


Características


¿Tienes alguna pregunta?
Recomendar


8 diapositivas
Geographic South America Template Presentation
Explore your data through a clean, professional map that highlights key insights and regional details across South America. Ideal for presenting demographics, business distribution, or performance metrics, this design combines clarity with impact. Fully compatible with PowerPoint, Keynote, and Google Slides for easy editing and seamless presentation.


10 diapositivas
Task and Role Allocation Matrix Presentation
Organize your team's responsibilities effectively with our Task and Role Allocation Matrix presentation template. Perfect for project managers and coordinators, this tool offers a clear, visual breakdown of who does what, using a color-coded system to assign tasks across multiple roles. It's ideal for streamlining project processes and ensuring accountability. Compatible with PowerPoint, Keynote, and Google Slides, this template is a must-have for any organized project team.

21 diapositivas
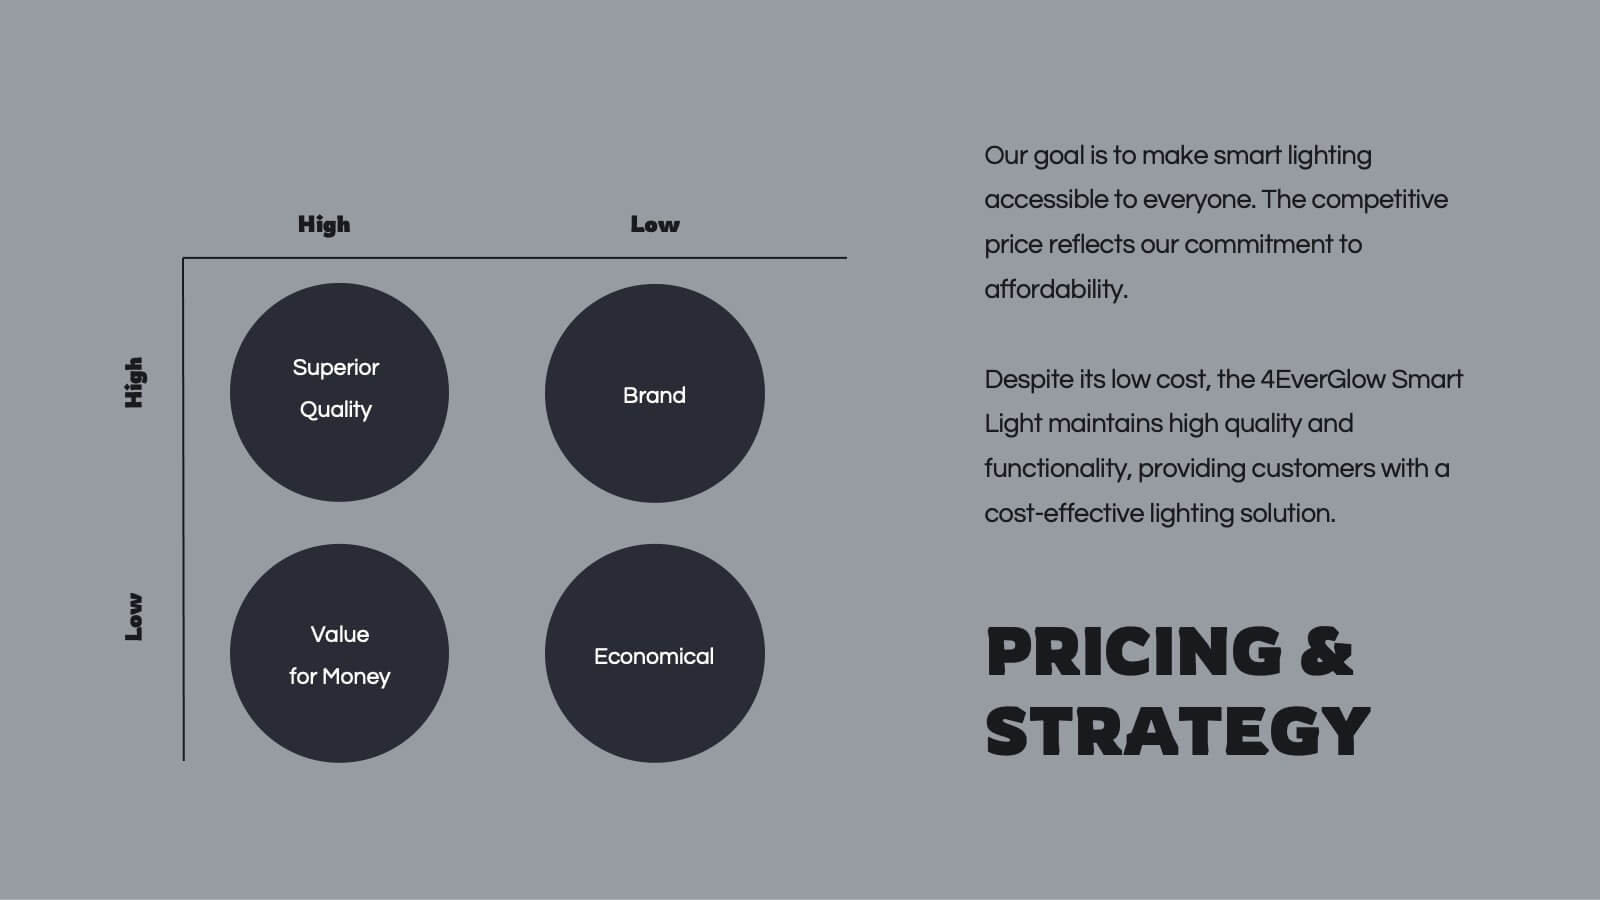
Spinel Product Strategy Report Presentation
Take your product strategy to the next level with this polished, spinel-inspired presentation! Designed to effectively communicate your product's goals, market analysis, and strategy roadmap, this template is both visually striking and easy to navigate. Its sharp design ensures a professional touch. Compatible with PowerPoint, Keynote, and Google Slides.


21 diapositivas
Planetar Startup Strategy Presentation
This Startup Strategy Presentation offers a modern and structured layout to showcase your startup’s mission, vision, market analysis, and financial projections. Designed for entrepreneurs and investors, it includes sections on customer needs, growth plans, and milestones. Fully customizable and compatible with PowerPoint, Keynote, and Google Slides.


6 diapositivas
Business Case Studies Analysis Presentation
Turn insights into impact with this clean and professional layout designed to showcase real-world business challenges and results. Perfect for summarizing objectives, methods, and key outcomes, it helps you tell a clear and compelling story. Fully compatible with PowerPoint, Keynote, and Google Slides for easy customization and presentation.


6 diapositivas
Lean Six Sigma Framework Slide Presentation
Bring your audience in with a bold, energetic layout that makes each stage feel clear and engaging. This presentation explains the DMAIC framework in a streamlined way, helping users outline process improvement steps with confidence and clarity. Fully customizable and compatible with PowerPoint, Keynote, and Google Slides.


26 diapositivas
Effective Communication Skills Presentation
Discover the key to successful interactions with our Effective Communication Skills presentation template. This all-in-one template is fully compatible with PowerPoint, Keynote, and Google Slides, making it the perfect addition to your toolkit, whether you're an educator, a corporate trainer, or a team leader. Our template is meticulously designed to help you convey the essence of effective communication, breaking down complex concepts into easily understandable segments. From active listening to clear articulation, it covers various aspects of communication that are crucial in both personal and professional environments. Each slide in the Effective Communication Skills template features a clean, engaging design, encouraging viewers to focus on the content. Editable charts, graphs, and models allow for a customized experience, ensuring that your message resonates with your specific audience. By using this template, you can confidently guide your audience through the intricacies of effective communication, making your presentation a reference point for those looking to improve their communication skills. Elevate your presentations and ensure your message is not just heard, but understood and acted upon.


7 diapositivas
SCRUM Process Infographic
Scrum is an agile framework used in software development and project management. Embark on an agile journey through the scrum Process with our infographic template. This illustrative and informative infographic provides a clear visual guide to this methodology, facilitating a swift and efficient path to project success. Compatible with Powerpoint, Keynote, and Google Slides. This is an informative and visually engaging presentation that brings the effectiveness of scrum methodology to life, encouraging individuals and teams to sprint towards project excellence with precision and collaboration.


6 diapositivas
Successful Loyalty Program Ideas Presentation
Turn creative reward concepts into visually engaging stories that inspire customer retention and brand loyalty. This modern layout is ideal for presenting program ideas, reward systems, and engagement strategies with clarity and style. Fully customizable and compatible with PowerPoint, Keynote, and Google Slides for seamless presentation design.


5 diapositivas
Key Drivers Behind Success Strategy Presentation
Highlight the building blocks of your business strategy with the Key Drivers Behind Success Strategy Presentation. This sleek, horizontal infographic uses a timeline-style layout with four labeled checkpoints—perfect for showcasing essential success factors, strategic pillars, or operational milestones. Ideal for leadership updates or corporate planning decks. Fully editable in Canva, PowerPoint, Keynote, and Google Slides.


7 diapositivas
McKinsey 7S Model Strategy Presentation
Bring clarity to complex organizational relationships with a clean, structured layout that highlights how key elements connect and influence performance. This presentation helps you explain core components, identify alignment gaps, and guide strategic decision-making with confidence. Easy to customize and fully compatible with PowerPoint, Keynote, and Google Slides.


23 diapositivas
Blade Corporate Strategy Proposal Presentation
Prepare to captivate your audience with the Blade Corporate Strategy Proposal template! This sleek and modern design is perfect for professionals looking to present their strategic objectives with clarity and impact. The template features a balanced color palette of blue and white, exuding professionalism while ensuring your content stands out. From analyzing the current landscape to outlining key challenges and growth opportunities, each slide is meticulously crafted to convey your strategic vision effectively. The clean layout ensures that complex data, such as SWOT analysis, performance metrics, and competitive analysis, is easily digestible. With dedicated sections for team roles, resource allocation, and timelines, this template helps you guide your audience through every step of your strategic plan. Fully compatible with PowerPoint, Keynote, and Google Slides, the Blade template is your go-to choice for delivering presentations that resonate with decision-makers and stakeholders alike.


5 diapositivas
How To Stop Fake News Infographics
Dive into the realm of media literacy with our how to stop fake news infographics. Crafted with striking shades of trust-inspiring blues and engaging, colorful accents, this vertical, informative, and creatively styled template is a beacon for journalists, educators, social media users, and advocates of truth. It is specifically designed to aid in the identification, debunking, and prevention of the spread of misinformation. Compatible with Powerpoint, Keynote, and Google Slides. The infographic encapsulates compelling graphics, easy-to-understand icons, and versatile image placeholders pertinent to the battle against fake news.


6 diapositivas
Pillar Ideas Infographic
"Pillar ideas" usually refer to the fundamental principles, concepts, or key components that form the foundation of a particular topic, strategy, or framework. This infographic template outlines and explains the core pillars or key principles of a particular topic, concept, or strategy. These pillars are essential for understanding and implementing the core aspects of that subject. The pillars included in the infographic provide structure and a clear understanding of the foundational elements that contribute to the success and effectiveness of various endeavors. This template is compatible with Powerpoint, Keynote, and Google Slides.
5 diapositivas
Goal-Oriented Arrow Diagram Strategy
Visualize alignment, focus, and convergence toward business objectives with this dynamic arrow-to-target diagram. Perfect for strategy teams, consultants, and marketing leads to communicate multi-stream initiatives driving toward one central goal. Fully editable in PowerPoint, Keynote, and Google Slides to suit your content and branding needs.


7 diapositivas
Artificial Intelligence Education Infographic Presentation
Artificial Intelligence is an important field of study and development that has the potential to revolutionize many aspects of modern life. A great way to display your ideas in a visual manner, this AI Infographic Template can be used by businesses and corporations who want to communicate their team vision in a clear and dynamic way. This template is completely editable, allowing you to customize it with your own information and photos. It includes icons and graphs to illustrate your points, as well as text boxes and slide titles. It is compatible with Powerpoint, Keynote and Google Slides.


4 diapositivas
Business Planning Framework Presentation
Turn big ideas into actionable strategies with this modern and structured presentation layout. Perfect for mapping goals, aligning priorities, and showcasing step-by-step planning processes, it helps you communicate strategy with clarity and confidence. Fully editable and compatible with PowerPoint, Keynote, and Google Slides for easy customization and professional results.