


Características


¿Tienes alguna pregunta?
Recomendar


4 diapositivas
Stakeholder Analysis and Engagement Presentation
Enhance your strategic planning with our Stakeholder Analysis and Engagement Presentation template. Designed to map influence and interest effectively, this tool aids in identifying key stakeholders and tailoring engagement strategies. It’s compatible with PowerPoint, Keynote, and Google Slides, perfect for impactful presentations and workshops.


5 diapositivas
Planning and Delivery in Five Phases Presentation
Guide your audience through each step of your execution plan using the Planning and Delivery in Five Phases Presentation. This clean, drop-pin style layout highlights five essential milestones for structured delivery and progress tracking. Each phase is color-coded for easy reference. Fully editable in PowerPoint, Keynote, Google Slides, and Canva.


6 diapositivas
Design Thinking 5-Stage Model Presentation
Turn creativity into structured innovation with a clean, circular layout that guides your audience through each phase of problem-solving and ideation. Ideal for workshops, strategy sessions, or innovation pitches, this presentation makes complex processes easy to follow. Fully compatible with PowerPoint, Keynote, and Google Slides for seamless editing.


22 diapositivas
Tranquil Project Status Report Presentation
This dynamic project report template delivers key insights with a bold, modern design. From performance metrics to market trends and client feedback, it's crafted for comprehensive yet visually appealing updates. Perfect for team presentations, this template ensures clarity and engagement. Compatible with PowerPoint, Keynote, and Google Slides, it’s ideal for project leaders!


7 diapositivas
RACI Matrix Project Infographic
A RACI Matrix, sometimes referred to as a Responsibility Assignment Matrix, is a project management tool used to clarify and communicate the roles and responsibilities of team members in completing tasks and activities within a project. This is a visually captivating and informative template designed to demystify the complexities of project accountability. Navigate through the world of roles and responsibilities in a project setting with this dynamic and easily digestible visual aid. With this infographic your audience will journey toward effective project management and accountability with the RACI Matrix.


5 diapositivas
Coffee Brewing Methods Infographics
Coffee brewing methods refer to the various techniques and processes used to extract flavor and aroma from coffee beans. These infographic templates are a visually appealing and informative presentation tool designed to showcase various methods of brewing coffee. Whether you're a coffee enthusiast, a barista, or someone interested in learning more about coffee preparation, this template provides an engaging way to explore different brewing techniques and their unique characteristics. These allows you to showcase and educate others about various coffee brewing techniques. Fully customizable and compatible with Powerpoint, Keynote, and Google Notes.


26 diapositivas
The Rise of Smart Cities Presentation
This presentation template is dedicated to urban developers, technology enthusiasts, and policy makers interested in the advancement of smart cities. The template serves as a deep dive into the integration of technology within urban settings to boost sustainability, efficiency, and quality of life. It is designed with a sleek, modern aesthetic, using a color palette that reflects innovation and modernity, which makes it visually appealing and easy to navigate. The content is structured to demystify complex concepts about smart cities, featuring sections on IoT implementations, eco-friendly urban development, and smart public services. It includes varied slide types such as diagrams, infographics, and statistical displays to showcase data and case studies from cities that are pioneers in this domain. The template is compatible with multiple presentation platforms like PowerPoint, Google Slides, and Keynote, ensuring it can be utilized across different devices and settings. This makes it a versatile tool for presentations in educational, professional, and conference contexts, aiming to inspire and educate on the transformative power of smart urban planning.


5 diapositivas
Work Schedule Overview Presentation
Keep your week perfectly organized with this clean and modern layout designed to simplify planning and scheduling. Ideal for presenting weekly goals, tasks, or project timelines, it helps teams stay aligned and productive. Fully customizable and compatible with PowerPoint, Keynote, and Google Slides for effortless professional presentations.


5 diapositivas
Step-by-Step Planning Roadmap Presentation
Clarify each phase of your strategy with the Step-by-Step Planning Roadmap Presentation. This engaging slide design uses a staircase-style layout with labeled checkpoints (A–E) and matching text boxes to clearly communicate sequential goals or stages. Great for project roadmaps, implementation plans, or business timelines. Fully customizable in PowerPoint, Keynote, and Google Slides.


7 diapositivas
Root Cause Analysis Infographic Presentation Template
Root cause analysis is a method of problem solving that identifies the cause of an issue and tries to prevent similar issues from happening again. Root cause analysis can be used in any industry, including IT, manufacturing, telecommunications, industrial process control, accident analysis and healthcare to eliminate misunderstandings. This template is perfect if you need an essential problem-solving method. This root cause analysis template includes a helpful timeline to keep track of items that cross through each stage in the process, and a diagram of all the possible causes.


6 diapositivas
Ideas Connection Venn Presentation Design
Present interconnected ideas with creativity and impact using the Ideas Connection Venn Presentation Design. This colorful, lightbulb-themed 5-section layout helps you visualize related concepts or stages, ideal for brainstorming, innovation mapping, or content planning. Each segment includes icons, titles, and descriptions to showcase your thoughts clearly. Fully customizable in PowerPoint, Keynote, and Google Slides.


7 diapositivas
Responsibility Assignment Matrix Infographic Presentation Template
The Responsibility Assignment Matrix is a graphical tool used to visually represent the various assignments and the roles of each individual in a project. It helps in better understanding who is responsible for what, and who is accountable for results. This is a matrix that identifies the key tasks involved in a project, and maps them to the individuals responsible for completing them. Use this template to emphasizes on the role of managers and the organizational goals. This simple template is designed to help teams create an effective accountability model, perfect for your next project!


7 diapositivas
Challenge Infographic Presentation Template
Our Challenge Infographic template is designed for conveying the challenge, purpose, problem and solution of an issue. This template is perfect for presenting ideas and plans on any topic from business to education. It features a clean design that allows you to highlight your ideas with confidence. With this template, you will make your data stand out with a variety of charts, graphs and text to create contrast and guide the audience through your message. Our template is compatible with powerpoint and gives you the ability to customize all of the text boxes, colors and any other elements.


22 diapositivas
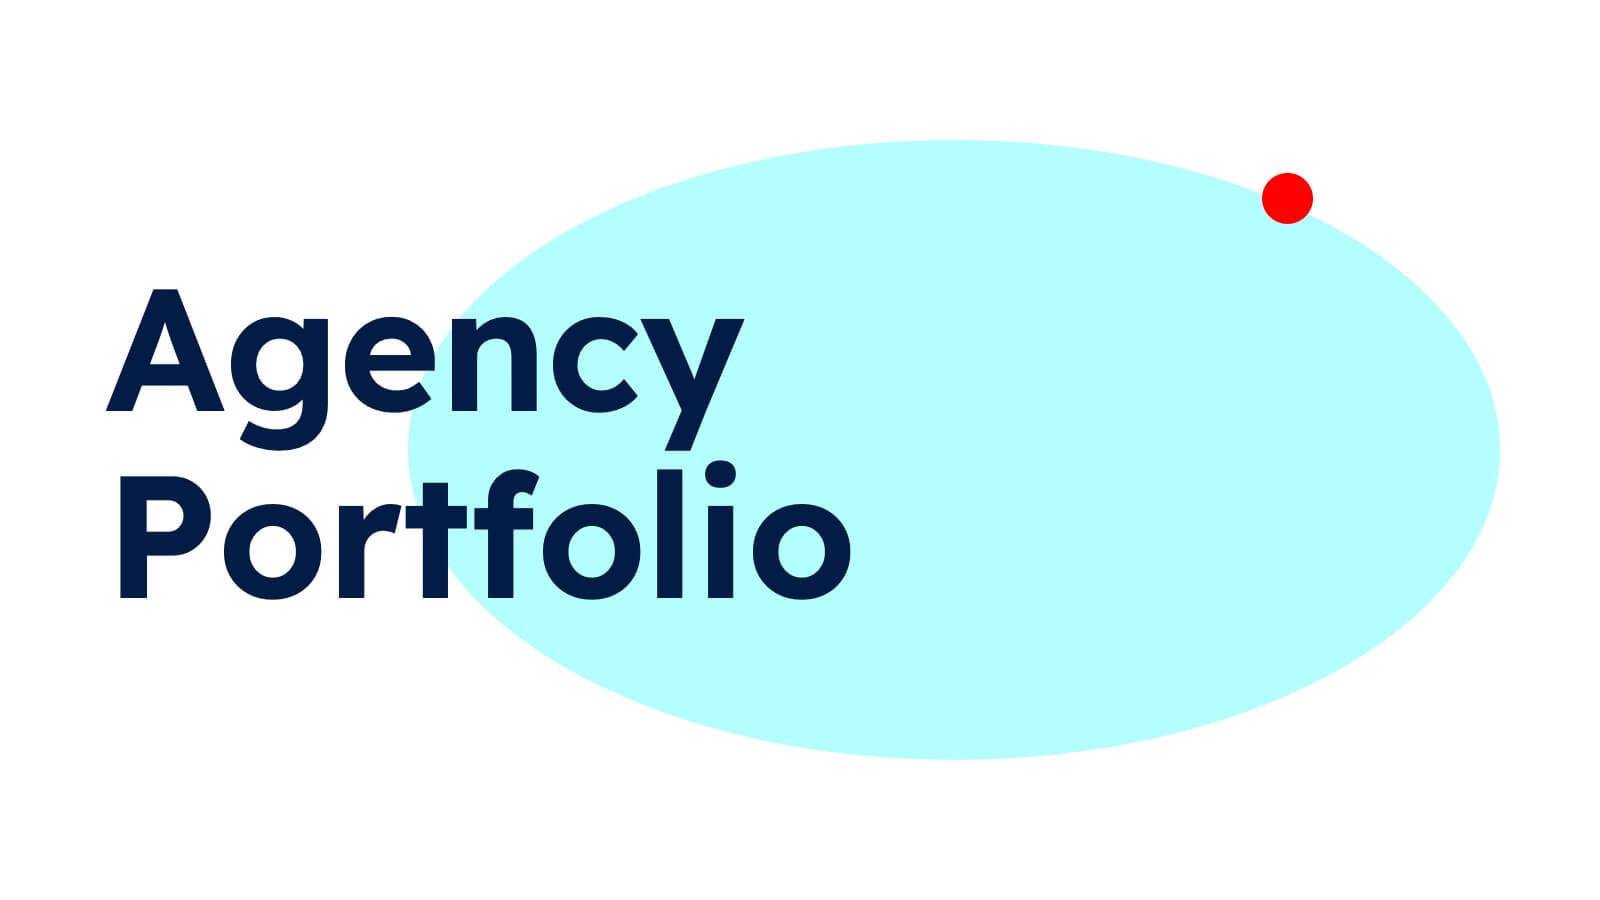
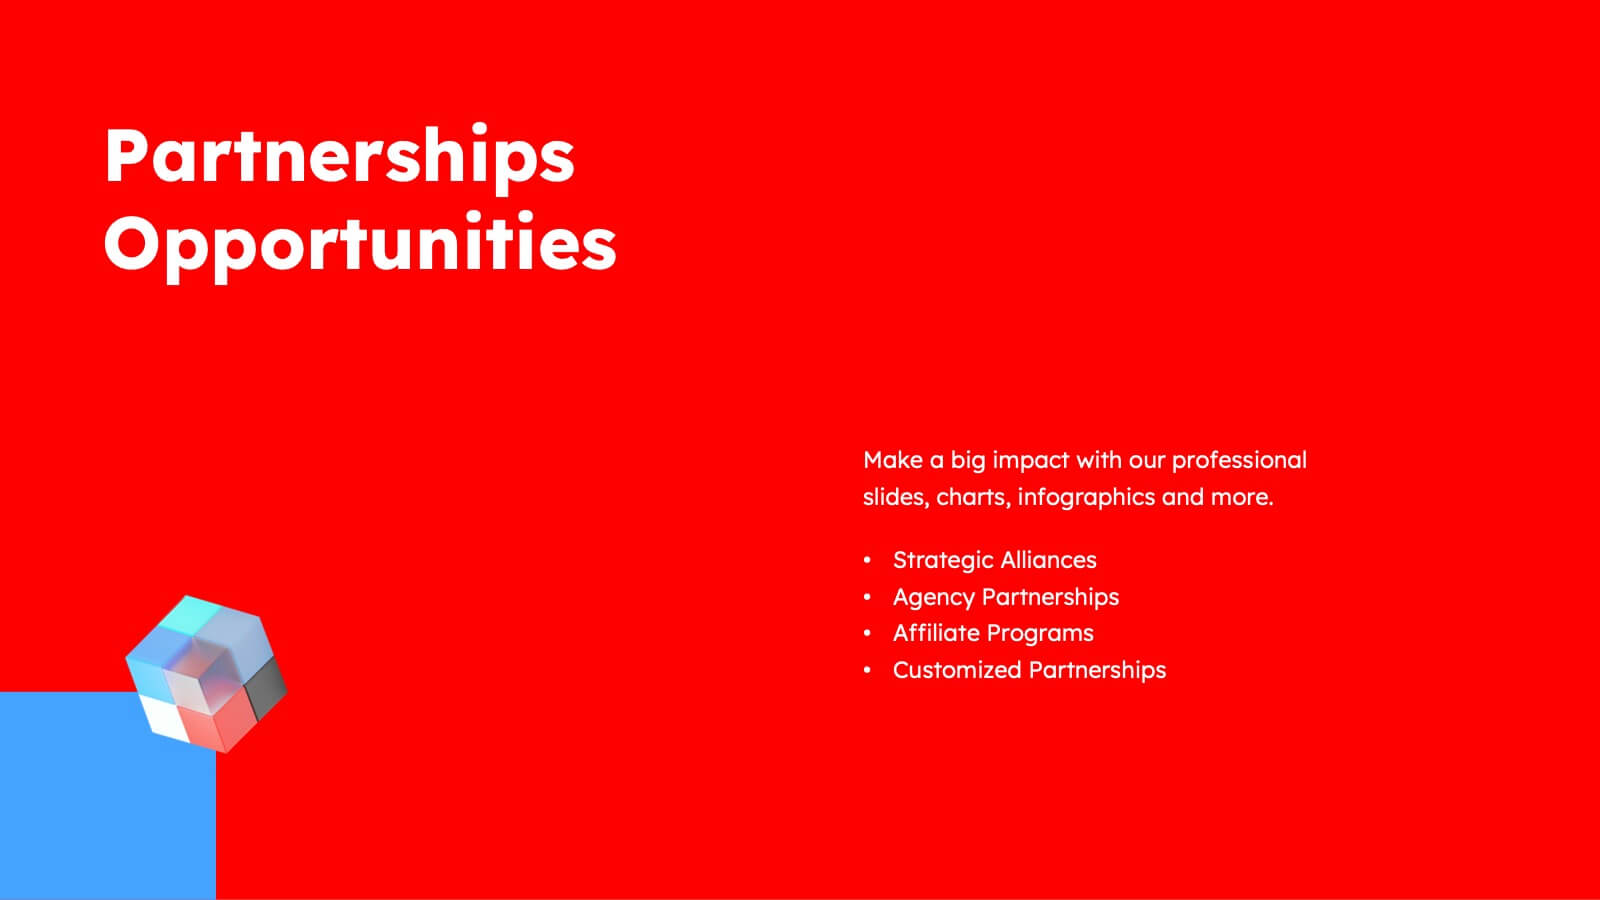
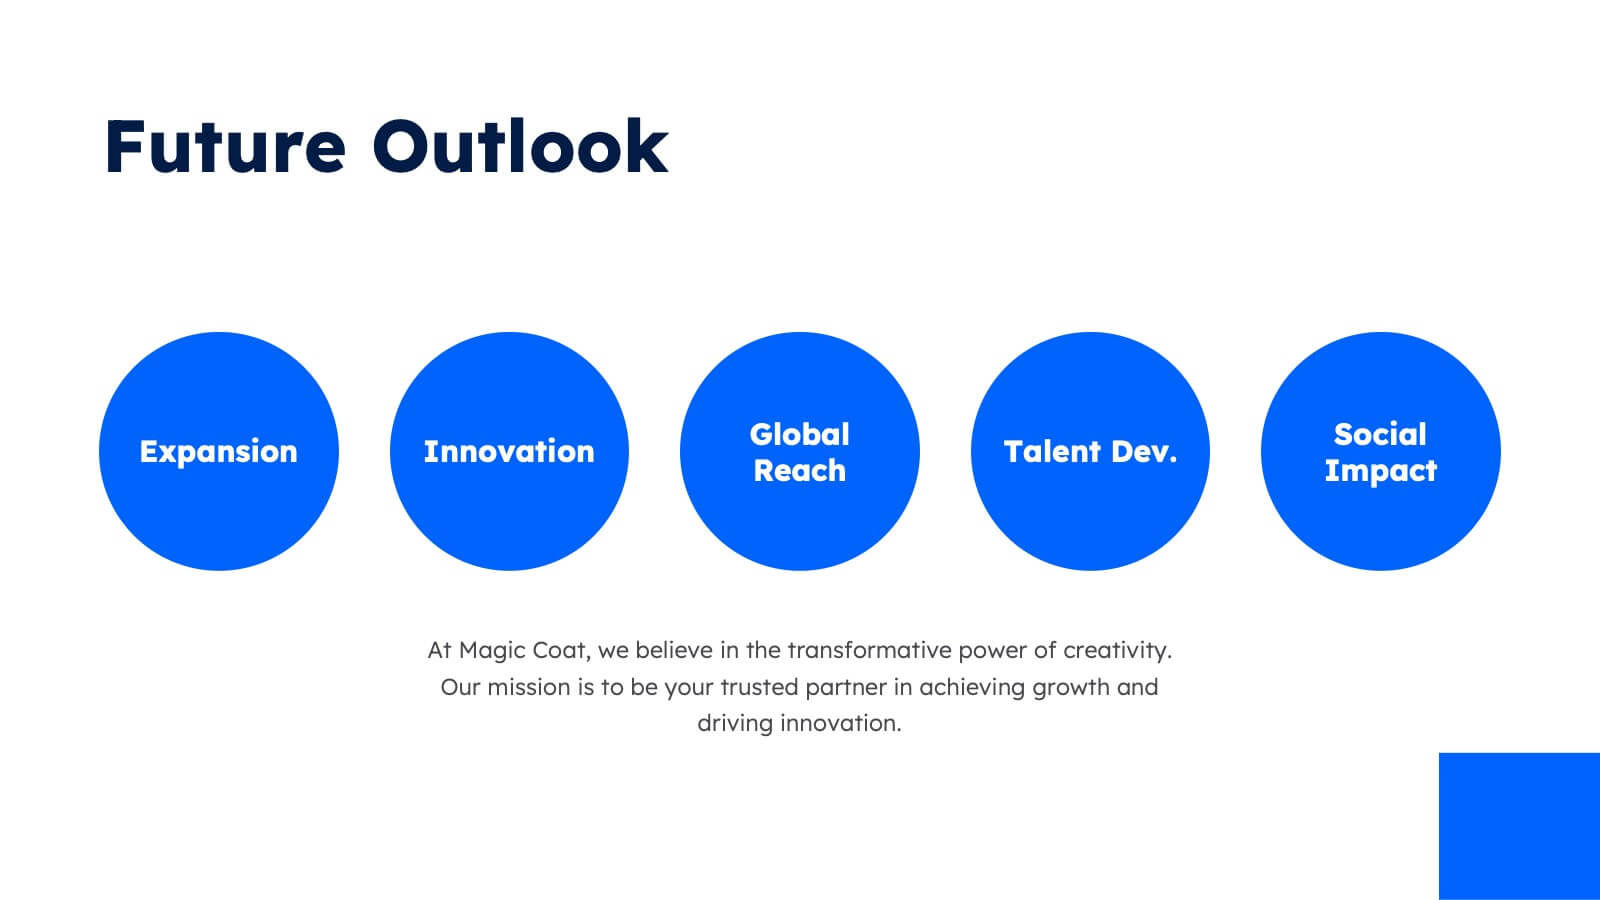
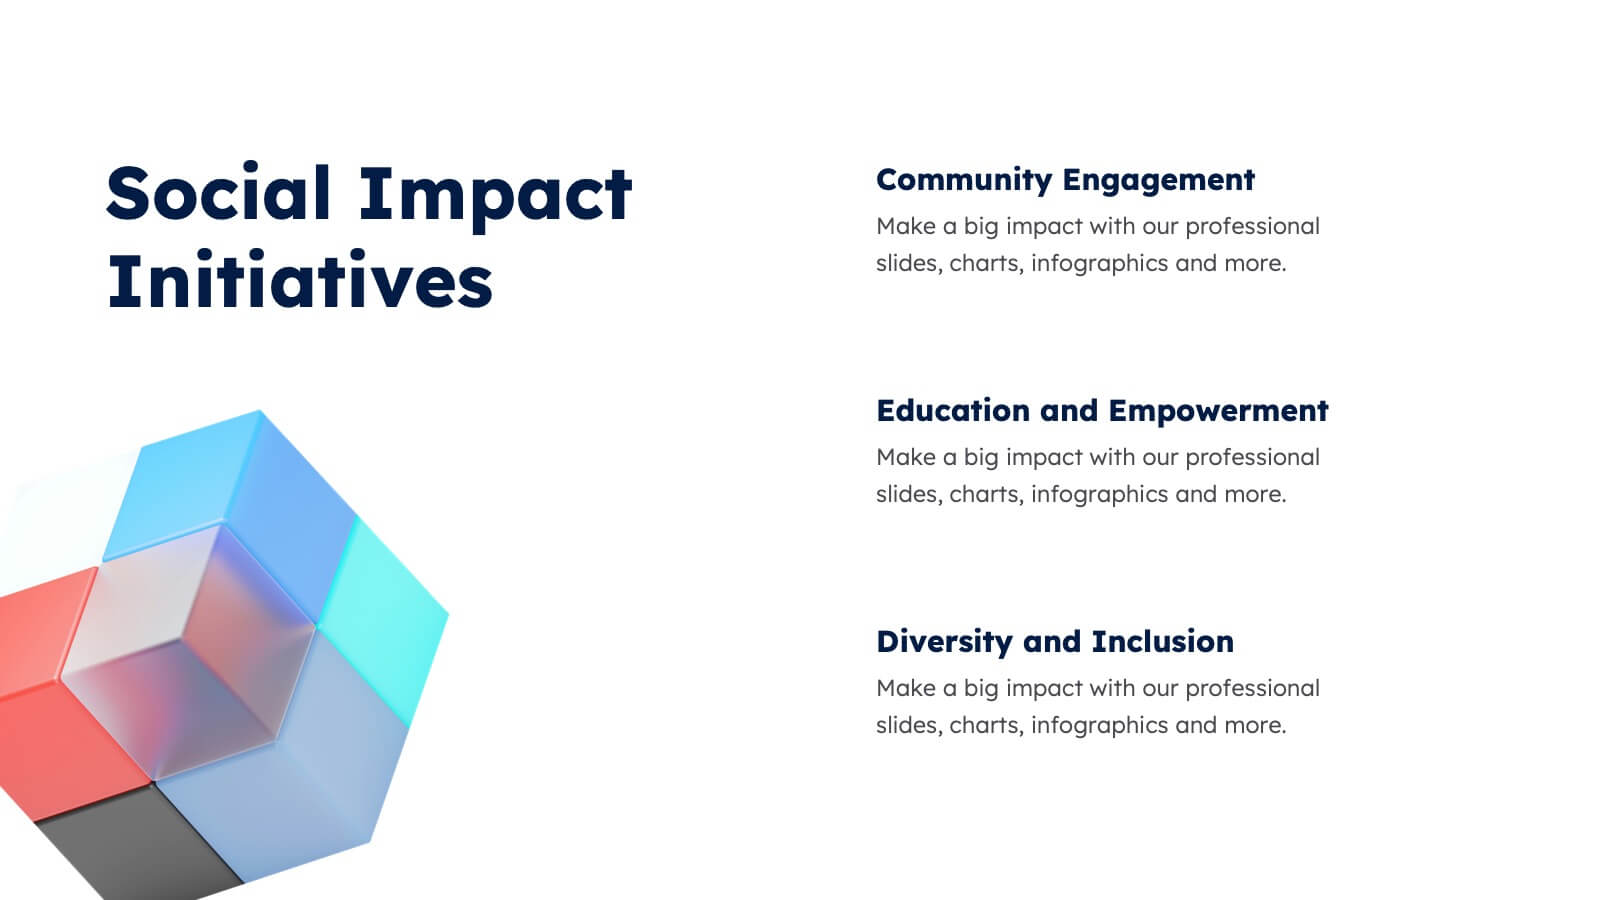
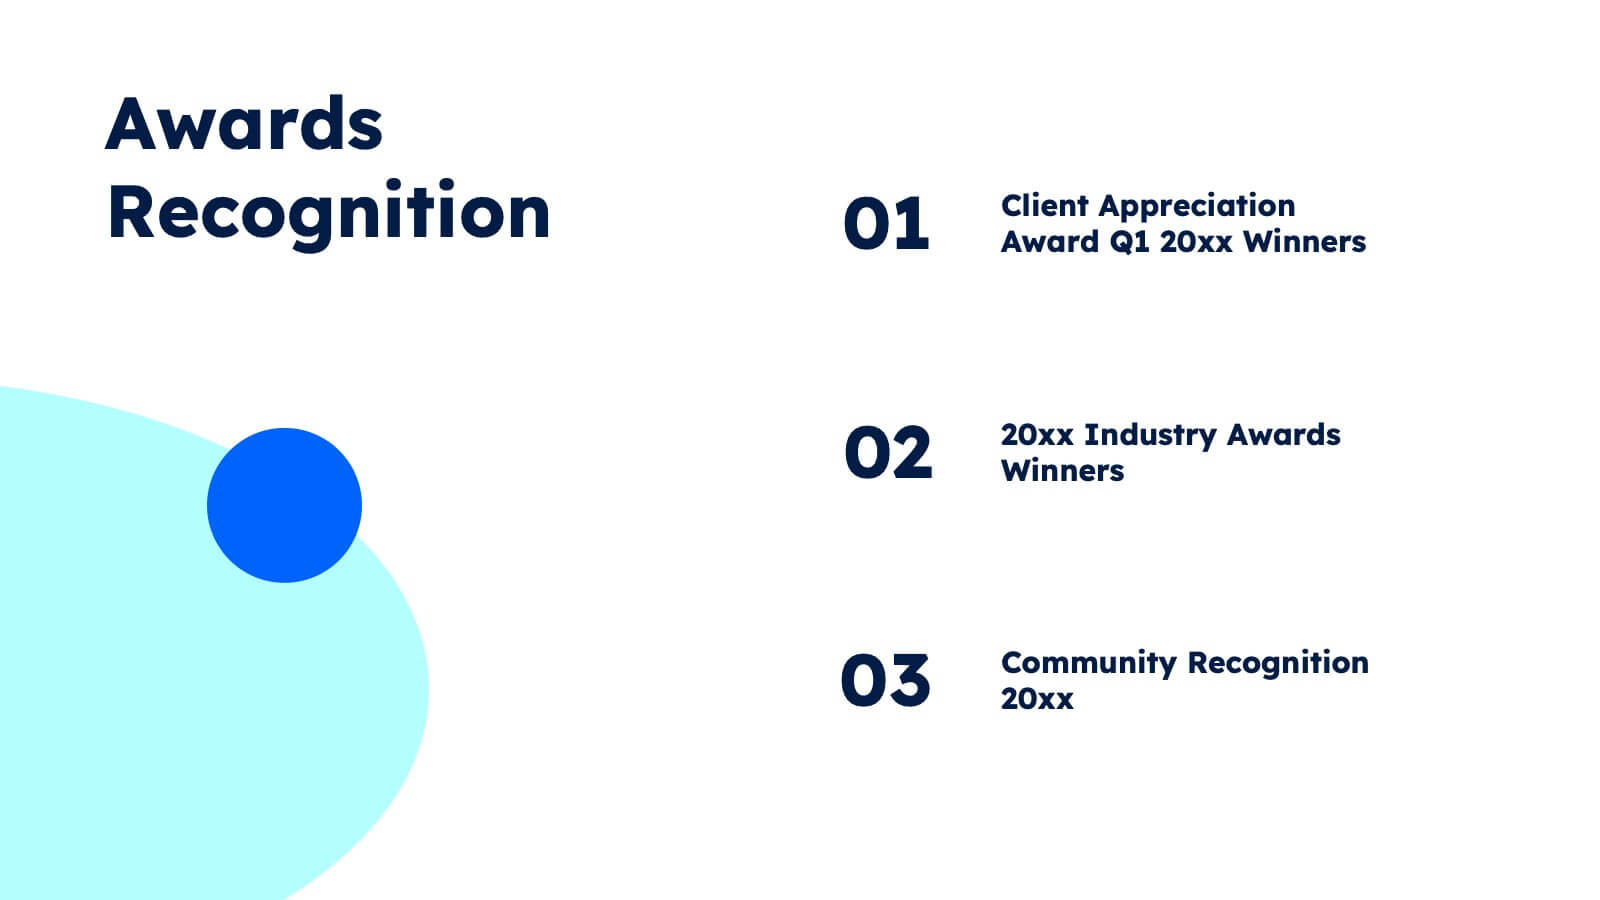
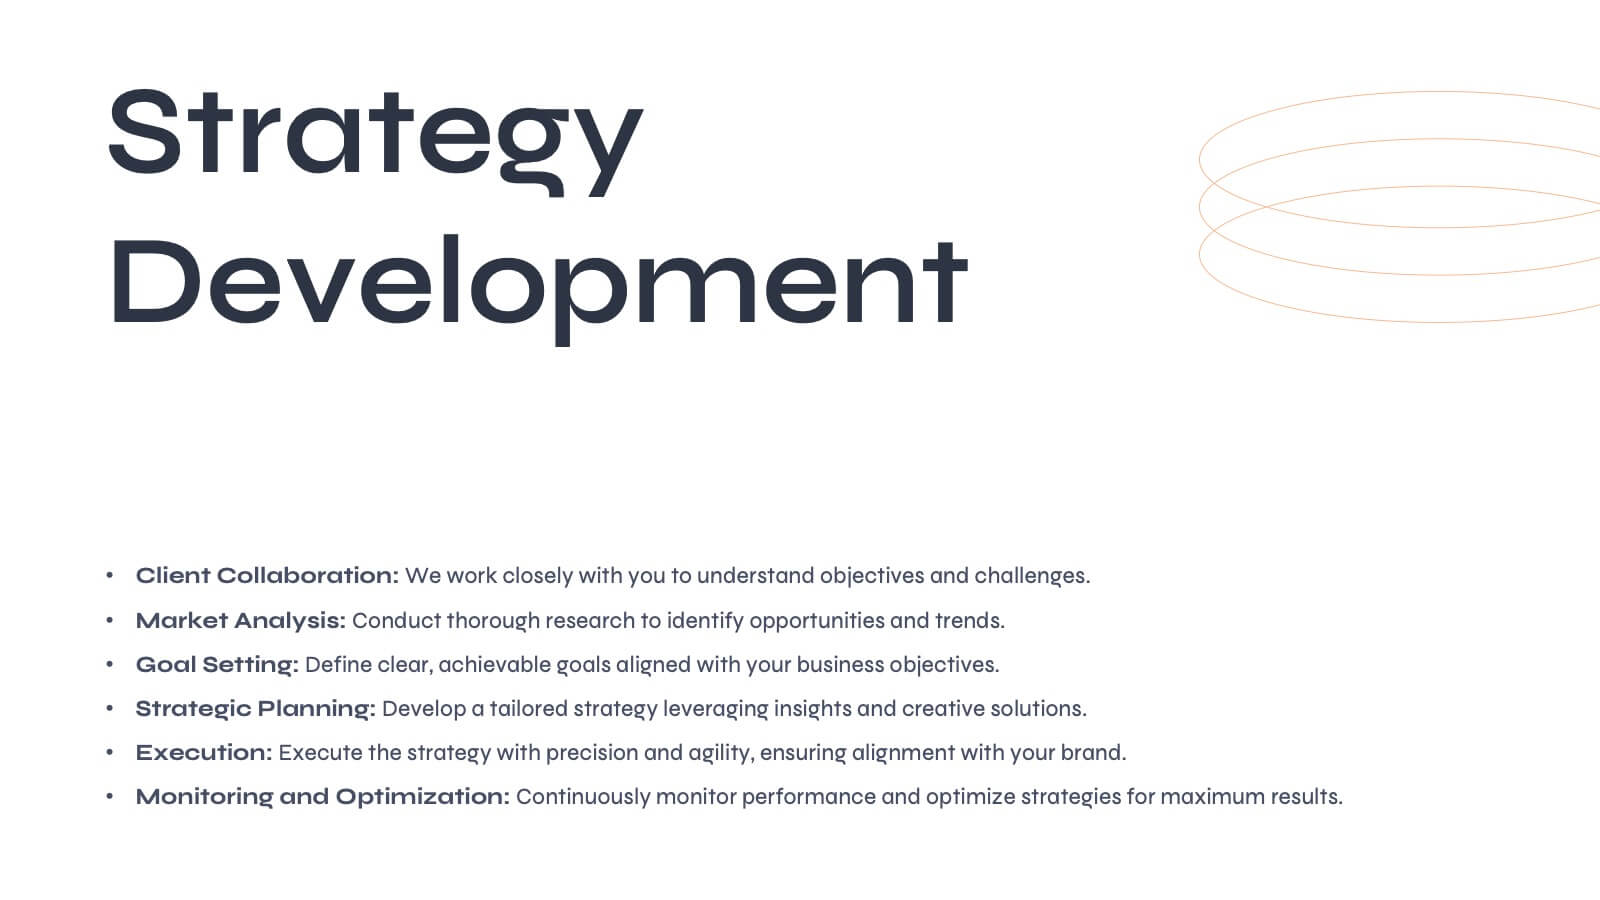
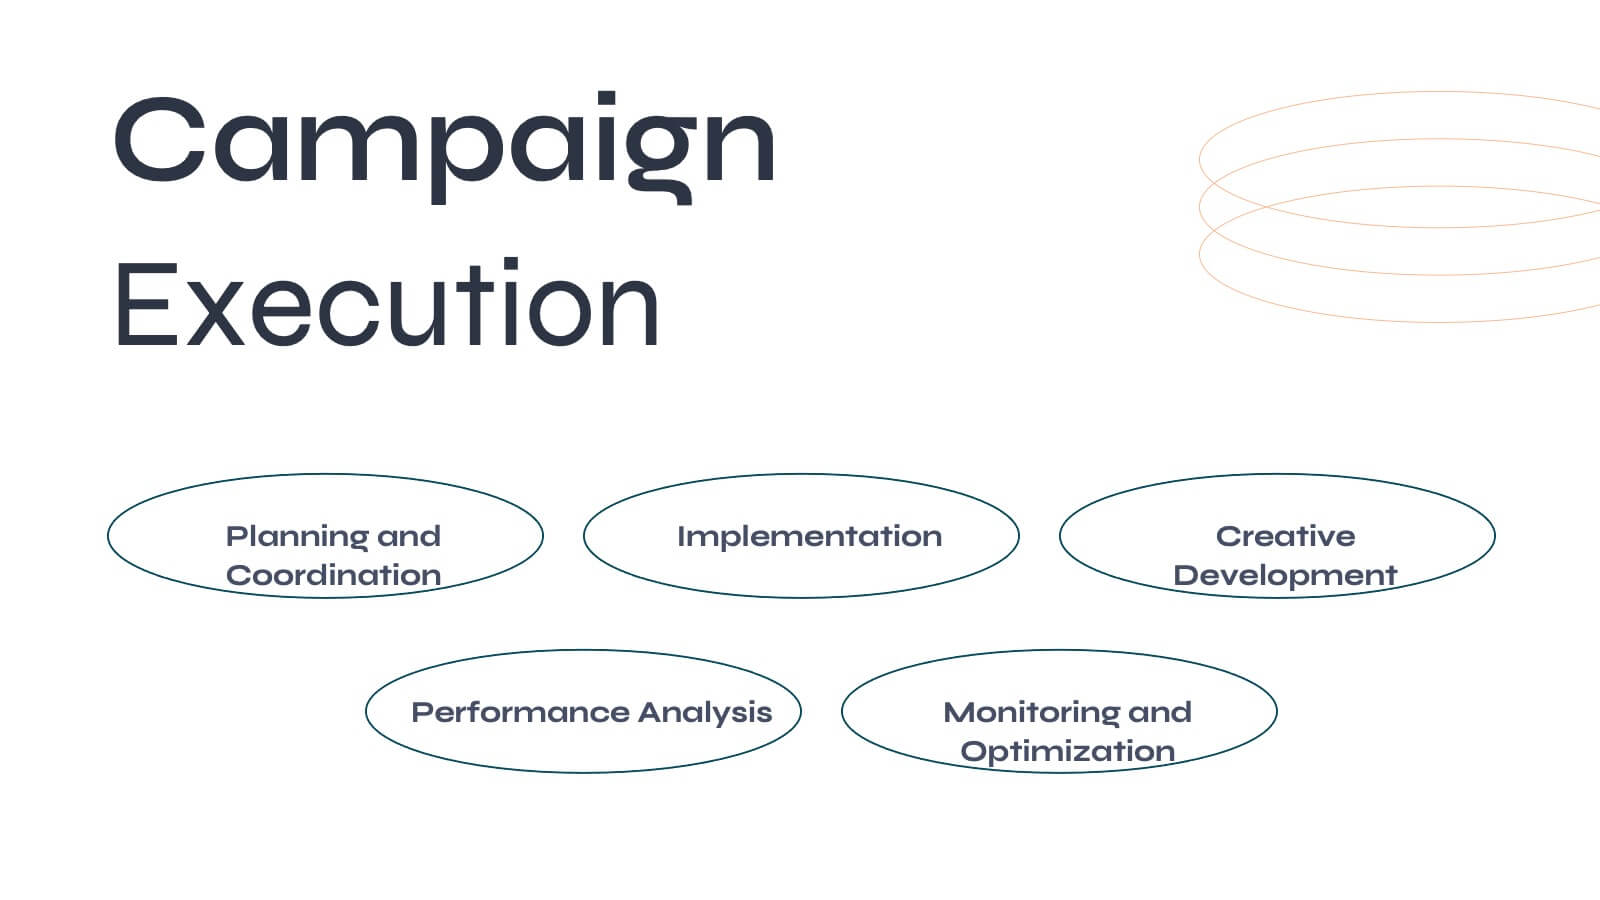
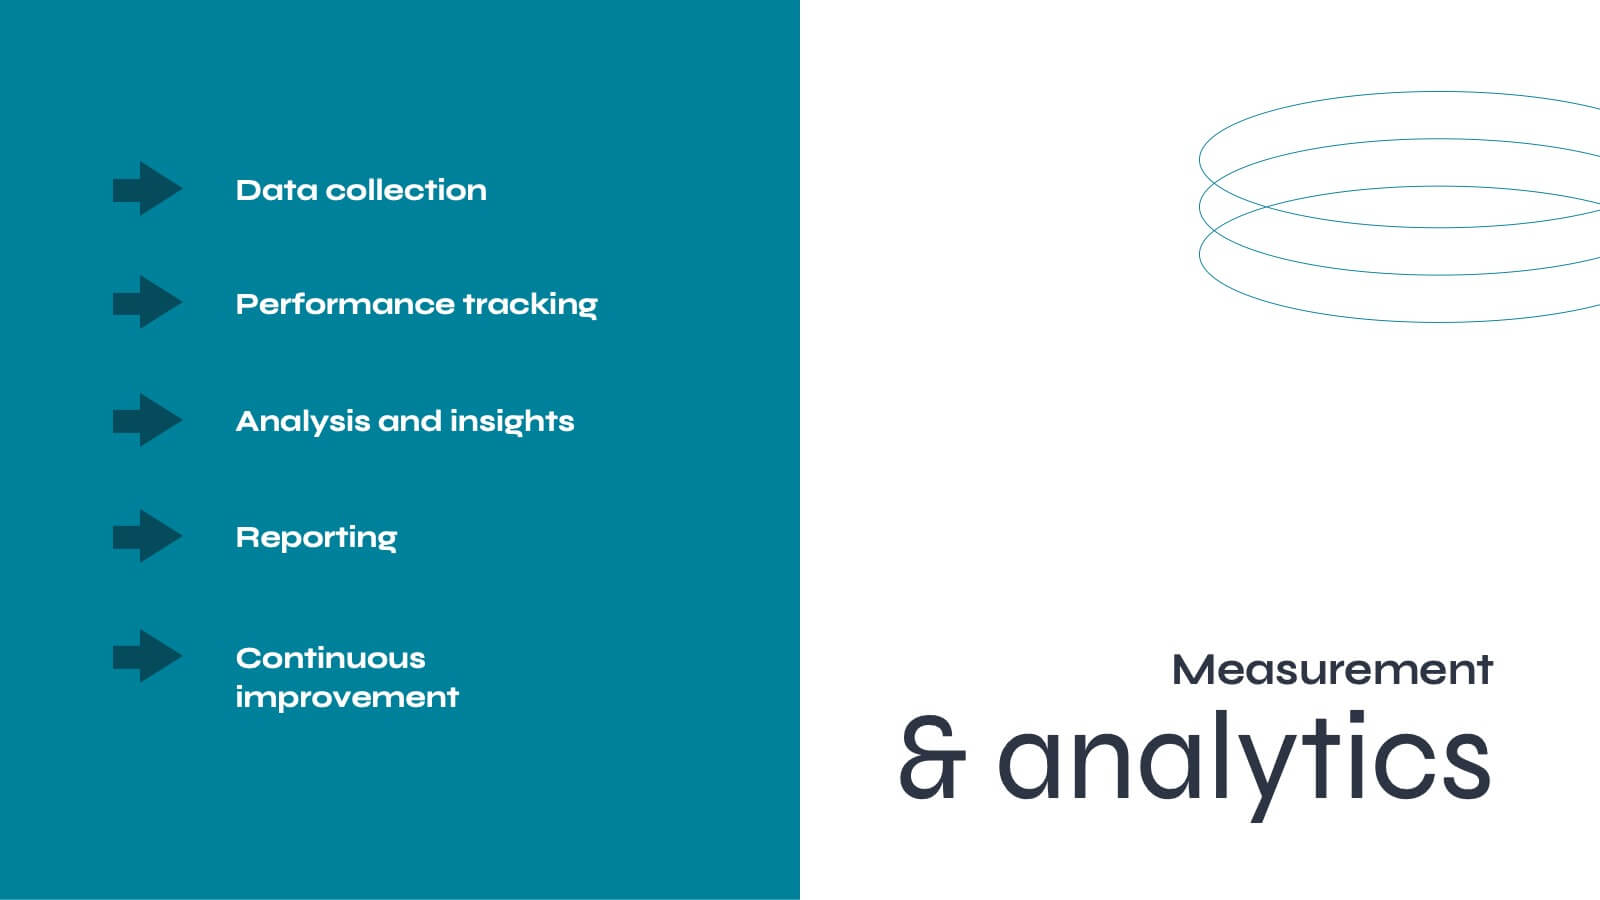
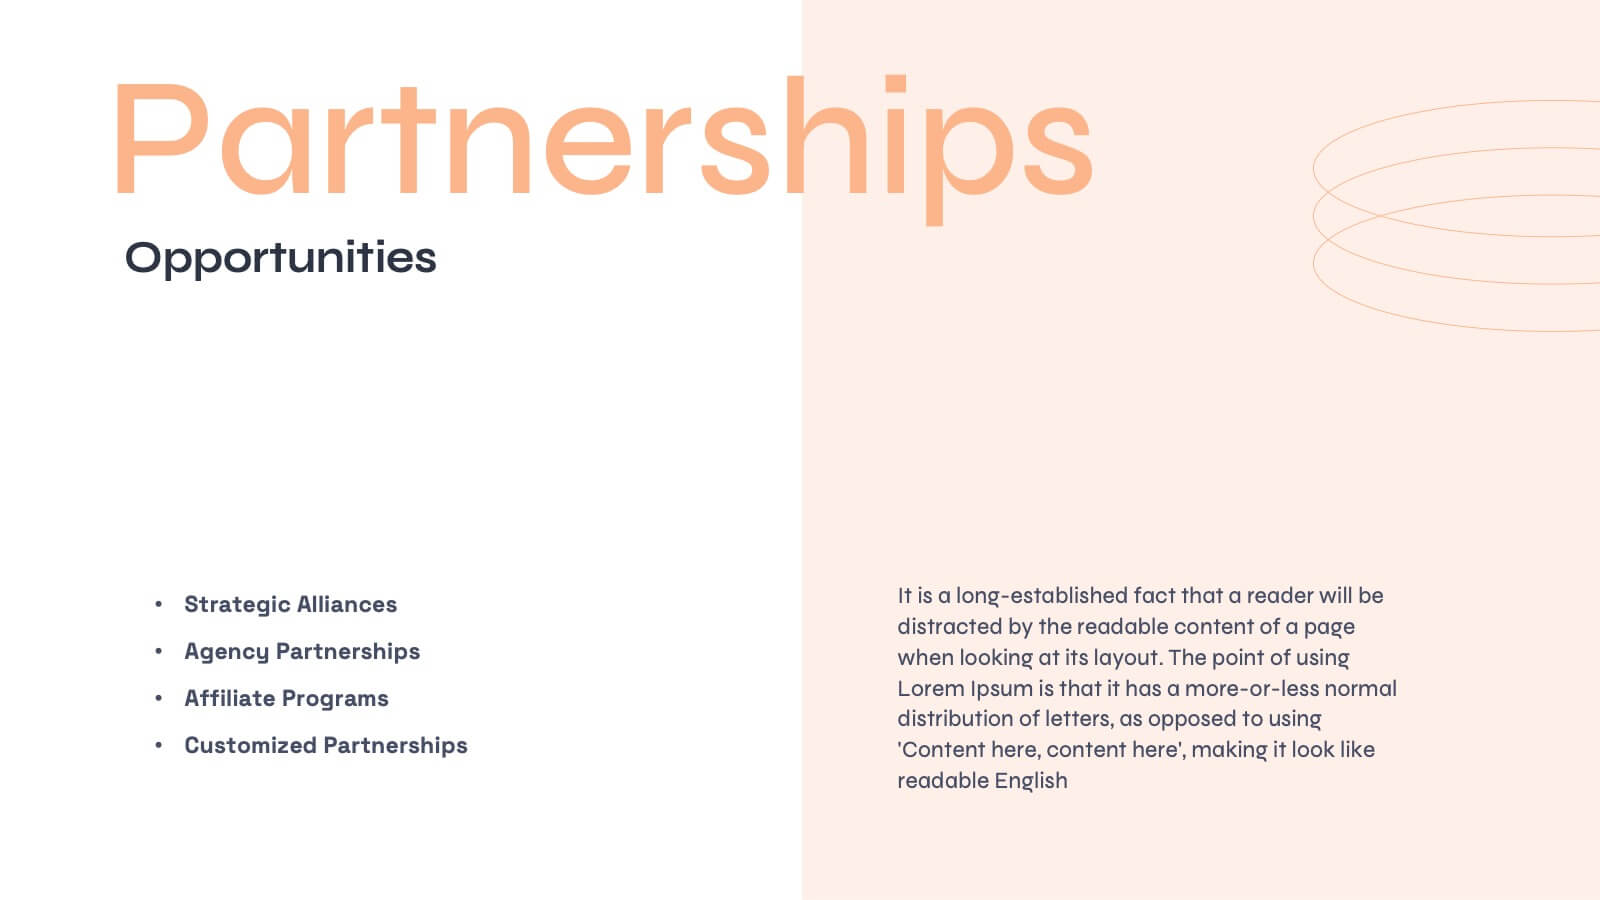
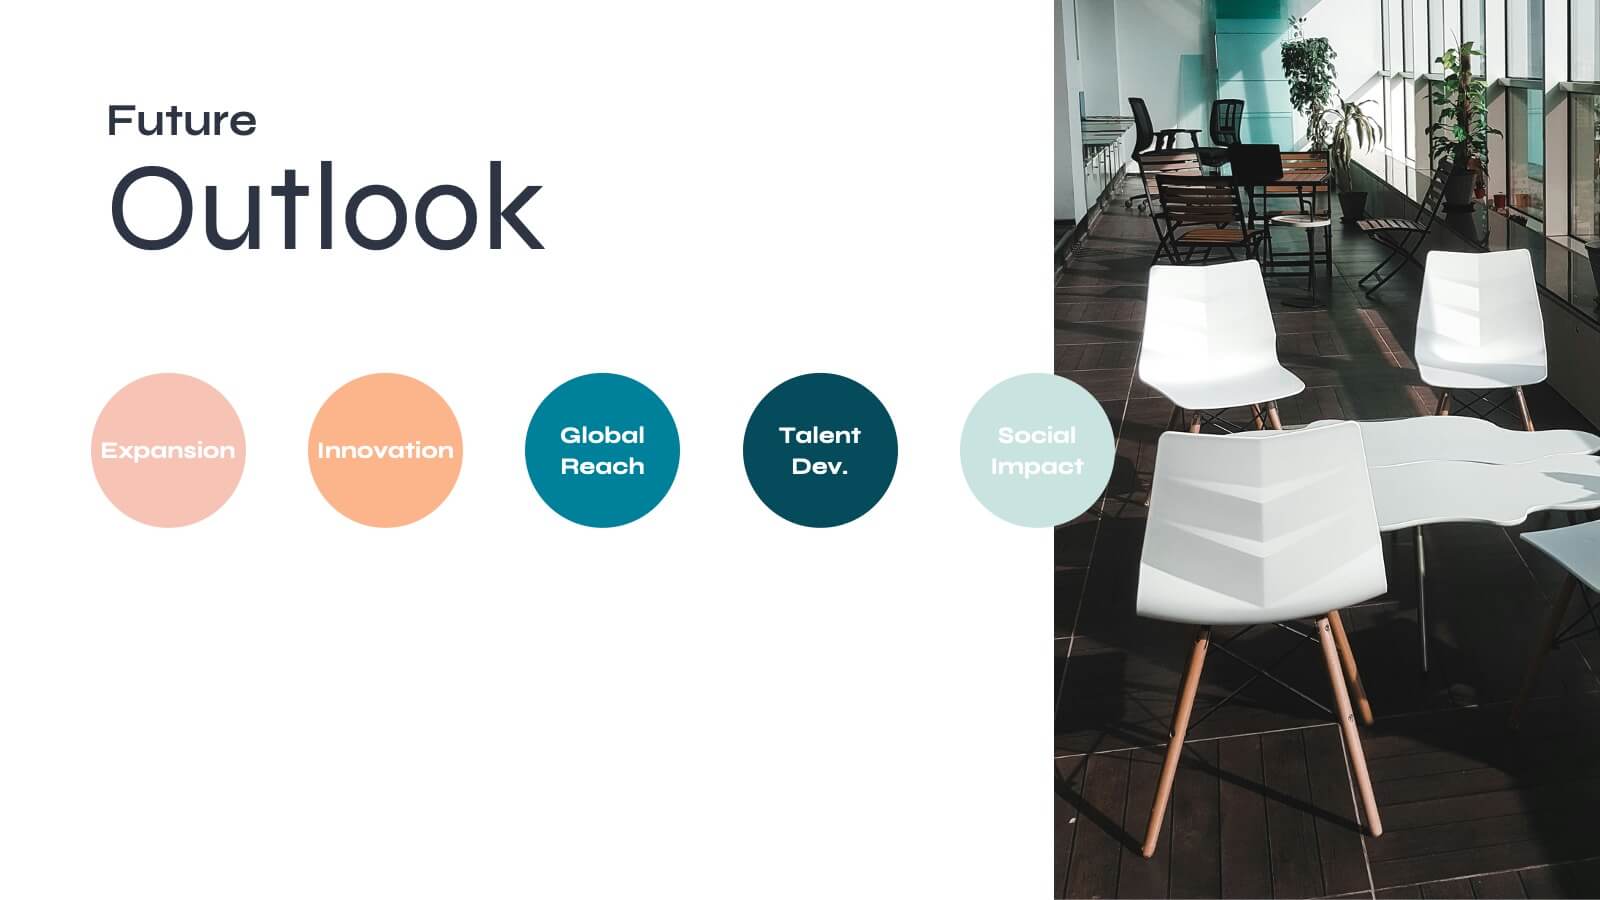
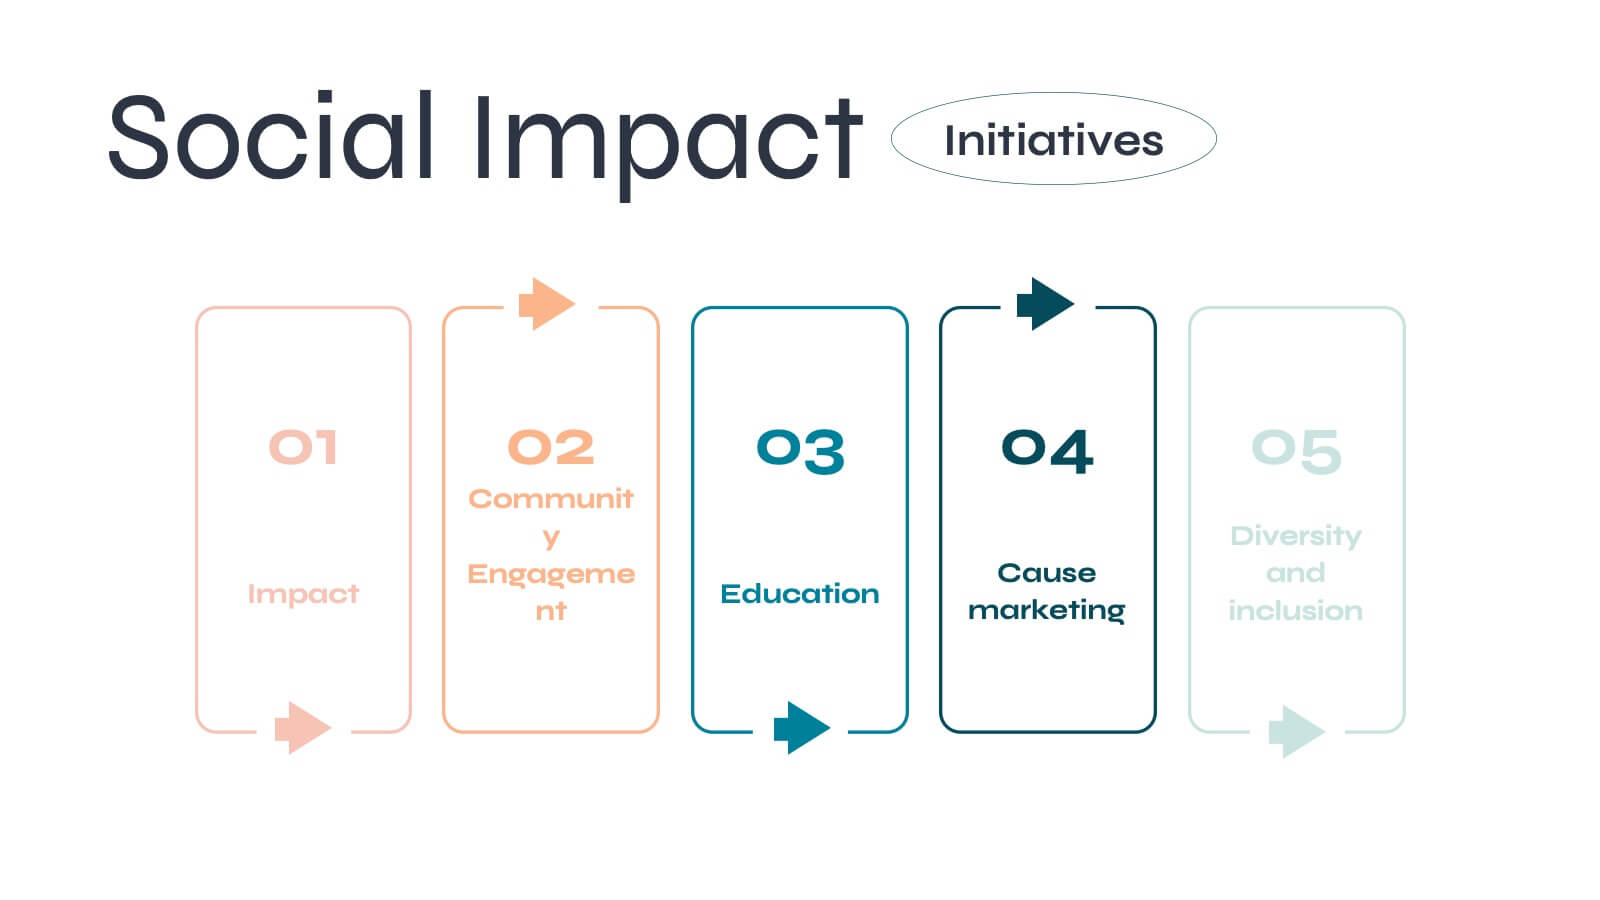
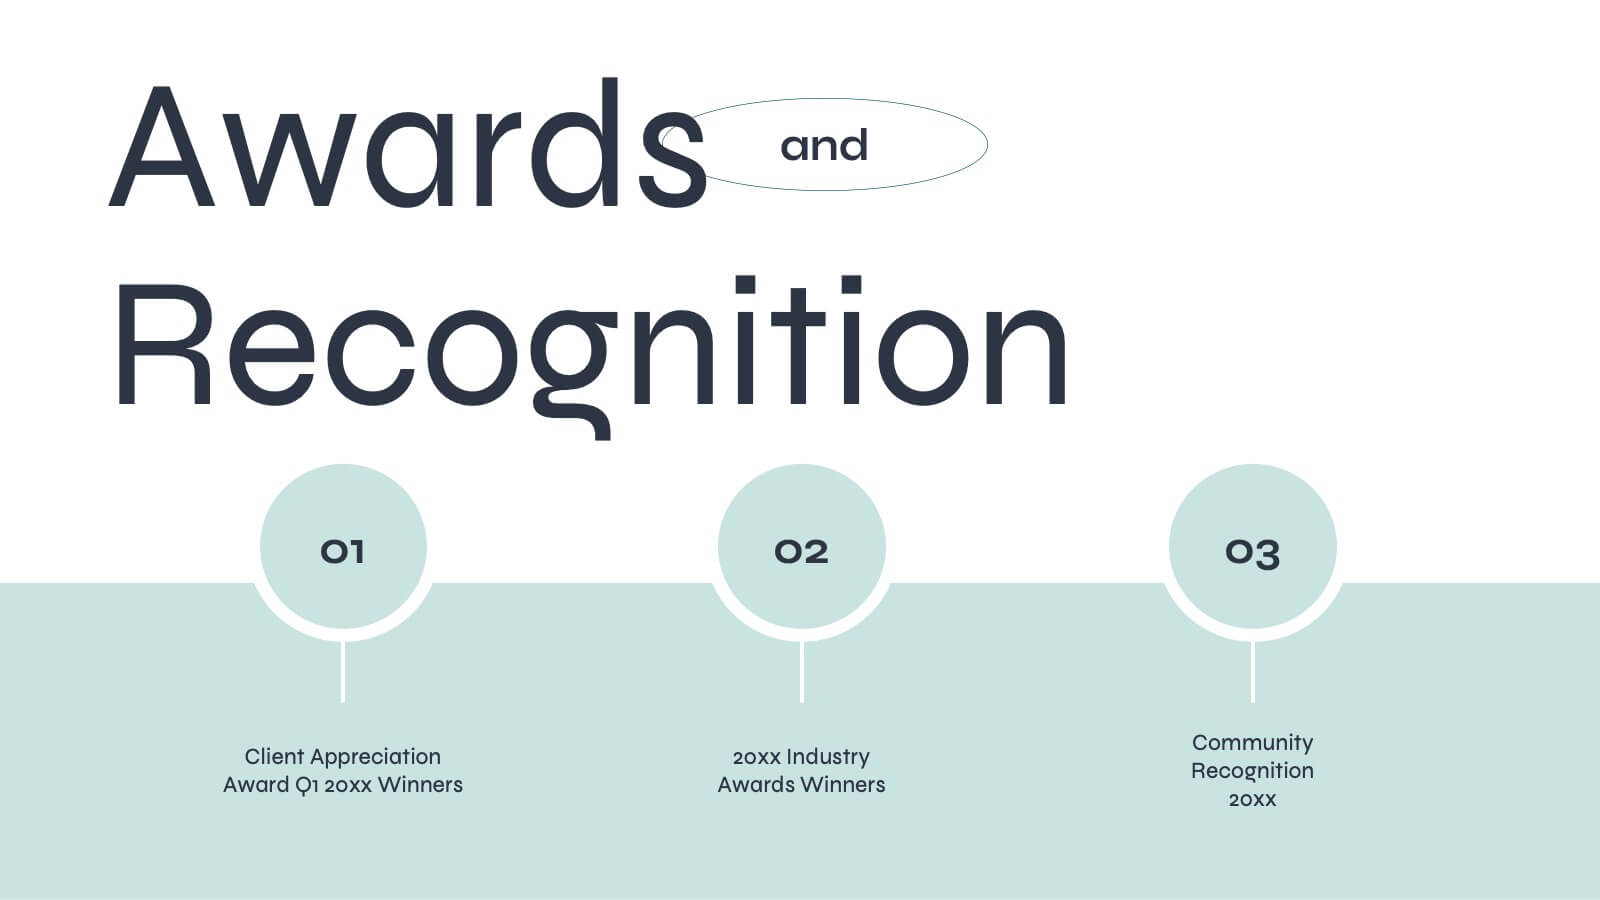
Aura Agency Portfolio Presentation
Showcase your agency's brilliance with this vibrant portfolio presentation template! Ideal for highlighting your mission, vision, case studies, and market analysis, it brings your achievements to life with colorful, engaging slides. Impress clients and partners with a well-structured, visually appealing narrative. Compatible with PowerPoint, Keynote, and Google Slides for easy use on any platform.


7 diapositivas
Dashboard Infographic Presentation Template
A Dashboard Infographic is a visual representation of important data or information that is organized in a way that is easy to understand. This template is perfect for getting your important information across in a way that's easy to comprehend. This template is designed to present your data in a concise and clear way and it can be used to track and monitor different metrics. This dashboard template has the ability to tell a story with a set of graphs and charts that can be customized in several different ways. You can use the graphs and charts and customize them according to your needs.


22 diapositivas
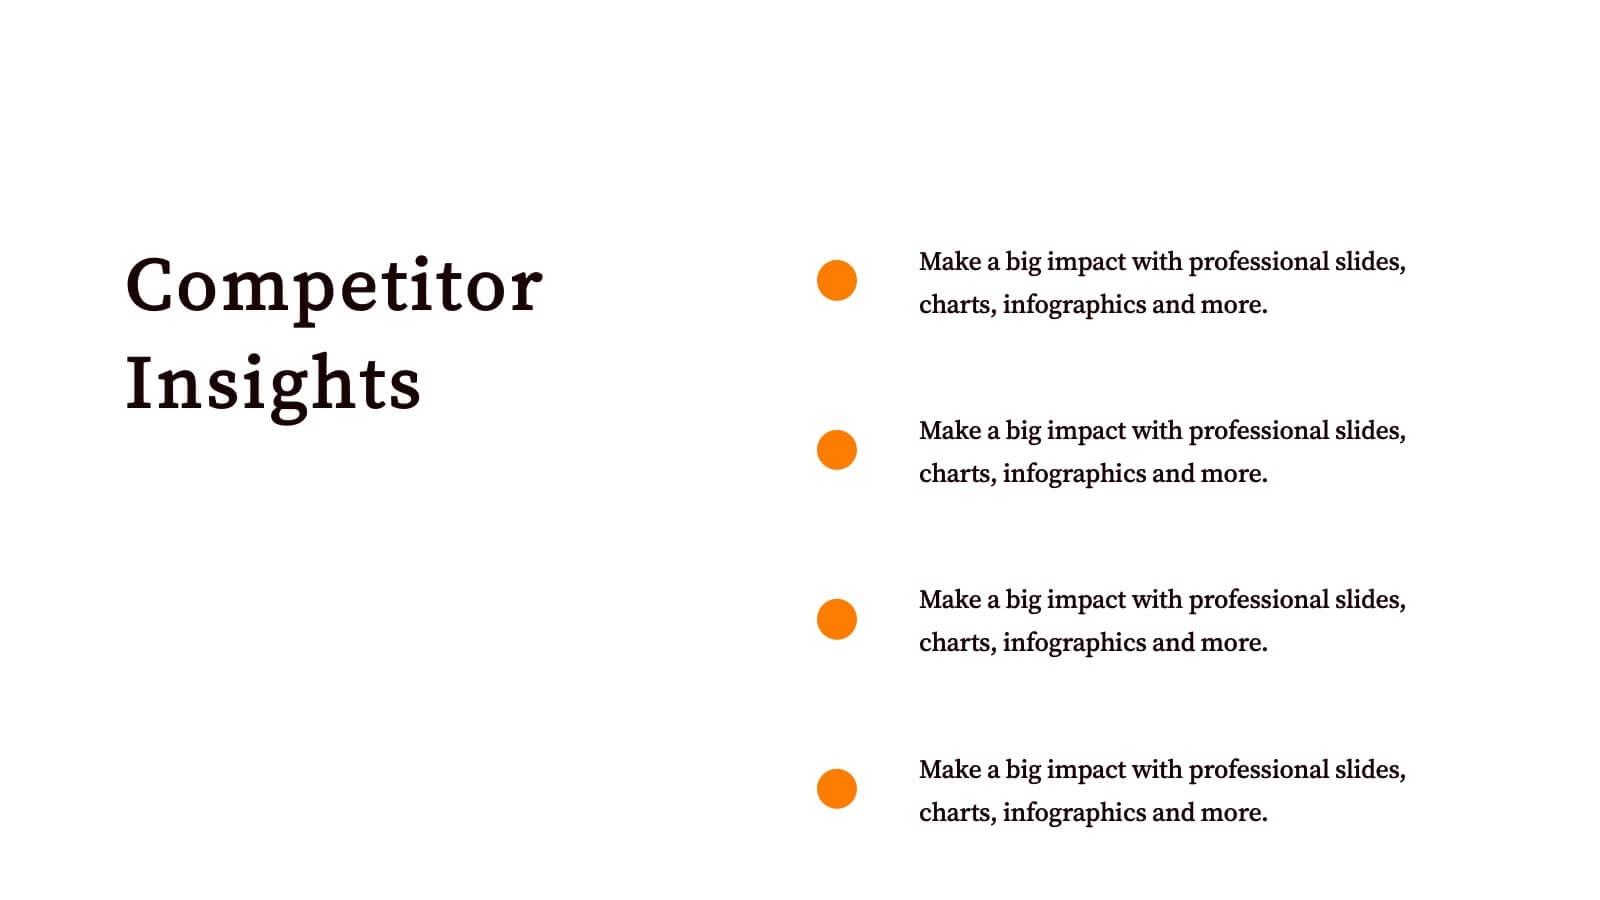
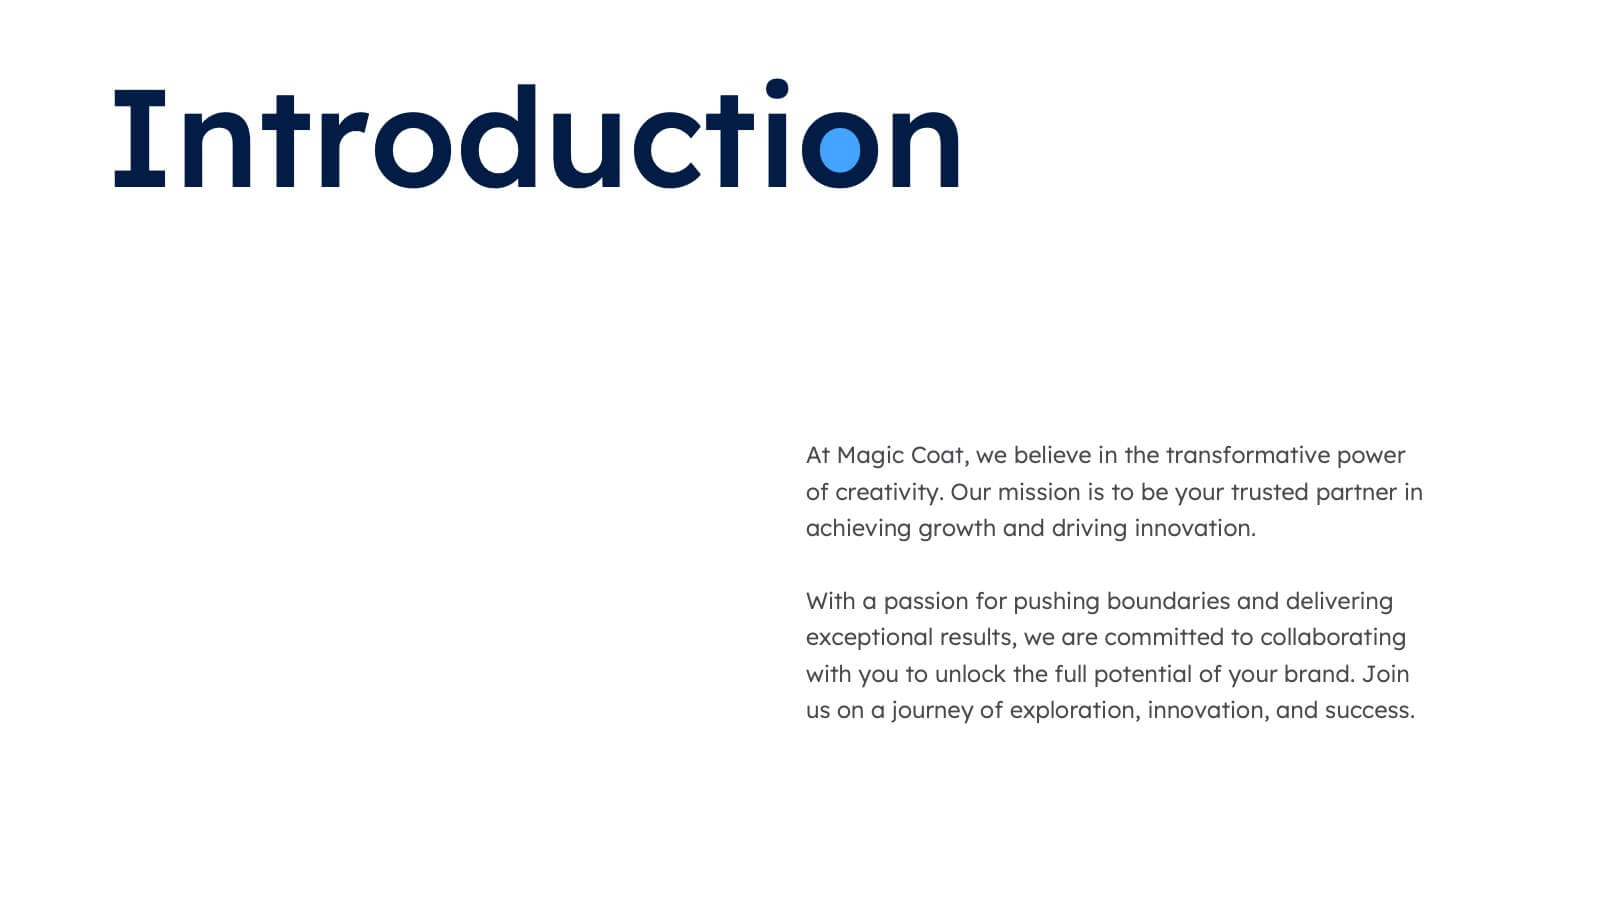
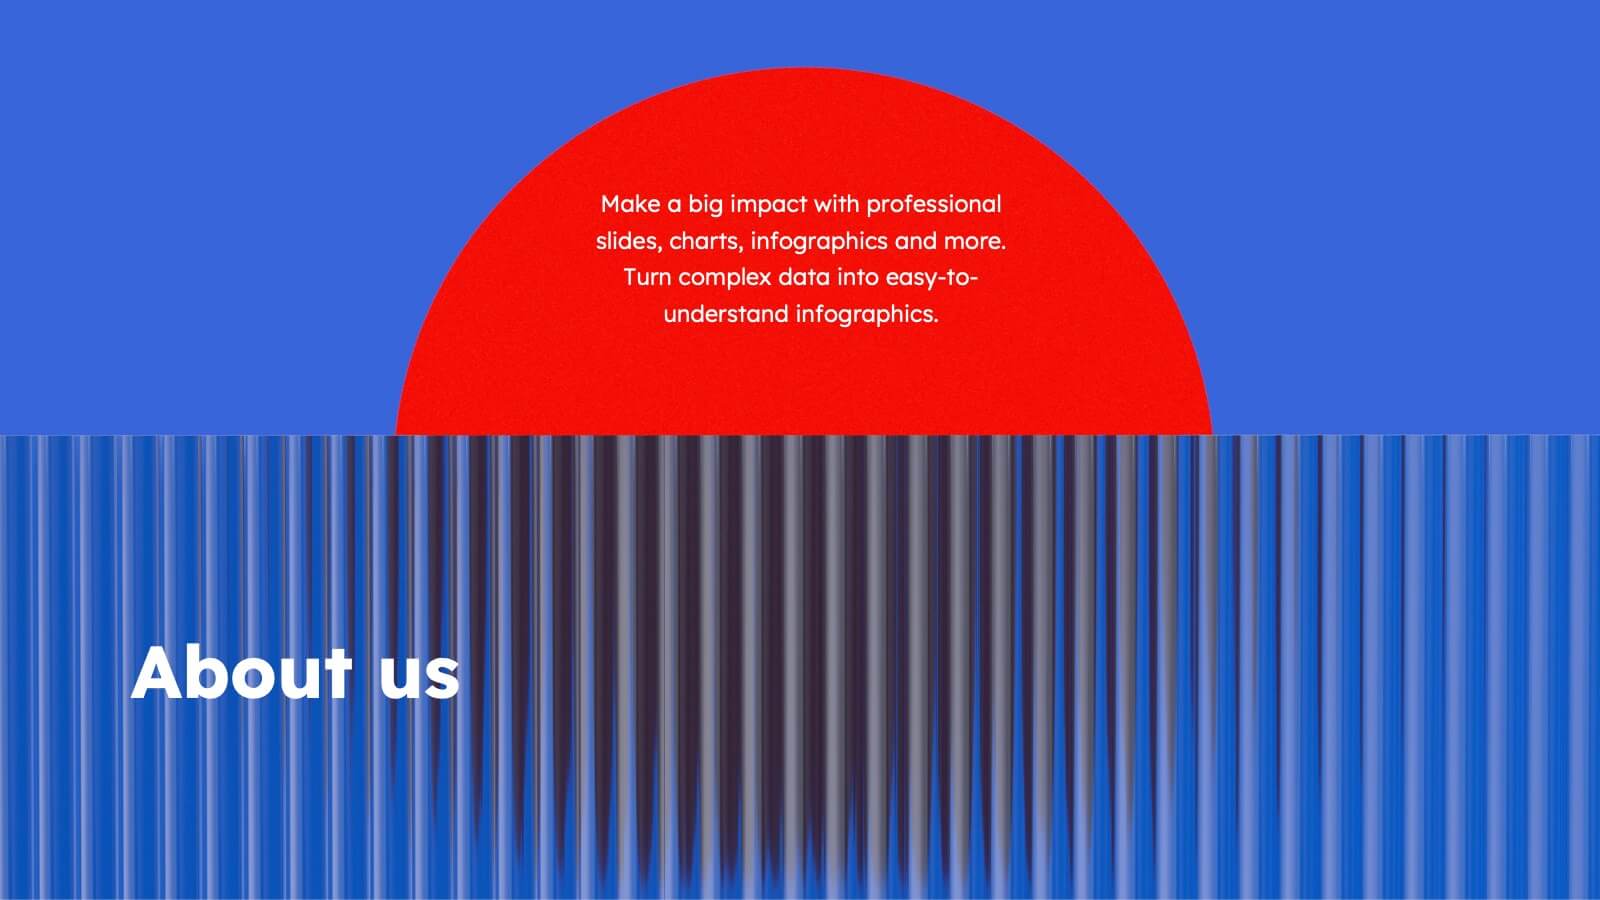
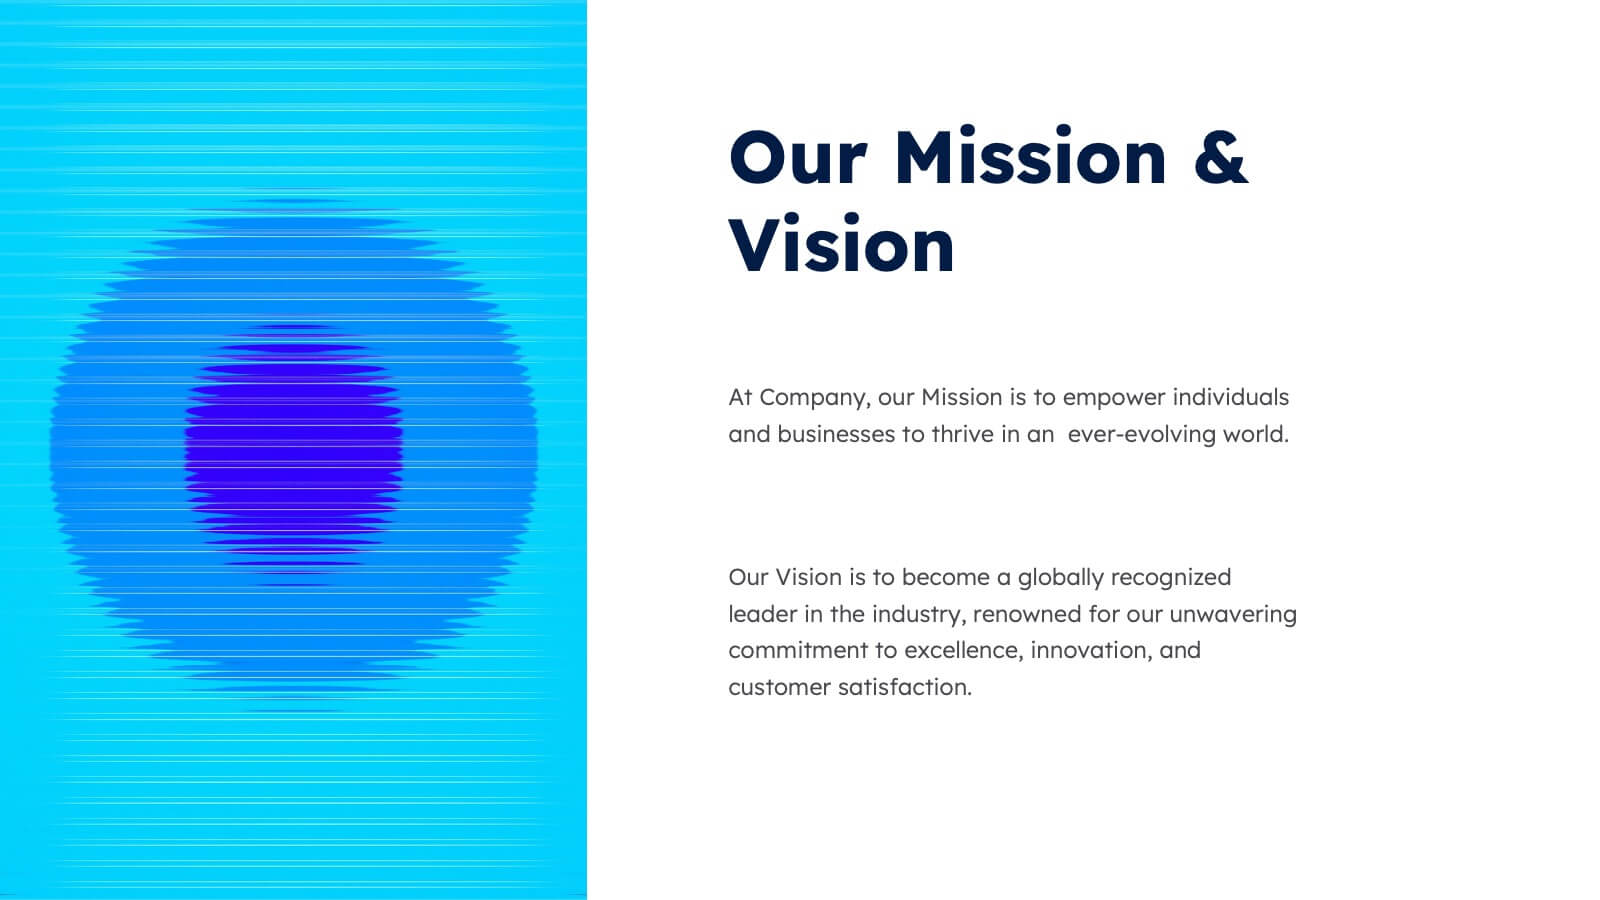
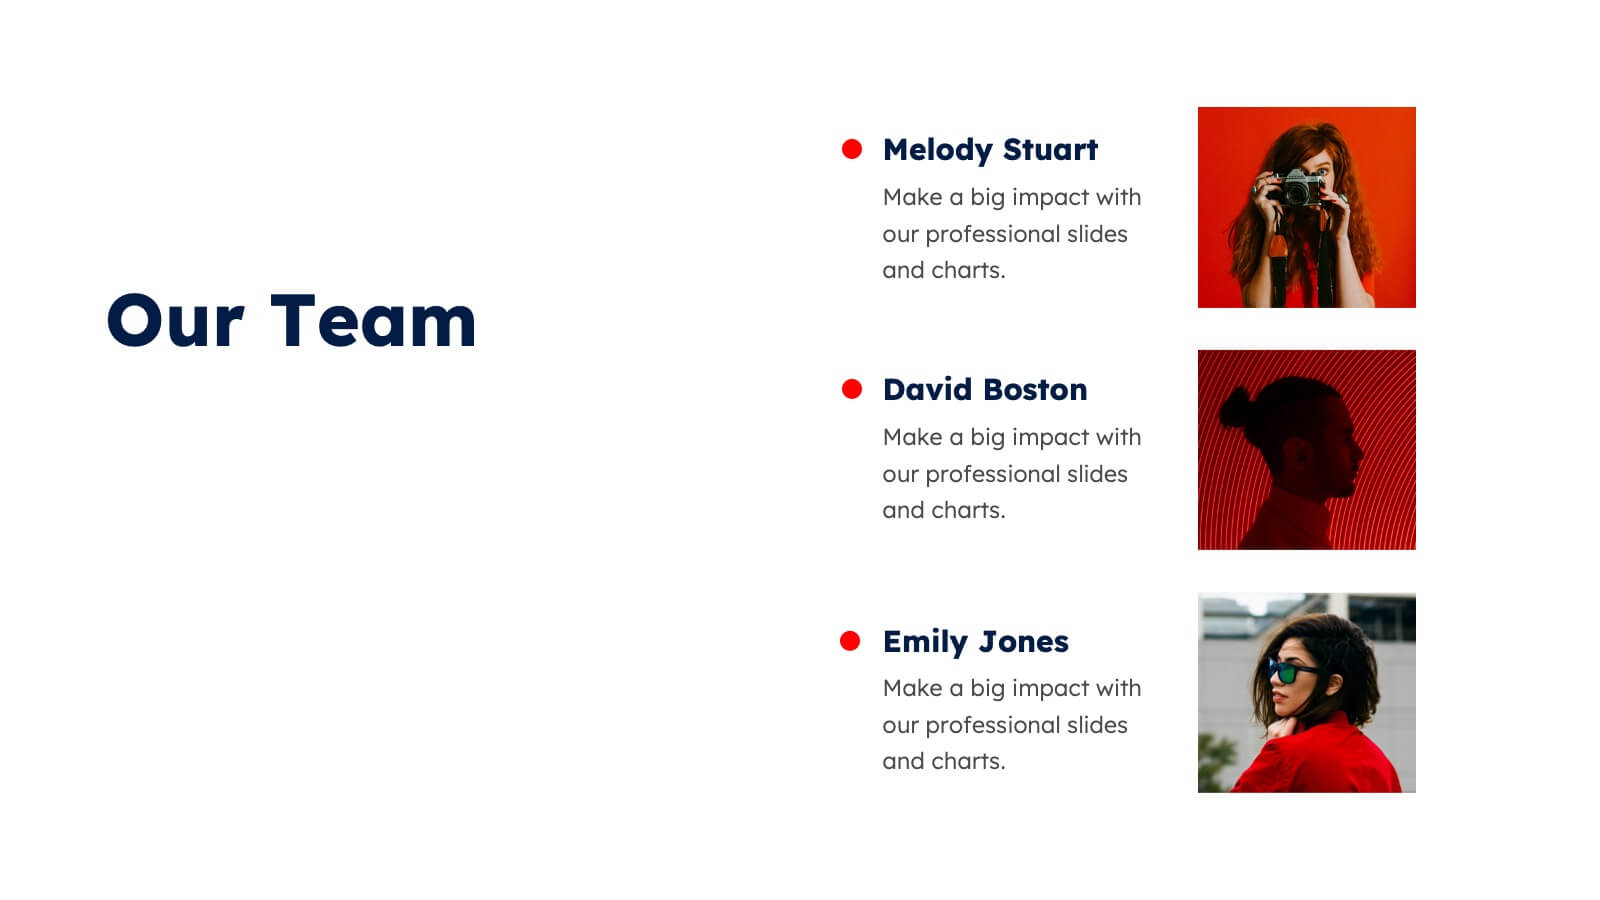
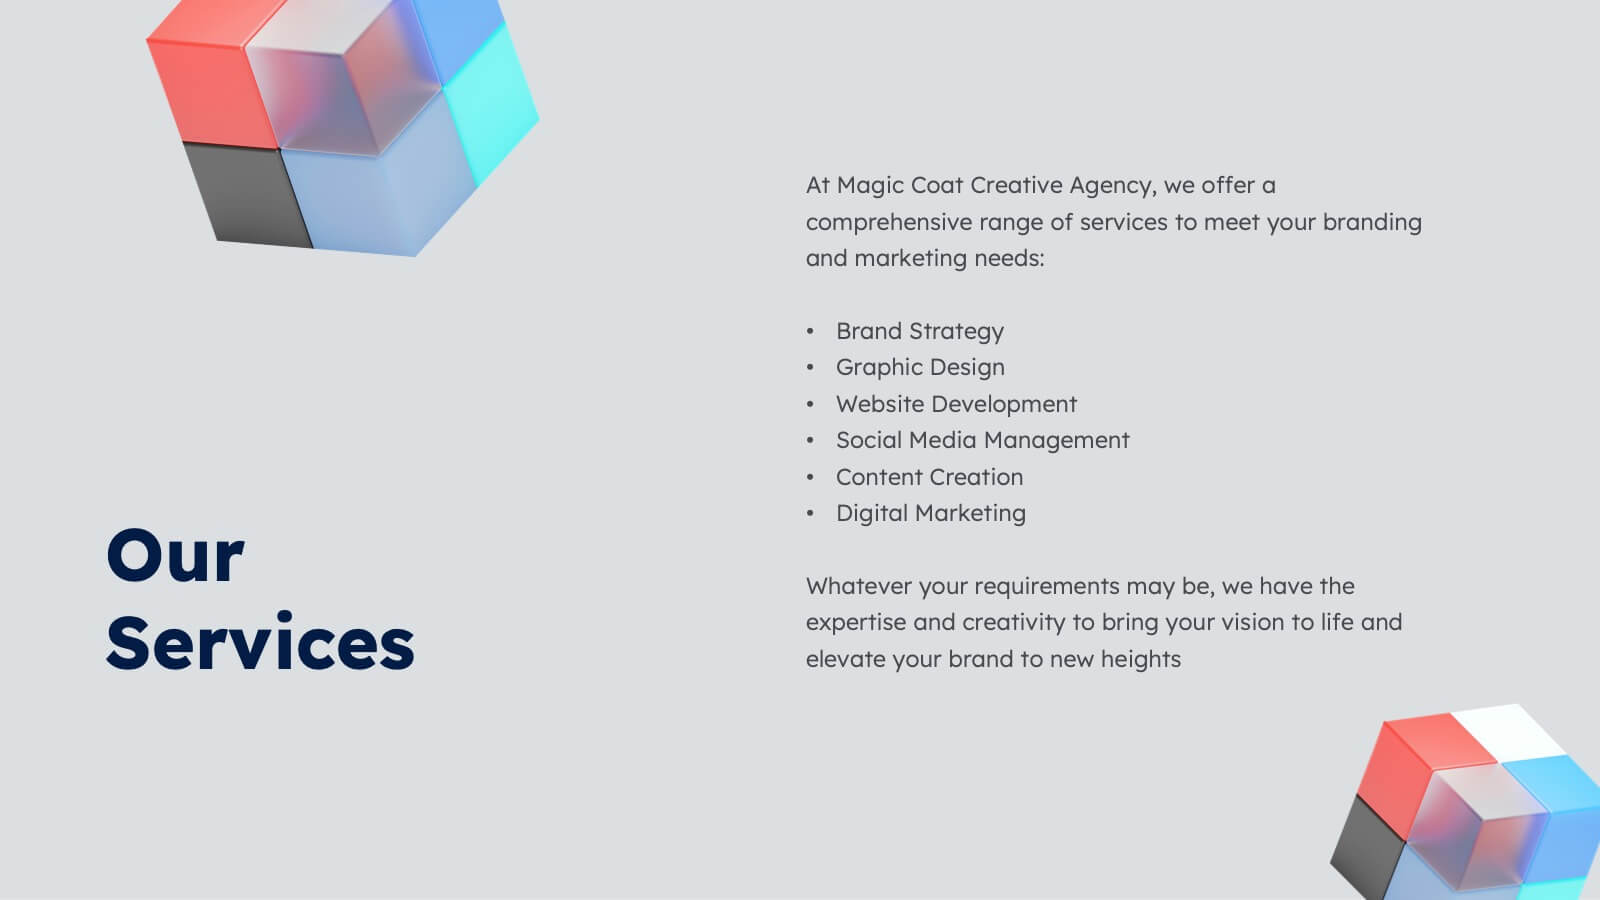
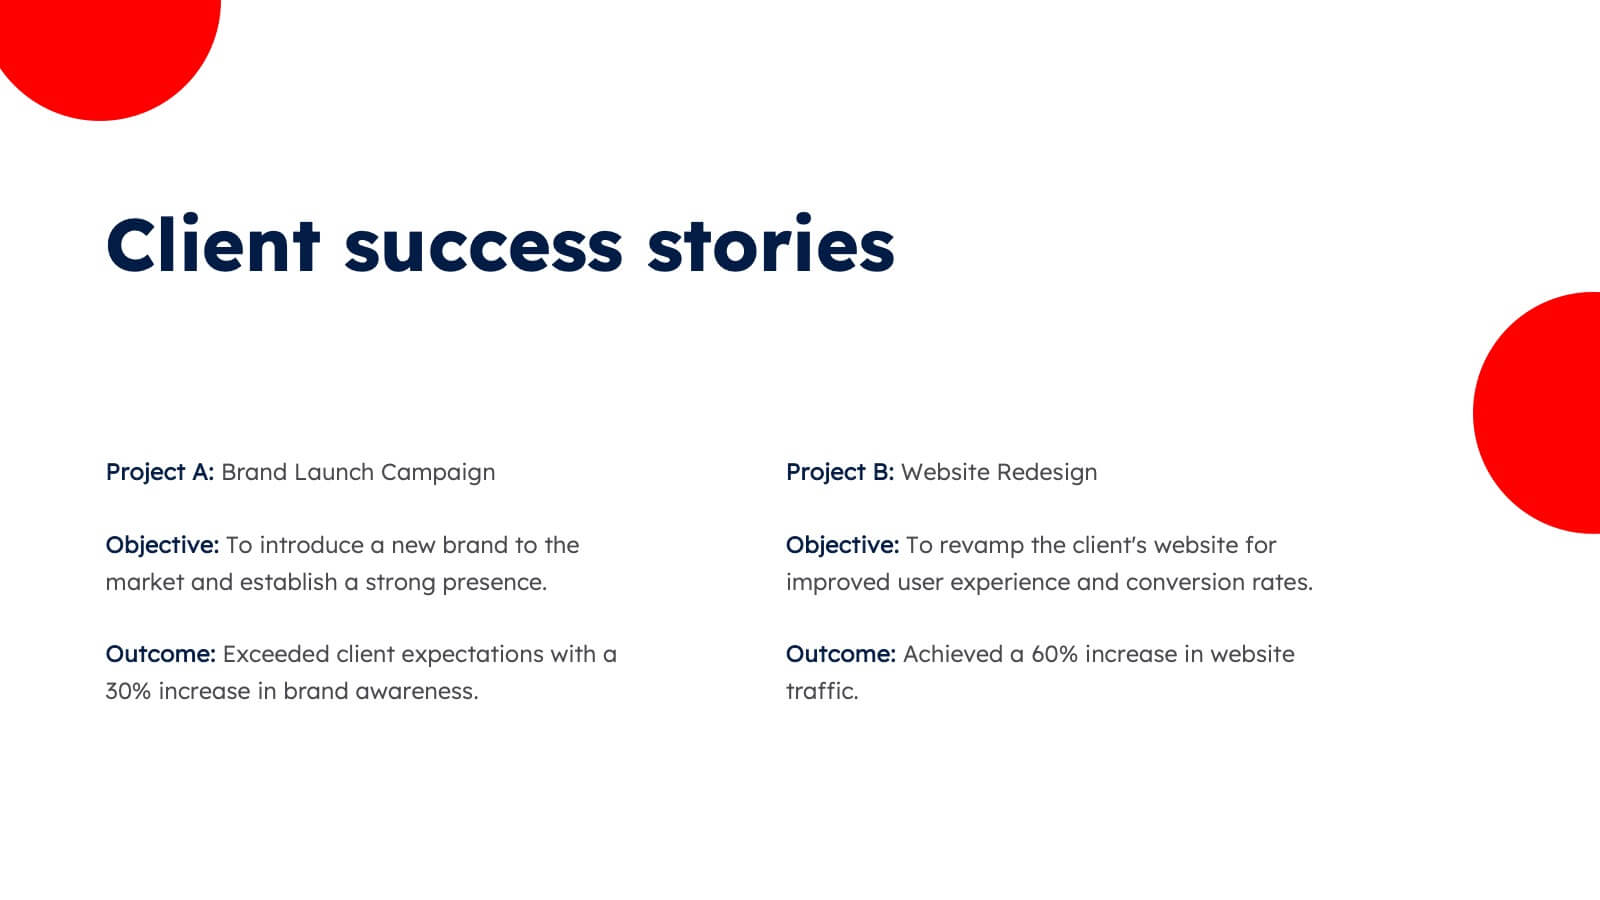
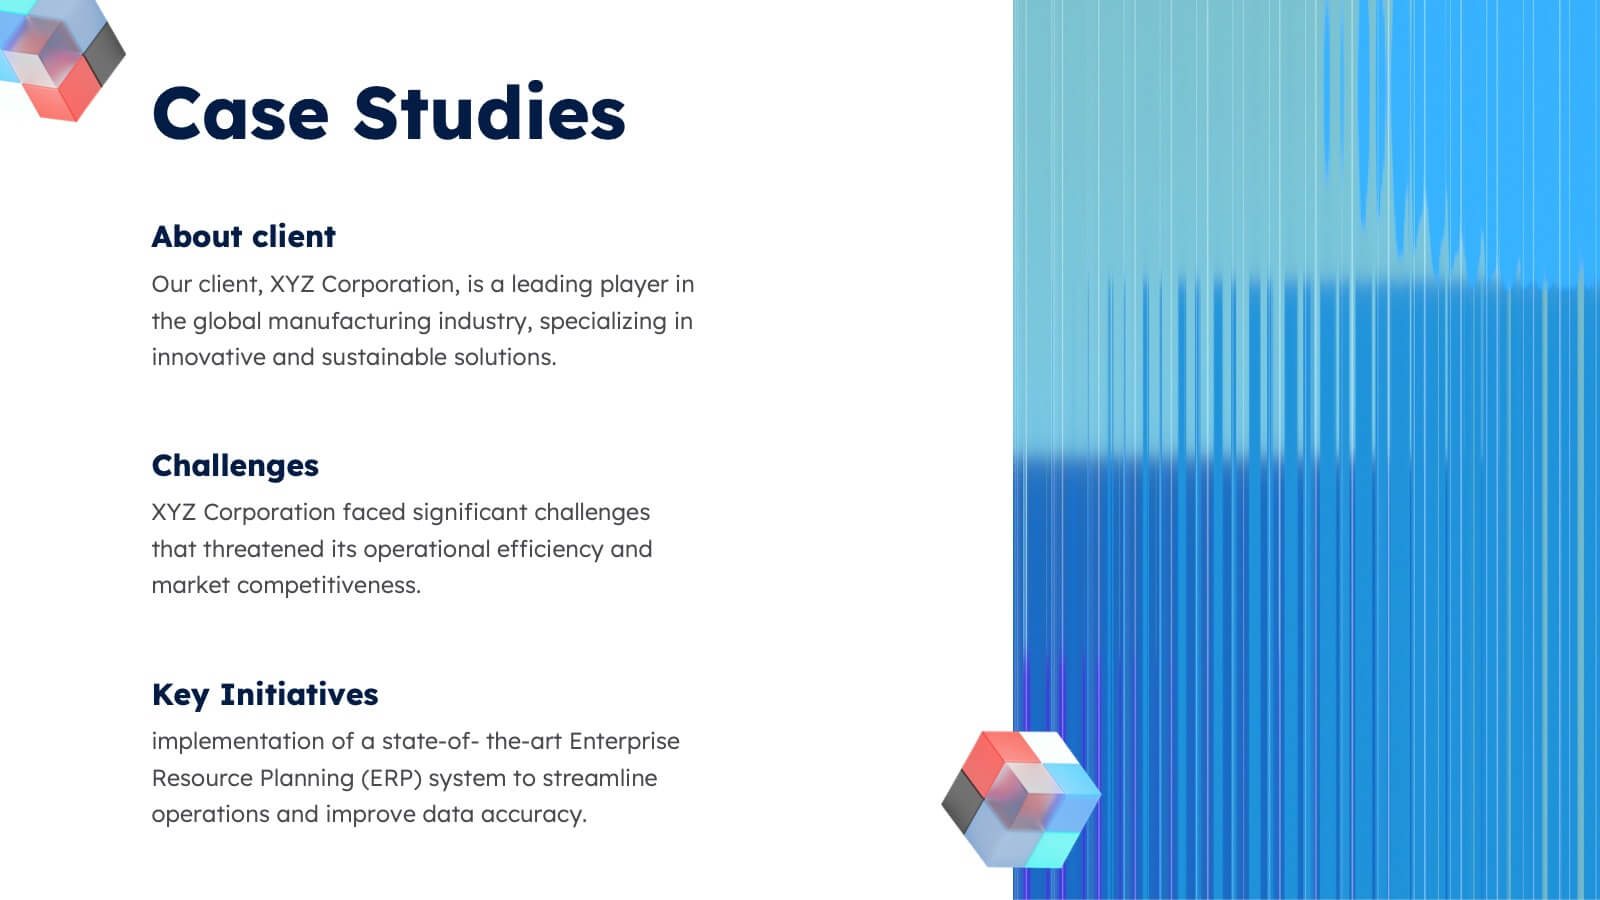
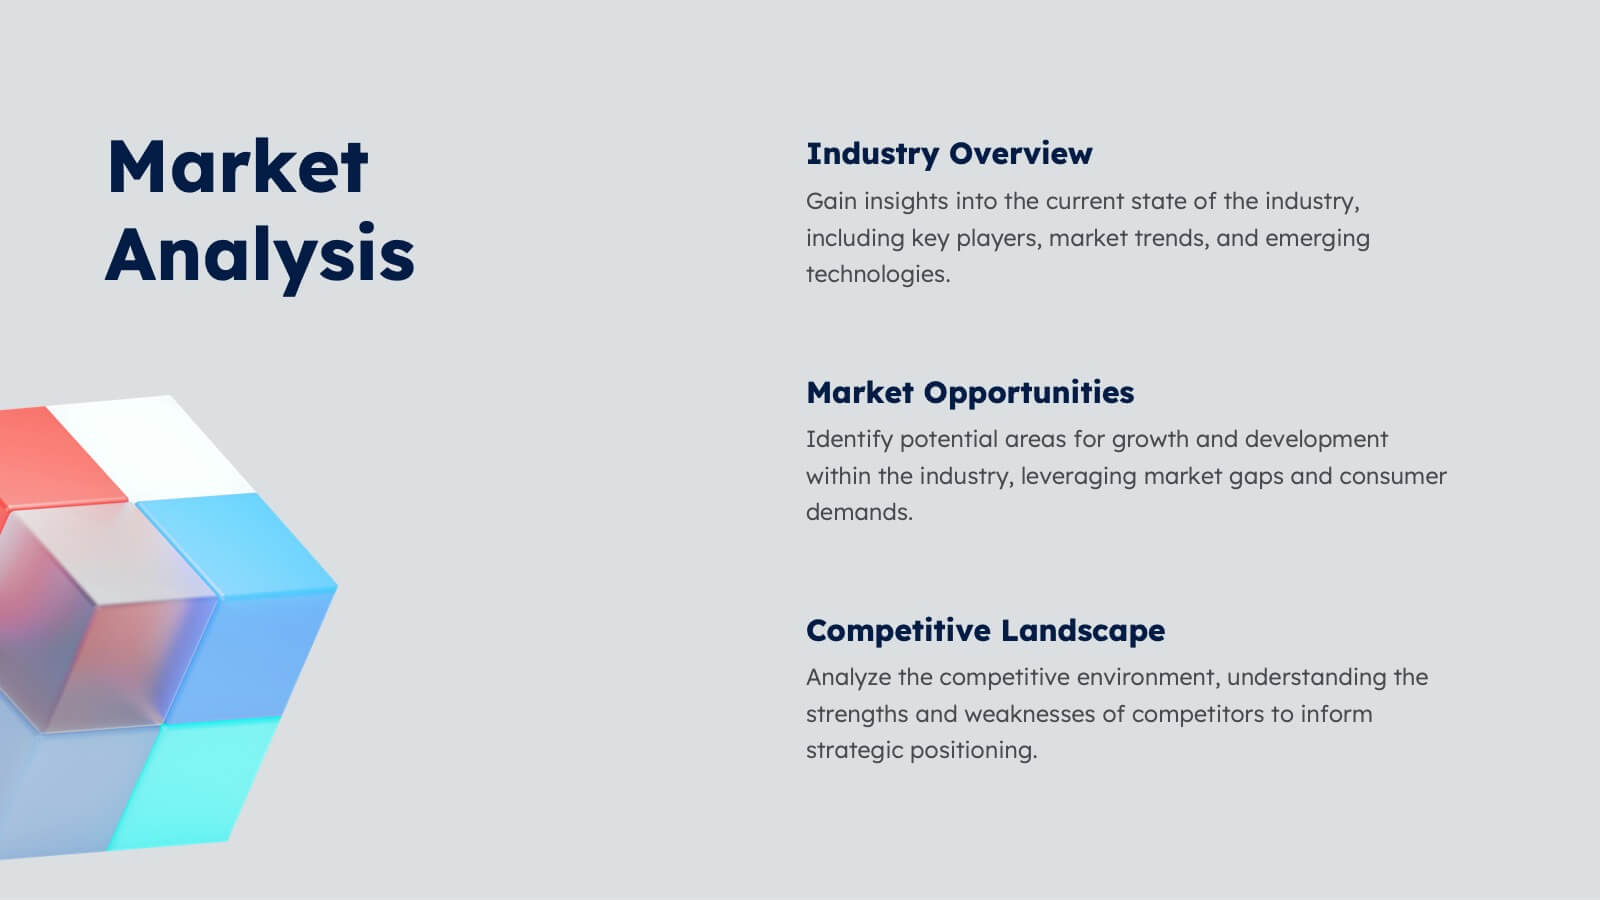
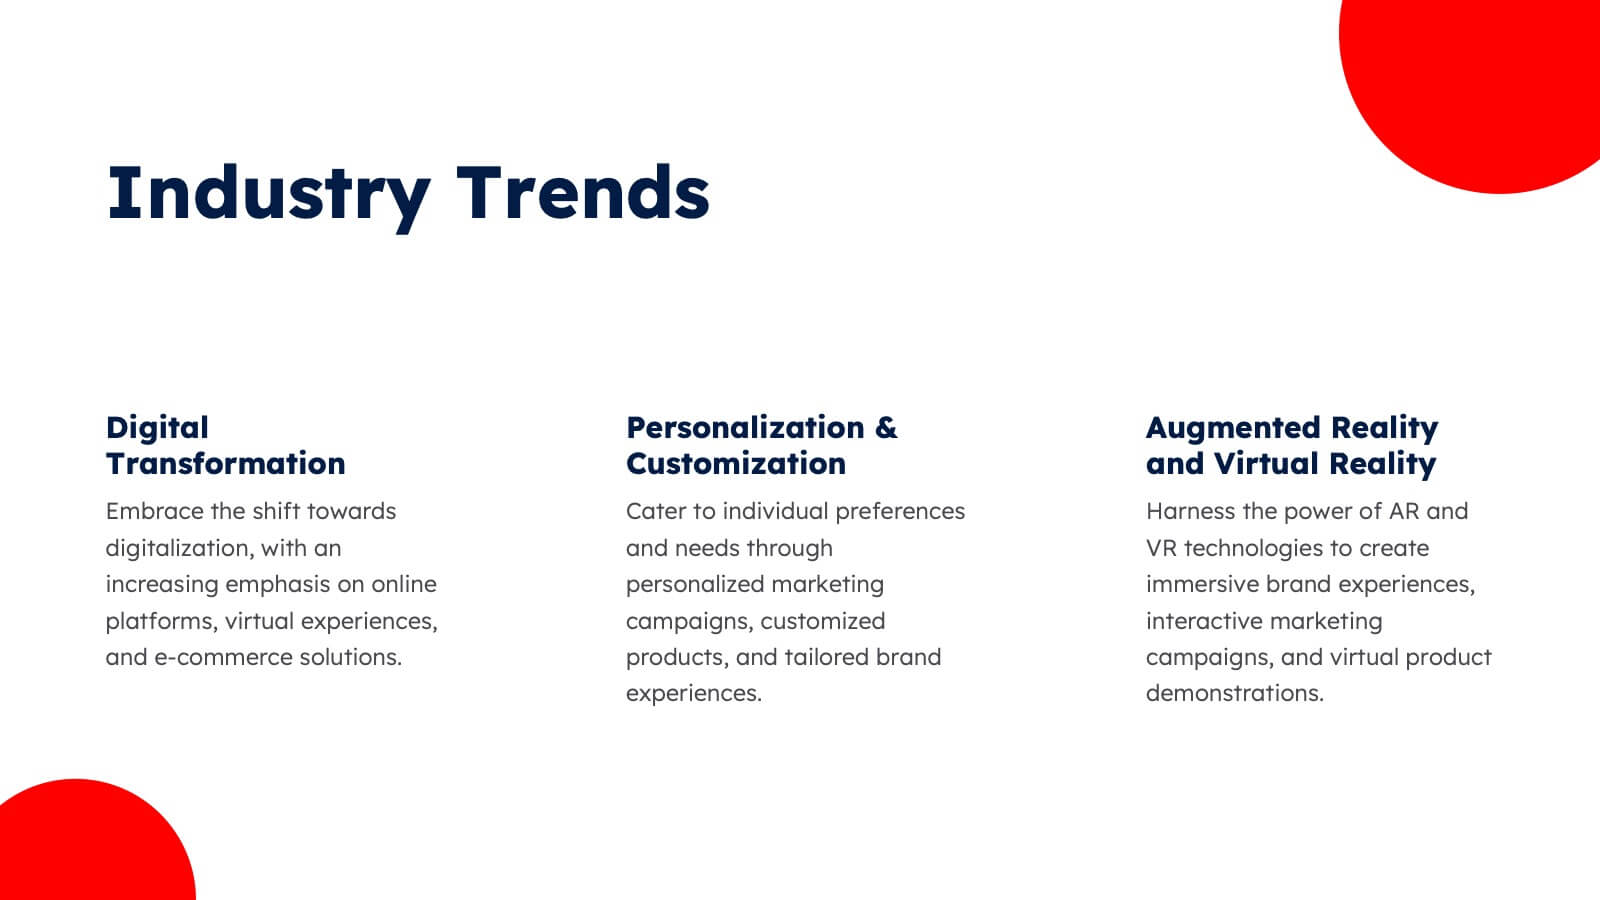
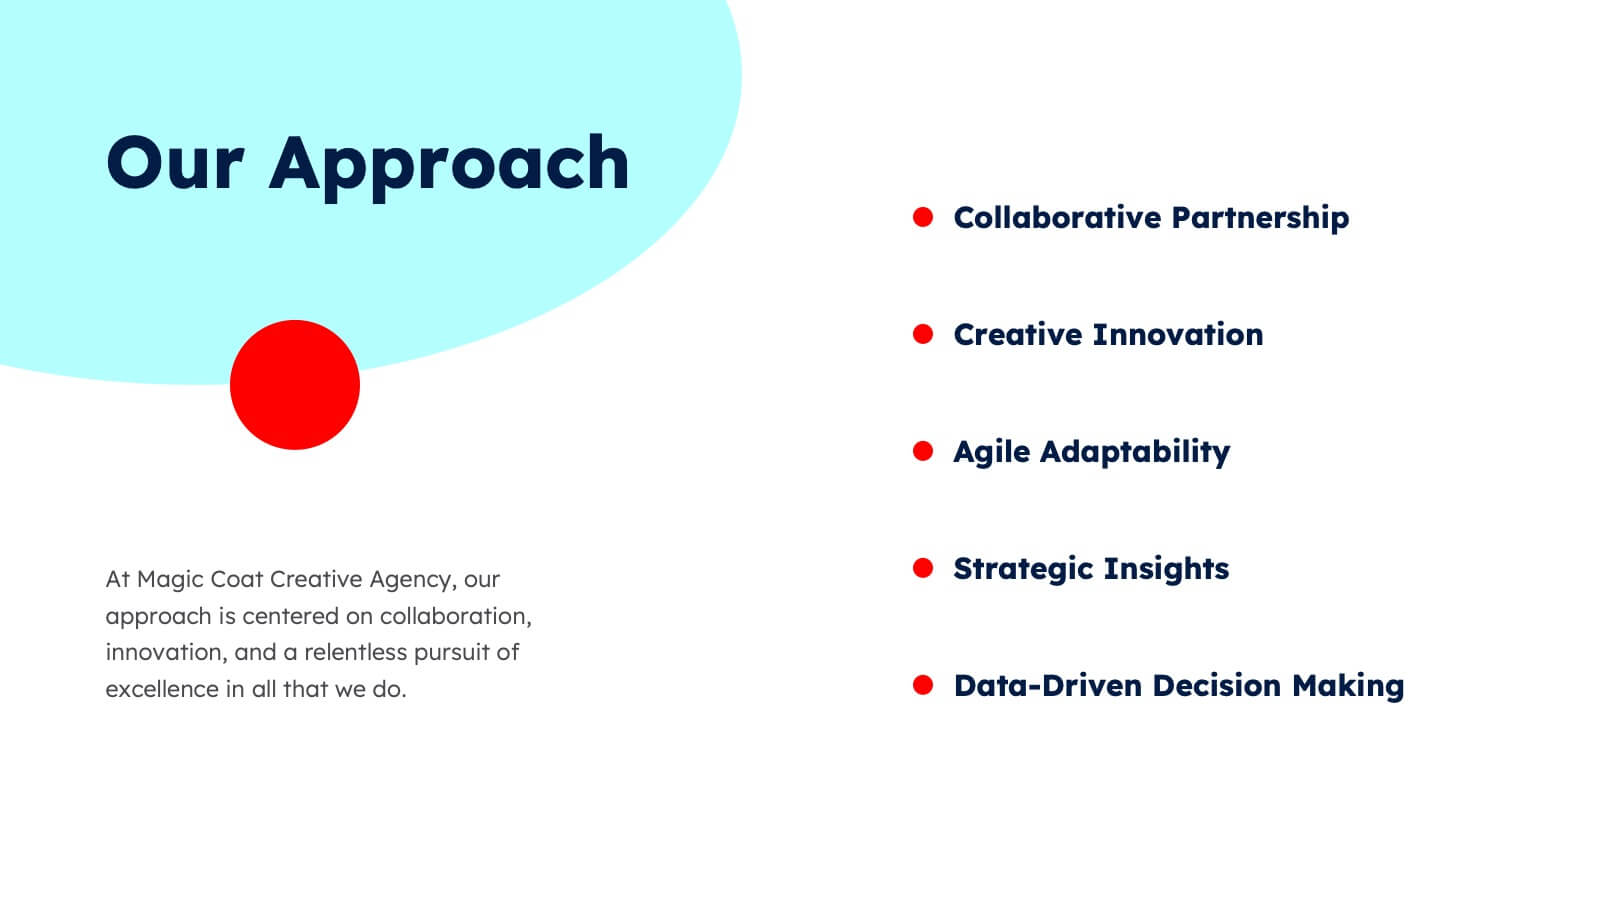
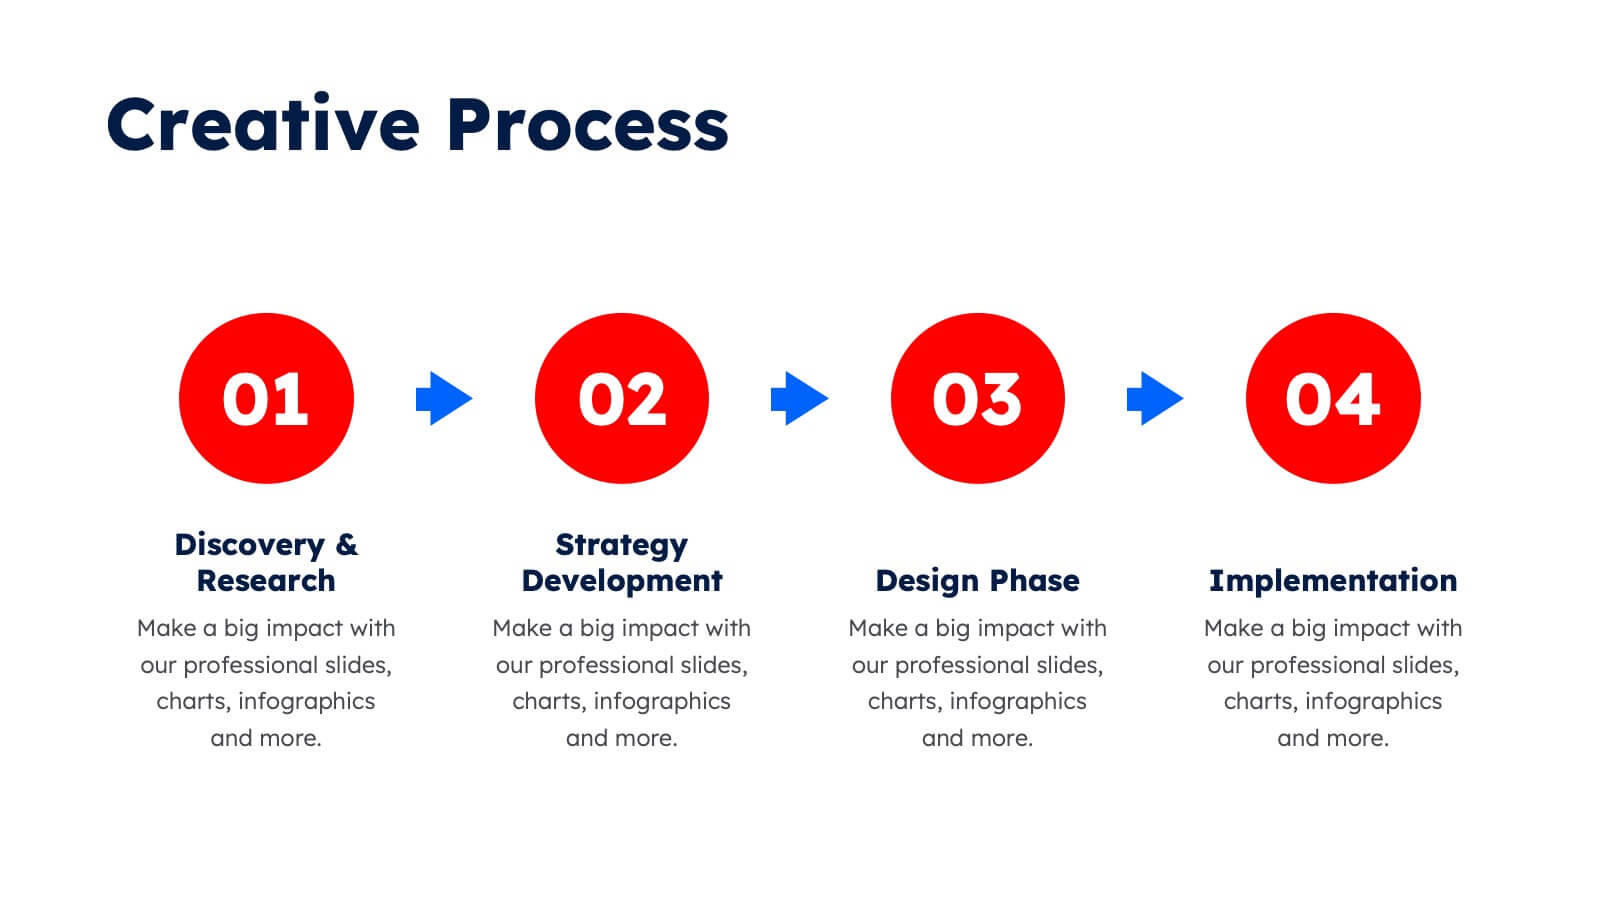
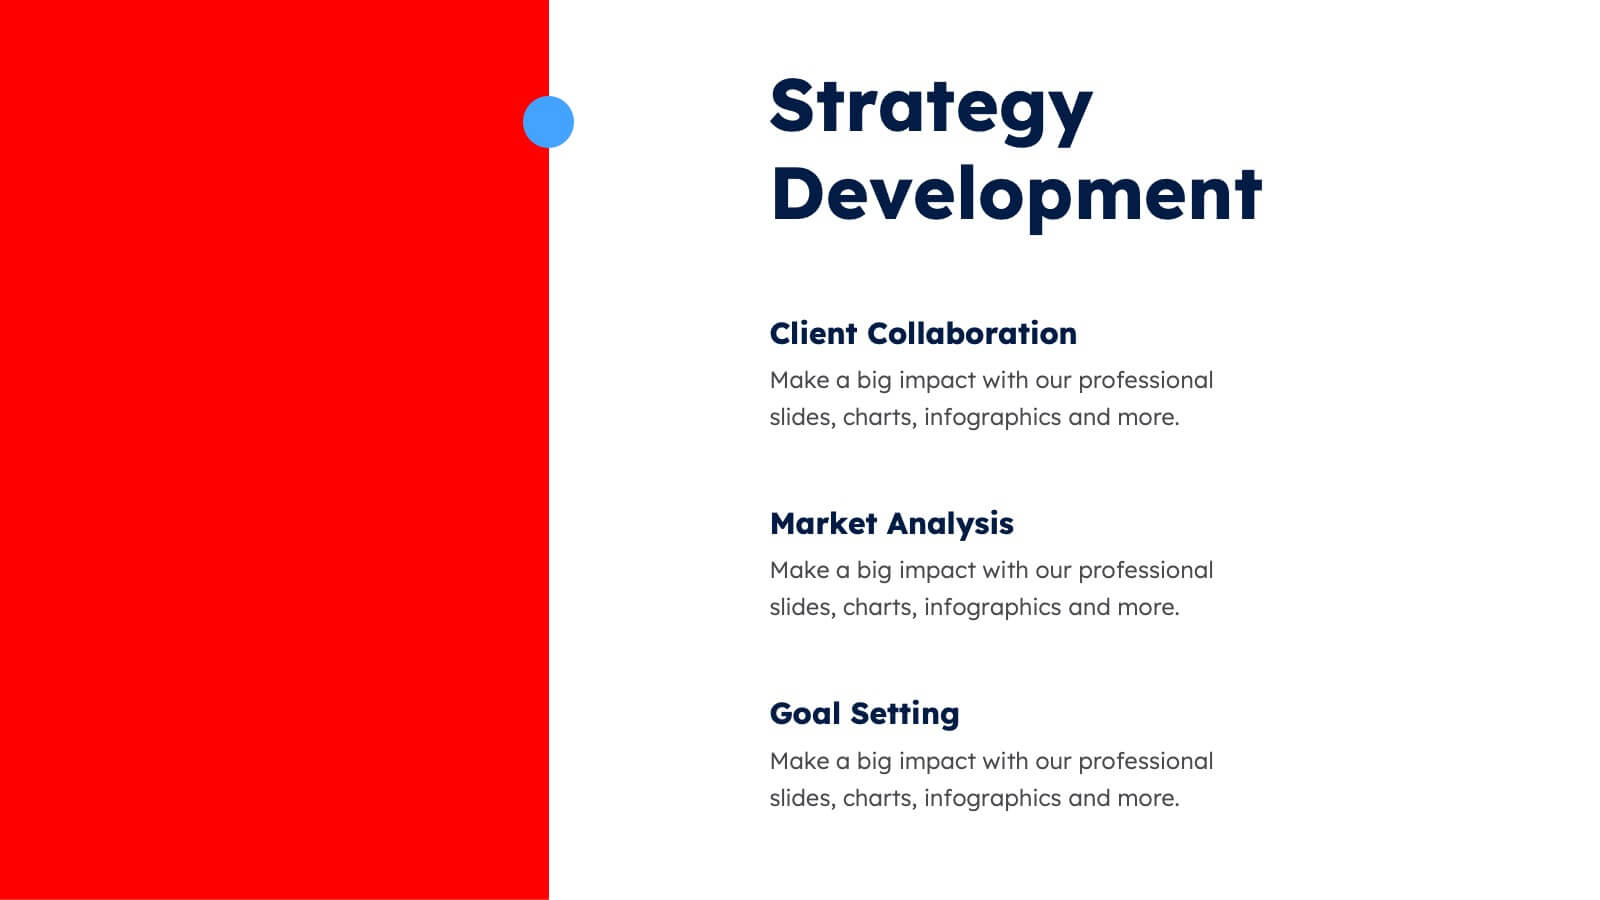
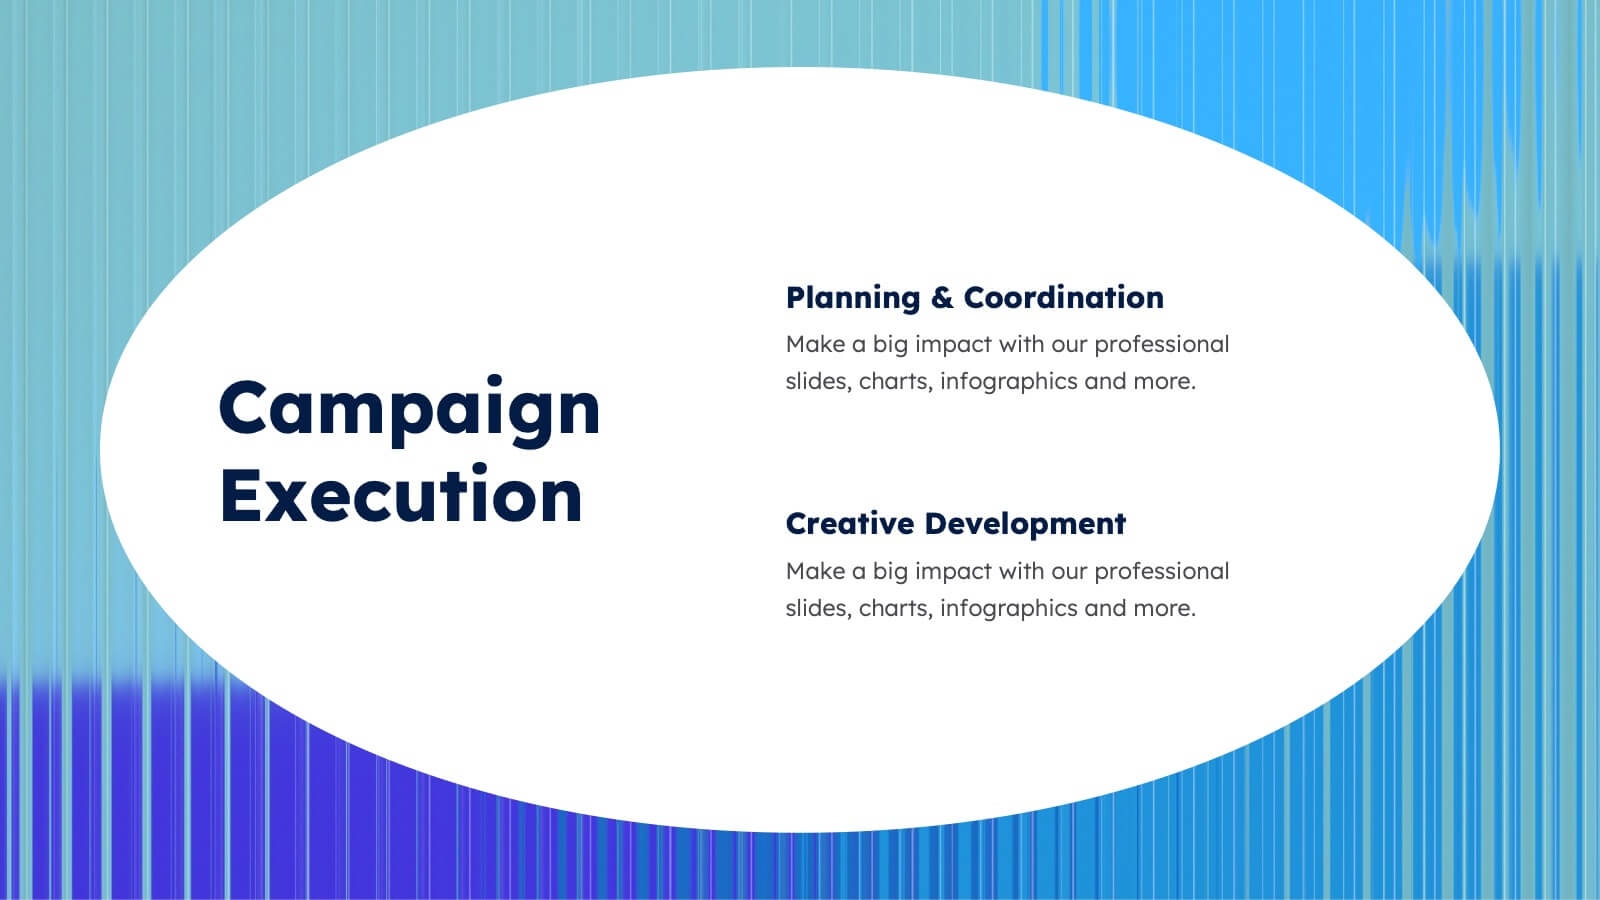
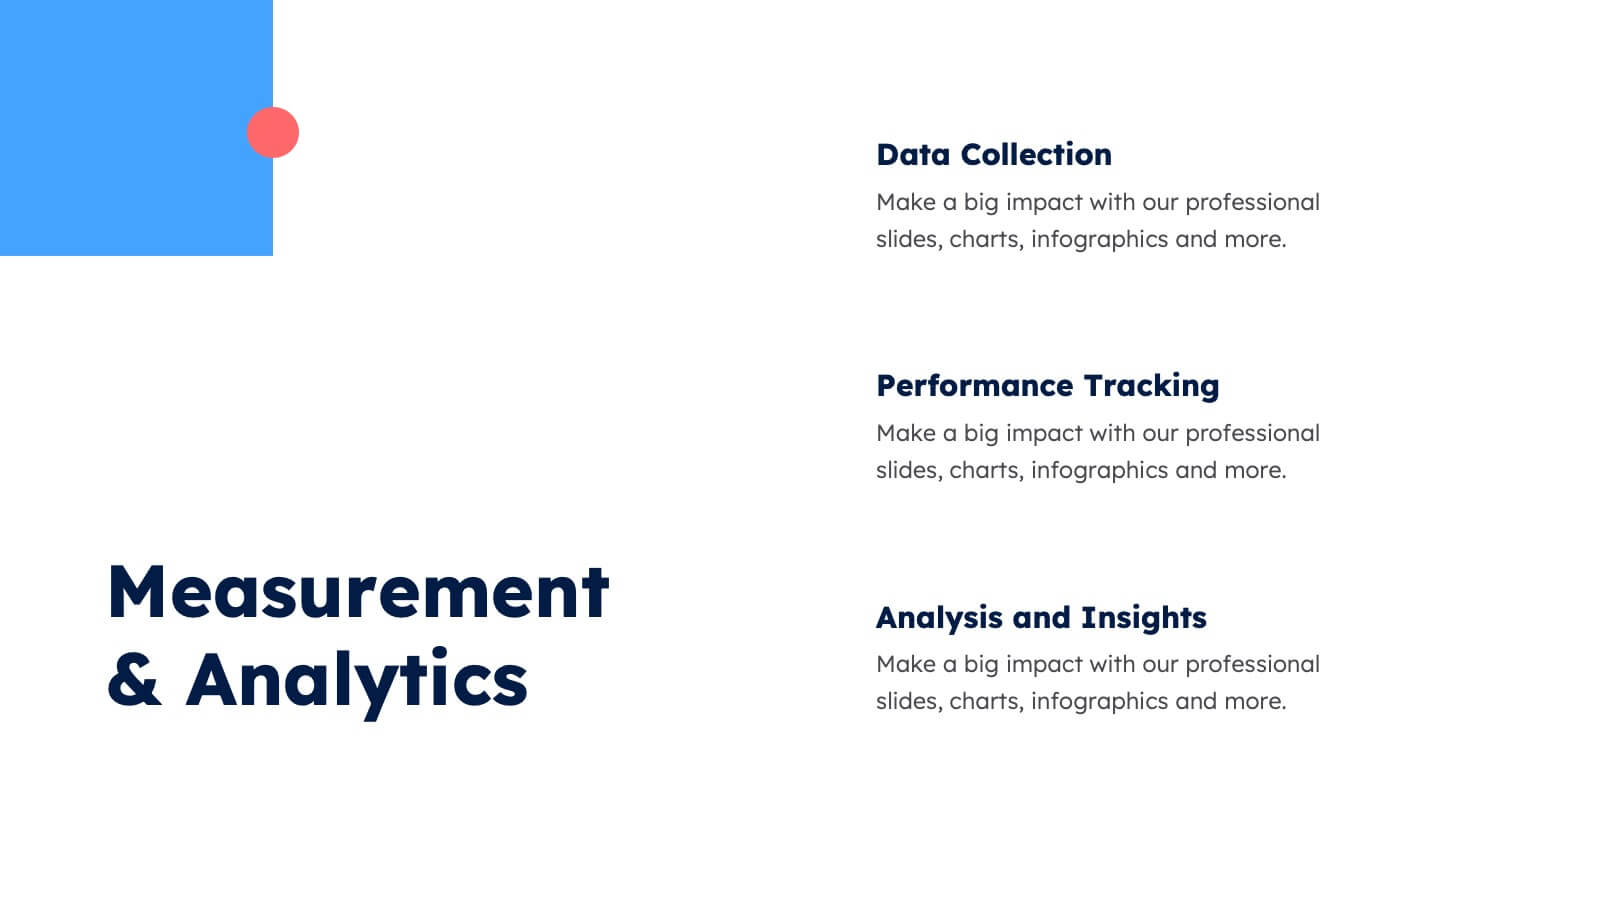
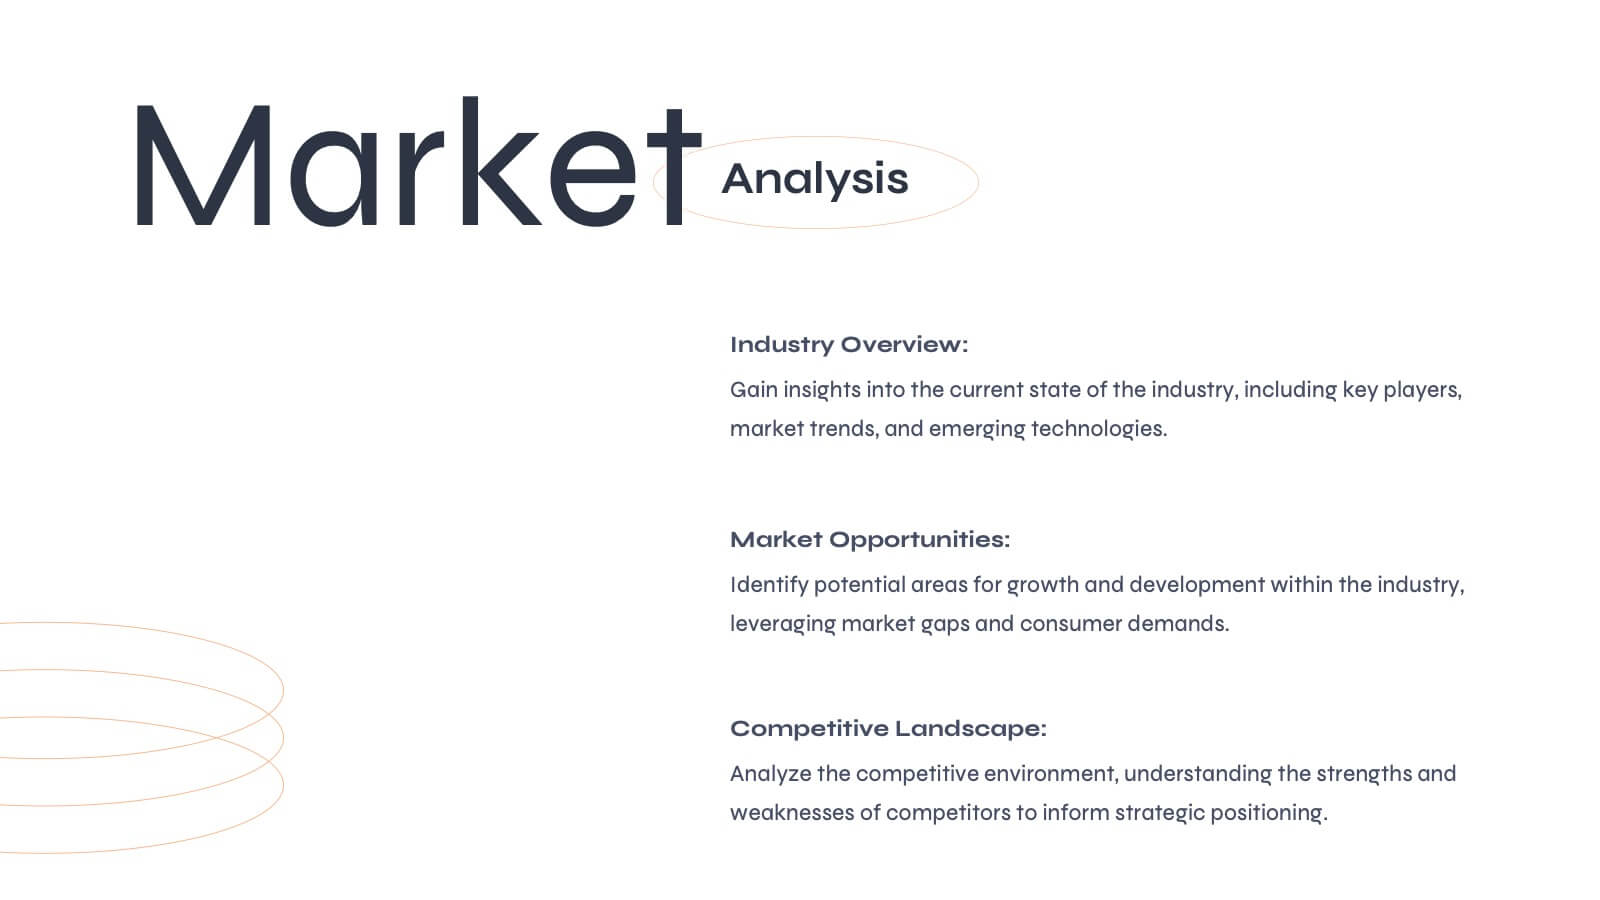
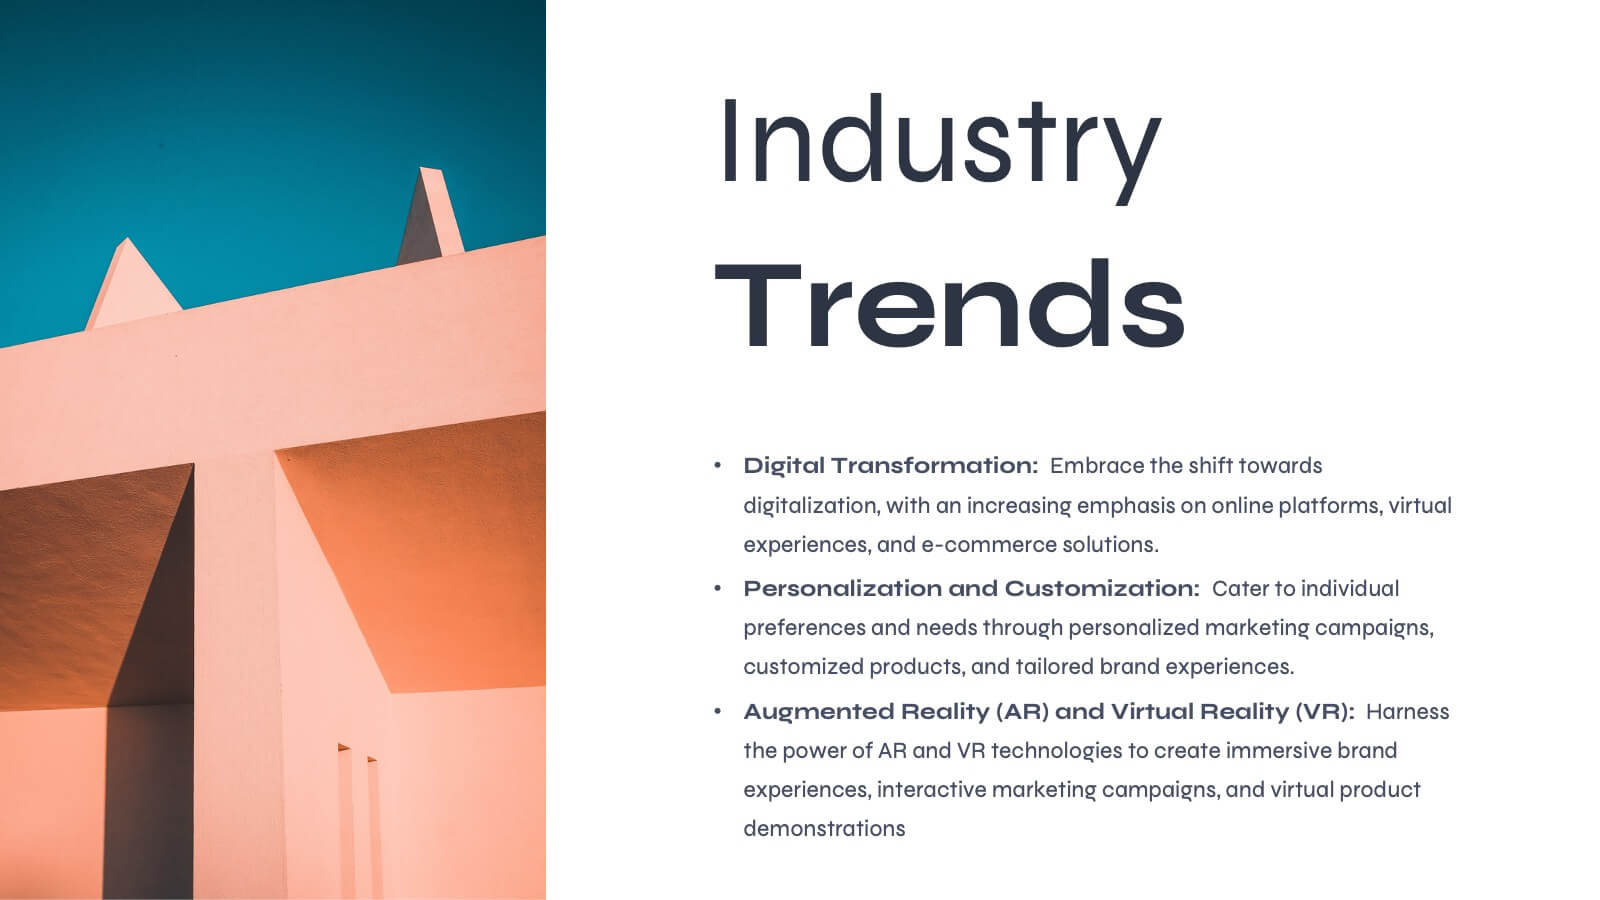
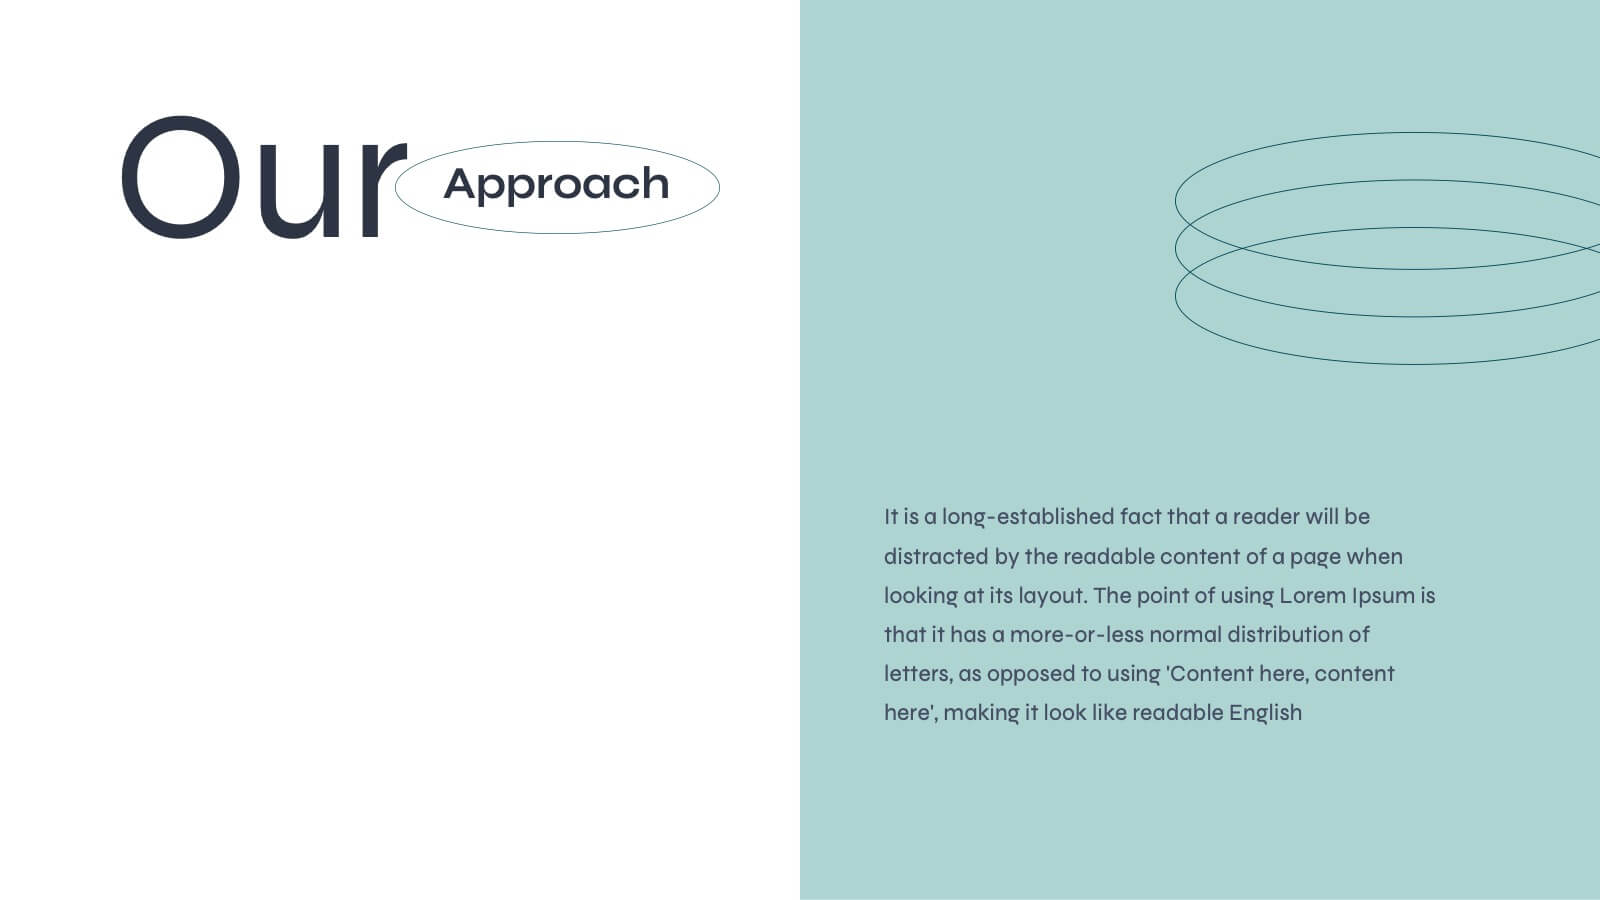
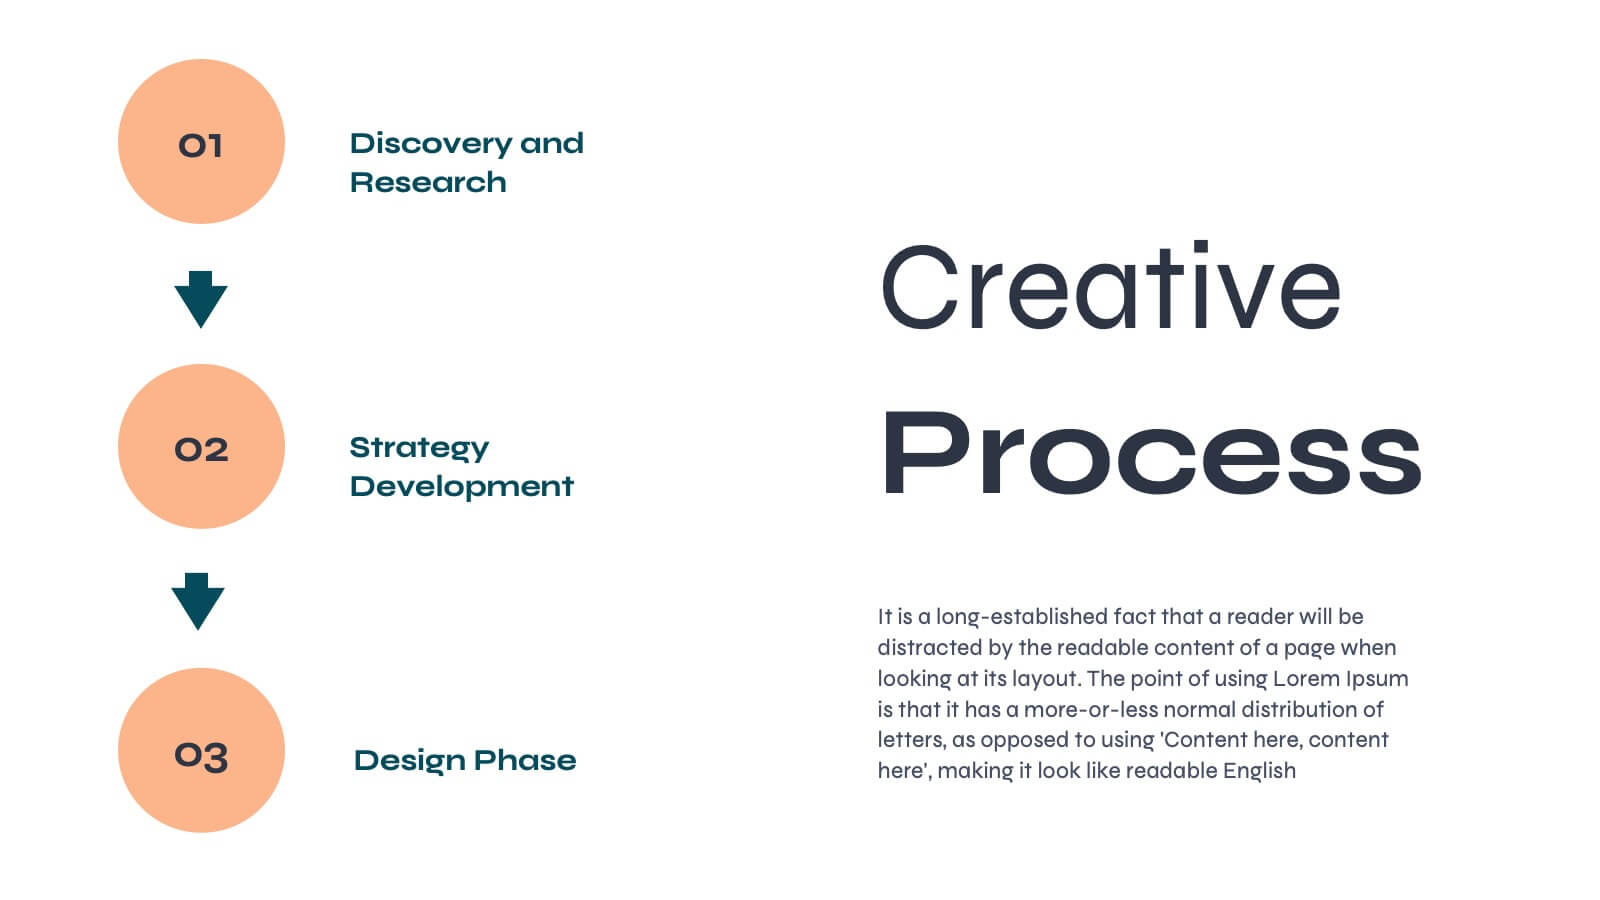
Aurora Agency Portfolio Presentation
Showcase your agency's strengths with this polished, modern presentation template. Perfect for presenting market analysis, client success stories, and creative processes, it features a clean and professional design. Highlight your team's expertise and strategic approach to impress potential clients. Compatible with PowerPoint, Keynote, and Google Slides, it ensures seamless presentations on any platform.


7 diapositivas
Asia Map Overview Infographic
Dive into the vast and varied landscape of Asia with our collection of infographic slides designed to provide an insightful overview of the continent. These templates are ideal for educators, business professionals, and researchers looking to present data on Asia’s geography, demographics, economic status, and more. Each slide is meticulously crafted to display information clearly and attractively, using maps, charts, and icons to represent statistical data and trends across Asia. The different shades and colors used in the maps distinguish between countries, regions, or data points, making it easy for audiences to grasp complex information at a glance. These templates are fully customizable, enabling you to highlight specific areas or data according to your presentation needs. Whether discussing population growth, economic development, or environmental concerns, these slides are an excellent resource for conveying detailed information in a visually engaging format.