


Características


¿Tienes alguna pregunta?
Recomendar


4 diapositivas
Team Member Compensation and Benefits
Showcase employee rewards, perks, and compensation structures with this sleek, progressive flow design. Perfect for HR presentations, onboarding materials, or internal updates. Easily customizable in PowerPoint, Keynote, and Google Slides to match your branding needs.


6 diapositivas
Economic Pyramid Infographic
Showcase economic structures with our Economic Pyramid Infographic, compatible with Powerpoint, Google Slides, and Keynote. This template is designed for economists, educators, and business professionals, providing a visual hierarchy of economic indicators or demographics. Each level of the pyramid represents a different segment, such as income brackets, consumer classes, or resource distribution. It's an ideal tool for presentations that require a clear depiction of economic stratification or market segmentation. Customizable and easy to understand, this infographic helps simplify complex economic data into digestible visual tiers for any audience.


21 diapositivas
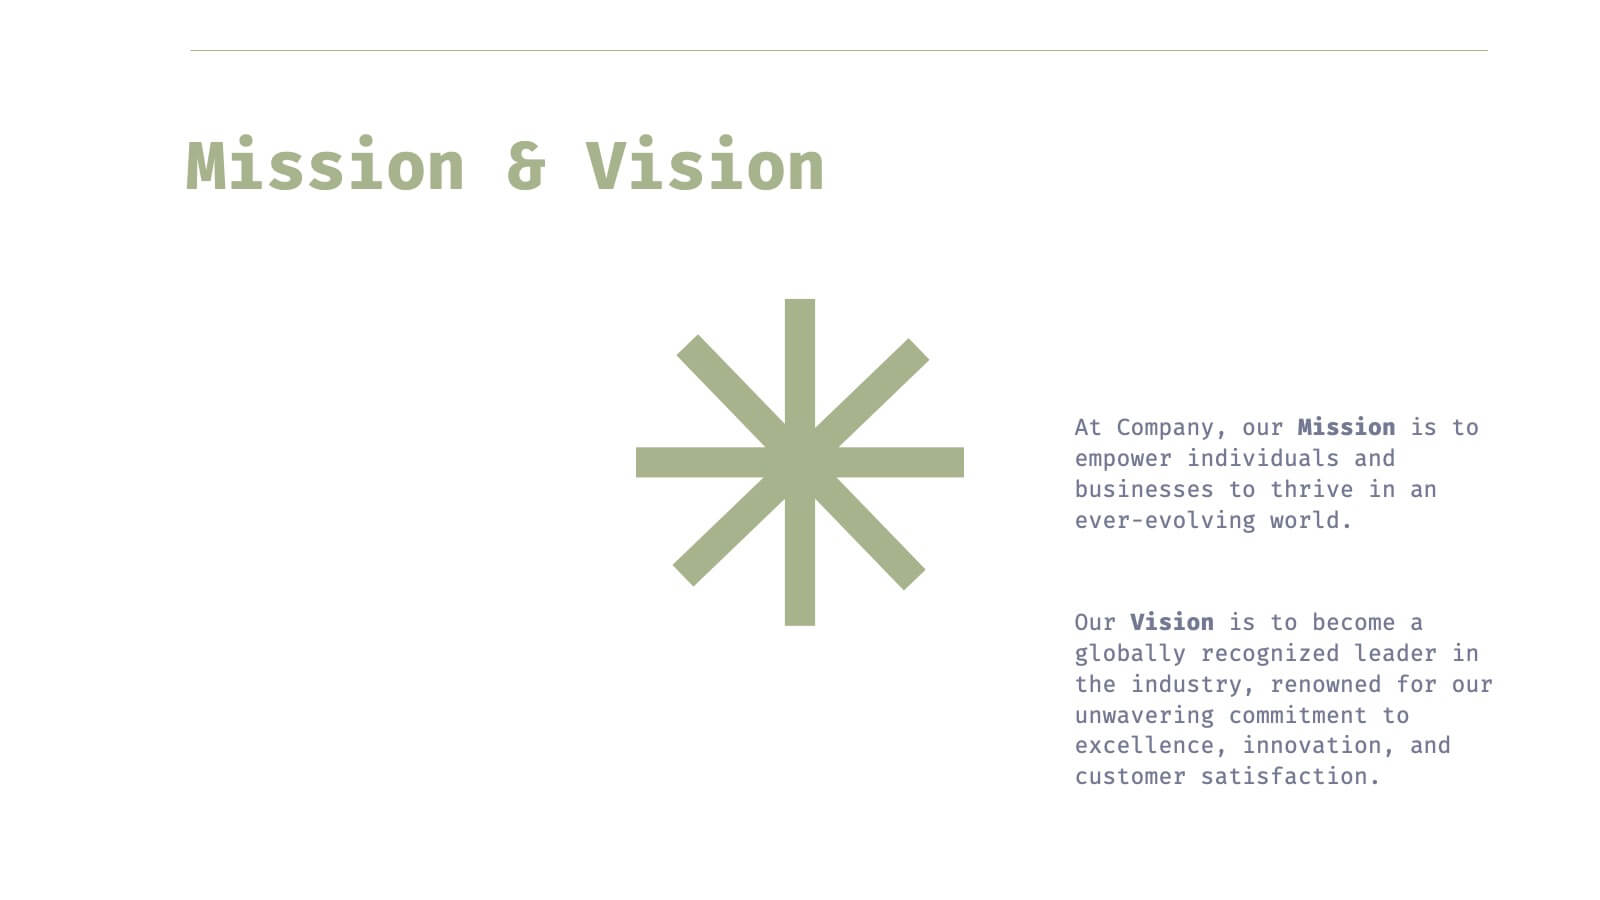
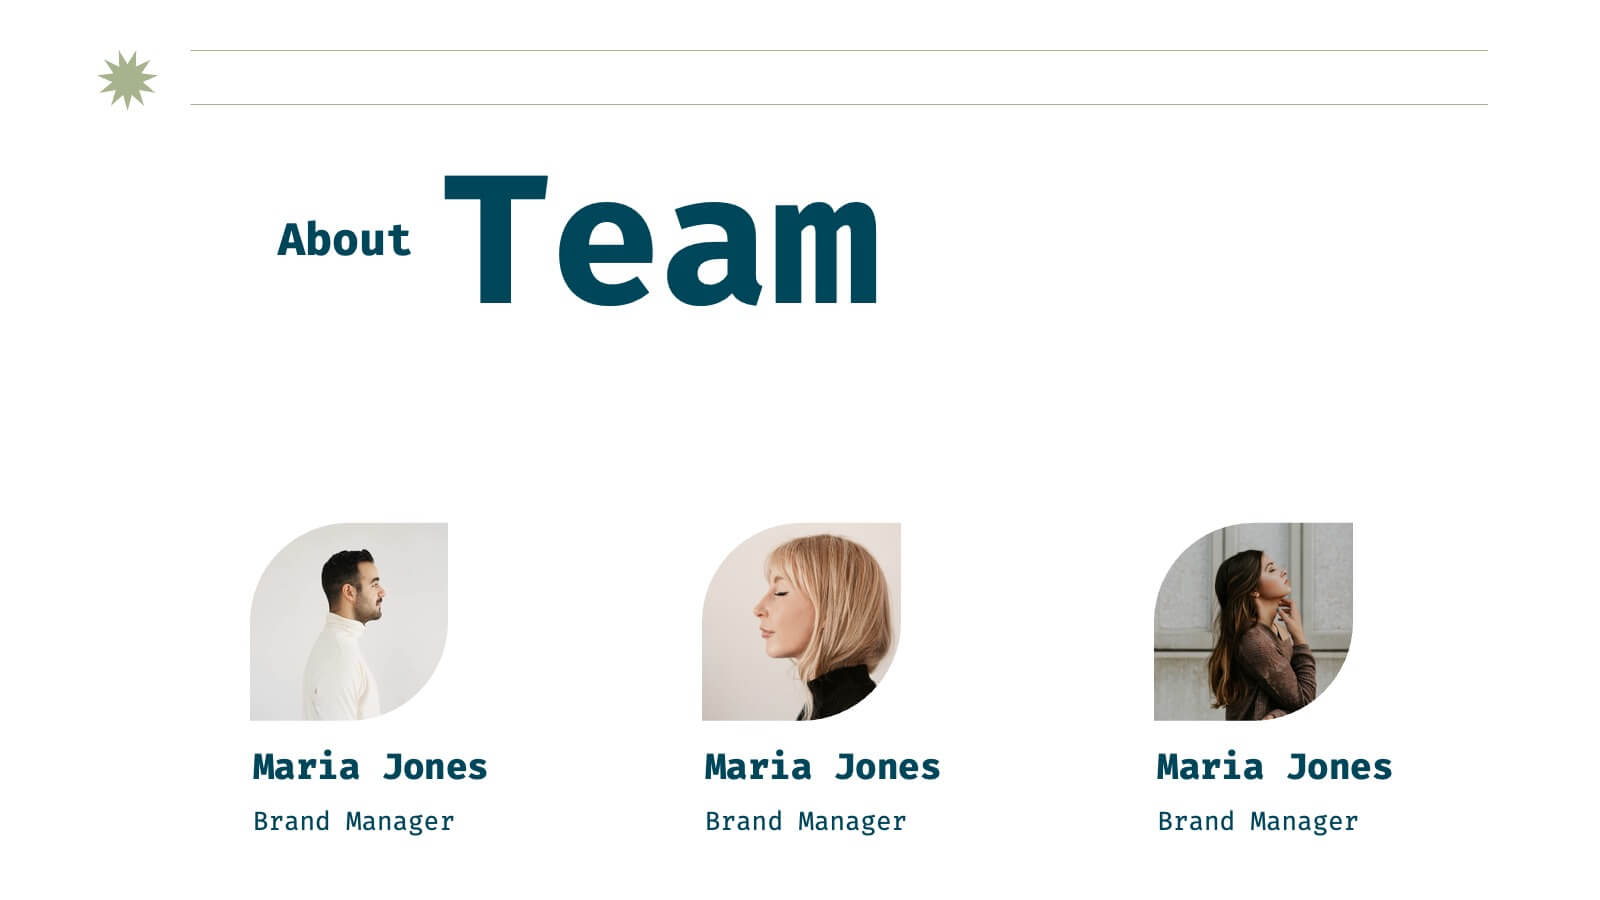
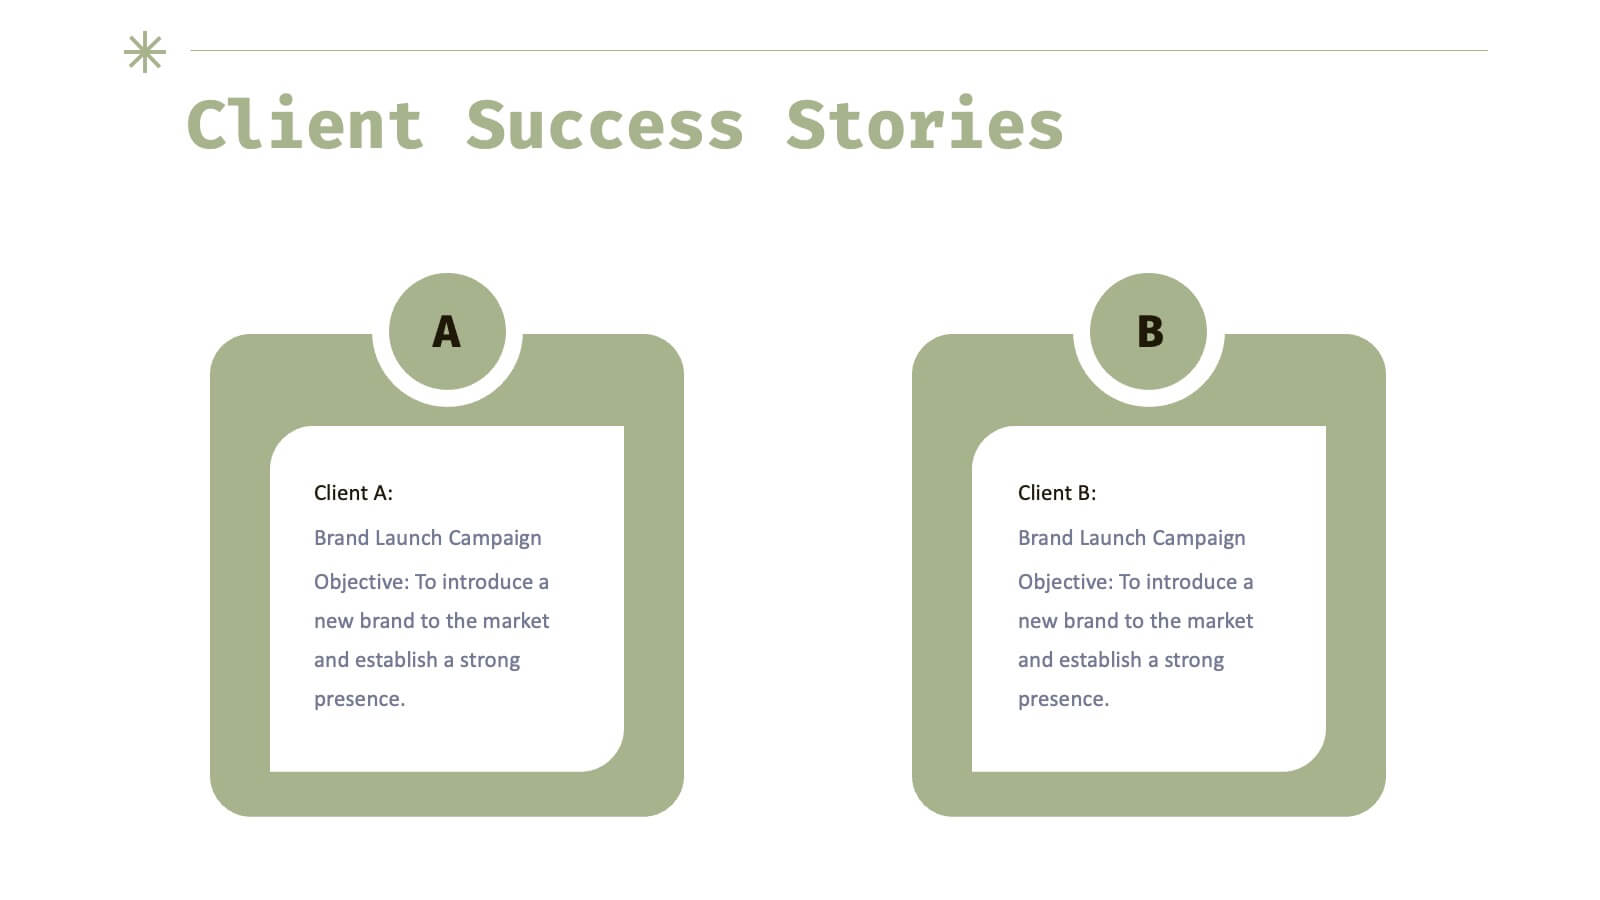
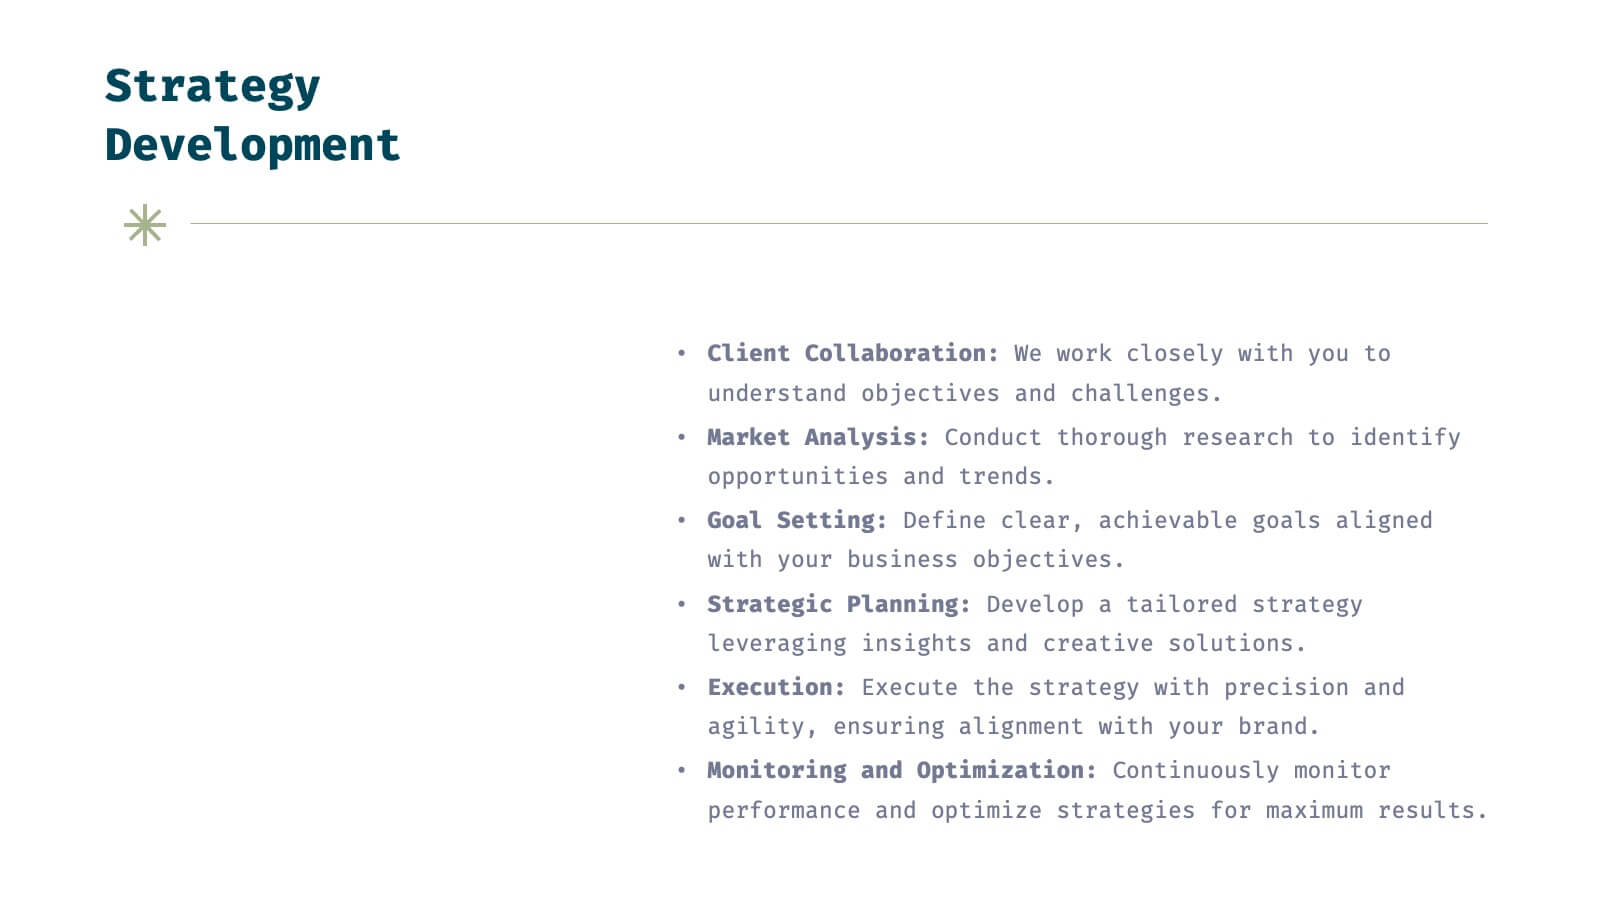
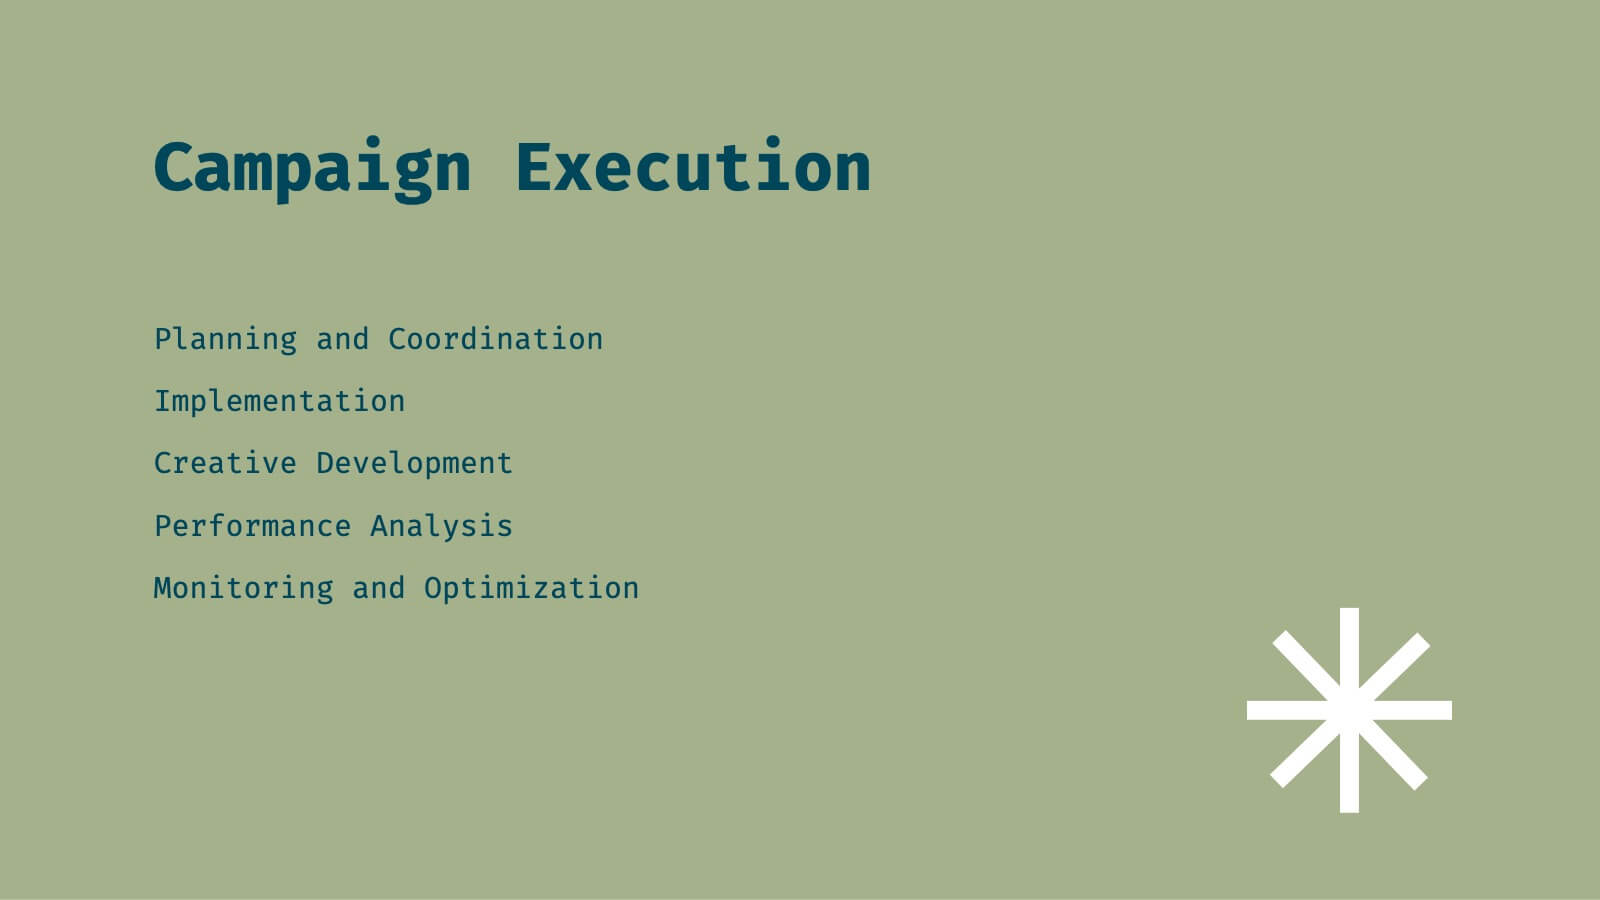
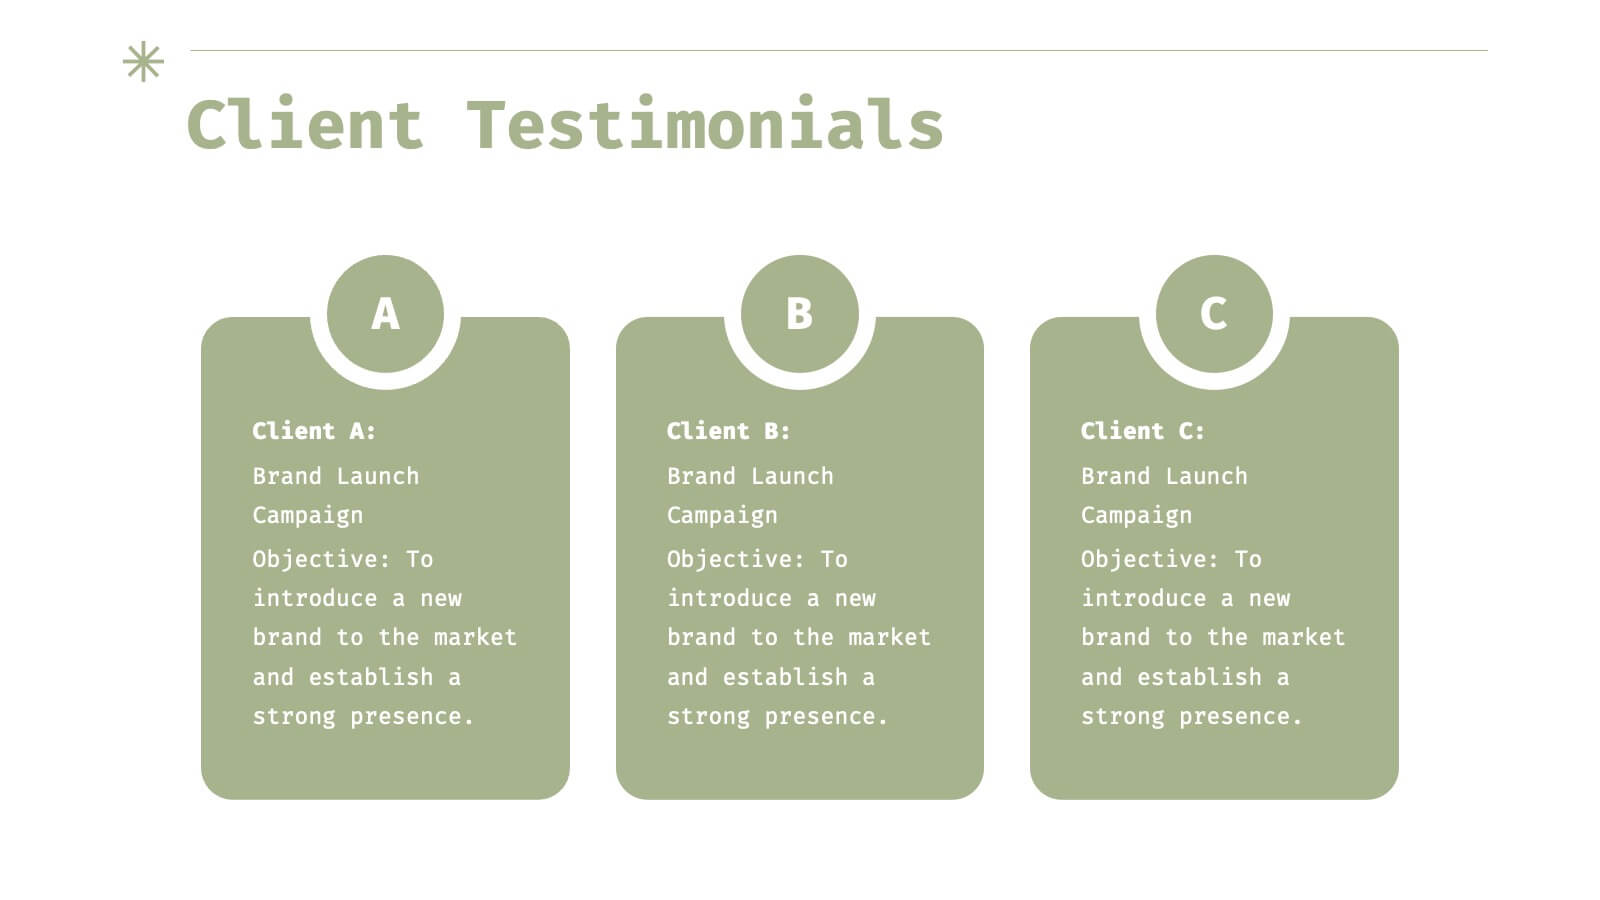
Helix Full-Service Agency Project Plan Presentation
Showcase your agency's expertise with this sophisticated, minimalistic presentation template. Designed to present comprehensive market analysis, strategy development, and client success stories, this template ensures your agency's capabilities are clearly communicated. Its clean design and professional layout make it perfect for building trust and credibility. Compatible with PowerPoint, Keynote, and Google Slides, it's versatile for any platform.


6 diapositivas
Detailed Case Analysis Report Presentation
Turn complex findings into a clear and engaging story with this modern, data-focused layout. Ideal for professionals presenting research, performance reviews, or audit results, it helps you organize insights with precision and clarity. Fully editable and compatible with PowerPoint, Keynote, and Google Slides for effortless customization and presentation delivery.


6 diapositivas
Creative Solutions for Business Challenges Presentation
Present your strategy with impact using the Creative Solutions for Business Challenges Presentation. Featuring a dynamic cloud and gear diagram, this layout helps illustrate interconnected solutions and innovative thinking. Ideal for brainstorming, strategic planning, and team problem-solving discussions. Fully editable in PowerPoint, Keynote, and Google Slides.


6 diapositivas
United States Coronavirus Map
A United States Coronavirus Map is a graphical representation that displays the spread of the coronavirus (COVID-19) across the United States. This infographic template may use different colors, shades, or symbols to indicate the severity of COVID-19 cases in different areas. Darker colors may represent higher case numbers, while lighter colors may represent lower case numbers. These maps are valuable tools to track the progression of the virus, identify hotspots, and make informed decisions related to public health. This can also help raise awareness about the importance of preventive measures and promote data-driven strategies to control the spread.


3 diapositivas
Business Ethics and Legal Guidelines Presentation
Navigate the complexities of corporate governance with the "Business Ethics and Legal Guidelines" template, designed to simplify and clarify the presentation of legal standards and ethical expectations in business environments.This visually engaging layout helps emphasize the progression and importance of each principle, ensuring clarity in communication. Ideal for training modules, compliance meetings, or strategic planning sessions, it's compatible with PowerPoint, Keynote, and Google Slides.


5 diapositivas
Meal Plan and Nutrition Guide Presentation
Simplify your nutrition strategy with the Meal Plan and Nutrition Guide Presentation. This visually engaging circular layout lets you outline five key nutrition pillars or daily meals with icons and editable titles. Ideal for dietitians, wellness coaches, or health brands. Compatible with PowerPoint, Canva, and Google Slides for seamless customization.


4 diapositivas
Colorful Workflow Process Chart Presentation
Bring your workflow to life with a vibrant, easy-to-follow layout that makes every stage feel connected and purposeful. This presentation helps you map processes, explain team roles, and simplify complex steps using a clean, visual flow. Fully compatible with PowerPoint, Keynote, and Google Slides.


7 diapositivas
Steps Process Infographic Presentation Template
A steps process is a way of breaking down a task or project into a series of smaller, manageable steps. This template is perfect for showing steps processes in a fun and easy-to-understand way. It's compatible with Powerpoint, Keynote, and Google Slides, so you can use it on any device. This template has attention-grabbing colors to make your presentation stand out. It is also customizable with step charts, so you can make your presentation look just the way you want. With this template, you can make learning fun and easy for your students, or make your business presentations look professional.


8 diapositivas
Market Expansion Strategies in North America Map Presentation
Visualize your market growth plans with this strategic North America map slide. Highlight four regional expansion points with vibrant markers and customizable labels. Perfect for showcasing entry strategies, regional goals, or sales plans. Fully editable in PowerPoint, Keynote, and Google Slides—ideal for professional business and marketing presentations.


25 diapositivas
Jasper Rebranding Project Plan Presentation
Elevate your brand transformation with this sleek rebranding presentation template! It covers everything from mission and values to market analysis and brand positioning. Perfect for showcasing your brand guidelines and touchpoints. Fully customizable, and compatible with PowerPoint, Keynote, and Google Slides, making your rebranding process seamless and professional.


7 diapositivas
North America Map Infographic Presentation Template
North America is a continent entirely within the Northern Hemisphere and almost all within the Western Hemisphere. It can also be considered a northern subcontinent of the Americas. North America is the third largest continent in the world, and home to some of the world's most iconic landmarks. This North America template is great for creating a simple and clean map. This easy-to-customize map includes icons in both light and dark color variations. This North America map template is great for presentations, reports and more. Add your data to create a professional presentation.


4 diapositivas
Investment Analysis Finance Presentation
Target your financial insights with this Investment Analysis Finance Presentation. Designed with a bold bullseye diagram and four labeled pointers, this slide helps communicate core focus areas, ROI, risk zones, or asset distribution. Ideal for pitch decks, portfolio reviews, and financial reports. Fully editable in PowerPoint, Keynote, and Google Slides—perfect for analysts, investors, and finance professionals.


6 diapositivas
Agile Project Management Infographic
Agile methodology is an iterative and collaborative approach to project management and software development. This infographic template outlines the key principles and practices of the Agile project management approach. This template is designed to help project managers, teams, and stakeholders understand and implement Agile methodologies for efficient and collaborative project delivery. This serves as a comprehensive guide to understanding and implementing Agile methodologies in project management. It presents the key principles, frameworks, practices, and benefits of Agile in a visually engaging and easy-to-understand format.


6 diapositivas
Mission and Values Overview Presentation
Your company's purpose deserves a visually stunning story! This infographic presentation template helps you clearly outline core values and mission statements with an engaging, structured design. Ideal for business strategy meetings, corporate presentations, and branding discussions, it keeps your content professional and impactful. Fully customizable and compatible with PowerPoint, Keynote, and Google Slides.


5 diapositivas
Feedback Assessment with Smile Ratings Presentation
Visually capture user sentiment with this Feedback Assessment with Smile Ratings slide. Featuring a curved layout with emoticons ranging from happy to unhappy, it’s ideal for showcasing satisfaction levels, survey results, or evaluation stages. Fully customizable in Canva, PowerPoint, or Google Slides—perfect for reports, workshops, or performance reviews.