


Características


¿Tienes alguna pregunta?
Recomendar


5 diapositivas
RAPID Decision-Making Roles Overview Presentation
Clarify accountability and streamline decisions with the RAPID Decision-Making Roles Overview Presentation. This visual layout breaks down the five essential roles—Recommend, Agree, Perform, Input, and Decide—into a clear quadrant diagram. Ideal for project teams, leadership alignment, or decision-making workshops. Fully editable in PowerPoint, Google Slides, Keynote, and Canva.


6 diapositivas
Employee Feedback Survey Results Presentation
Showcase Employee Feedback Survey Results with a data-driven and professional layout designed for clear visualization and analysis. This PowerPoint, Keynote, and Google Slides-compatible template features stacked bar charts for easy trend comparison, helping you present workplace insights effectively. Fully customizable with editable text, colors, and labels, this template ensures a seamless and engaging presentation of employee feedback metrics.


7 diapositivas
Loves Travel Infographic Presentation
Travel is an opportunity to get out of our comfort zones and be inspired to try new things, it changes our perspective on the world. Use this template to give your audience an overview of a trip and prepare them for what they will be experiencing. This template features an infographic style design, with plenty of room to describe the locations and activities as well as instructions and tips. Build your own infographic with this template, and add it to your presentations. You can easily add your own content in PowerPoint, Keynote, or Google slides and turn it into a fun presentation in minutes.


4 diapositivas
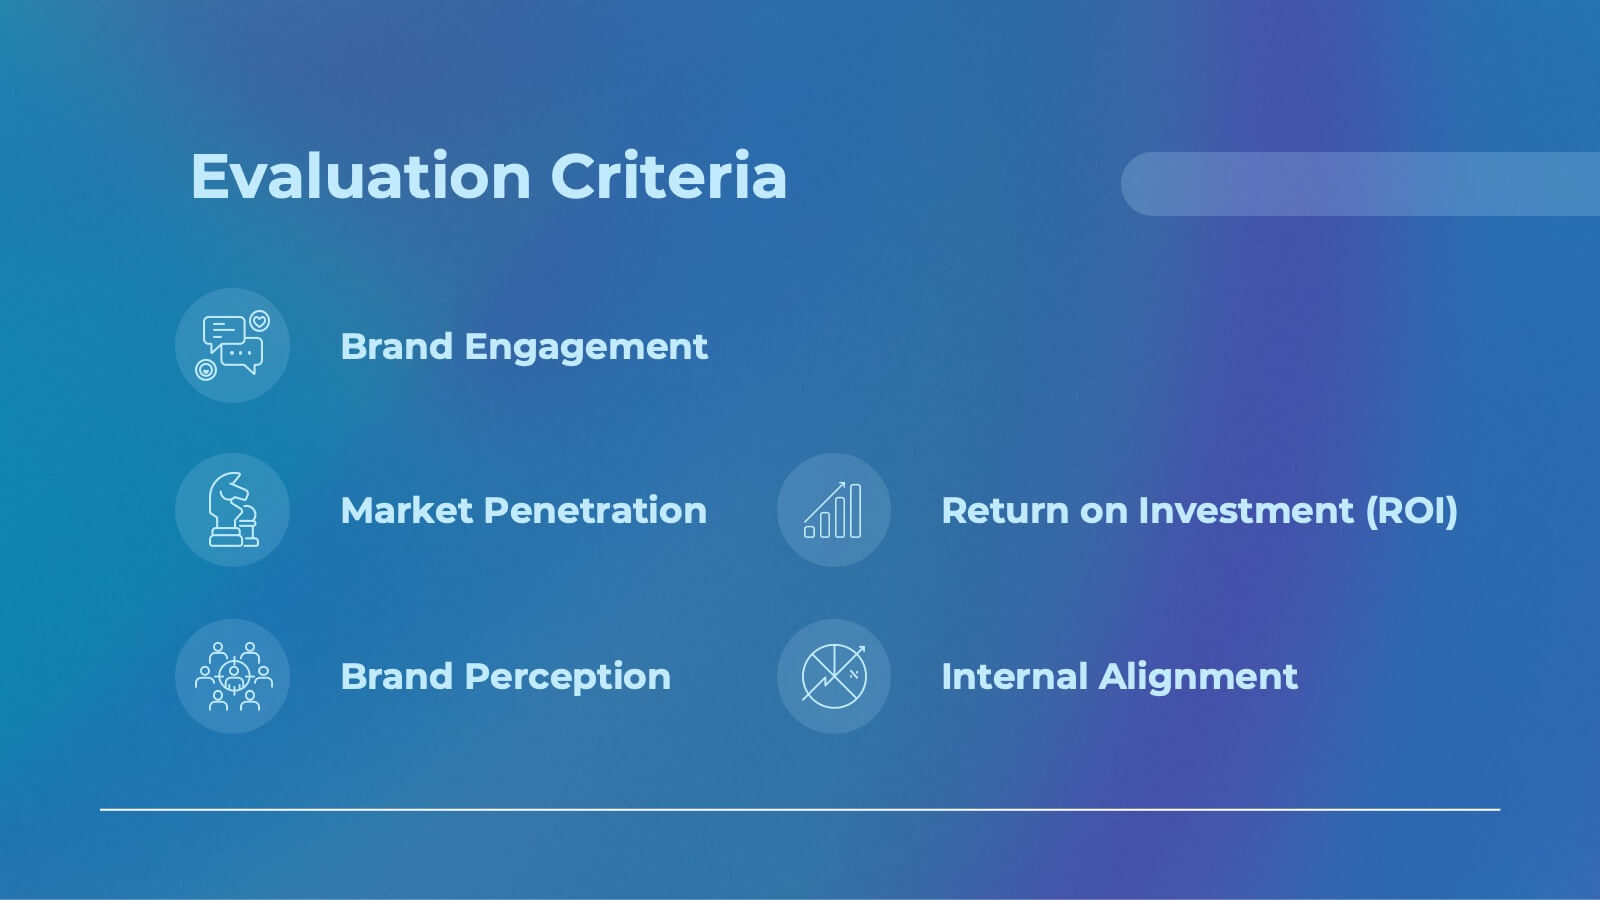
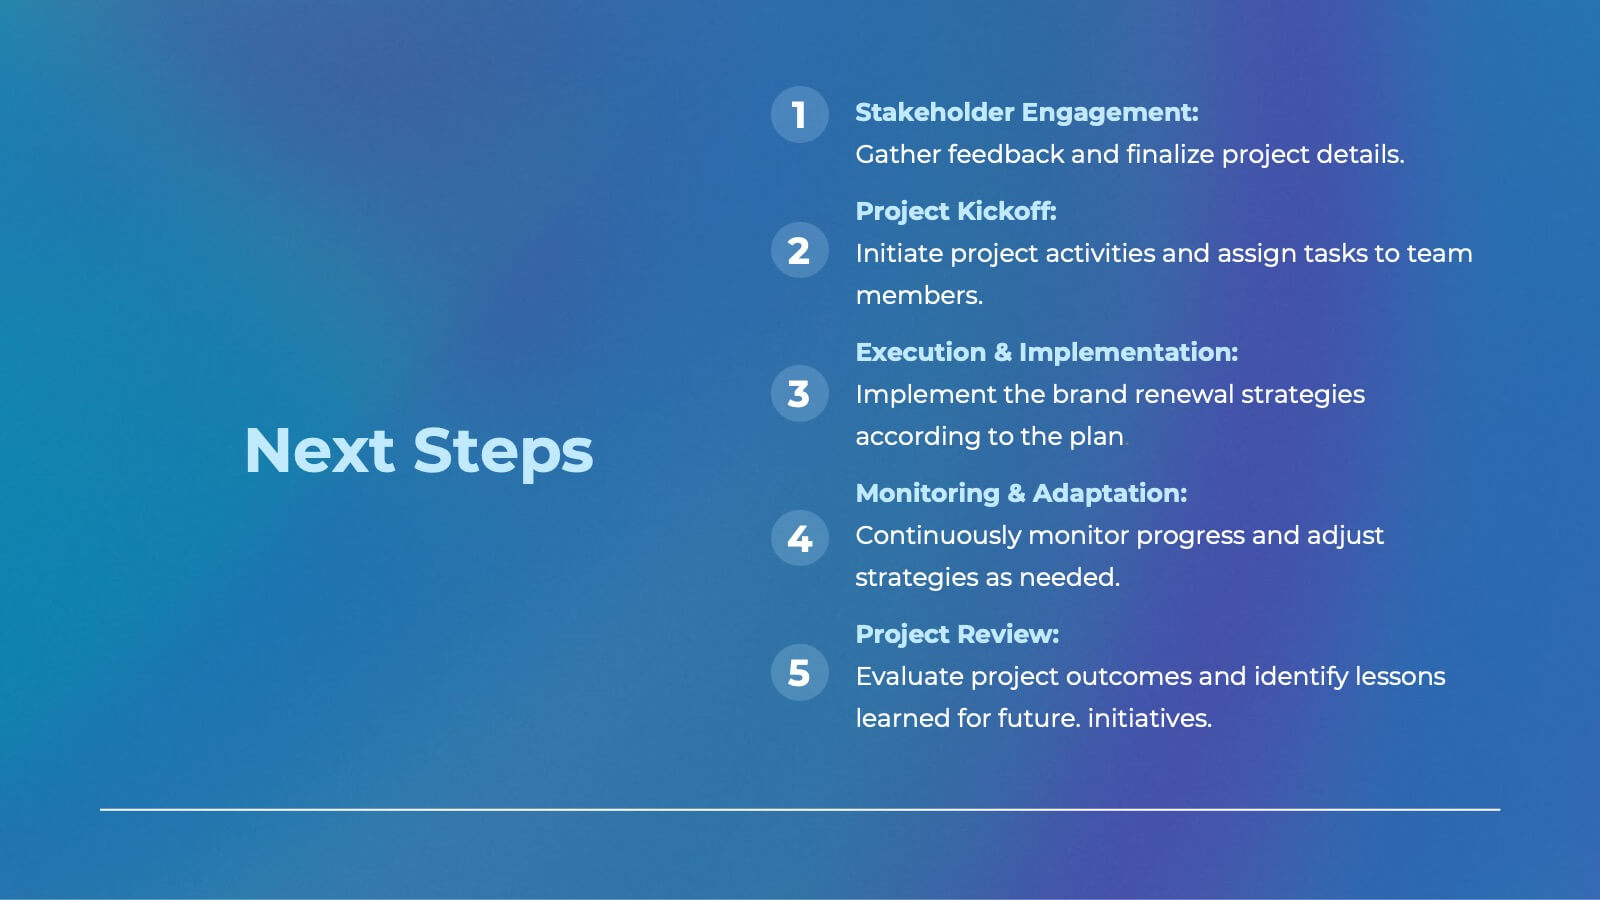
Action Plan and Next Phase Outline Presentation
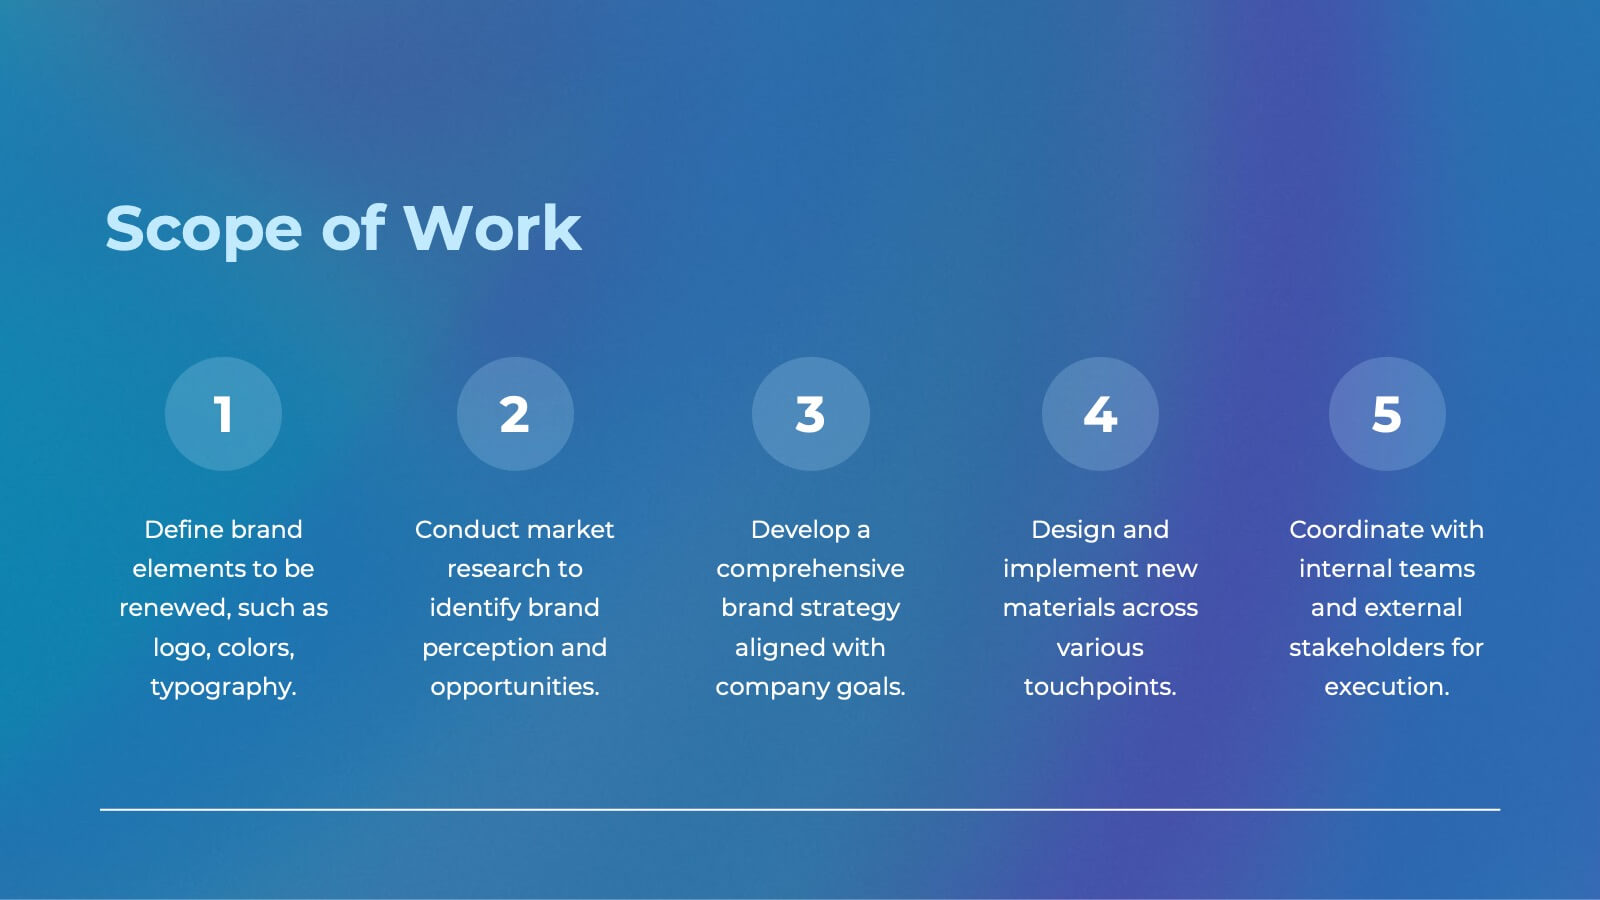
Stay organized and move forward with confidence using the Action Plan and Next Phase Outline Presentation. This slide features a clear four-step vertical roadmap with alternating color-coded blocks and icons, perfect for project milestones, implementation steps, or strategic priorities. Easily editable in PowerPoint, Keynote, and Google Slides.


21 diapositivas
Ember Agile Project Plan Presentation
Ready to ace your next project proposal? This sleek presentation template is perfect for outlining objectives, timelines, and budgets. Designed for professionals aiming to impress stakeholders and secure approvals. Compatible with PowerPoint, Keynote, and Google Slides, it ensures a smooth and professional presentation every time. Ideal for project managers and business leaders.


6 diapositivas
Financial Report and Charts Presentation
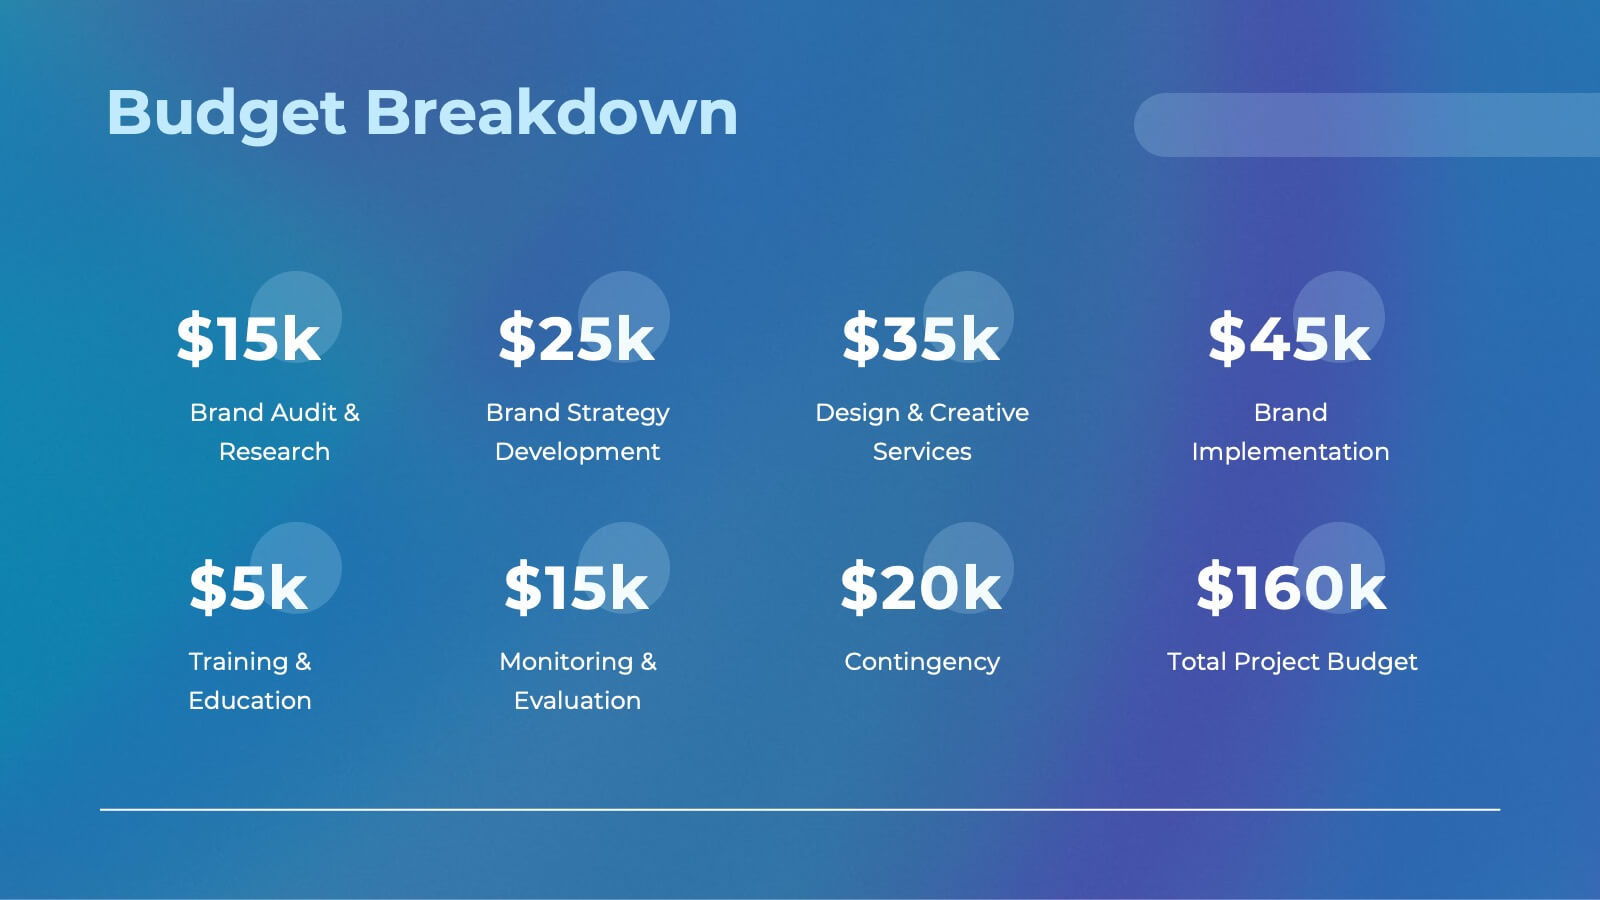
Deliver financial insights with impact using this Financial Report and Charts Presentation Template. Featuring a clean layout with a money bag visual and percentage breakdowns, it’s perfect for showcasing profit distribution, investment categories, or budget summaries. Fully customizable in PowerPoint, Keynote, and Google Slides.


7 diapositivas
Data Analysis Infographics Presentation Template
Data Analysis is a process used to turn raw data into information useful for decision making by users. Data that has been collected, is analyzed to answer questions, or disprove theories. Analyses include tasks such as statistical modeling and hypothesis testing. This template can be used to collect data via surveys or experiments. It is a great tool for those conducting research and analyzing data. This template allows you to create an efficient and organized data collection process using multiple methods of data collection. Graphs and statistics are available to help visualize your data.


7 diapositivas
Business Networking Strategy Presentation
Build strong business connections with this Business Networking Strategy template. Featuring a circular segmented diagram, this slide helps illustrate key networking approaches, strategic partnerships, and relationship-building techniques in an easy-to-understand format. Ideal for entrepreneurs, business developers, and corporate leaders, this fully editable slide is compatible with PowerPoint, Keynote, and Google Slides.


5 diapositivas
Risk Analysis Bowtie Diagram Presentation
Visualize threats, controls, and consequences effectively with the Risk Analysis Bowtie Diagram Presentation. This dynamic template illustrates cause-and-effect relationships using a bowtie structure, making it ideal for safety audits, project risk planning, or corporate strategy. Fully customizable in PowerPoint, Keynote, and Google Slides for any industry.


22 diapositivas
Jade Graphic Design Project Plan Presentation
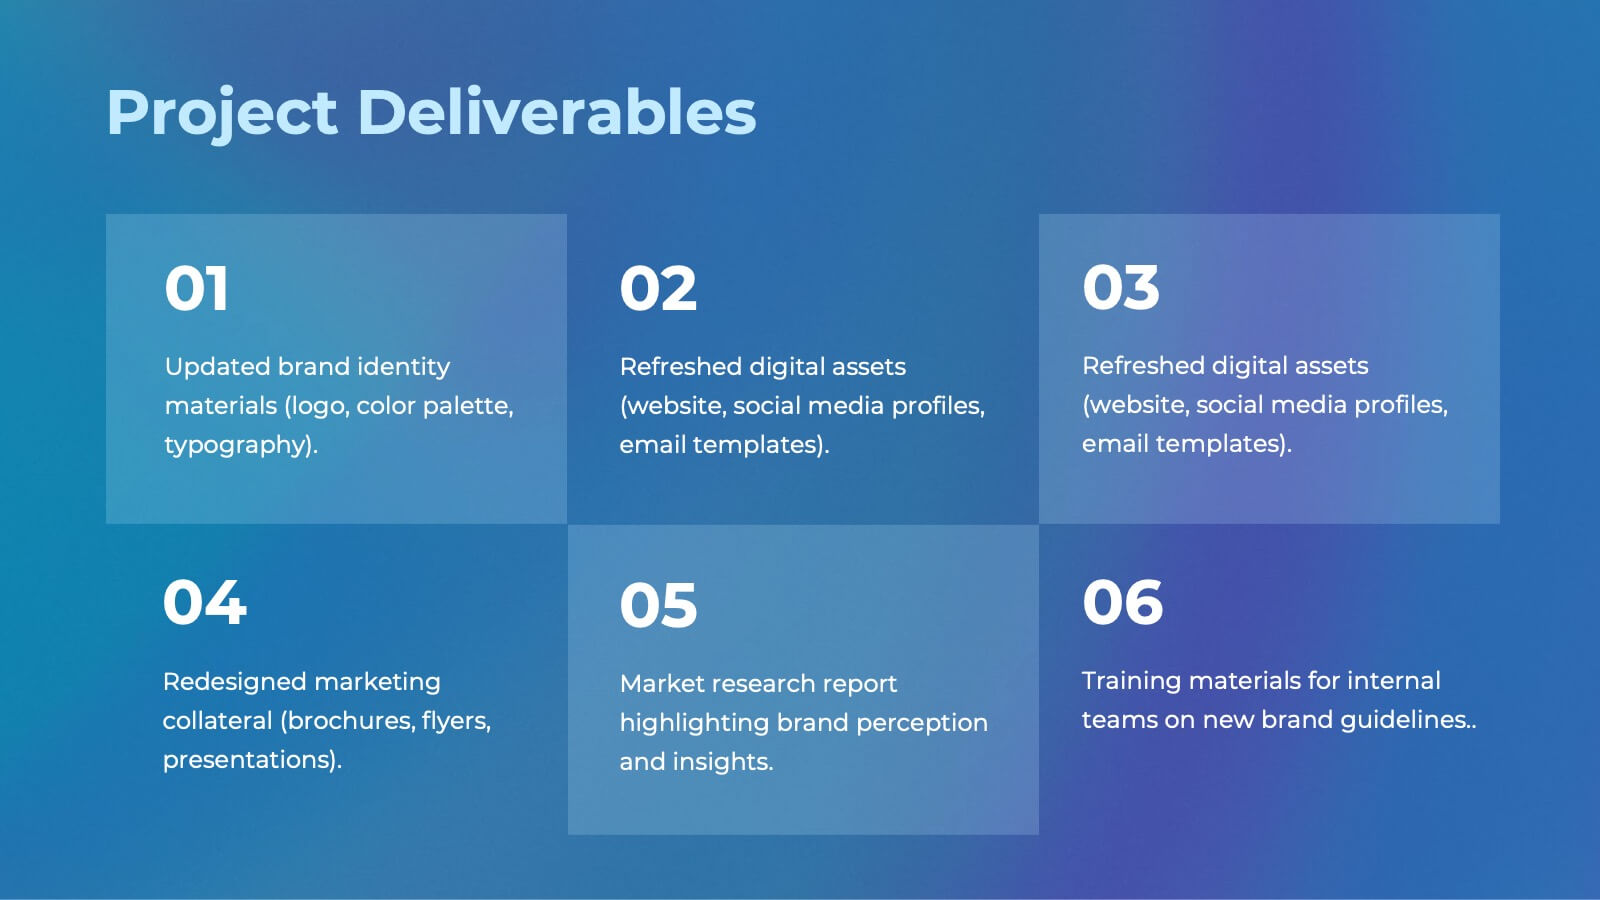
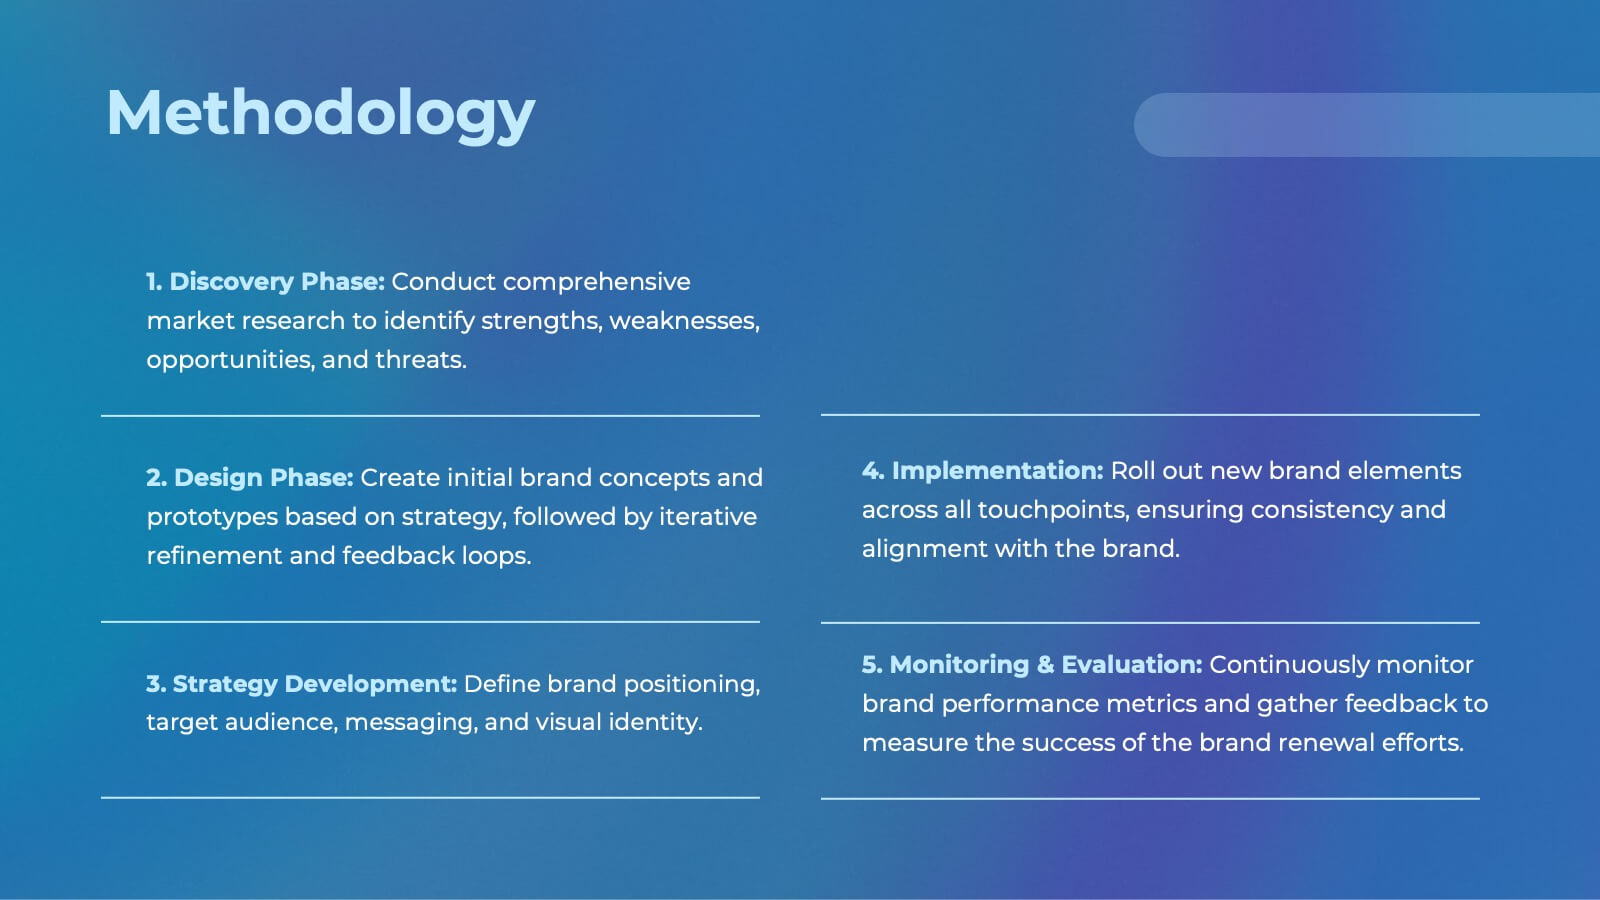
Unleash creativity with this vibrant Graphic Design Project template! Perfect for showcasing your design process, prototypes, and assets, it keeps the audience captivated with clean visuals and a fresh, modern look. Whether you're outlining color palettes or final designs, every slide exudes style. Ideal for PowerPoint, Keynote, and Google Slides!


6 diapositivas
SCAR Process Model Presentation
The "SCAR Process Model" presentation template provides a clear visualization of the SCAR (Supplier, Corrective, Action, Request) model, designed to help professionals manage and enhance supplier relationships effectively. Each quadrant of the template is dedicated to one of the SCAR components, neatly arranged around a central hub, symbolizing the interconnected nature of these processes. The circular layout facilitates the understanding of how each component influences the others, leading to a more streamlined approach in handling supplier interactions and corrective actions. This template is perfect for presentations in supply chain management, operational reviews, and strategic planning meetings, offering a practical framework for discussing and planning effective supply chain strategies.


5 diapositivas
Business Decision-Making Questions
Streamline critical thinking with this interactive Business Decision-Making Questions template. Featuring a creative circular diagram and visual cues, it helps structure questions around options, evaluations, and outcomes. Ideal for brainstorming, strategic planning, and executive decision sessions. Fully editable in PowerPoint, Keynote, and Google Slides.


7 diapositivas
Simple Schedule Infographic
Effortlessly structure your time with our simple schedule infographic. Rendered in a clean white canvas, enhanced with dependable blue tones and anchored with timeless black, our template is the epitome of clarity and organization. Equipped with streamlined infographics, universal icons, and adaptable image placeholders, it facilitates easy time management and daily planning. Seamlessly tailored for Powerpoint, Keynote, or Google Slides. A fundamental tool for project managers, event planners, educators, or any professional aiming to efficiently allocate their time. Plan with ease; let every slide bring order to your daily chaos.


21 diapositivas
Mistrain Marketing Research Report Presentation
Present complex marketing research data with a visually engaging and structured template. This presentation design simplifies the process of showcasing company history, market presence, target audience insights, and competitive landscape analysis. With sections for financial highlights, growth plans, and client testimonials, it supports a comprehensive storytelling approach. Featuring clean layouts and aesthetic visuals, this template is ideal for presenting research findings, marketing plans, or audience insights to stakeholders. Fully customizable and compatible with PowerPoint, Google Slides, and Keynote, it ensures a seamless and professional presentation experience. Perfect for businesses, agencies, and professionals aiming to make impactful impressions.


26 diapositivas
Wilten Presentation Template
This template is a design foundation, and has been built with modern esthetic principles. The shapes are organic and earthy, with image place holders to allow customization. Designed for companies that have a strong connection to nature and the aesthetic, who wants to go beyond just being organic. Wilten template allows you to save time while getting the best result possible. A great clean modern template for creative agencies, business or branding deck. Enhance your presentations with this minimalistic design and impress your audience with smart ideas.


6 diapositivas
Leadership Program Infographic
A leadership program is a structured and intentional learning experience designed to develop and enhance leadership skills and qualities in individuals. This infographic template aims to provide a concise overview of the program's objectives, target audience, curriculum, and expected outcomes. This template includes icons, graphics, and color schemes that align with the organization's branding and make the infographic visually appealing. This infographic serves as an effective marketing tool to attract potential participants, showcase the value of the program, and communicate the positive outcomes of joining the leadership development journey.


5 diapositivas
African Continent Map Slide Presentation
Visualize your data across Africa with a modern, easy-to-read map design that highlights regional trends and insights. Perfect for showcasing demographics, market distribution, or project reach, this template combines clarity and impact. Fully compatible with PowerPoint, Keynote, and Google Slides for smooth customization and presentation flexibility.