


Características


¿Tienes alguna pregunta?
Recomendar


7 diapositivas
Science Research Infographic
Science research, is a systematic and organized inquiry that aims to generate new knowledge, validate existing knowledge, or solve specific problems using scientific methods and principles. This infographic template aims to present your science research initiatives, achievements, and vision to the audience in an engaging and informative way. This is essential to convey complex scientific data and discoveries in a visually appealing manner. Fully customizable and compatible with Powerpoint, Keynote, and Google Slides. Adapt and personalize the content to align with your specific research center's focus and mission.


6 diapositivas
Performance Evaluation Infographic
Performance evaluation is a process used by organizations to assess and measure the performance of employees, teams, departments, or the overall organization. This infographic template aims to evaluate how well individuals and groups are meeting their goals and objectives, and involves the use of metrics to quantify performance. This template is designed to provide an overview of the employee's strengths, areas for improvement, and overall performance rating. This infographic is perfect for managers, HR professionals, and organizations for performance reviews to communicate feedback and progress to employees.


24 diapositivas
Fictara UX Research Report Presentation
Present your UX research findings effectively with this modern and professional template. Covering essential topics such as user personas, wireframes, usability guidelines, and feedback iteration, it’s designed to showcase insights clearly. Fully editable and compatible with PowerPoint, Keynote, and Google Slides.


5 diapositivas
Target Audience Analysis Slide Presentation
Discover who your audience truly is with this clear and visually balanced layout designed to simplify audience insights. Perfect for marketing plans, presentations, and strategy reports, it helps you visualize key demographics and behaviors effortlessly. Fully customizable and compatible with PowerPoint, Keynote, and Google Slides for easy editing.


4 diapositivas
Sales Funnel Journey Mapping Presentation
Visualize your customer conversion process with the Sales Funnel Journey Mapping Presentation. This slide helps you break down key touchpoints from awareness to decision, ideal for marketing strategies, lead analysis, or CRM reporting. Fully editable in PowerPoint, Canva, and Google Slides for easy customization.


7 diapositivas
Pillar Distribution Infographic
Discover a striking visual representation of data with the pillar distribution Infographic. Bathed in shades of blue, white, and green, this template masterfully showcases the core foundations of any topic in a 'pillar' format. Specifically tailored for business analysts, educators, and marketers, the infographic aids in simplifying dense information. With its crisp graphics, bespoke icons, and dedicated image placeholders, conveying your insights becomes an engaging narrative experience. Its versatility ensures smooth integration with PowerPoint, Keynote, and Google Slides, transforming any presentation into a captivating visual story.


6 diapositivas
Employee Change Management Strategy Presentation
Communicate change with clarity using this structured, gear-themed presentation slide. Designed to visualize six strategic stages of employee transition, it's ideal for HR professionals, team leaders, and consultants managing organizational change. Each step is represented with a numbered circle and aligned text for easy guidance. Fully customizable in PowerPoint, Keynote, and Google Slides.


6 diapositivas
Business Strategy Pyramid Presentation
Outline your strategic priorities with clarity using the Business Strategy Pyramid Presentation. This template features a five-step 3D pyramid that highlights key business goals, initiatives, or stages. Each layer includes icons and numbered sections for easy interpretation. Ideal for strategy meetings, executive briefings, and growth plans. Fully editable in PowerPoint, Keynote, and Google Slides.


21 diapositivas
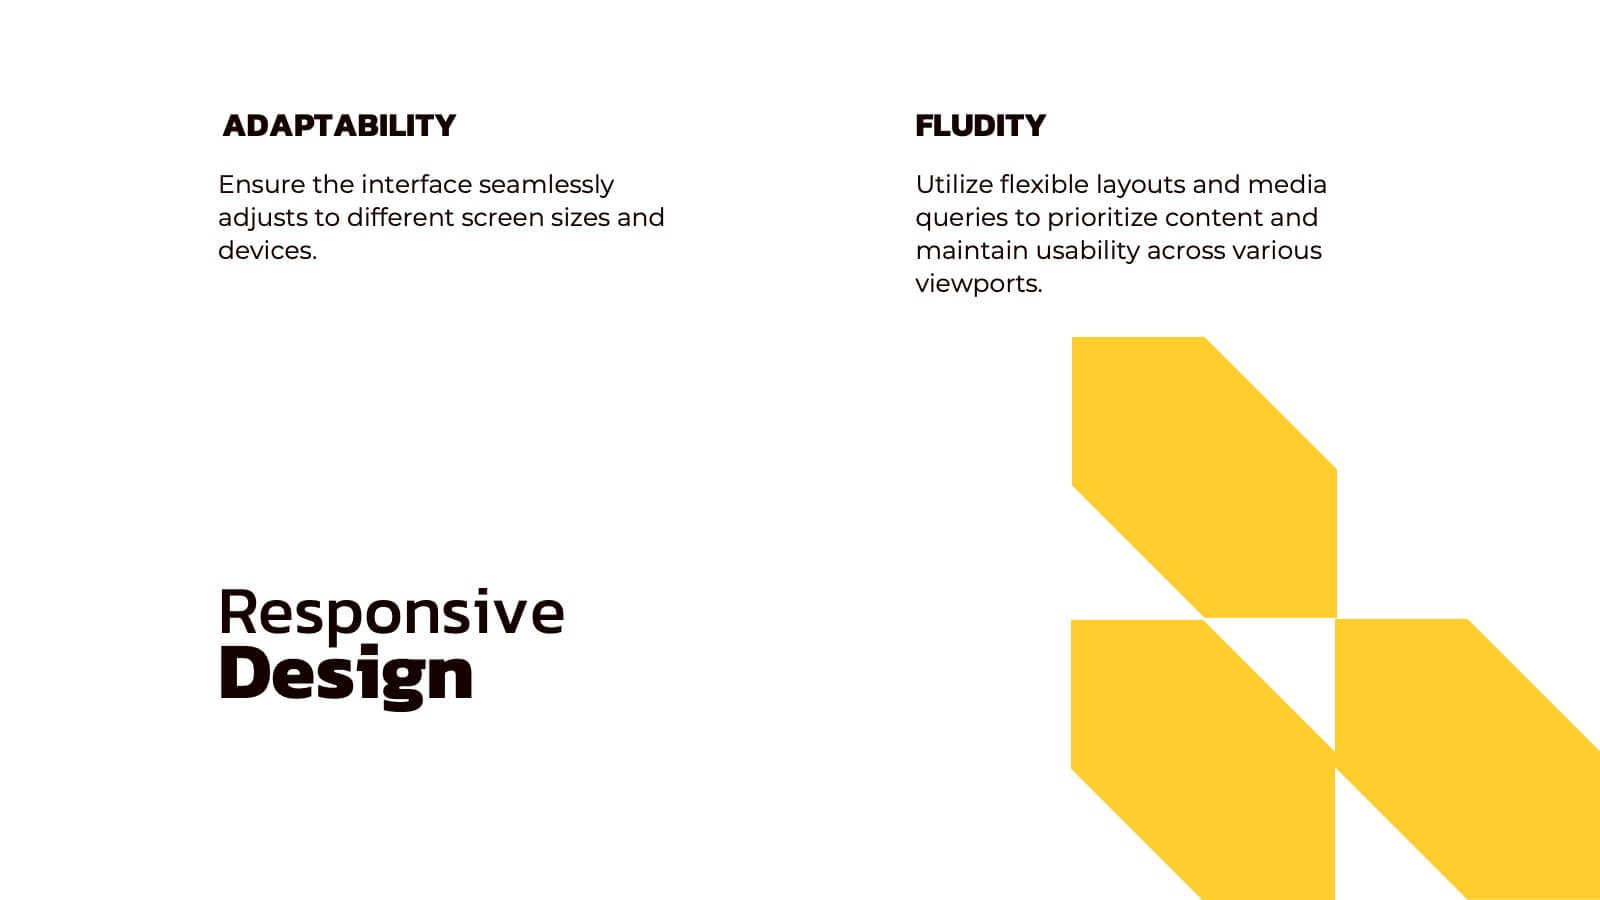
Crystalhearth UX Design Presentation
This professional template simplifies UX/UI design presentations, covering user research, personas, journey mapping, wireframes, and usability guidelines. Showcase visual elements, branding, accessibility, and responsive design. Ideal for illustrating the iterative process, testing insights, and project showcases. Fully customizable and compatible with PowerPoint, Keynote, and Google Slides.


6 diapositivas
Create Challenge Infographic
Challenges are obstacles, difficulties, or problems that individuals, organizations, or societies face while trying to achieve their goals or navigate through various situations. This infographic template involves visually presenting a specific challenge, its context, and possible solutions in an informative way. Summarize the key takeaways from the infographic, emphasizing the importance of addressing the challenge and implementing the suggested solutions. An effective challenge infographic can be used for educational purposes, presentations, or as a reference guide to help individuals and teams overcome challenges in a structured and informed manner.


5 diapositivas
Social Media Strategy Infographic
Social Media refers to digital platforms and websites that allow users to create and share content, engage with others, and participate in online communities. This presentation template is a powerful tool to help you create a comprehensive social media strategy. It provides a visually appealing and easy-to-understand overview of the key elements of a successful social media strategy. Use this template to plan and communicate your social media strategy effectively, ensuring that you make the most of your social media presence and engage your target audience efficiently. This template is compatible with Powerpoint, Keynote, and Google Slides.


6 diapositivas
Six Sigma Process Infographic
Dive into the world of process improvement with our six sigma process infographic. Crafted with a harmonious blend of blue, yellow, and white, this infographic elucidates the principles of Six Sigma methodology in an engaging manner. Ideal for business analysts, quality assurance teams, and corporate trainers, it delineates the DMAIC process in vivid detail. The design encapsulates the rigorous methodology of Six Sigma, providing clarity and fostering knowledge retention. This versatile template is a perfect fit for PowerPoint, Keynote, and Google Slides, making your presentations both captivating and insightful.


10 diapositivas
Brand Loyalty and Customer Retention Presentation
Strengthen your brand’s relationship with your audience using the "Brand Loyalty and Customer Retention" presentation template. This design effectively illustrates how strong branding strategies enhance customer loyalty and retention rates. Ideal for marketers and business strategists, this template is fully compatible with PowerPoint, Keynote, and Google Slides, making it perfect for presentations aimed at improving customer engagement and business growth.


20 diapositivas
Wyrmwood Design Proposal Presentation
The Startup Funding Proposal Presentation Template includes 20 sleek and professional slides covering problem statements, solutions, pricing structures, and team expertise. With its modern black-and-white aesthetic, it ensures clarity and impact. Fully editable and compatible with PowerPoint, Keynote, and Google Slides, it's perfect for startups seeking investment opportunities and partnerships.


6 diapositivas
Growth Through Lifelong Learning Presentation
Visualize personal or organizational development with this creative lifelong learning slide. Featuring a human head silhouette and puzzle piece graphics, it's perfect for illustrating stages of learning, training programs, or growth mindset principles. Fully editable in PowerPoint, Keynote, and Google Slides—ideal for educators, coaches, or corporate development professionals.


10 diapositivas
Hospital Services Overview Presentation
Bring your healthcare message to life with a clean, modern layout that makes complex hospital services easy to understand. This presentation helps you outline key departments, care processes, and essential service details with clarity and confidence. Designed for smooth communication in medical settings, it works seamlessly in PowerPoint, Keynote, and Google Slides.


20 diapositivas
Kirin Artist Portfolio Template Presentation
Showcase your creative work with style and flair using this sleek portfolio presentation! It covers key sections like featured projects, creative process, collaborations, and client testimonials, ensuring your expertise is communicated effectively. Ideal for freelancers, designers, or agencies, this template is fully compatible with PowerPoint, Keynote, and Google Slides.