


Características


¿Tienes alguna pregunta?
Recomendar


7 diapositivas
Ecology Restoration Infographic
Dive into the world of eco-conscious solutions with our ecology restoration infographic. Adorned in soothing shades of white and fresh green, this template captures the essence of nature's rejuvenation. Compatible with Powerpoint, Keynote, and Google Slides, it boasts meticulously crafted graphics, intuitive icons, and user-friendly image placeholders, all tailored to emphasize the urgency and methods of restoring our planet's ecological balance. Ideal for environmentalists, educators, NGOs, or anyone aiming to spread awareness about our planet's well-being.


4 diapositivas
Communication Model and Channels Presentation
Illustrate how your messages move through various channels using this clean, visual communication model slide. Ideal for team briefings, marketing workflows, or internal training, it simplifies how information is shared across platforms. Fully editable in Canva, PowerPoint, and Google Slides for seamless customization to match your branding and messaging goals.


8 diapositivas
Alphabet List Infographics
Discover the power of alphabet lists, a versatile tool for structured information presentation. This infographic is your guide to understanding alphabet lists, from the basics to the benefits of alphabetical order. Master the art of creating organized and readable content. Learn why arranging information alphabetically is advantageous. Explore its logical sequence that simplifies referencing and comprehension. Unlock the potential of alphabetical order in various contexts, improving content organization for easy access and digestion. Master the use of alphabet lists to boost content readability. Discover techniques such as subheadings and concise descriptions. With this infographic, compatible with PowerPoint, Keynote, and Google Slides, sharing your knowledge of alphabet lists is effortless. Dive into the world of alphabet lists and improve your communication and content organization skills.


5 diapositivas
Pillar-Based Marketing Strategy Presentation
Visualize the foundations of your marketing efforts with our Pillar-Based Marketing Strategy presentation template. This layout helps you define and discuss the critical elements that uphold your marketing campaigns, ensuring clear communication of strategies to your team or stakeholders.


6 diapositivas
Above and Below Surface Iceberg Strategy
Reveal both the visible and hidden layers of your business approach with the Above and Below Surface Iceberg Strategy Presentation. Ideal for leadership meetings, transformation plans, or behavioral analysis, this diagram helps clarify surface-level actions vs. deeper root drivers. Compatible with PowerPoint, Keynote, and Google Slides for easy customization.


5 diapositivas
USA Economic Map Infographic
Navigate the complexities of the American economy with our USA economic map infographic. Crafted in shades of blue and diverse colors, this creative, vertical infographic is a boon for economists, researchers, and educators. It's designed to dissect financial data across states, highlighting economic indicators vividly. From GDP growth, employment rates to industry-specific insights, make economic trends accessible. This template, beneficial for anyone addressing economic audiences, features intuitive graphics, state icons, and designated areas for relevant imagery, ensuring each economic facet is visually compelling and information-rich.


21 diapositivas
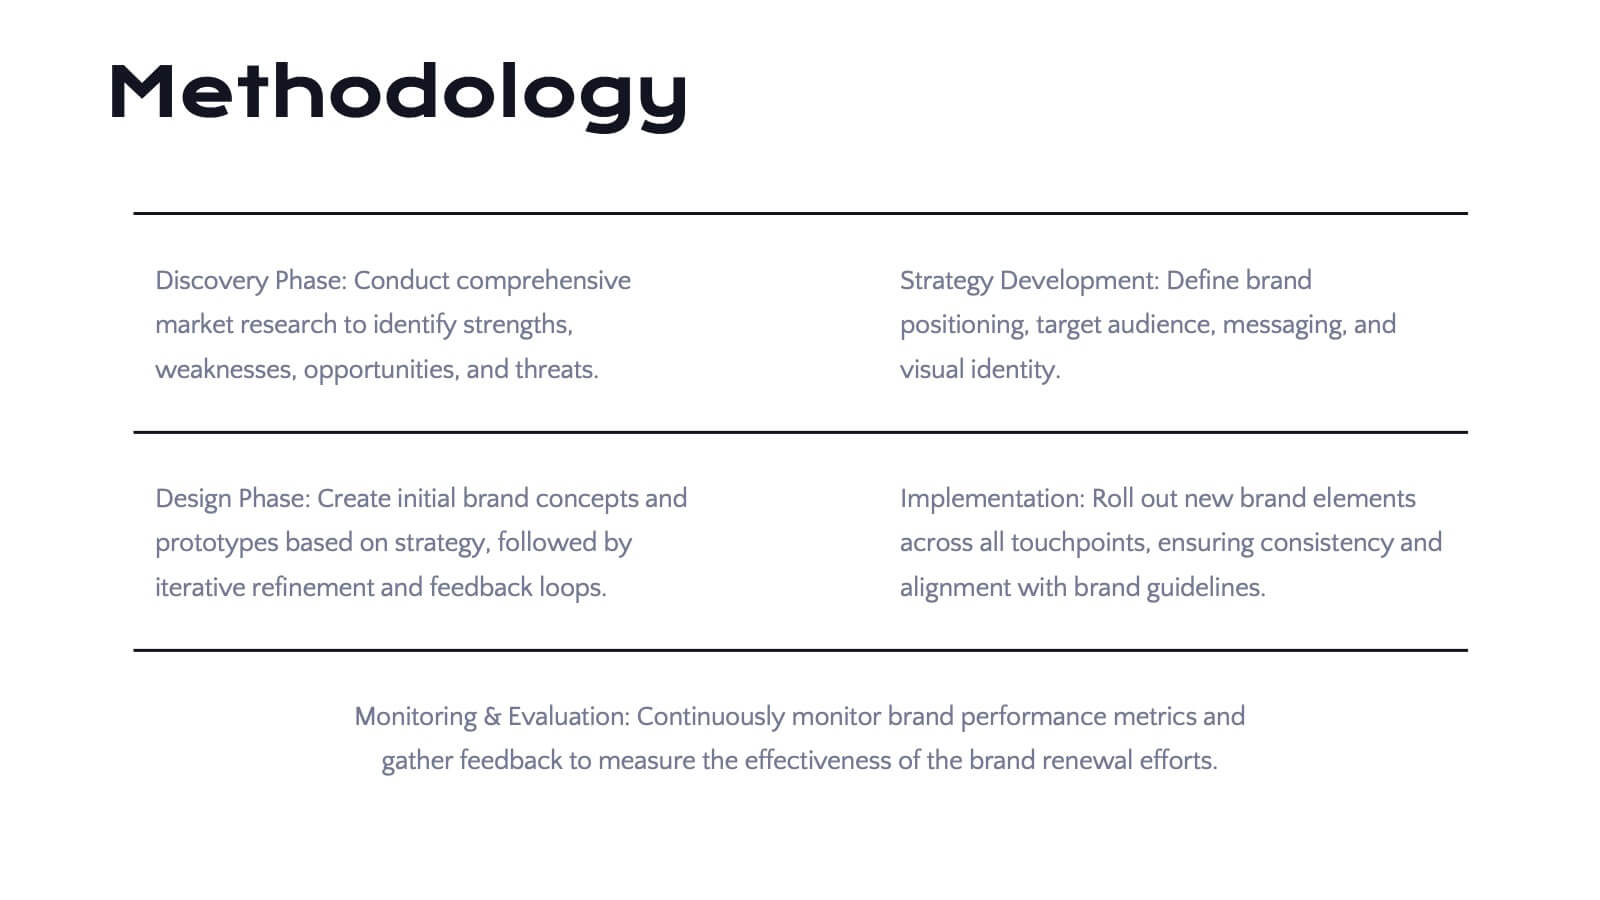
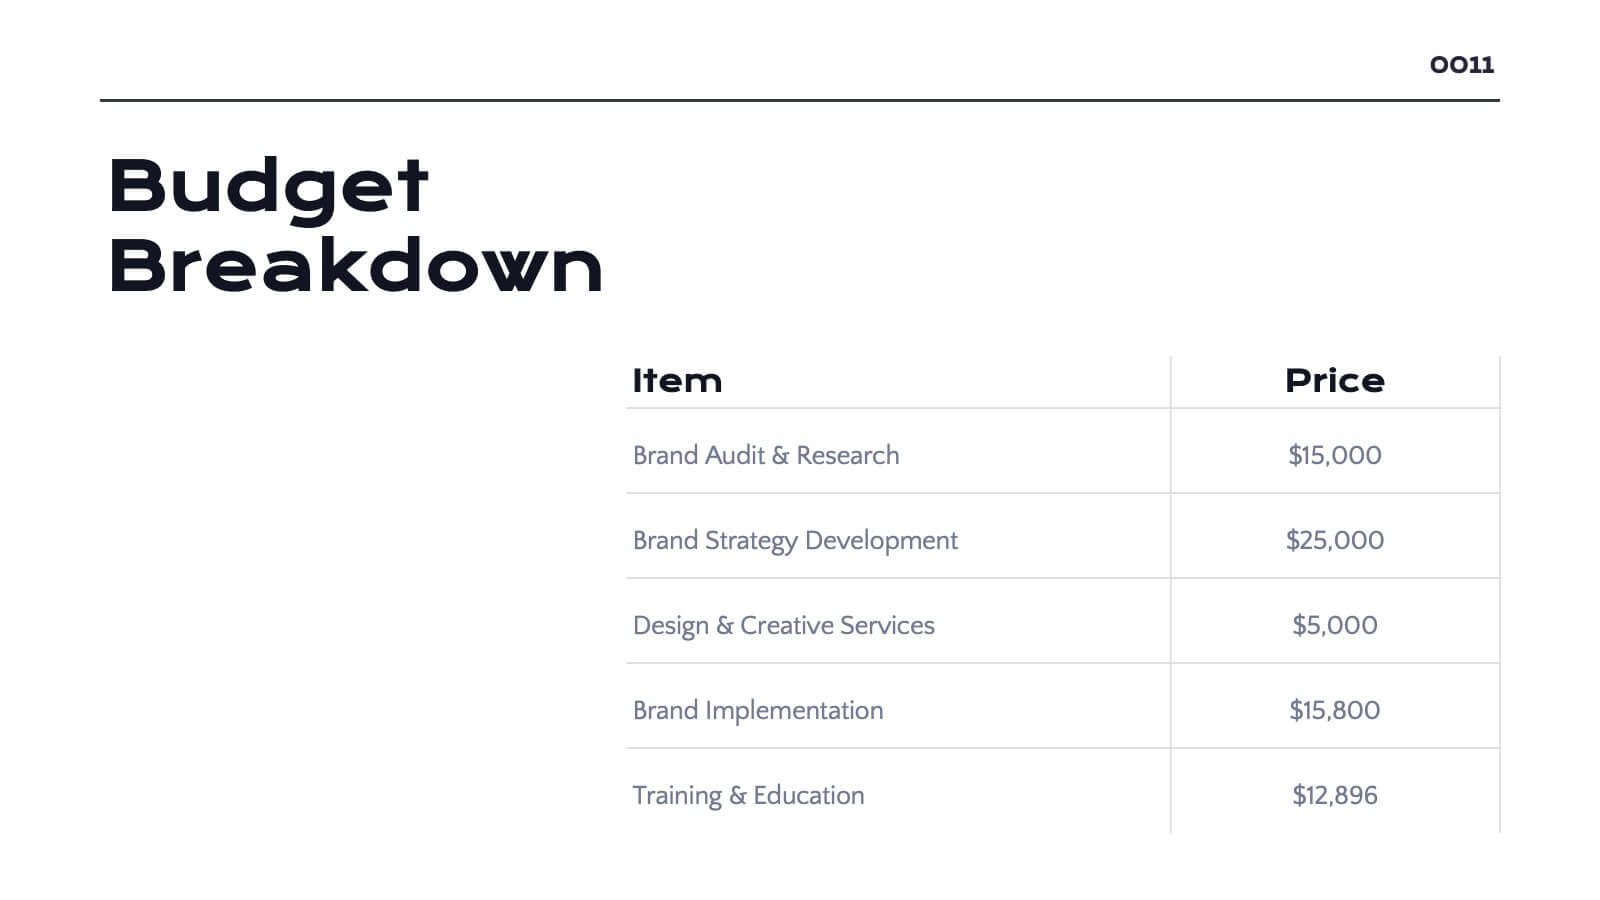
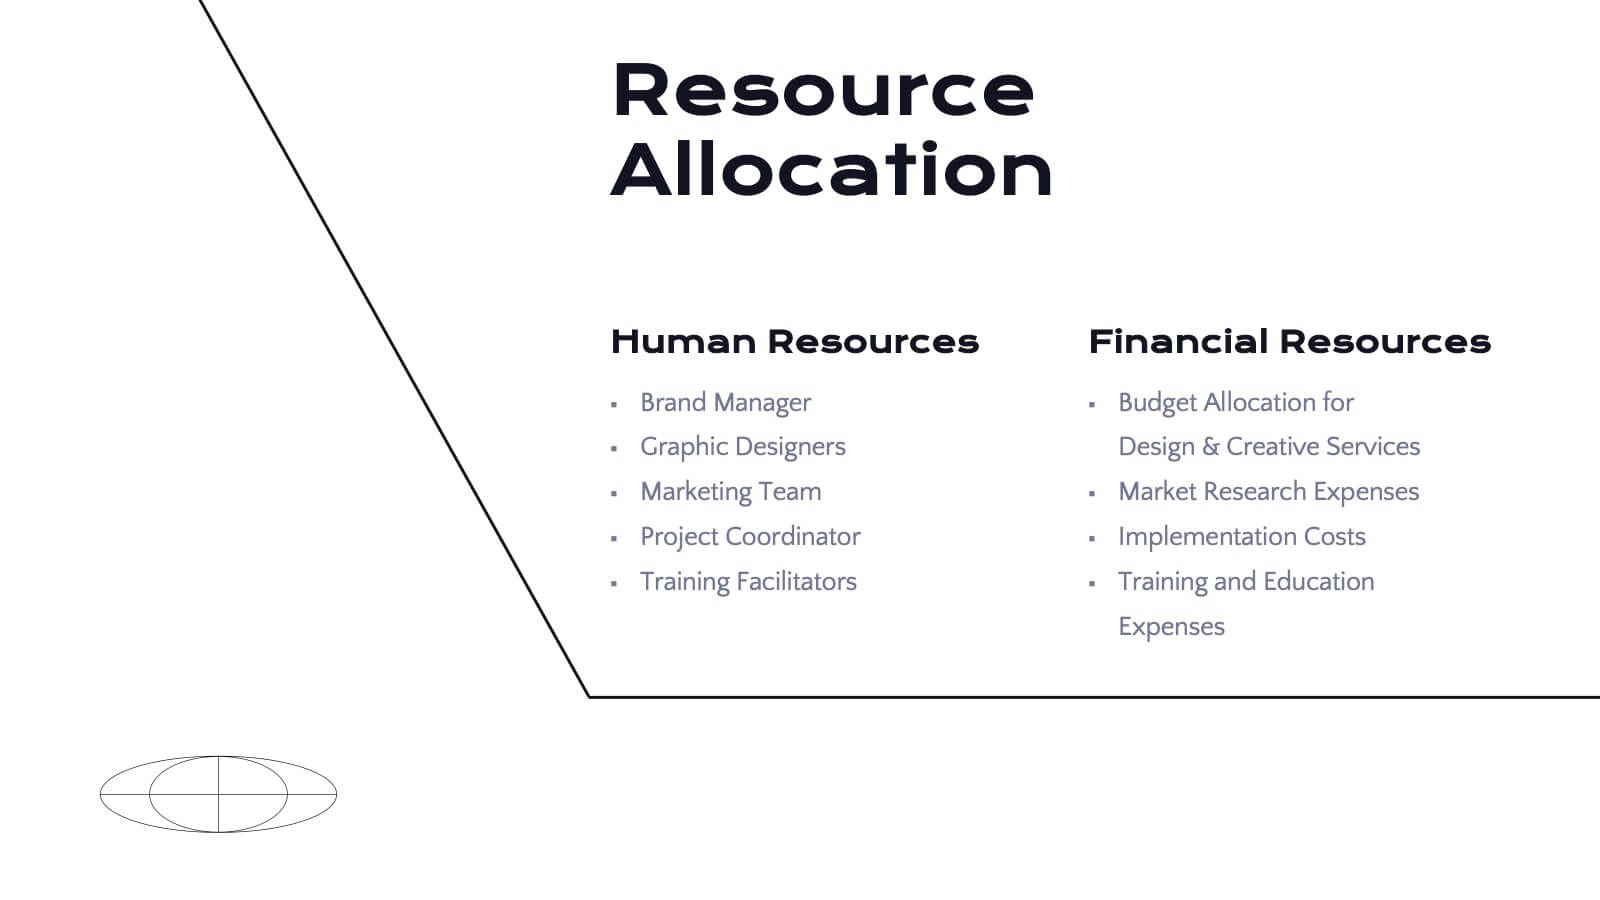
Radiance Detailed Project Execution Plan Presentation
Elevate your project execution presentations with this sleek template, covering everything from objectives to timelines and budget breakdowns. It's perfect for aligning your team and stakeholders. Compatible with PowerPoint, Keynote, and Google Slides, it ensures professionalism and clarity in showcasing your project plans.


10 diapositivas
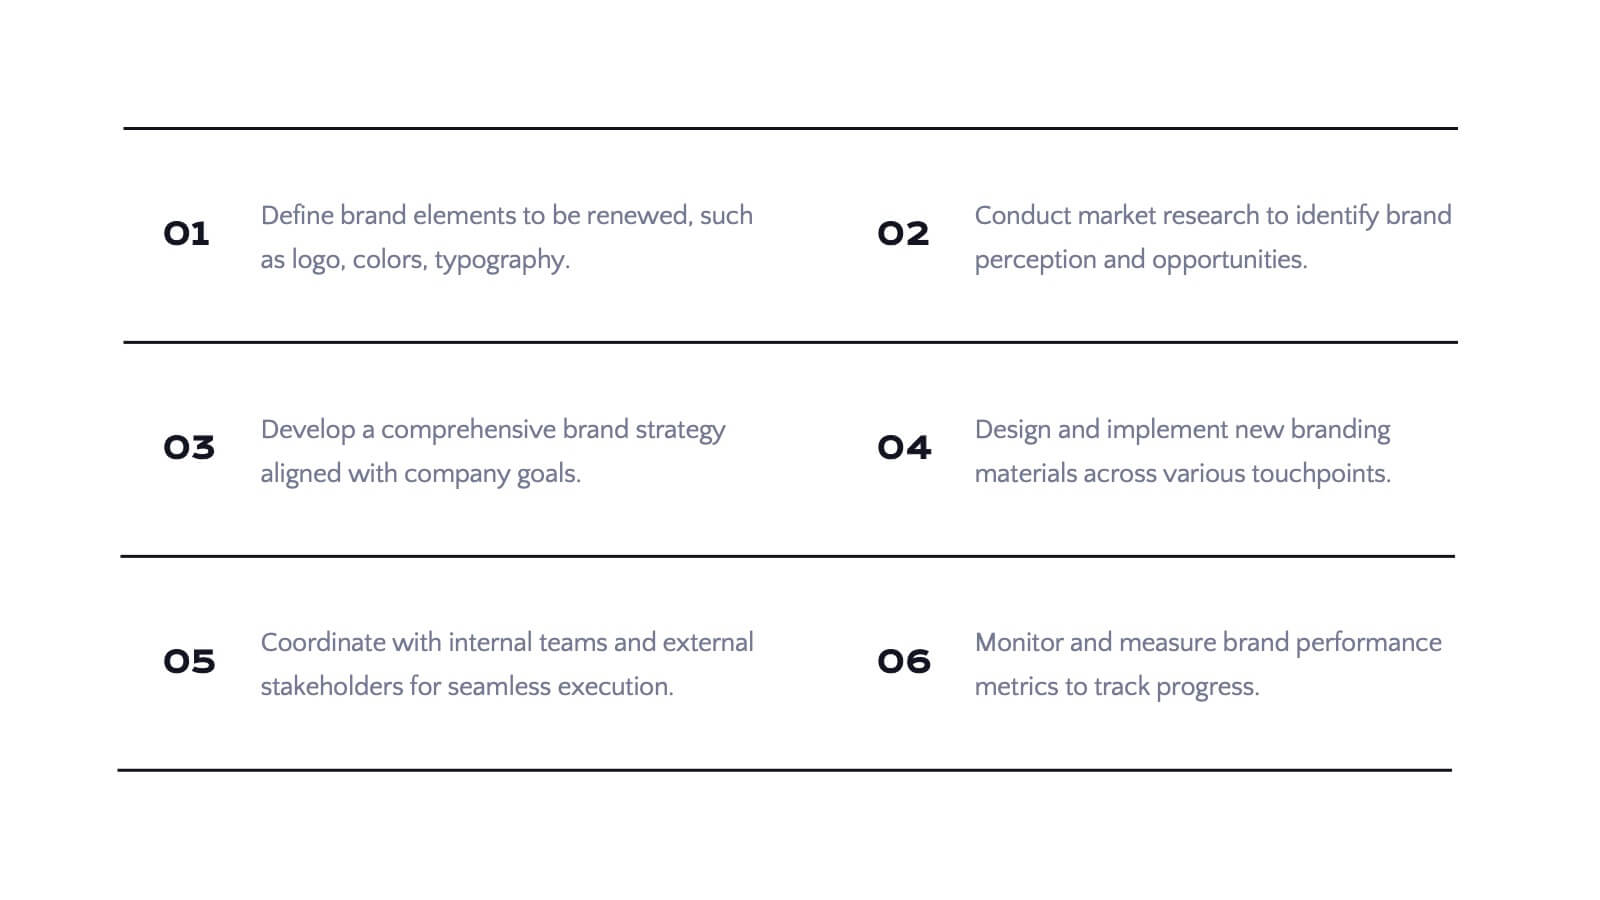
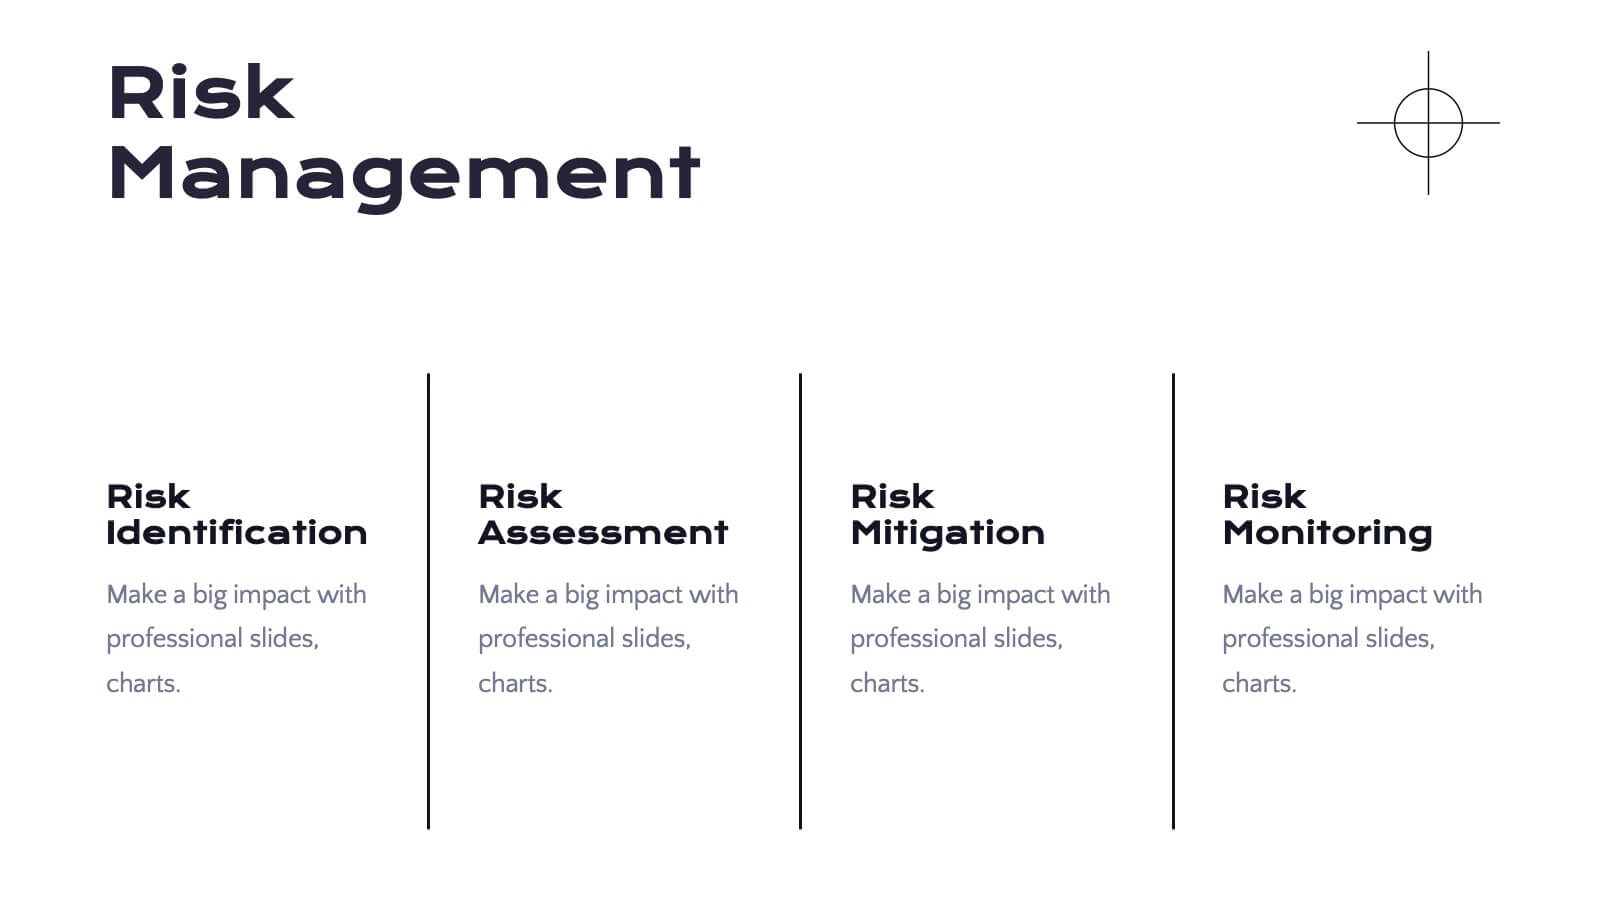
Risk Management Plan Presentation
The "Risk Management Plan Presentation" template is designed to outline strategic steps for identifying, assessing, managing, and monitoring business risks. Each segment of the plan is clearly labeled and represented on a segmented wheel, with A identifying risks, B assessing them, C managing responses, and D monitoring and reporting outcomes. The clean and straightforward design ensures key risk management strategies are communicated effectively to stakeholders. This visual tool is perfect for business meetings or training sessions, helping teams understand their roles in mitigating risks and ensuring that the business maintains a proactive approach to challenges.


22 diapositivas
Transmuton Creative Agency Pitch Deck Presentation
Showcase your agency’s creativity and expertise with this bold and modern pitch deck presentation. Covering key areas like campaign execution, strategy development, client success stories, and market analysis, this template helps you present a compelling vision. Fully customizable and compatible with PowerPoint, Keynote, and Google Slides for a seamless presentation experience.


5 diapositivas
Business Investment in Africa Map Presentation
Explore promising markets with the "Business Investment in Africa Map" template, designed to provide a visual overview of investment opportunities across the continent. It features a map with marked regions, each linked to specific data points about business prospects. Ideal for investors or companies looking at market penetration or expansion within Africa, this layout helps in making data-driven decisions by providing a clear, concise visual representation of key information.


4 diapositivas
Insurance Market Trends
Track and present evolving market dynamics with this Insurance Market Trends presentation. Featuring clean, multi-point visual elements, this slide set is perfect for analysts, consultants, and insurance professionals aiming to highlight growth segments, percentages, or trend categories. Fully editable in PowerPoint, Keynote, and Google Slides.


8 diapositivas
Survey Poll Results Visualization Presentation
Easily showcase your survey or poll data with this bold and modern results visualization slide. Designed with eye-catching circular charts, it helps your audience quickly grasp key insights at a glance. Perfect for business reviews, feedback summaries, or internal reports. Compatible with PowerPoint, Keynote, and Google Slides.


5 diapositivas
Meal Plan and Nutrition Guide Presentation
Simplify your nutrition strategy with the Meal Plan and Nutrition Guide Presentation. This visually engaging circular layout lets you outline five key nutrition pillars or daily meals with icons and editable titles. Ideal for dietitians, wellness coaches, or health brands. Compatible with PowerPoint, Canva, and Google Slides for seamless customization.


6 diapositivas
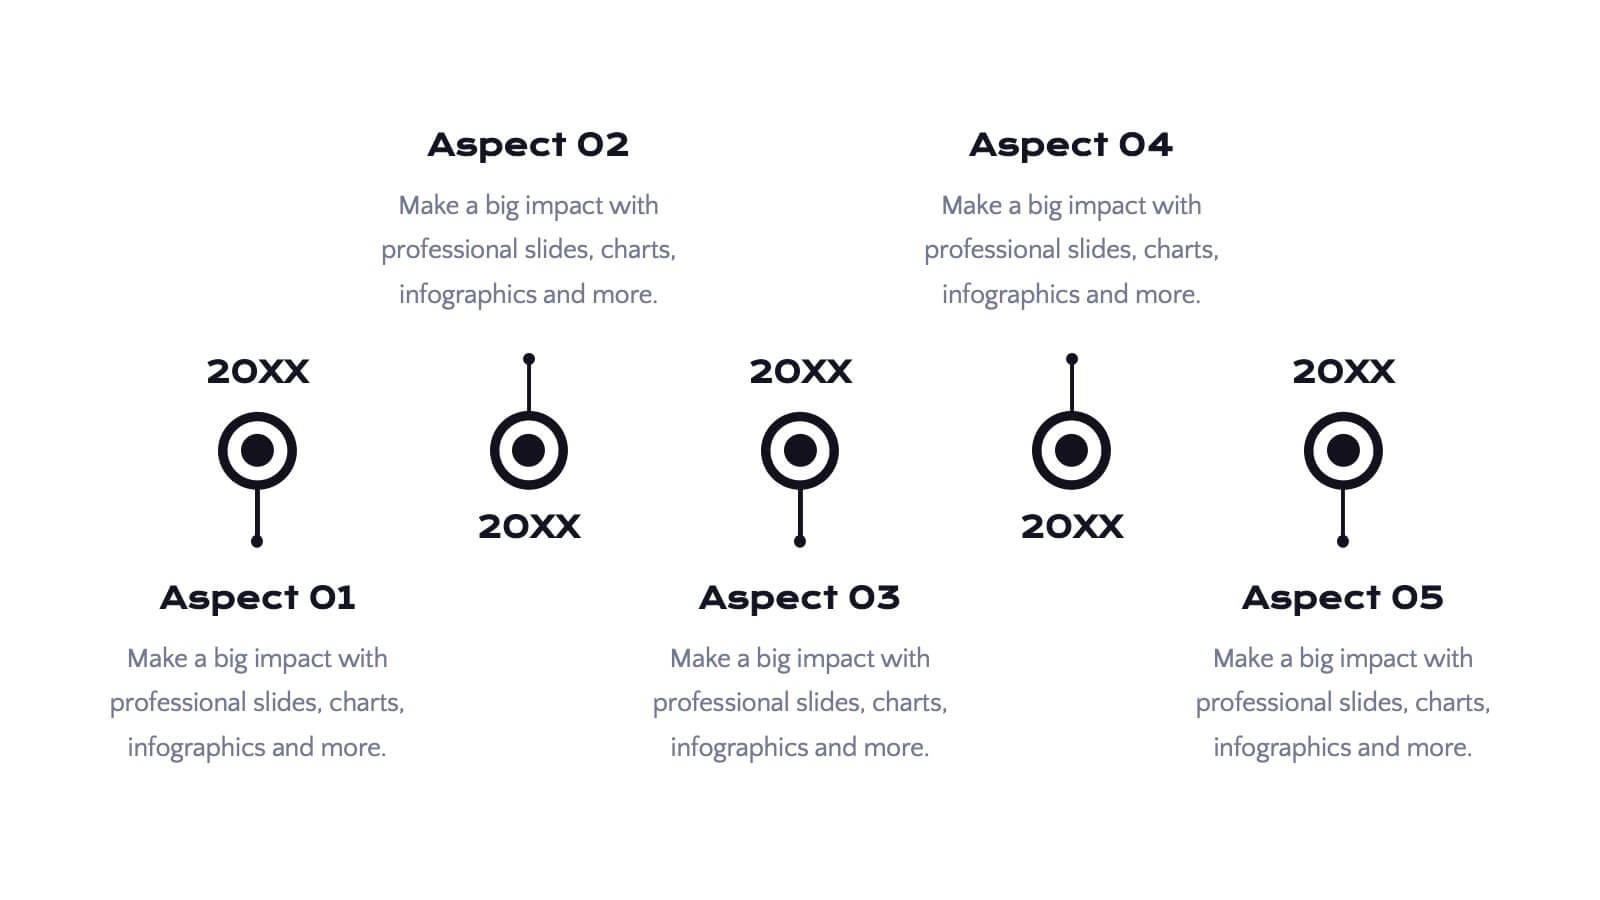
Project Timeline and Scheduling Presentation
The Project Timeline and Scheduling template provides a visual progression of project tasks and deadlines, featuring clear, progress-indicating design elements for each phase. It's ideal for project managers and teams to track milestones and updates efficiently. This template is compatible with PowerPoint, Keynote, and Google Slides, ensuring accessibility across different platforms.


6 diapositivas
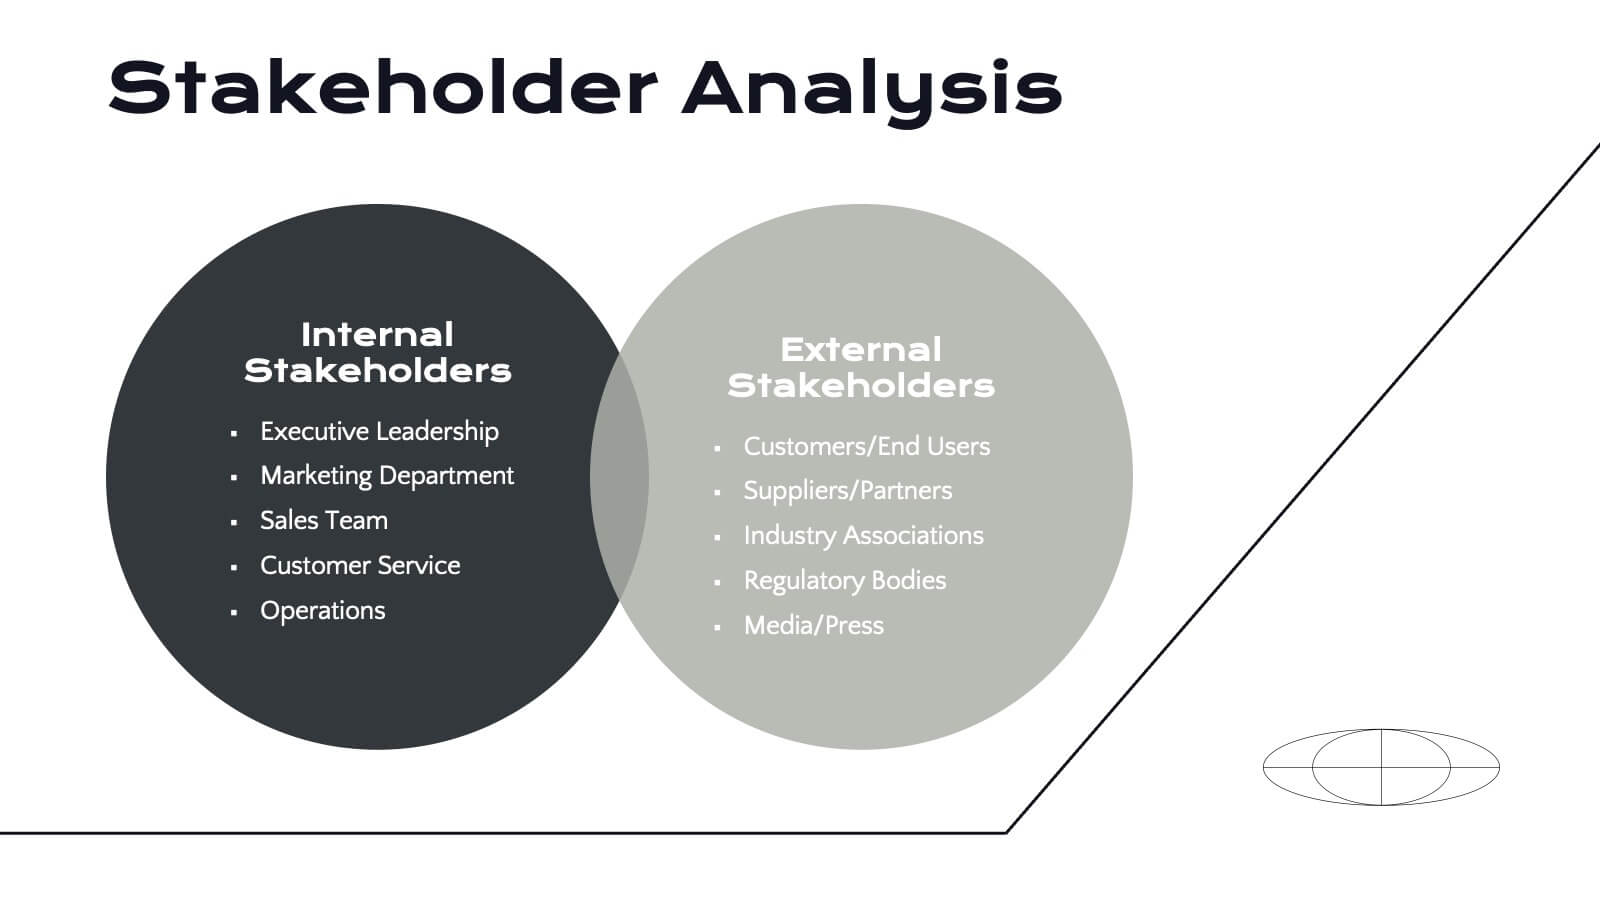
Venn Diagram
A Venn diagram is a visual representation of the relationships between different sets or groups. This infographic template consists of overlapping circles, each representing a specific set, and the overlapping parts indicates the elements that belong to multiple sets. Use this infographic to illustrate the relationships between different sets of data or concepts. The main components of the infographic are the circles or ellipses that represent the sets being compared. The size and position of the circles can be adjusted to reflect the data accurately. This infographic is fully customizable and compatible with Powerpoint, Keynote, and Google Slides.


7 diapositivas
Vacations Travel Infographic
Are you ready to embark on a journey around the world? Our Vacations Travel Infographic is your ultimate guide to thrilling destinations, exotic experiences, and memorable adventures. Whether you're a passionate traveler seeking new horizons or an explorer at heart, this infographic is designed to ignite your wanderlust and set your vacation dreams on fire. Compatible with Powerpoint, Keynote, and Google Slides. Dive into the world of travel with this vivid infographic that sparks excitement and eagerness to discover what lies beyond. This template is not just a visual delight, it's a roadmap to your dream vacation!


23 diapositivas
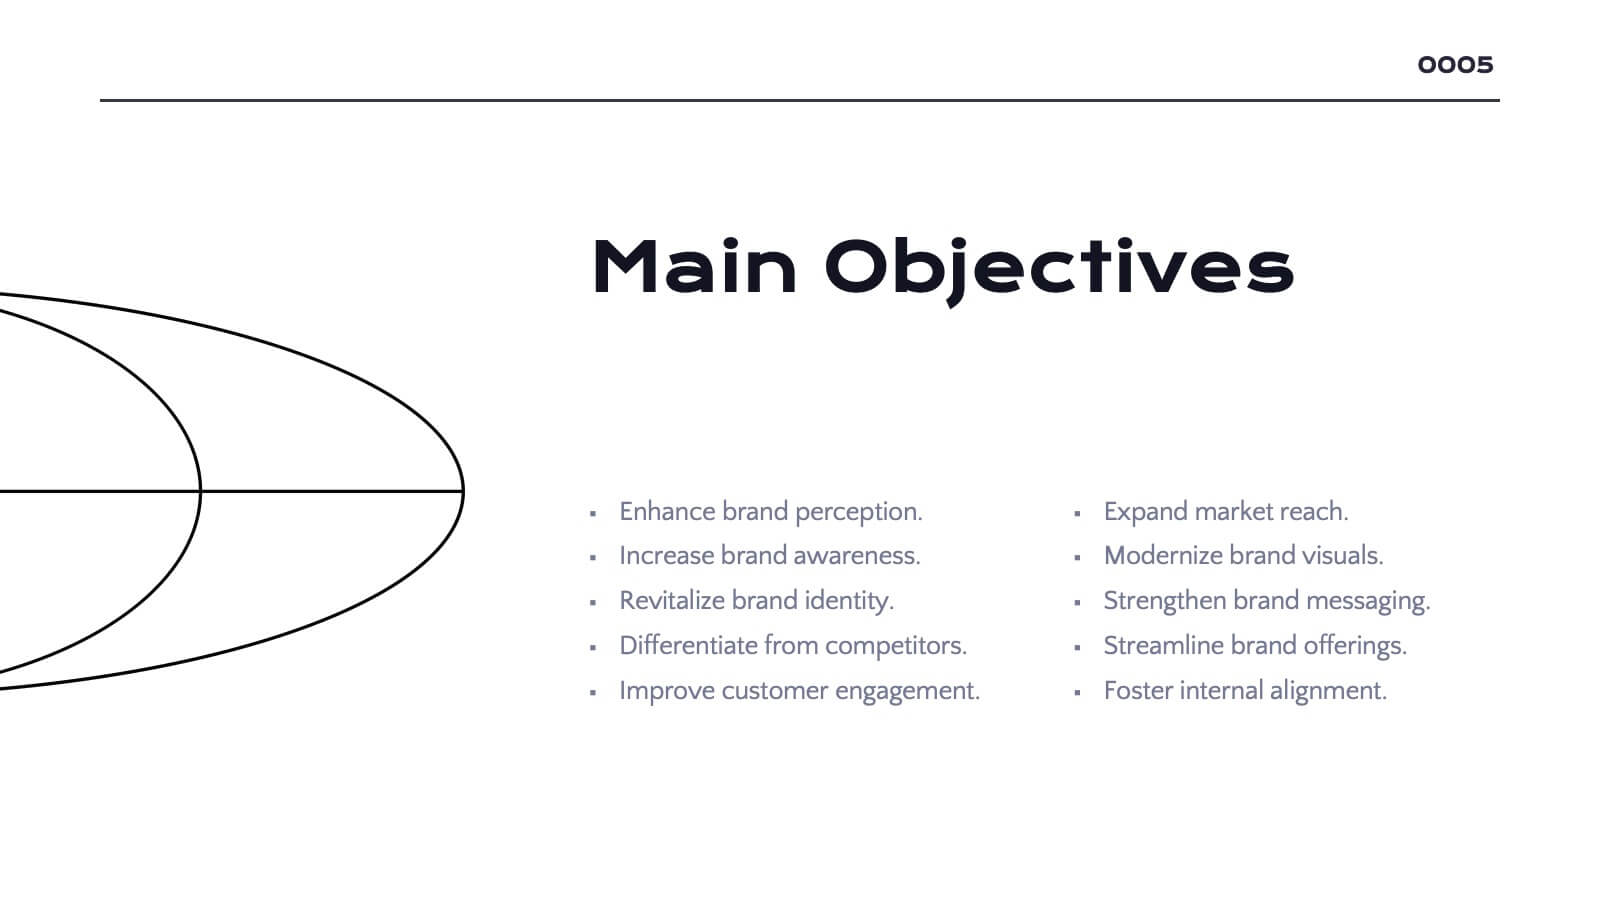
Meteor New Product Proposal Presentation
The Meteor New Product Proposal template is the perfect tool for presenting your innovative ideas in a bold and professional manner. With its striking yellow and black color scheme, this template grabs attention while maintaining a clean and modern aesthetic. It’s designed to help you effectively communicate your product’s potential, covering key aspects such as problem statement, solution, market opportunity, competitive landscape, and unique selling proposition. The template also includes sections for financials, growth projections, and risk analysis, ensuring that every critical detail is covered. Ideal for startups, product managers, and marketers, this template is fully compatible with PowerPoint, Keynote, and Google Slides, making it easy to customize and present on any platform. Impress investors, stakeholders, or team members with a comprehensive and visually compelling proposal that highlights the strengths and opportunities of your new product.