


Características


¿Tienes alguna pregunta?
Recomendar


5 diapositivas
Sales and Revenue KPI Snapshot Presentation
Present your top metrics with this clean Sales and Revenue KPI Snapshot slide. Display up to four key performance indicators using icons, percentage bars, and customizable labels. Ideal for business reviews, marketing updates, and executive dashboards. Fully editable in PowerPoint, Keynote, and Google Slides for seamless integration.


7 diapositivas
Smile Rating Importance Infographic Presentation
Smile Rating is a metric used in customer service to measure the level of customer satisfaction or happiness with a particular experience, interaction or service. This template will help you make a vibrant, friendly and original presentation. This smile rating infographic is easy to use and customize. It is fully editable and the layout allows you to personalize it. This template can be edited in PowerPoint, Keynote, and Google Slides. This is perfect for business presentations, strategic planning, idea-sharing sessions or just a fun way to share your thoughts on this design topic.


5 diapositivas
Breast Cancer Prevention Infographics
Breast Cancer is a serious disease that affects millions of people worldwide. These infographics are visual representations of information that provide tips and strategies to help prevent breast cancer. These infographics include statistics about breast cancer, risk factors, and preventative measures that can be taken to reduce the risk of developing the disease. You can also use these to provide information on screening and early detection, such as mammograms and self-exams. The visuals in these infographics may include icons, images, graphs, and charts to make the information easy to understand.


7 diapositivas
Solutions to Problems Infographic
These slides are designed to outline and explore solutions to identified problems in a clear and effective manner. Each slide uses a clean layout with a consistent color theme that enhances readability and focus. They effectively combine text and graphical elements to showcase problem-solving strategies, making the slides ideal for business presentations or strategic meetings. The inclusion of icons and diagrams aids in visualizing the problem-solving process, and the structured design ensures that the information is presented in a logical sequence. This approach not only aids in communicating the solutions effectively but also engages the audience by making complex information easier to understand. These templates can be adapted for various industries and scenarios, where clear communication of problem-solving steps is crucial. They are especially useful for team discussions, stakeholder presentations, and strategic planning sessions.


6 diapositivas
30 60 90 Manager Infographic
A 30-60-90 day plan outlines an individual's goals and tasks for the first three months of a new job, project, or role. This infographic template outlines the goals and tasks a manager plans to achieve during the first 30, 60, and 90 days of their role. This is a helpful tool to communicate objectives and strategy to your team. Design the infographic so that it's easy to share. The 30-60-90 Manager Infographic serves as a roadmap for the manager's initial months and provides transparency to their team about their goals and priorities. Use a consistent color scheme that aligns with your company's branding.


7 diapositivas
RACI Matrix Process Infographic Presentation
A RACI matrix is a project management tool that is used to clarify and define roles and responsibilities for project tasks and deliverables. Use this template to help you quickly create RACI charts for your next project. Made up of strategic box with shapes, colors, numeric value and text boxes that can be edited easily. This Template is a multipurpose slide as it can be used to present data visually, build a discussion on the topic and influence your audience to take action. Save time and energy with this infographic template, compatible with Powerpoint, Keynote and Google Slides.


6 diapositivas
Problem-Solving with Design Thinking
Communicate your innovation process with clarity using the Problem-Solving with Design Thinking Presentation. This slide visualizes the six key phases of the design thinking methodology (e.g., Empathize, Define, Ideate, Prototype, Test, Implement) arranged in a dynamic hexagonal loop. Each section is color-coded and icon-labeled for easy navigation, with editable titles and space for explanatory text. Ideal for creative workshops, team brainstorming, innovation strategy, and agile process presentations. Fully editable in PowerPoint, Keynote, and Google Slides.


5 diapositivas
Employee Lifecycle Management Presentation
Visualize every stage of the employee journey with the Employee Lifecycle Management template. Featuring a streamlined process flow, this layout is ideal for showcasing recruitment, onboarding, development, retention, and offboarding strategies. Fully editable in Canva, PowerPoint, and Google Slides, allowing seamless customization to align with your HR goals and branding.


21 diapositivas
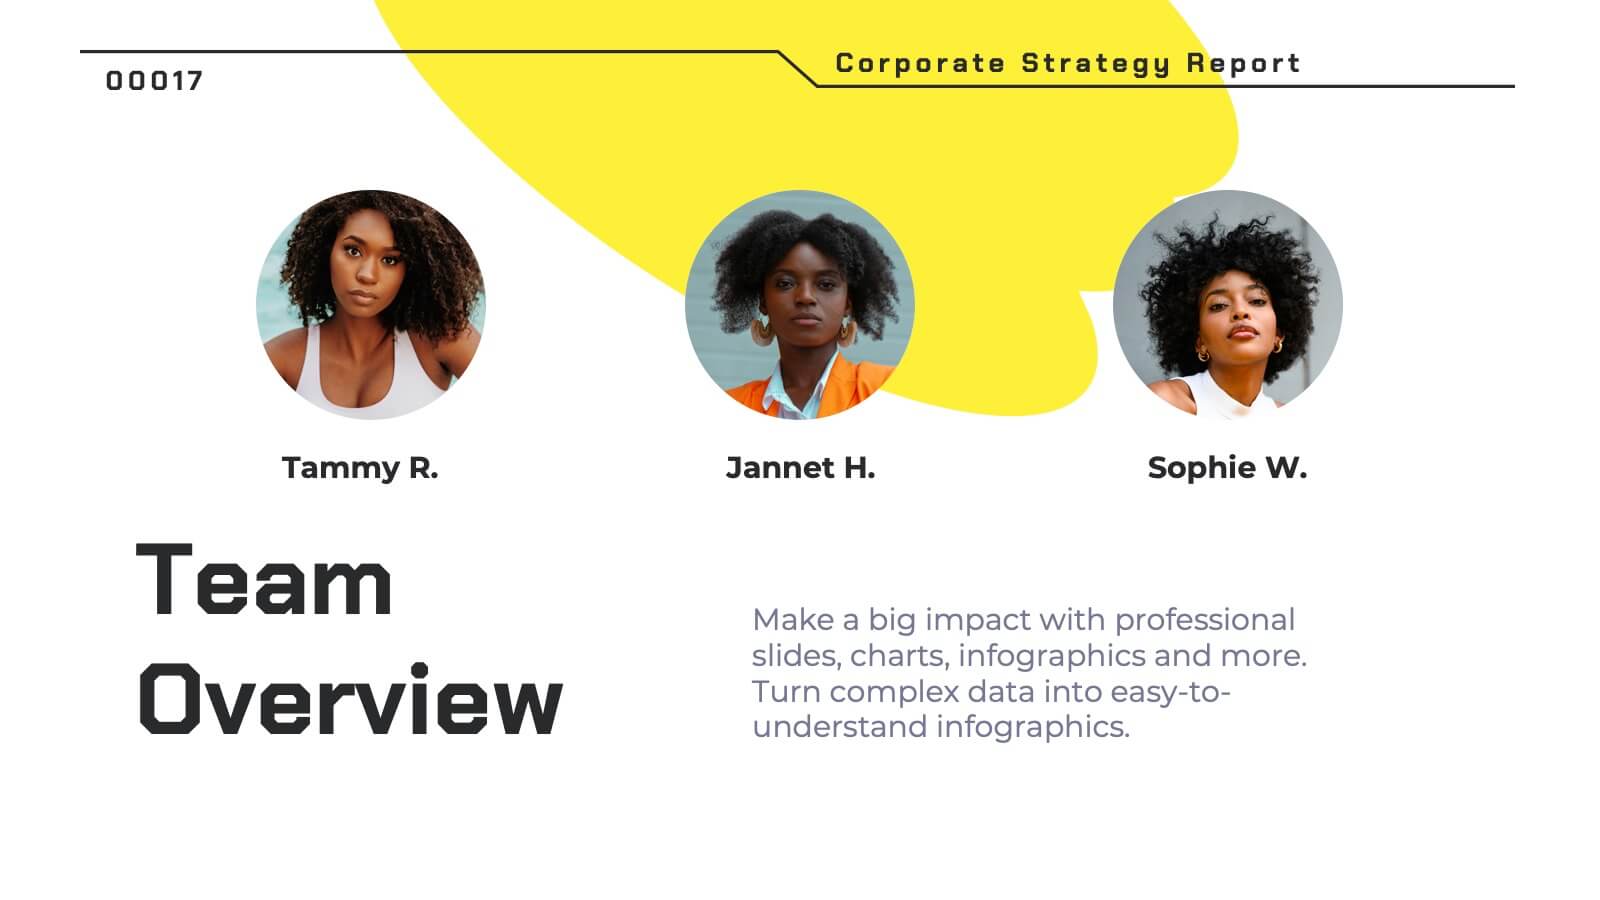
Pyronova Corporate Strategy Report Presentation
This professional corporate strategy template includes slides for market opportunity, SWOT analysis, objectives, marketing plan, revenue model, and competitive analysis. Designed for impactful presentations, it highlights financial performance, investment opportunities, and operational plans. Fully customizable in PowerPoint, Keynote, and Google Slides to suit diverse business needs.

22 diapositivas
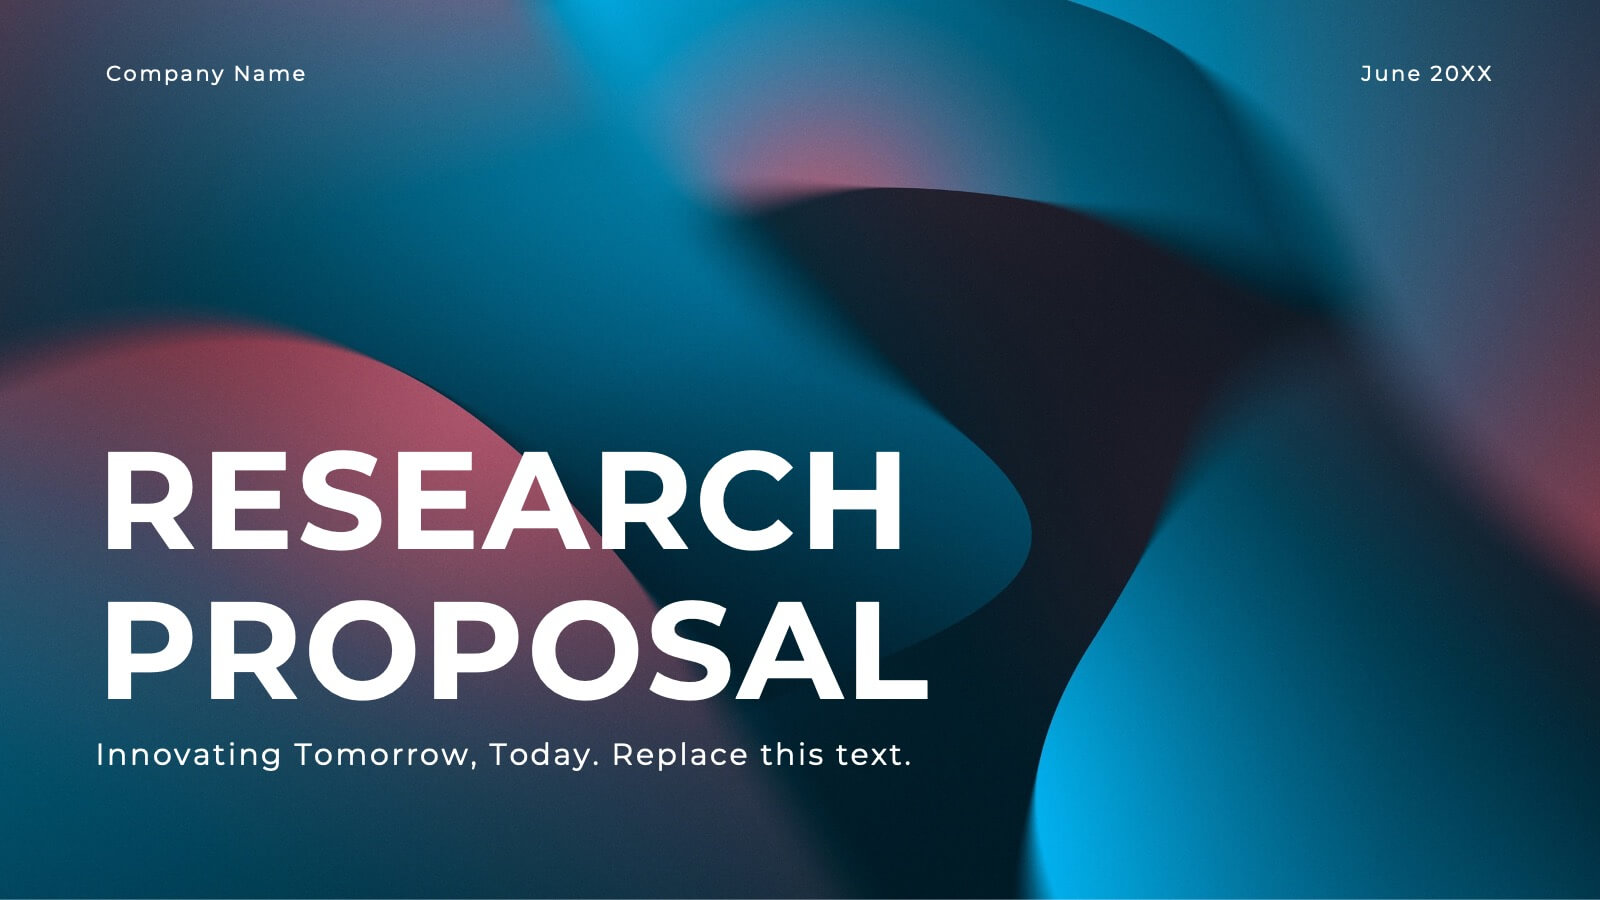
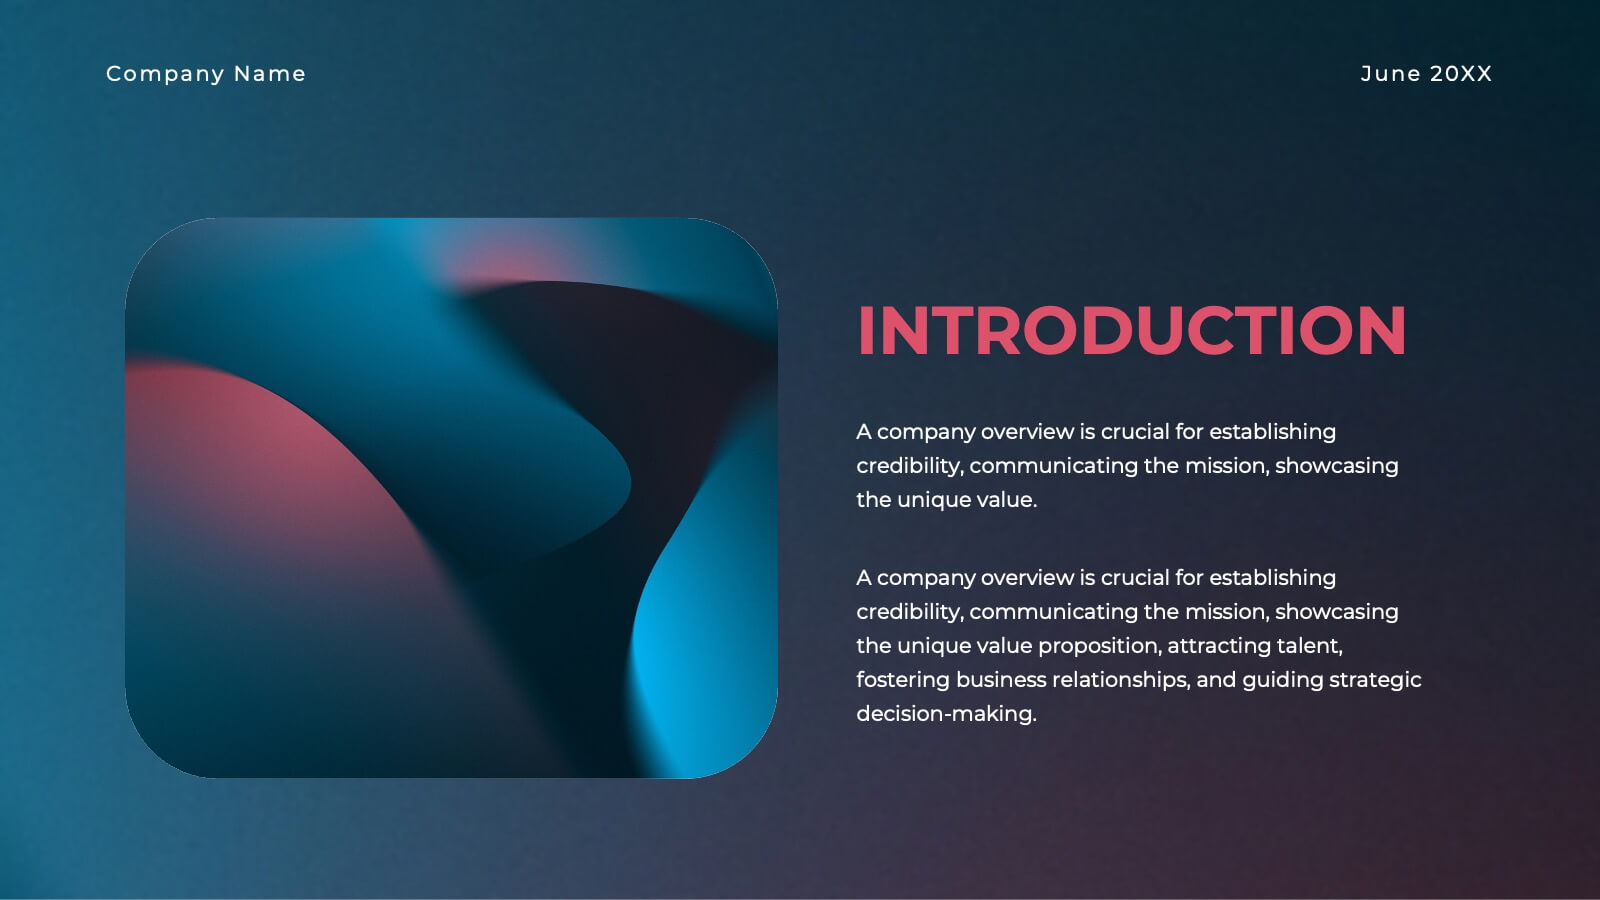
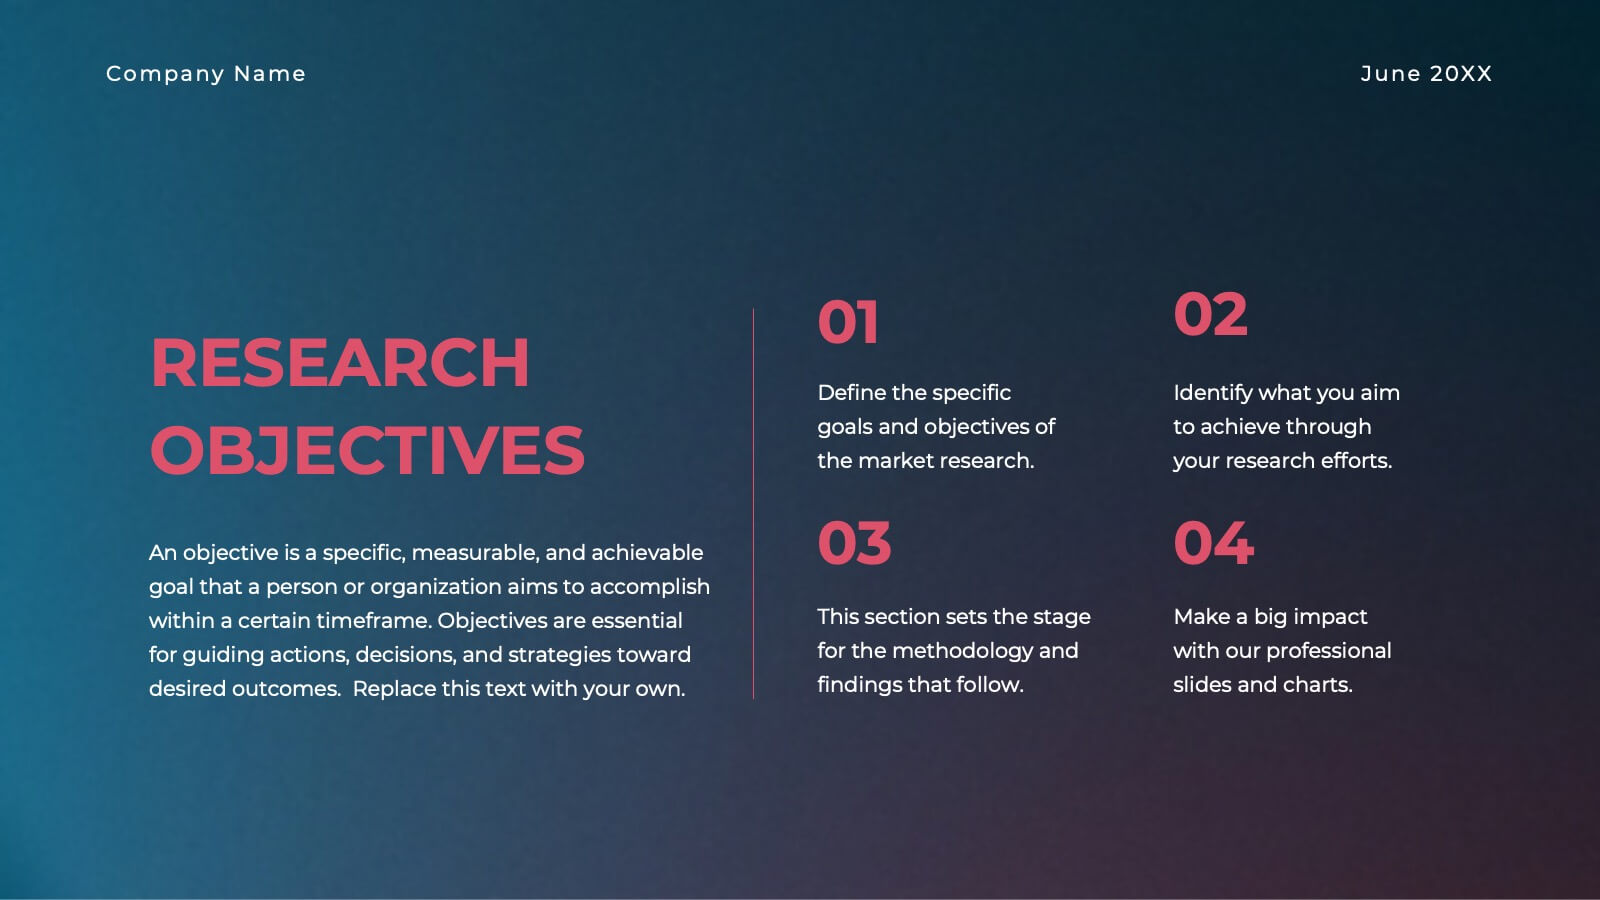
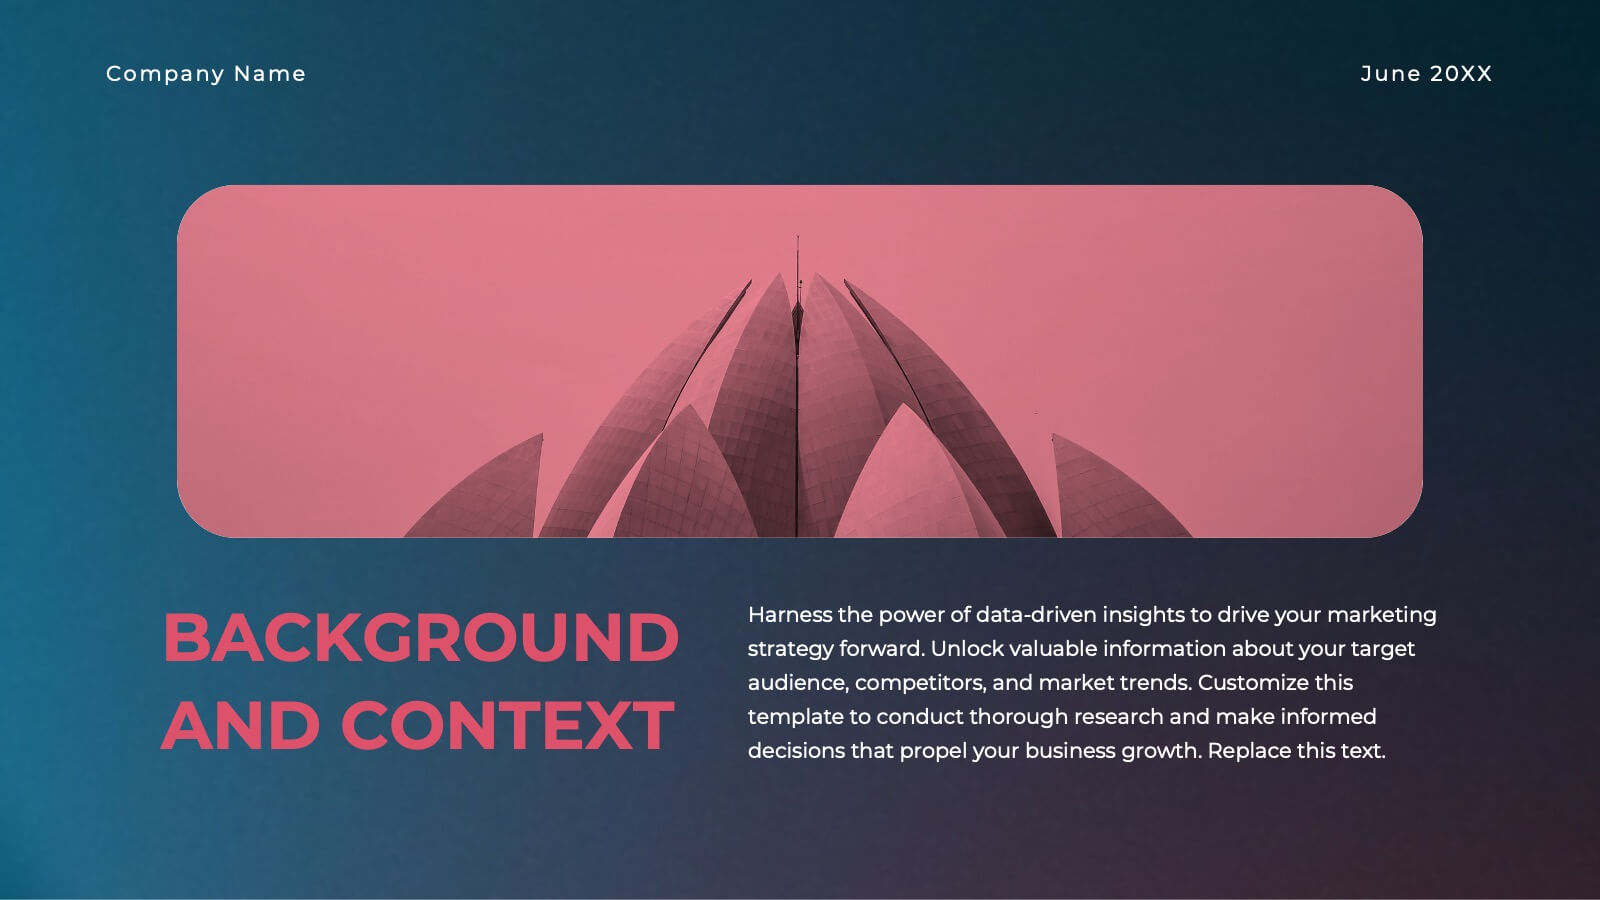
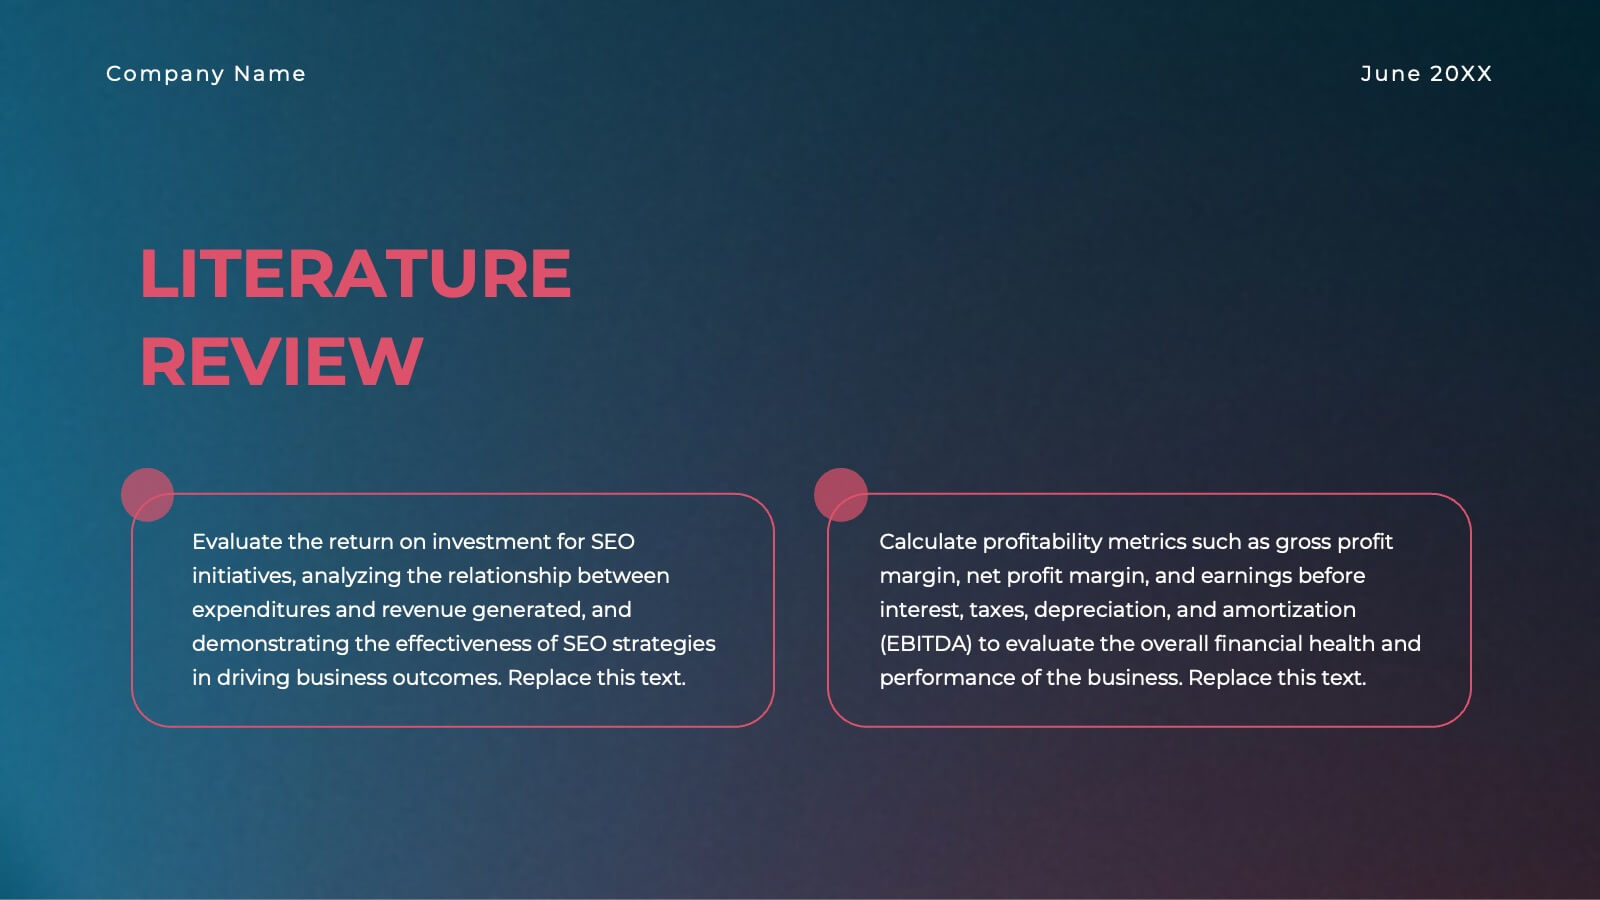
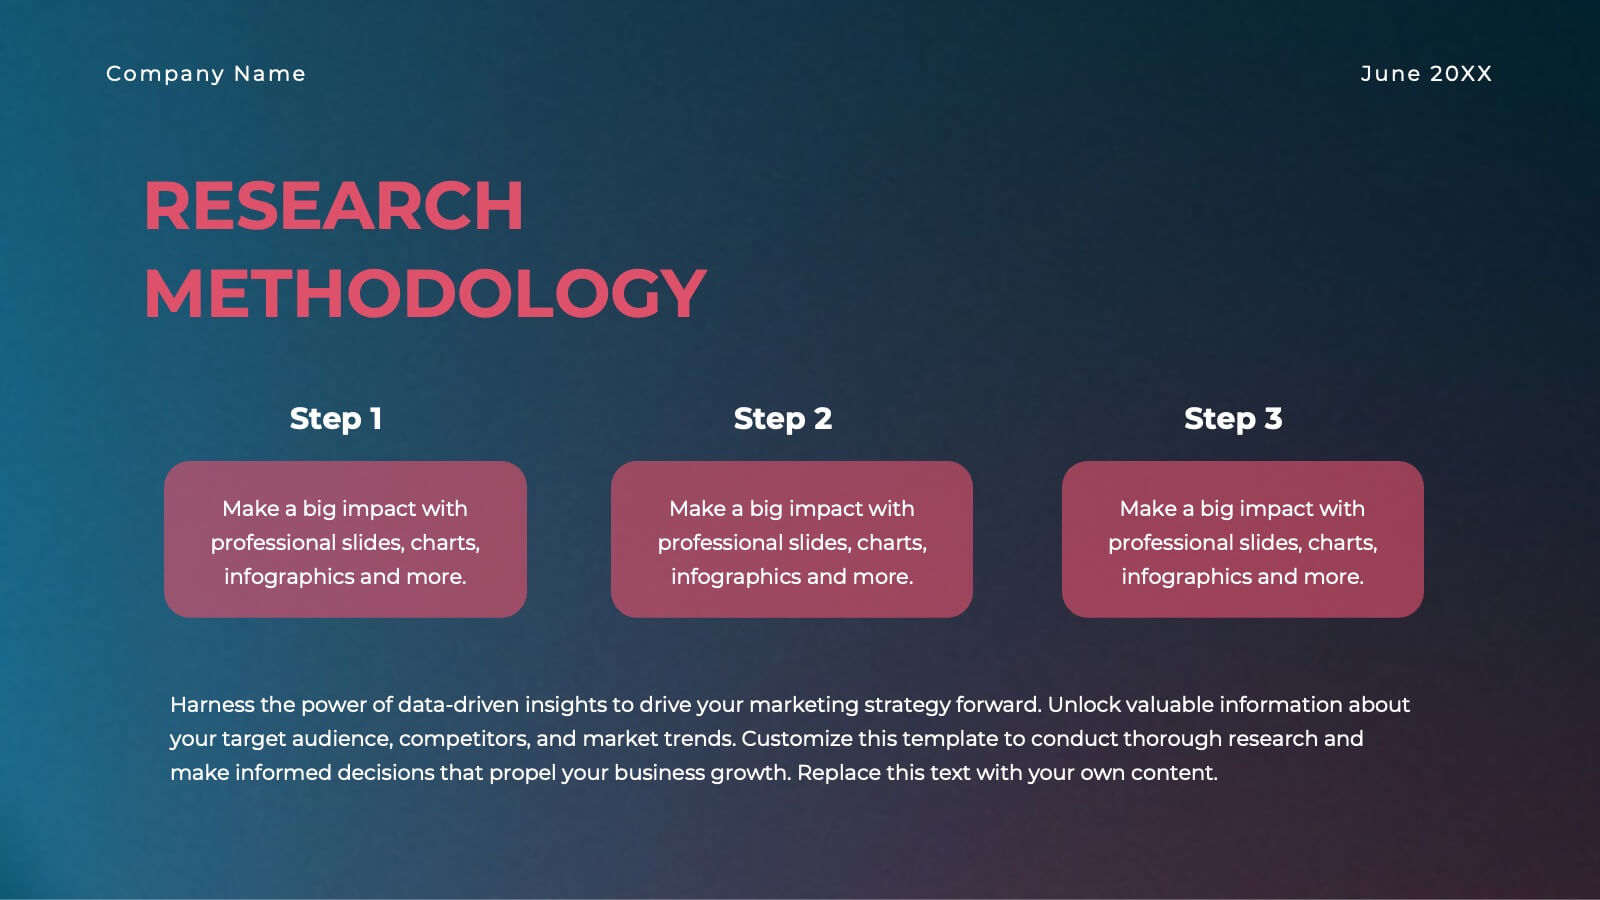
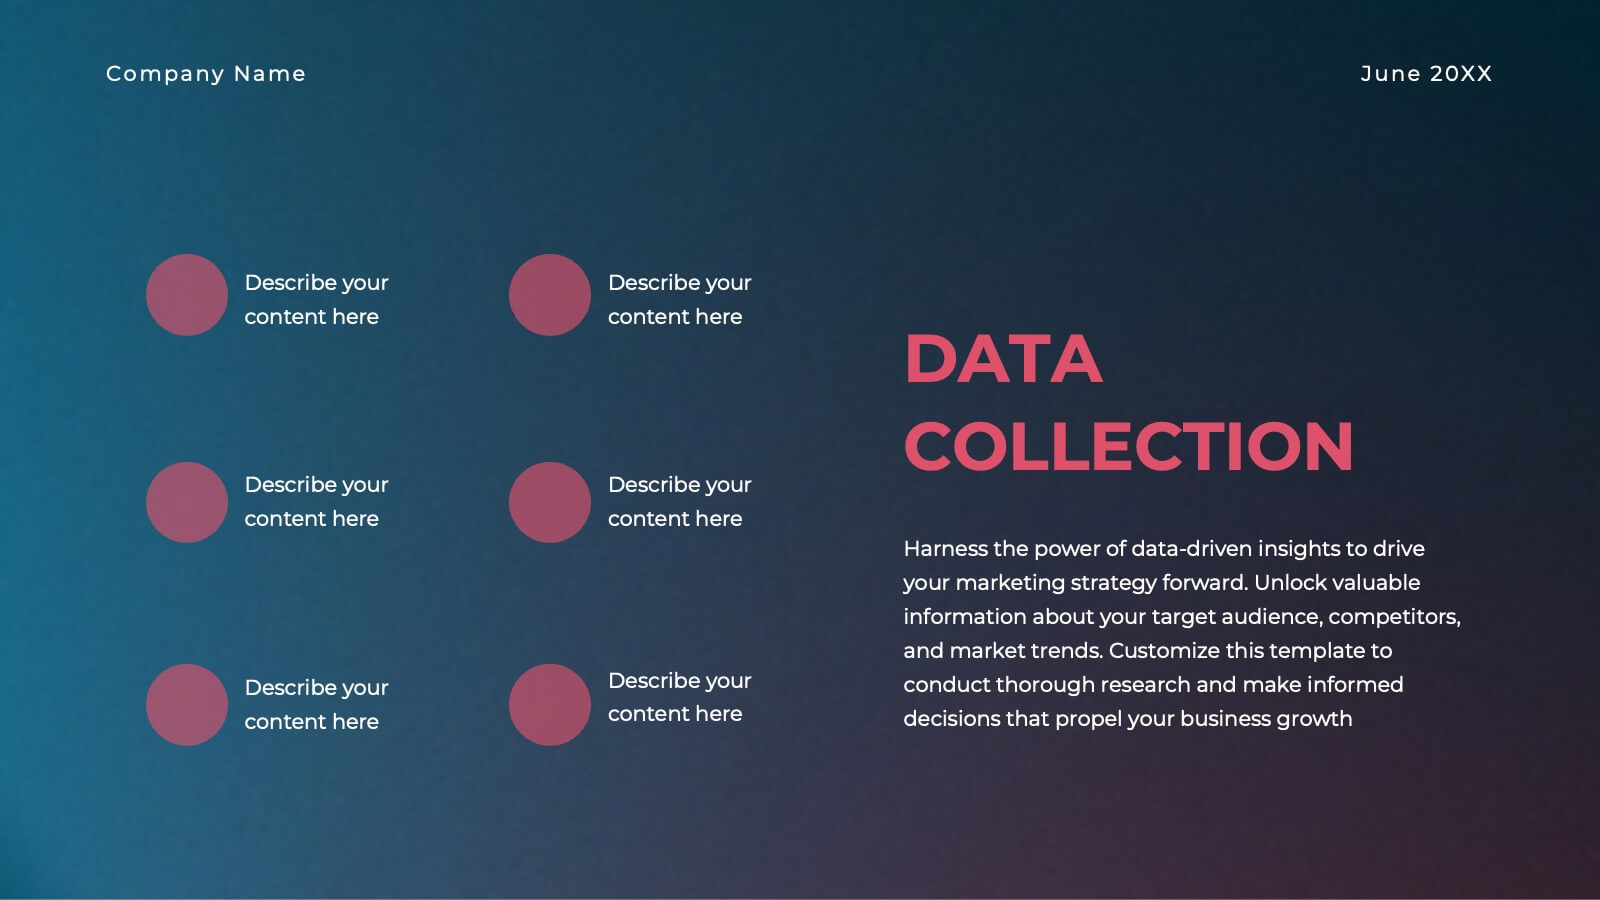
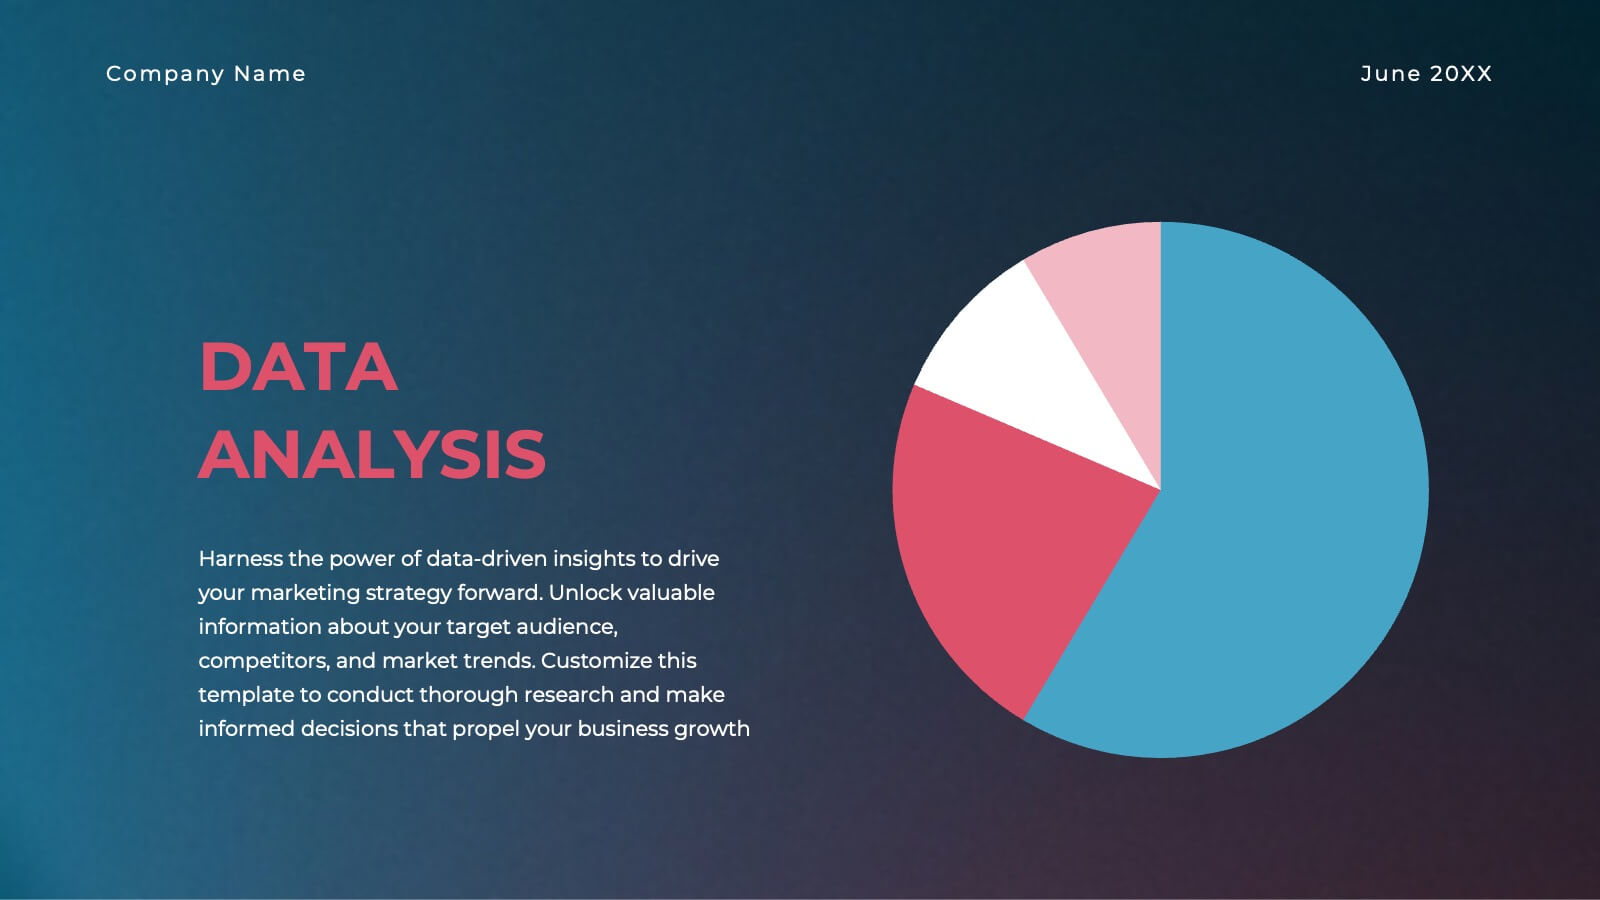
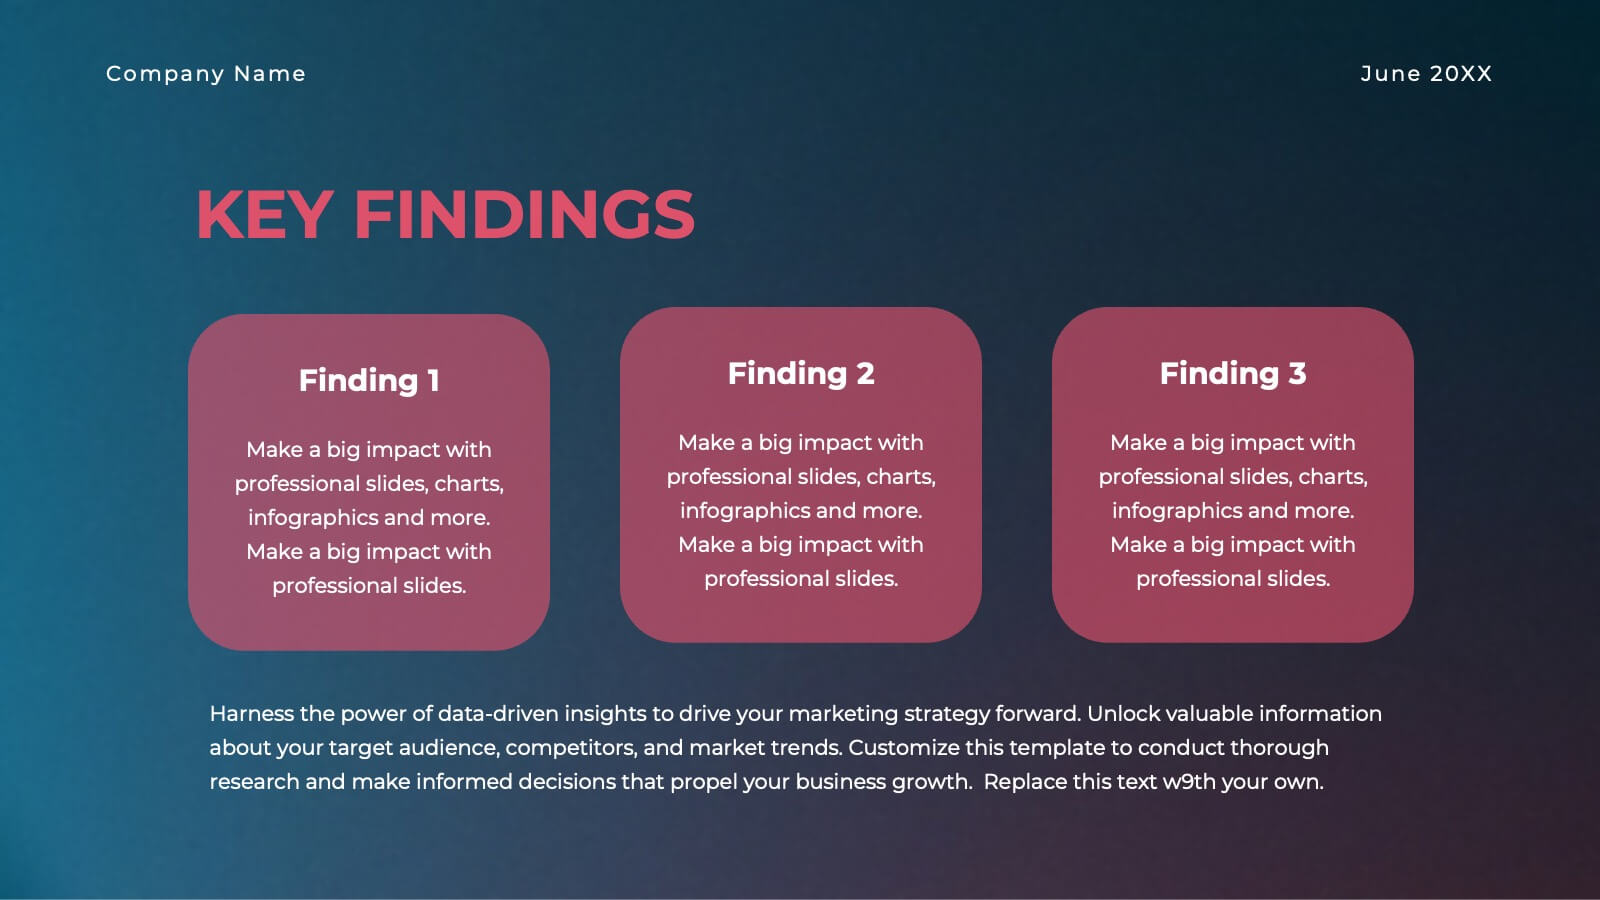
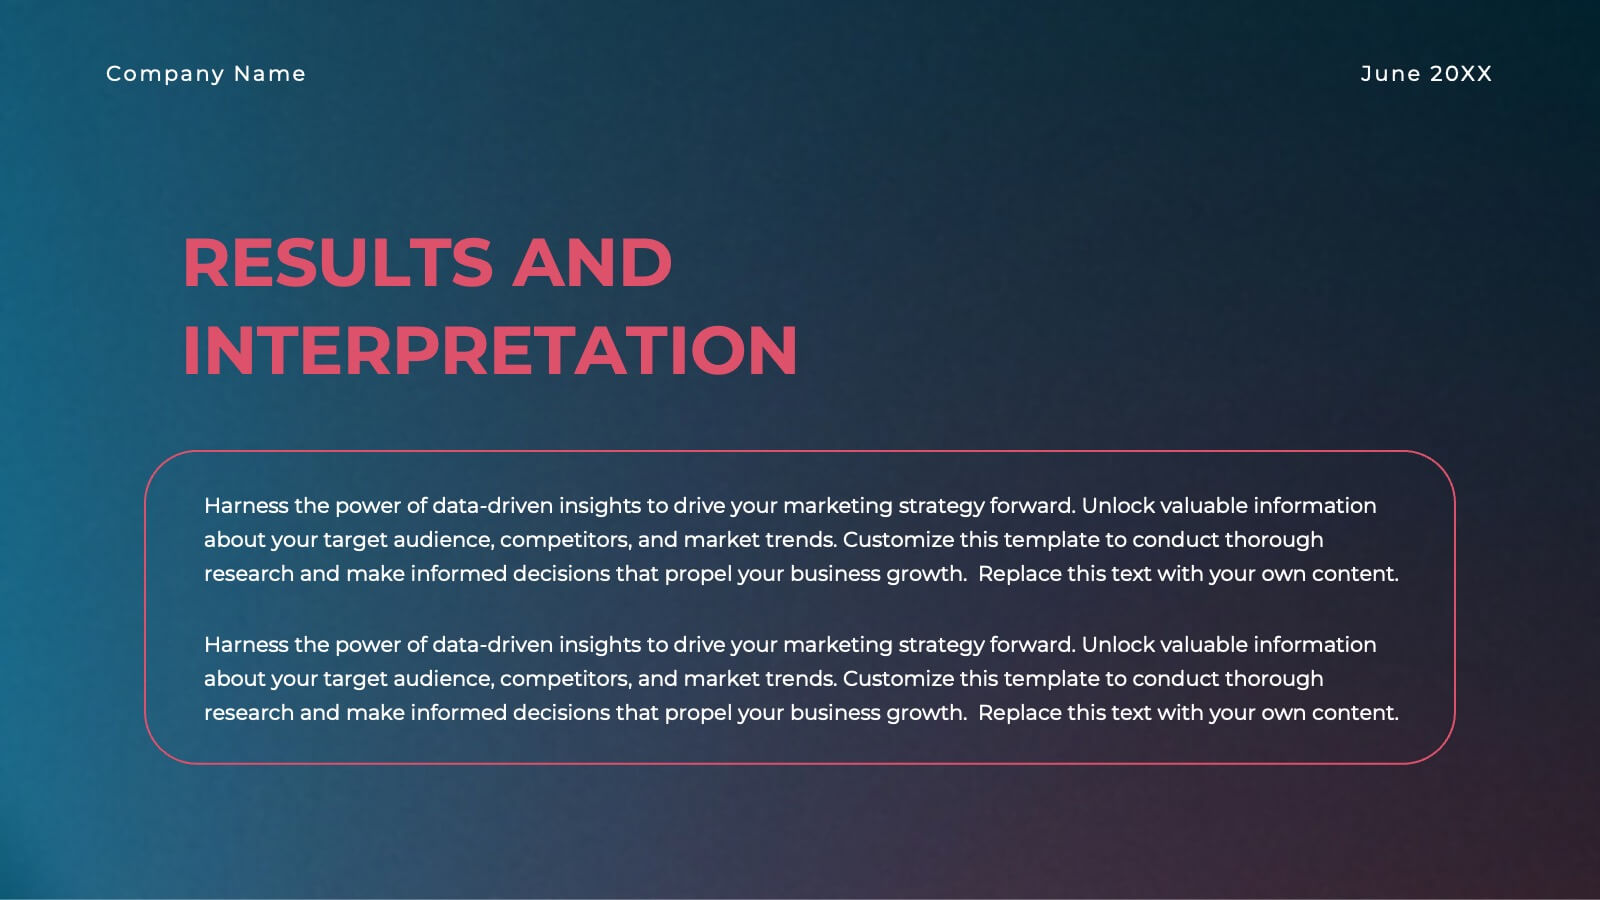
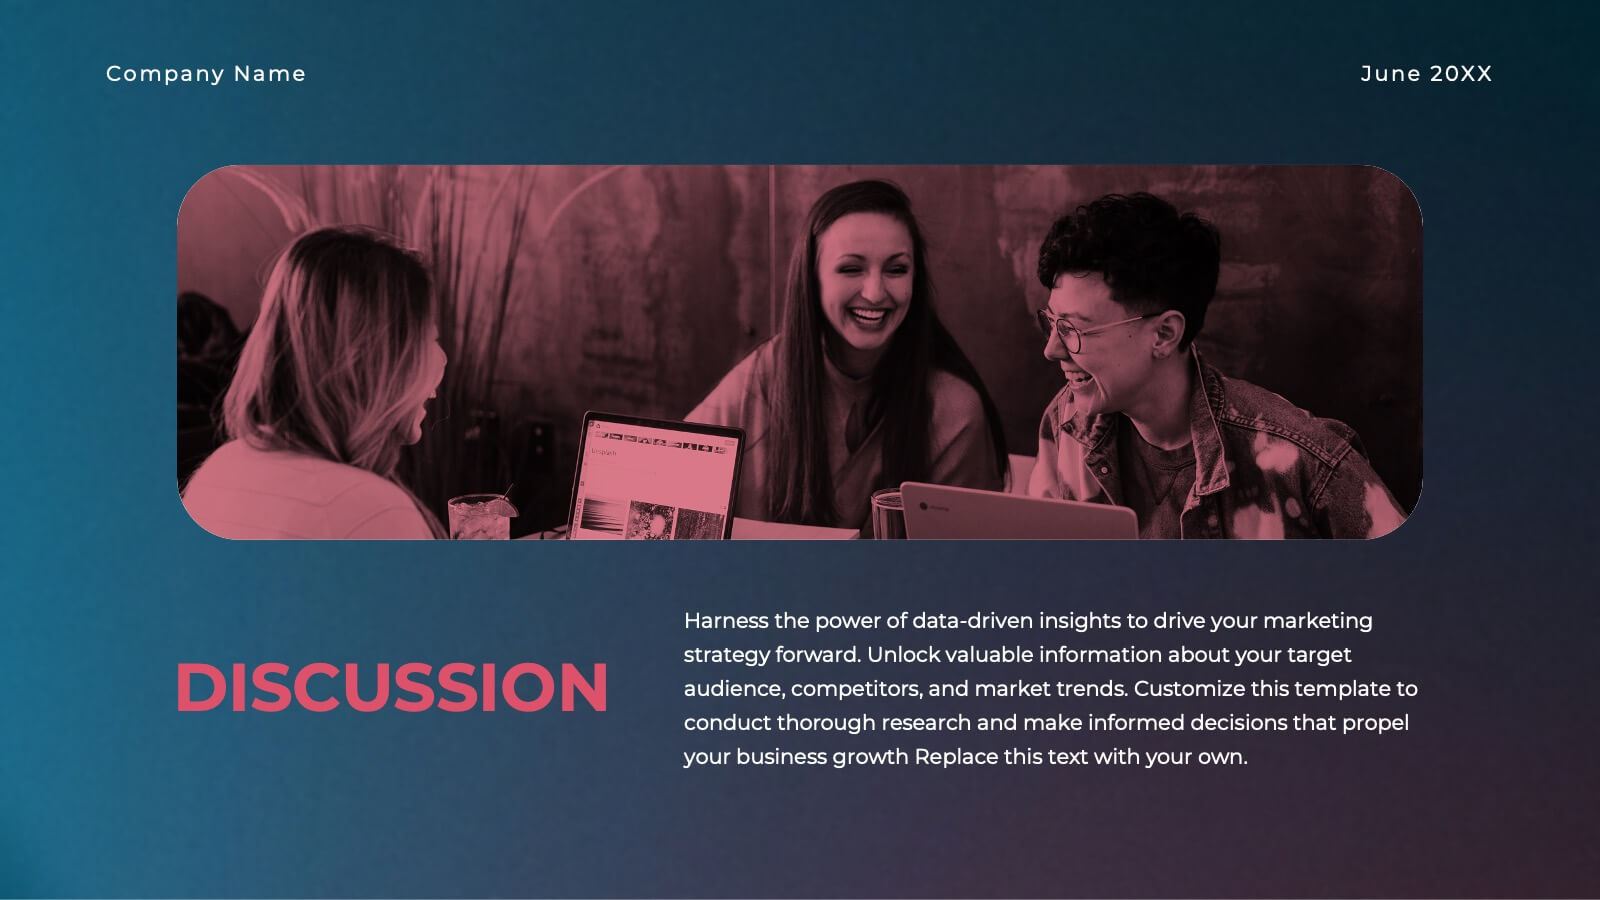
Gold Research Proposal Presentation
Present your research with impact using this sleek and modern research proposal template! Featuring sections for objectives, data collection, analysis, key findings, and recommendations, this template helps organize your research clearly and professionally. Fully customizable and compatible with PowerPoint, Keynote, and Google Slides, it's ideal for any research presentation.


4 diapositivas
Personal and Business Insurance Plans
Clearly present your insurance tiers with this easy-to-read comparison layout. Ideal for showcasing plan options for individuals, families, and businesses, this template highlights pricing, benefits, and coverage icons side-by-side. Clean and professional, it’s fully editable in PowerPoint, Keynote, and Google Slides.


6 diapositivas
Innovative Design Thinking Steps Presentation
Bring structure to creativity with a bold, modern layout that walks your audience through each phase of innovation. Perfect for showcasing processes, strategy development, or brainstorming frameworks, this presentation makes complex ideas feel simple and engaging. Fully compatible with PowerPoint, Keynote, and Google Slides for effortless editing and presentation.


5 diapositivas
Project Milestone Timeline Presentation
Bring your project’s journey to life with this vibrant and organized presentation layout. Designed to showcase milestones, releases, and key phases clearly, it helps teams stay aligned and focused on goals. Fully editable and compatible with PowerPoint, Keynote, and Google Slides for smooth, professional presentations every time.


12 diapositivas
Corporate Sustainability Strategy Presentation
Achieve your sustainability goals with the Corporate Sustainability Strategy Presentation template. This modern, visually engaging layout helps businesses showcase their environmental, social, and governance (ESG) initiatives, sustainability roadmaps, and corporate responsibility plans. Featuring clear, structured sections, this fully customizable design is perfect for corporate leaders, consultants, and eco-conscious organizations. Compatible with PowerPoint, Keynote, and Google Slides for effortless editing and presentation.


5 diapositivas
Modern Home Layout Slides Presentation
Give your design ideas a modern edge with this clean, architectural presentation. Perfect for showcasing home layouts, interior concepts, or real estate projects, it combines structure and creativity to keep viewers engaged. Fully customizable and compatible with PowerPoint, Keynote, and Google Slides for effortless editing and professional delivery.


6 diapositivas
Corporate Responsibility Sustainability Plan Presentation
Present your sustainability vision with the Corporate Responsibility Sustainability Plan Presentation. Designed around a tree-themed layout, this infographic highlights six key initiatives—perfect for showcasing environmental, social, and governance (ESG) efforts. Ideal for CSR reports, strategy decks, or stakeholder presentations. Fully editable in Canva, PowerPoint, Keynote, and Google Slides.


8 diapositivas
Business Growth with TAM SAM SOM Framework Presentation
Illustrate Your Market Expansion Strategy with this Business Growth with TAM SAM SOM Framework presentation template. Clearly differentiate Total Addressable Market (TAM), Serviceable Available Market (SAM), and Serviceable Obtainable Market (SOM) to help businesses, entrepreneurs, and investors make informed growth decisions and target market opportunities. This visually engaging and fully customizable template is compatible with PowerPoint, Keynote, and Google Slides, making it ideal for business planning, market research, and investor presentations.