


Características


¿Tienes alguna pregunta?
Recomendar


5 diapositivas
Workflow Management Diagram Presentation
Simplify your process visuals with a clean, modern layout designed to clarify every step. This presentation helps you map workflows, define responsibilities, and streamline communication across teams. Perfect for project planning and operations, it’s fully compatible with PowerPoint, Keynote, and Google Slides for effortless customization and professional presentation delivery.


5 diapositivas
Population Segmentation by Demographic Factors Presentation
Break down audience demographics with this segmented infographic slide. Featuring a vertical figure illustration divided into color-coded percentage bars, it’s ideal for showcasing traits like age, gender, or location. This layout offers a clear visual summary, making it perfect for reports, marketing briefs, or investor presentations. Fully editable in Canva.


3 diapositivas
Break Even Financial Model Presentation
Bring your financial story to life with this sleek and professional presentation design. Ideal for illustrating profit margins, cost recovery, or growth potential, it helps visualize when investments start to pay off. Fully customizable and compatible with PowerPoint, Keynote, and Google Slides for effortless editing and impactful presentations.


4 diapositivas
Employee Onboarding Process Presentation
Streamline your onboarding process with clarity and efficiency. This Employee Onboarding Process template visually maps out key steps for a smooth transition into your organization. Ideal for HR professionals, managers, and team leads. Fully editable and compatible with PowerPoint, Keynote, and Google Slides for seamless integration into your workflow.


6 diapositivas
Product Development Cycles Presentation
A great product starts with a clear, engaging story—this presentation brings that journey to life. It outlines each stage of the development cycle in a simple, visual flow that helps teams communicate progress, milestones, and next steps. Perfect for strategy, planning, and updates. Fully compatible with PowerPoint, Keynote, and Google Slides.


5 diapositivas
Operational Workflow Process Chart Presentation
Streamline your operations with the Operational Workflow Process Chart Presentation. This template provides a clear visual layout to map out step-by-step processes, helping teams align on roles, timelines, and dependencies. Perfect for training, reporting, or system audits—fully customizable in PowerPoint, Canva, and Google Slides.


22 diapositivas
Muse UX Case Study Presentation
Deliver compelling UX case studies with a sleek presentation template designed to highlight your design journey and results. Ideal for showcasing your user-centered approach, it includes dedicated slides for project overview, user research, personas, journey mapping, wireframes, prototyping, and user testing. Clearly communicate your design principles and decision-making processes with visual design elements and brand guidelines. With specific sections for feedback, accessibility considerations, and project outcomes, this template ensures every aspect of your UX process is captured in a structured and visually engaging manner. Whether you're presenting to clients, stakeholders, or design teams, this template is fully editable and compatible with PowerPoint, Google Slides, and Keynote. Its modern design and professional layout provide an effortless way to convey the value of your UX work, making a lasting impact on your audience. Tailor it to your brand, and elevate your case studies today!


4 diapositivas
Highlighting Key Business Benefits Presentation
Unlock your brand's value with the Highlighting Key Business Benefits Presentation. This modern slide layout uses a visual key concept to emphasize four essential advantages, helping your audience quickly grasp your core offerings. Ideal for sales pitches, service overviews, or value proposition discussions. Fully editable and compatible with PowerPoint, Keynote, and Google Slides.


30 diapositivas
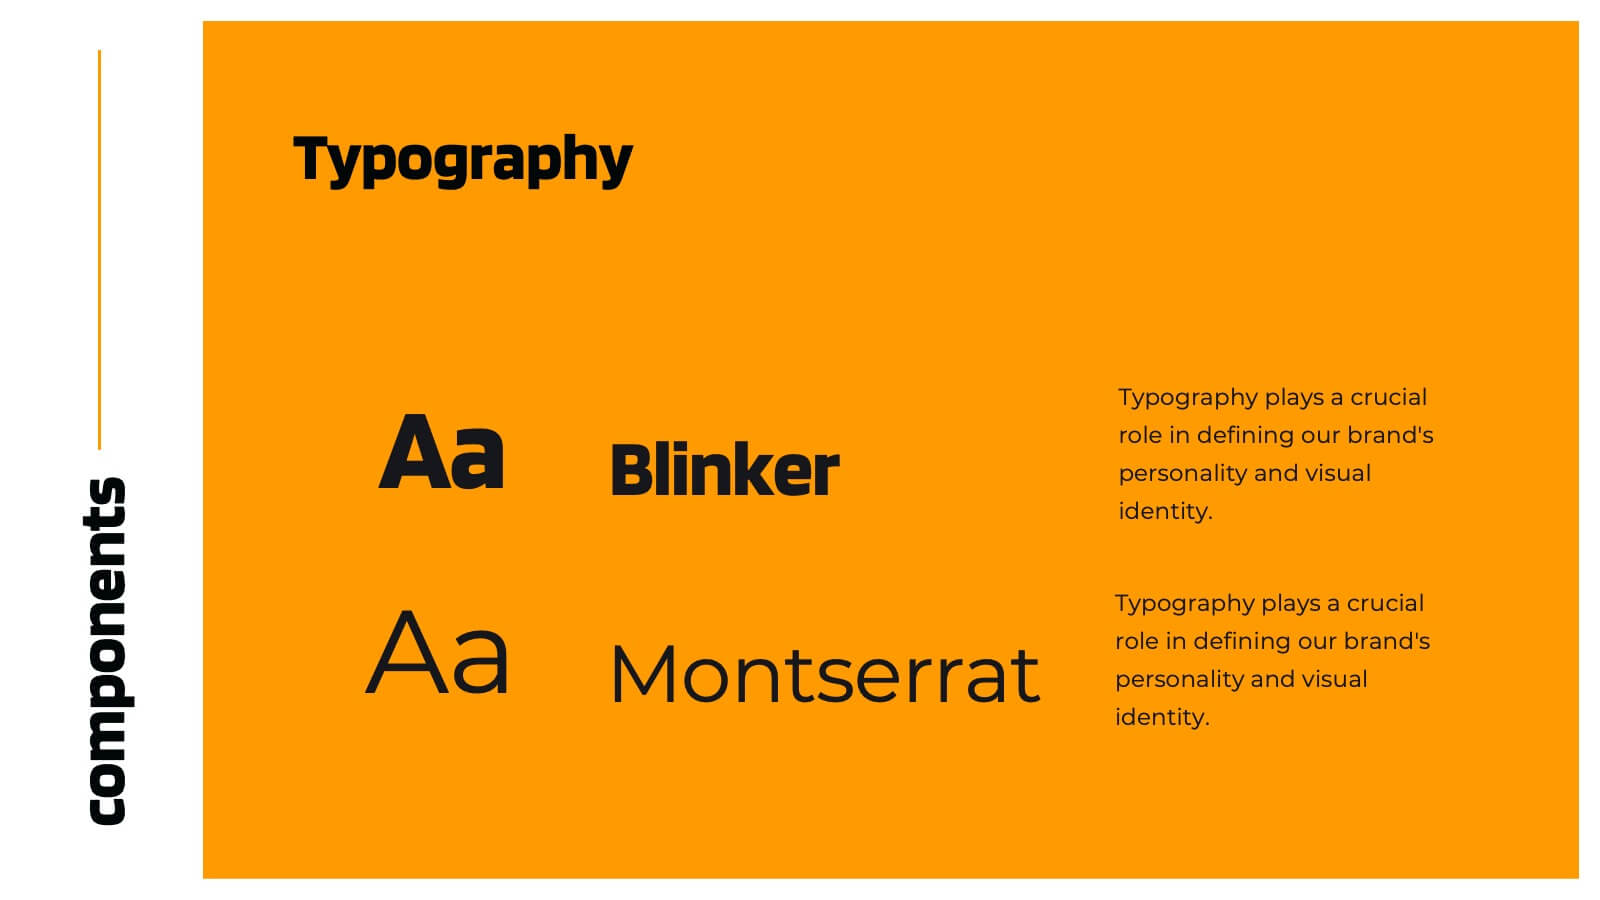
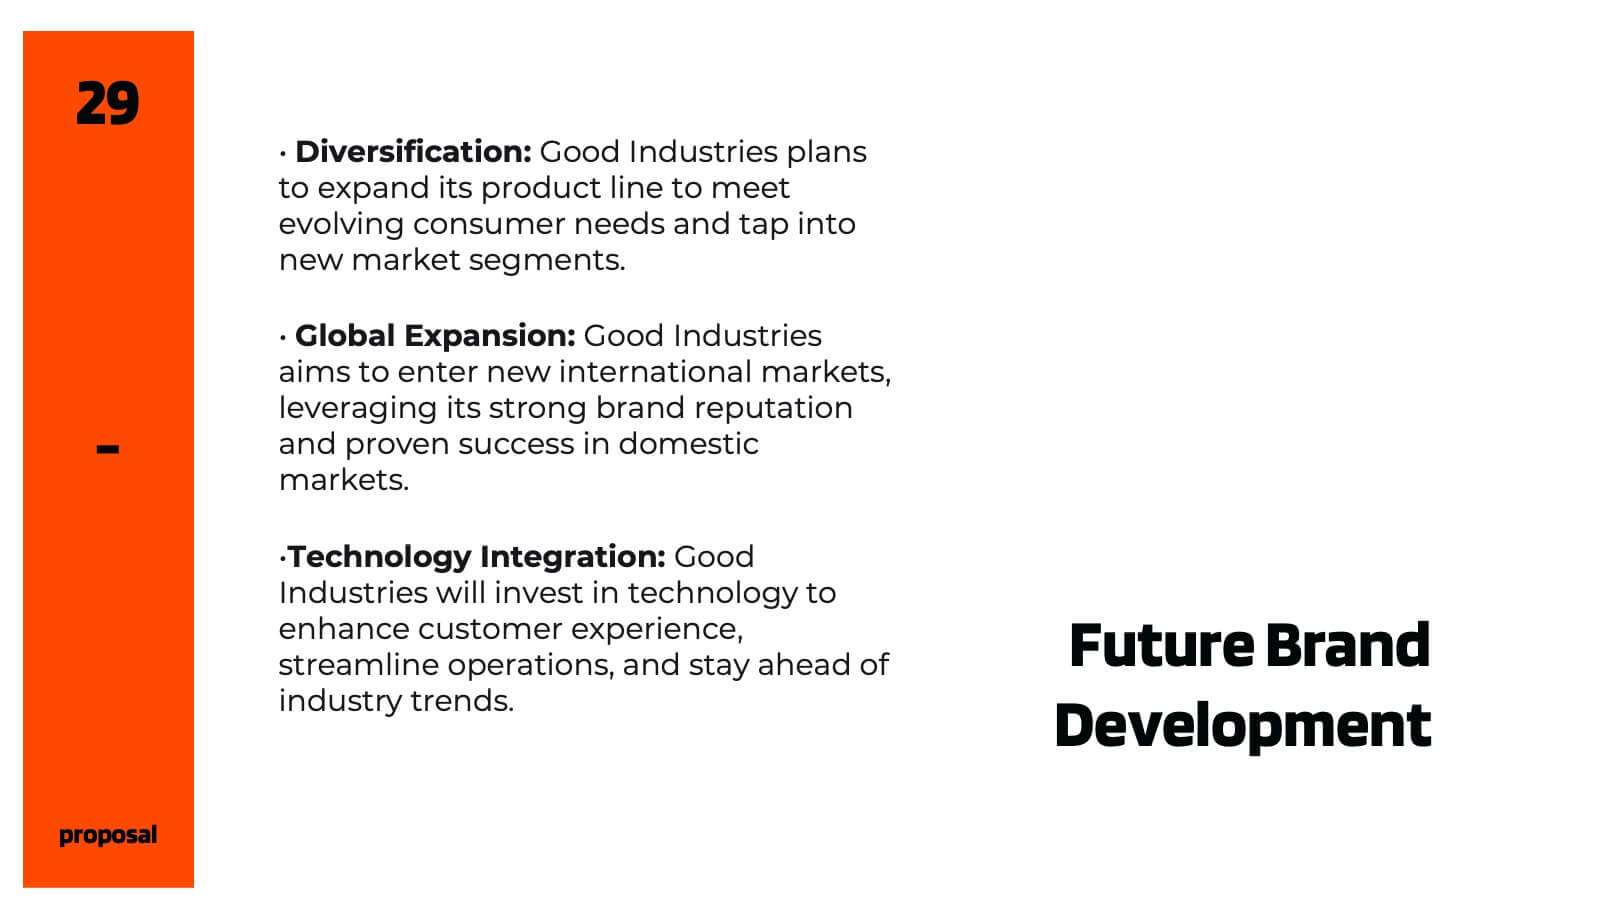
Chromalight Brand Guidelines Proposal Presentation
Elevate your brand's story with this visually engaging presentation template that embodies modern, professional aesthetics. From mission and vision statements to brand identity and market positioning, each slide is crafted to showcase your brand's core essence. Ideal for brand strategists and marketers, this template is compatible with PowerPoint, Keynote, and Google Slides.


6 diapositivas
Territorial Presence Across the Globe Presentation
Visualize your worldwide footprint with this territorial presence map. Highlight key regions using color-coded markers linked to strategic points, teams, or operations. Ideal for corporate overviews, investor updates, and expansion plans. Fully editable and easy to customize in PowerPoint, Keynote, or Google Slides for impactful global presentations.


6 diapositivas
KPI Overview in Dashboard Format Presentation
Track performance at a glance with this KPI Overview in Dashboard Format presentation. Featuring visual gauge meters and progress indicators, it's perfect for reporting on targets, performance metrics, and business KPIs. Clean and modern layout, fully customizable in Canva, PowerPoint, and Google Slides to match your data visualization needs.


8 diapositivas
Agriculture Business Model Presentation
Turn your ideas into growth with this vibrant and modern presentation design. Perfect for explaining market strategies, production cycles, or investment models in agriculture, it helps visualize key stages from concept to harvest. Fully customizable and compatible with PowerPoint, Keynote, and Google Slides for a seamless presentation experience.


5 diapositivas
Business Growth Cycle Presentation
Illustrate your company’s journey with the Business Growth Cycle slide. This dynamic layout features four sleek arrow segments that represent each phase of growth—from initiation to expansion. Color-coded steps and minimalist icons help guide the audience through your strategy clearly and efficiently. Ideal for outlining roadmaps, business stages, or workflow transitions. Fully editable and compatible with PowerPoint, Keynote, and Google Slides.


8 diapositivas
Environmental and Social Sustainability
Showcase your sustainability efforts with this layered pyramid slide, perfect for visualizing tiered environmental or social responsibility strategies. Ideal for ESG reporting, sustainability workshops, or stakeholder presentations. Fully customizable in PowerPoint, Keynote, and Google Slides to match your brand and message.


3 diapositivas
Project Completion Checklist Presentation
Keep projects on track with the Project Completion Checklist template. This structured layout helps you monitor tasks, update statuses, and document progress seamlessly. Featuring status indicators, date tracking, and notes sections, this template enhances productivity and organization. Fully customizable and compatible with PowerPoint, Keynote, and Google Slides for effortless use.


6 diapositivas
TAM SAM SOM for Target Reach Forecasting Presentation
Break down your market reach with clarity using the TAM SAM SOM for Target Reach Forecasting Presentation. This sleek, layered circle diagram is ideal for illustrating your total addressable market, serviceable market, and obtainable market. Customize easily in PowerPoint, Keynote, or Google Slides to align with your brand and business strategy.


4 diapositivas
Personal and Business Insurance Plans
Clearly present your insurance tiers with this easy-to-read comparison layout. Ideal for showcasing plan options for individuals, families, and businesses, this template highlights pricing, benefits, and coverage icons side-by-side. Clean and professional, it’s fully editable in PowerPoint, Keynote, and Google Slides.