


Características


¿Tienes alguna pregunta?
Recomendar


5 diapositivas
Flow Chart for Decision Trees
Clarify complex decisions with the Flow Chart for Decision Trees Presentation. This layout uses a vertical tree design with branching logic paths, making it perfect for outlining strategic choices, workflows, or evaluation criteria. Featuring five customizable sections with icon support and placeholder text, this template works seamlessly in PowerPoint, Keynote, and Google Slides.


20 diapositivas
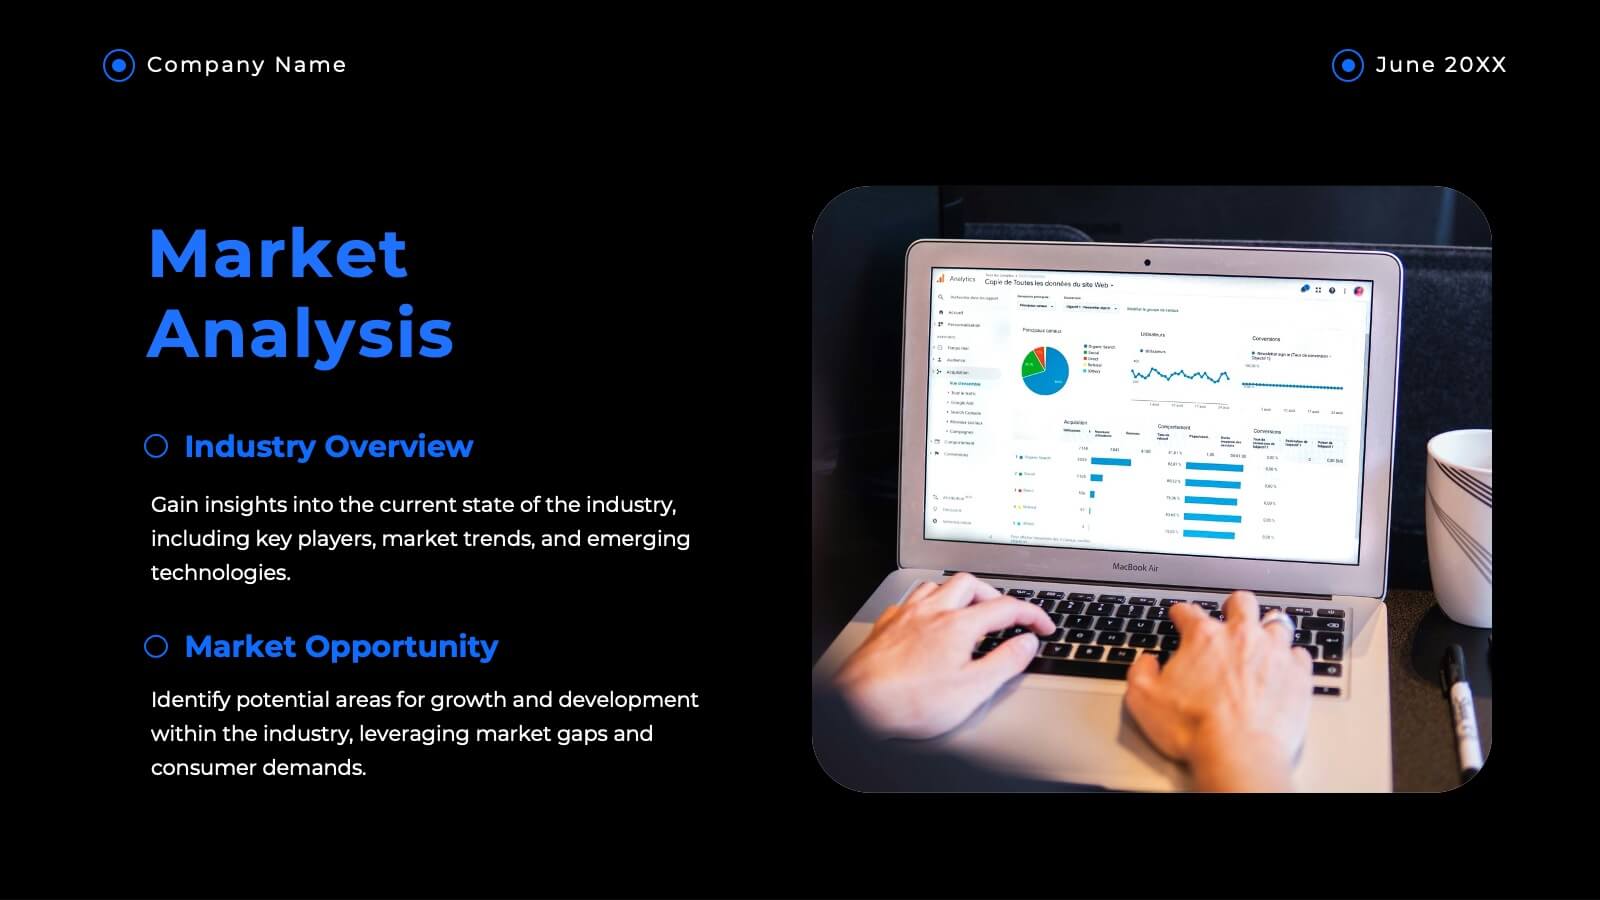
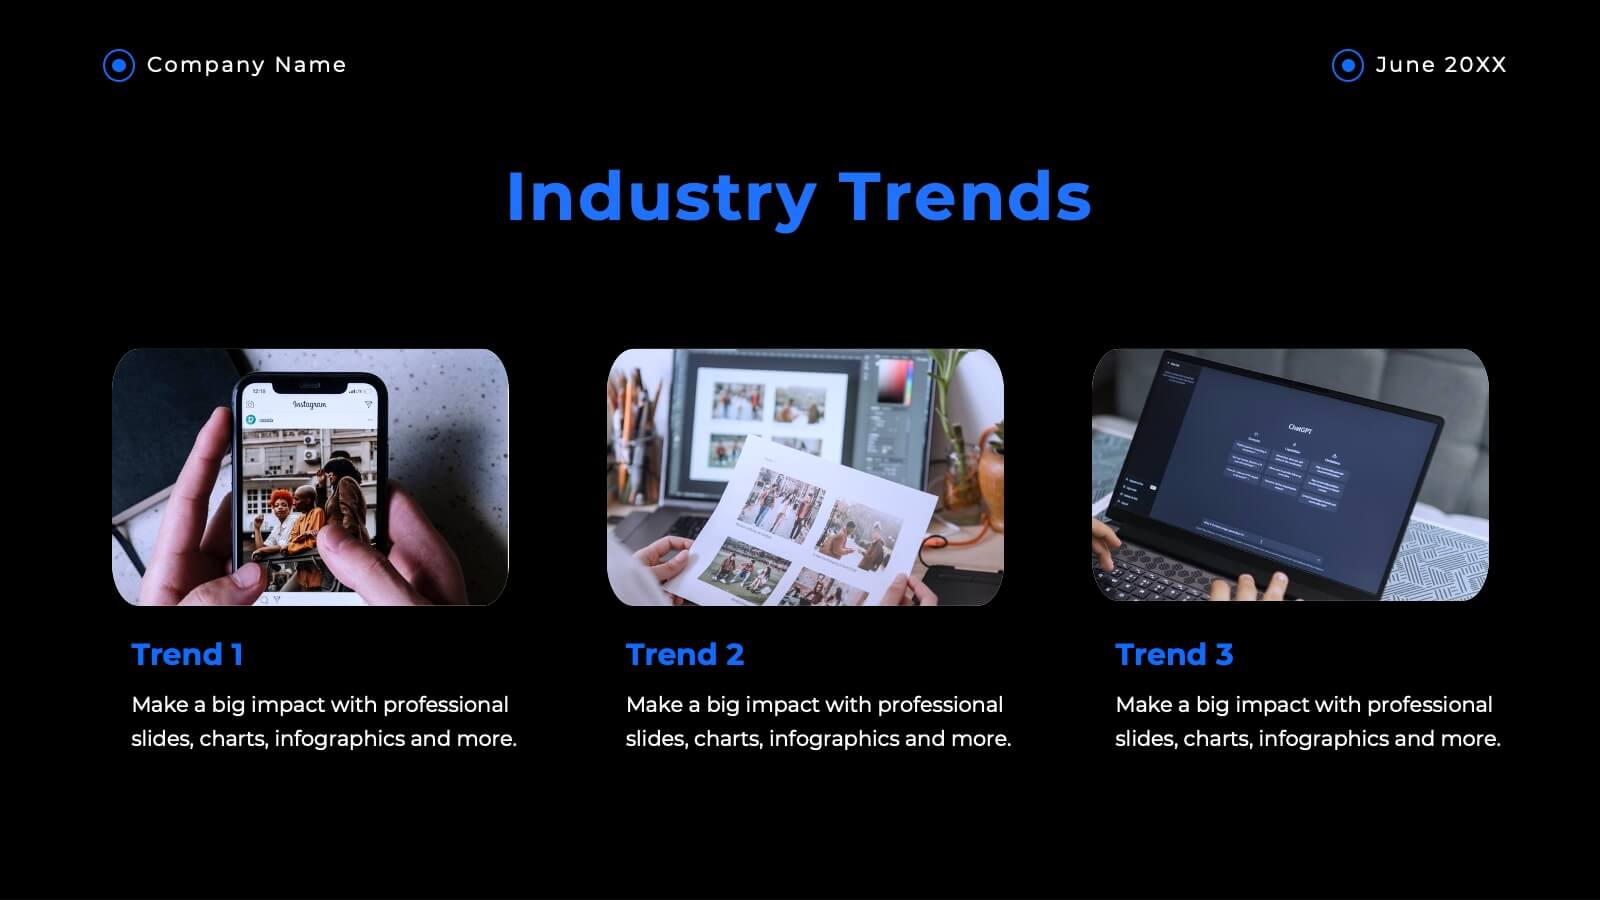
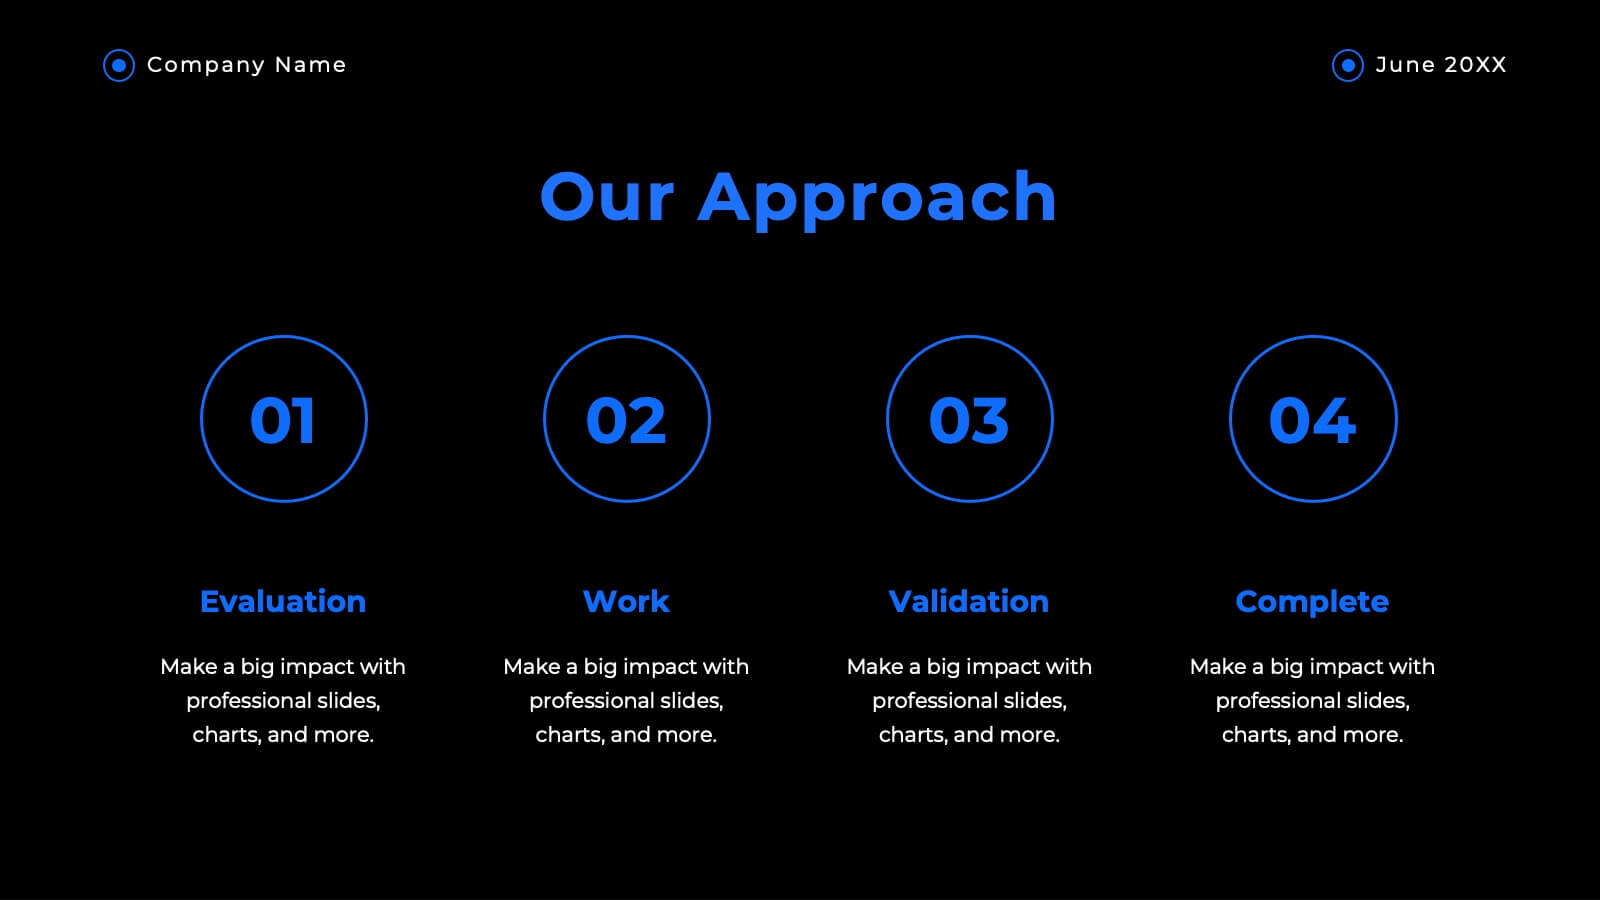
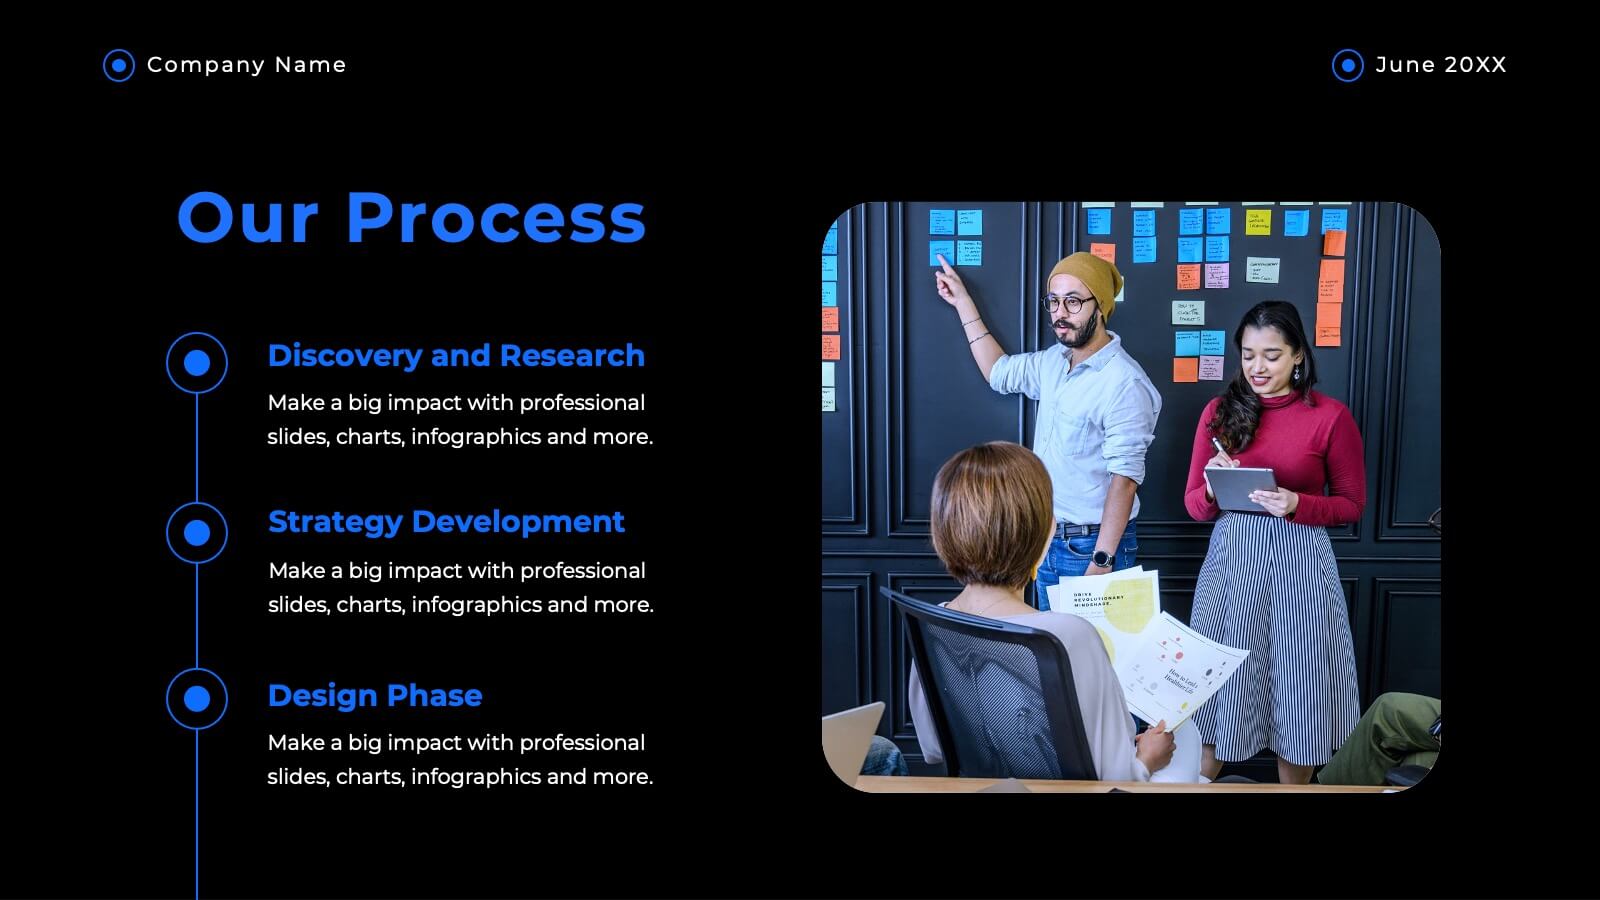
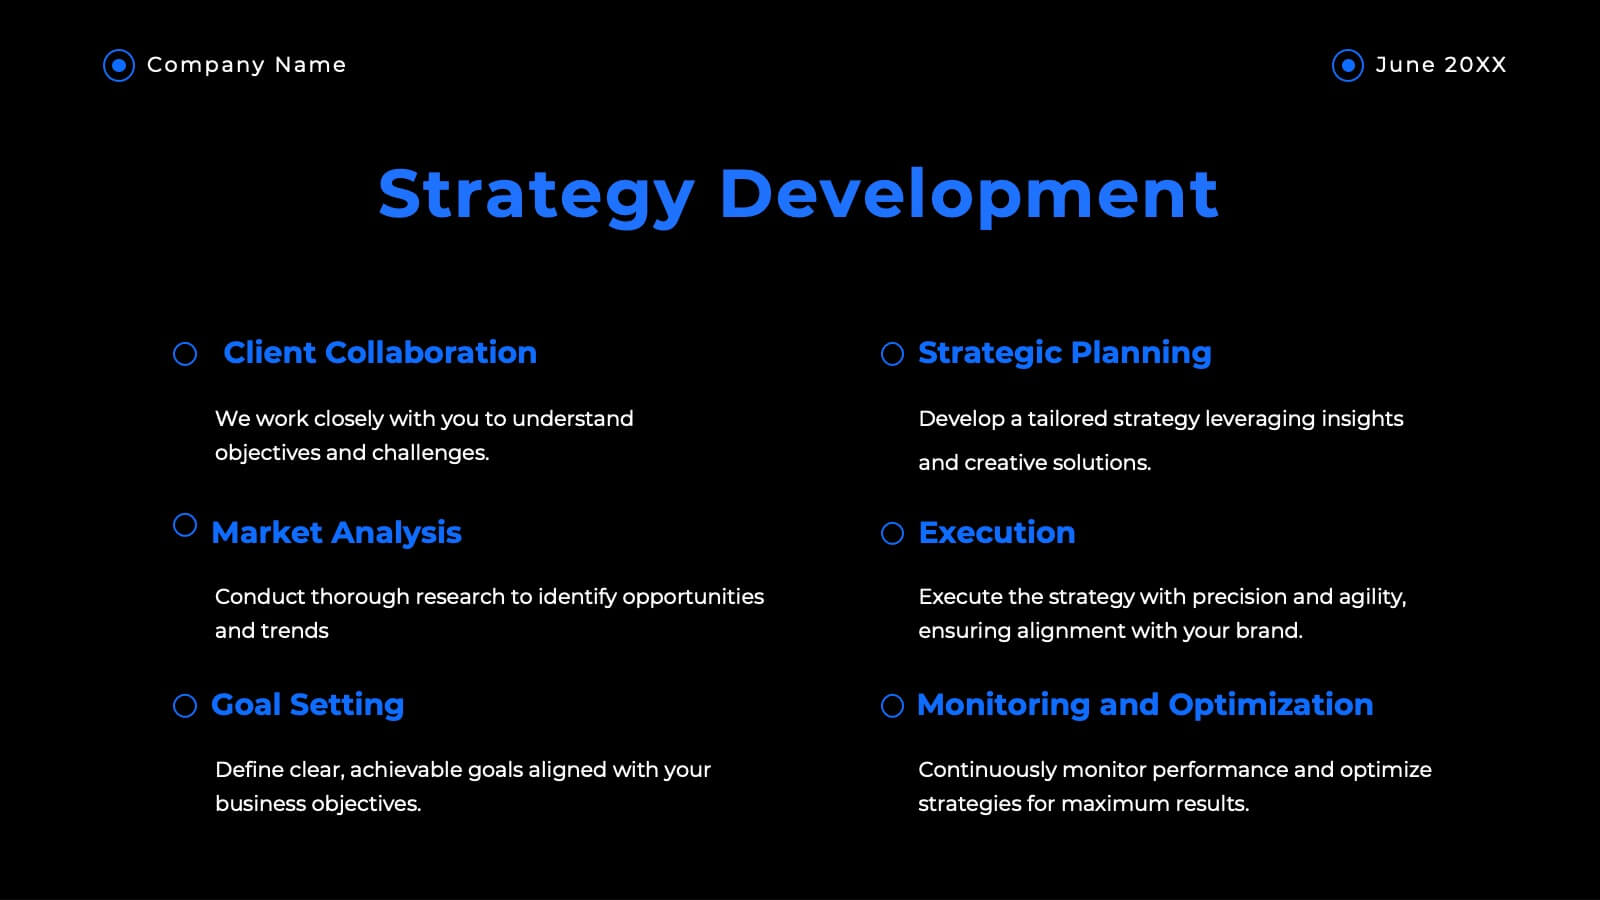
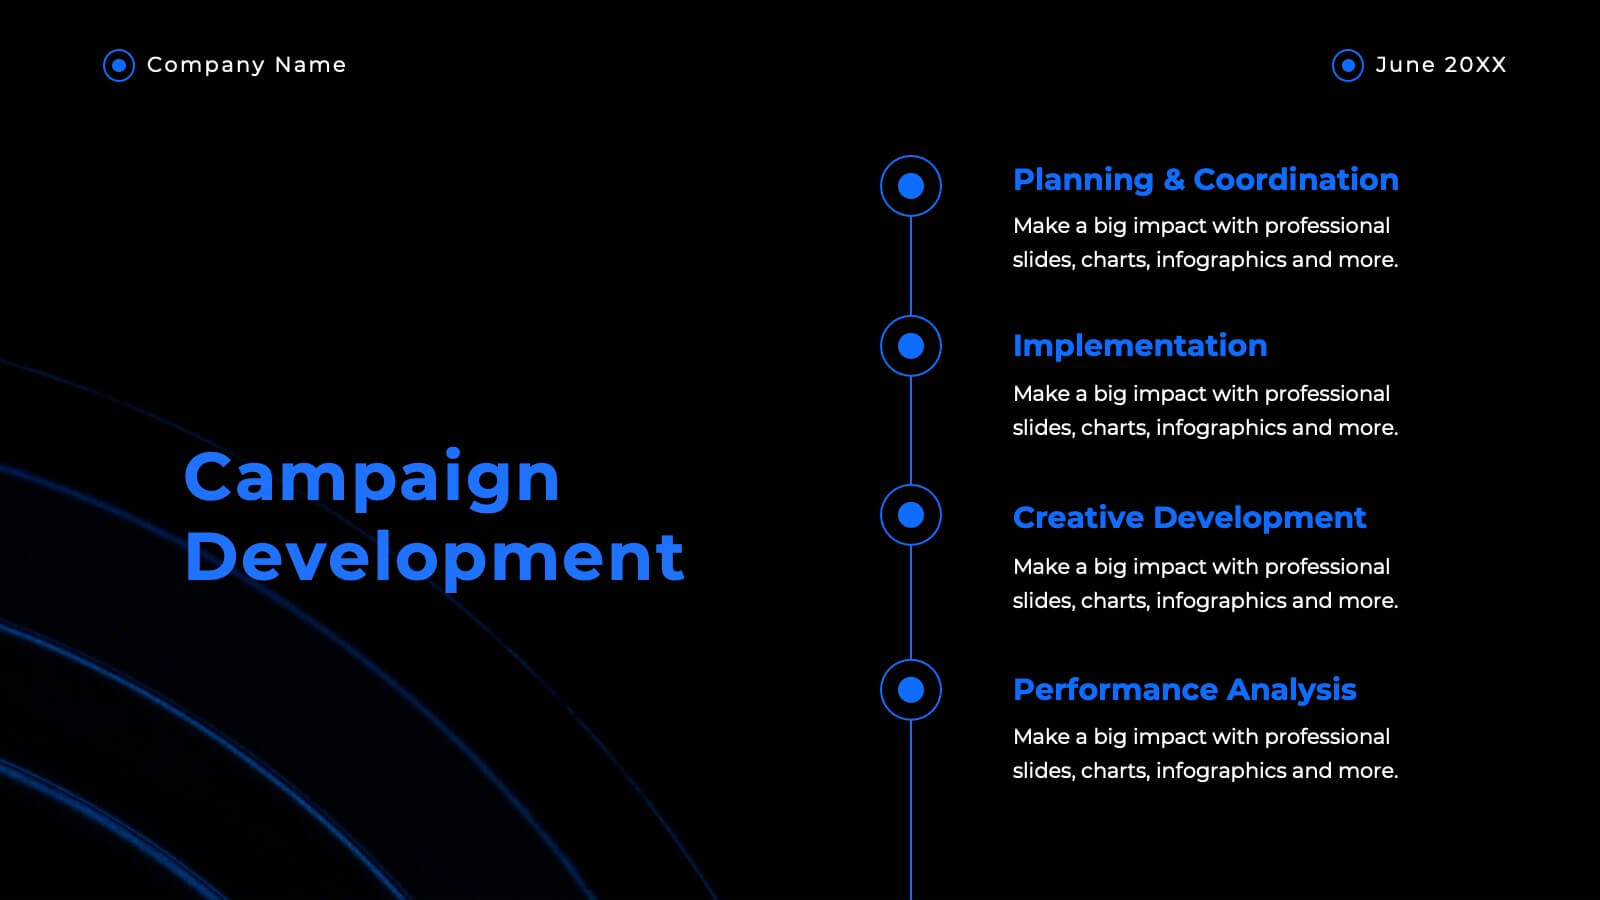
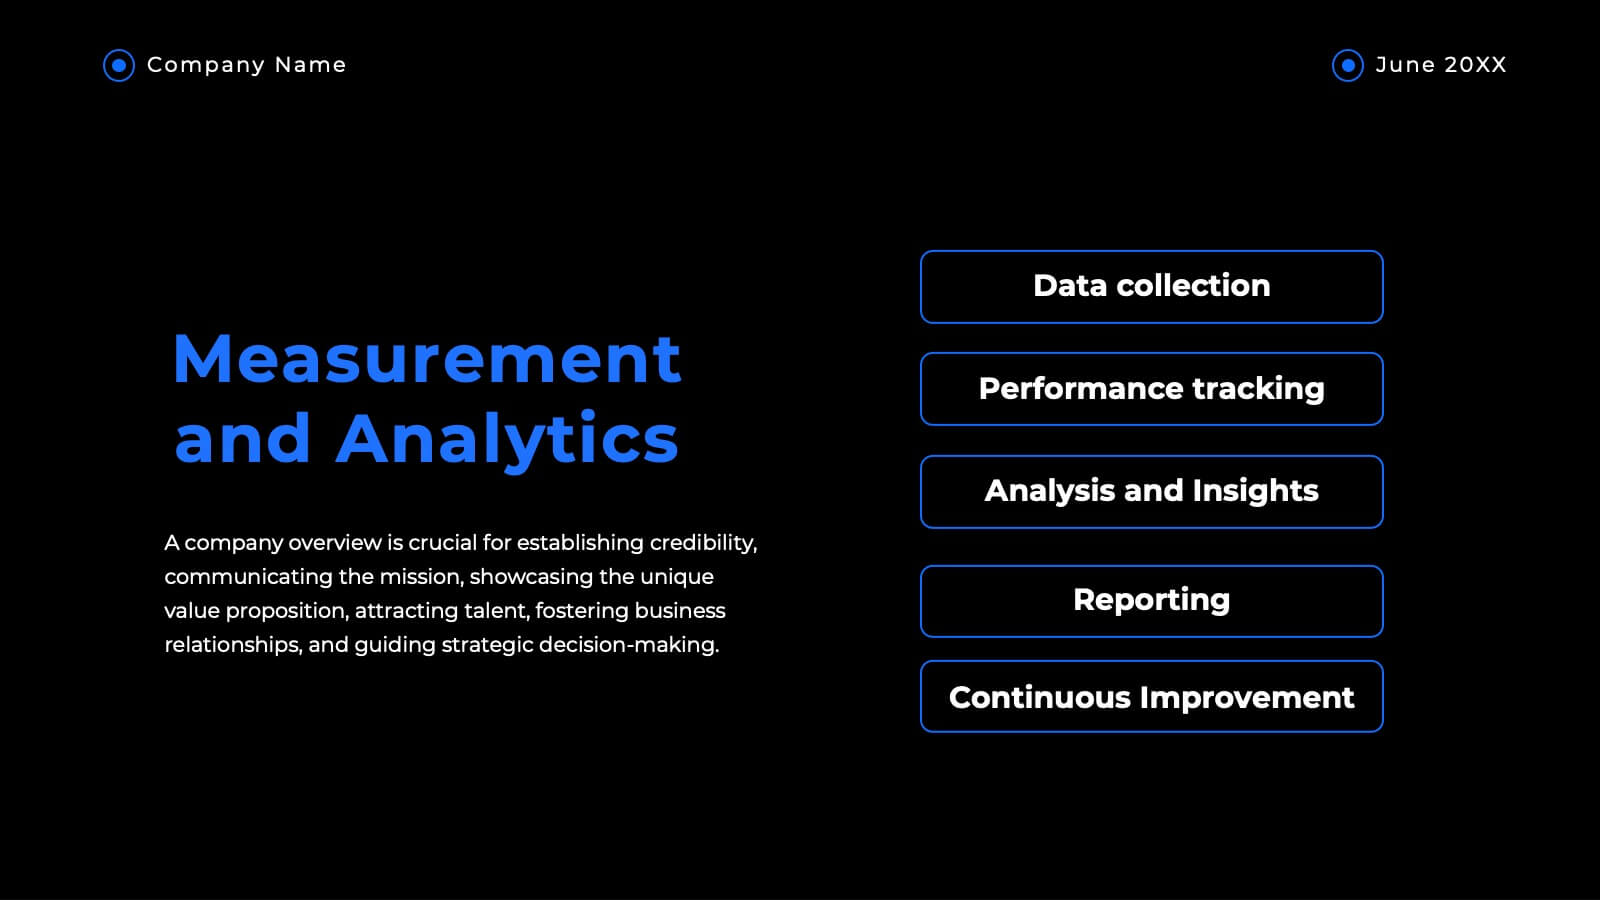
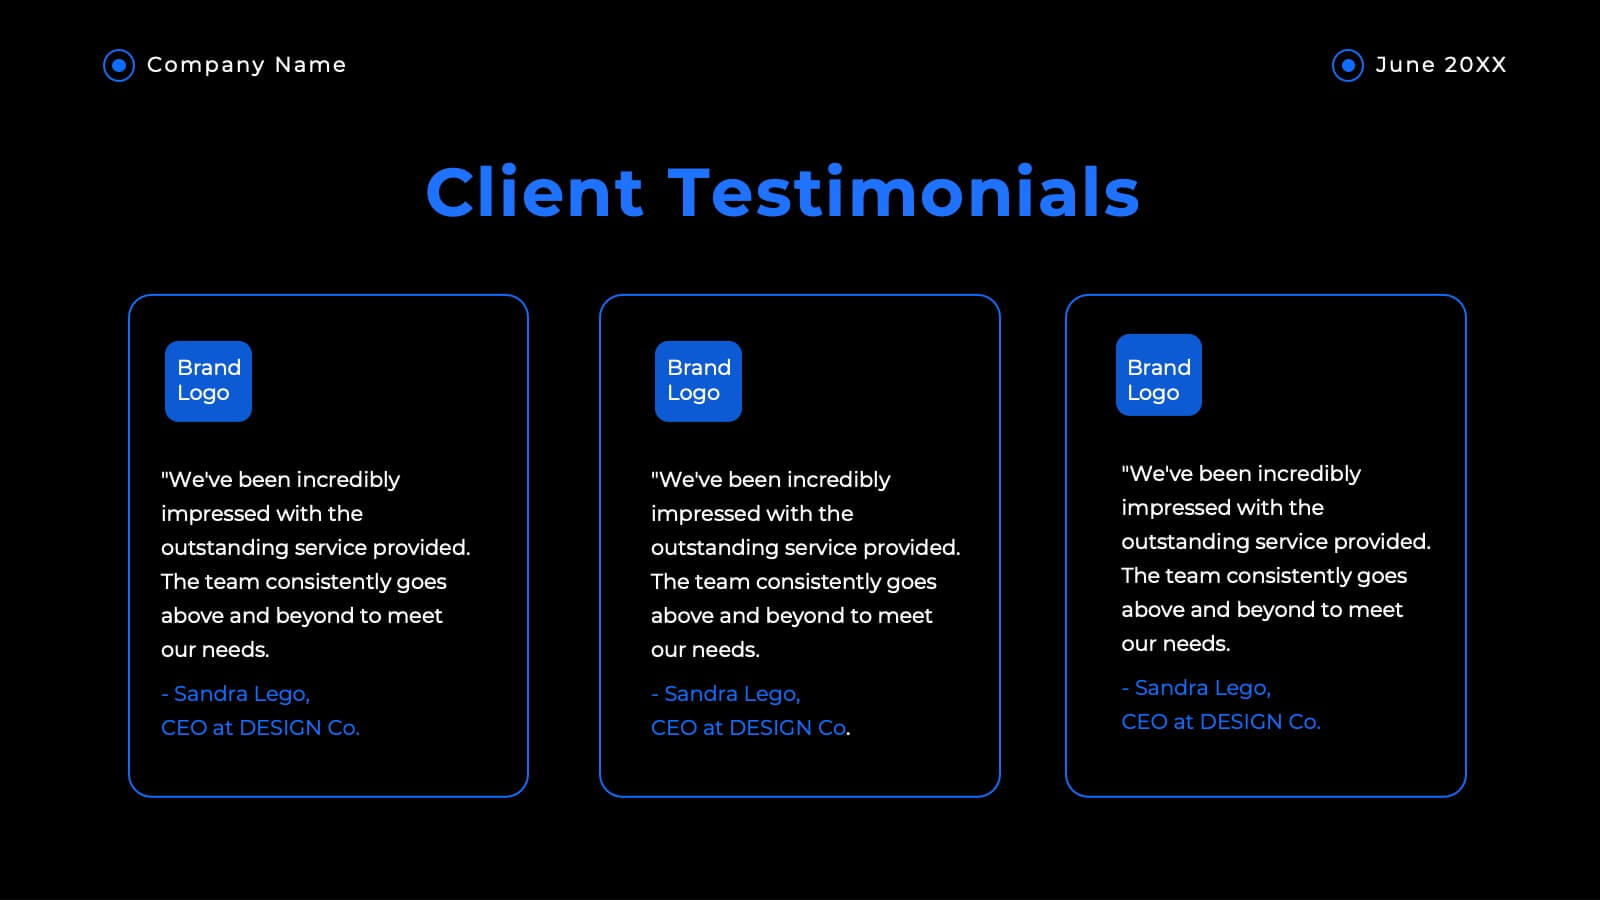
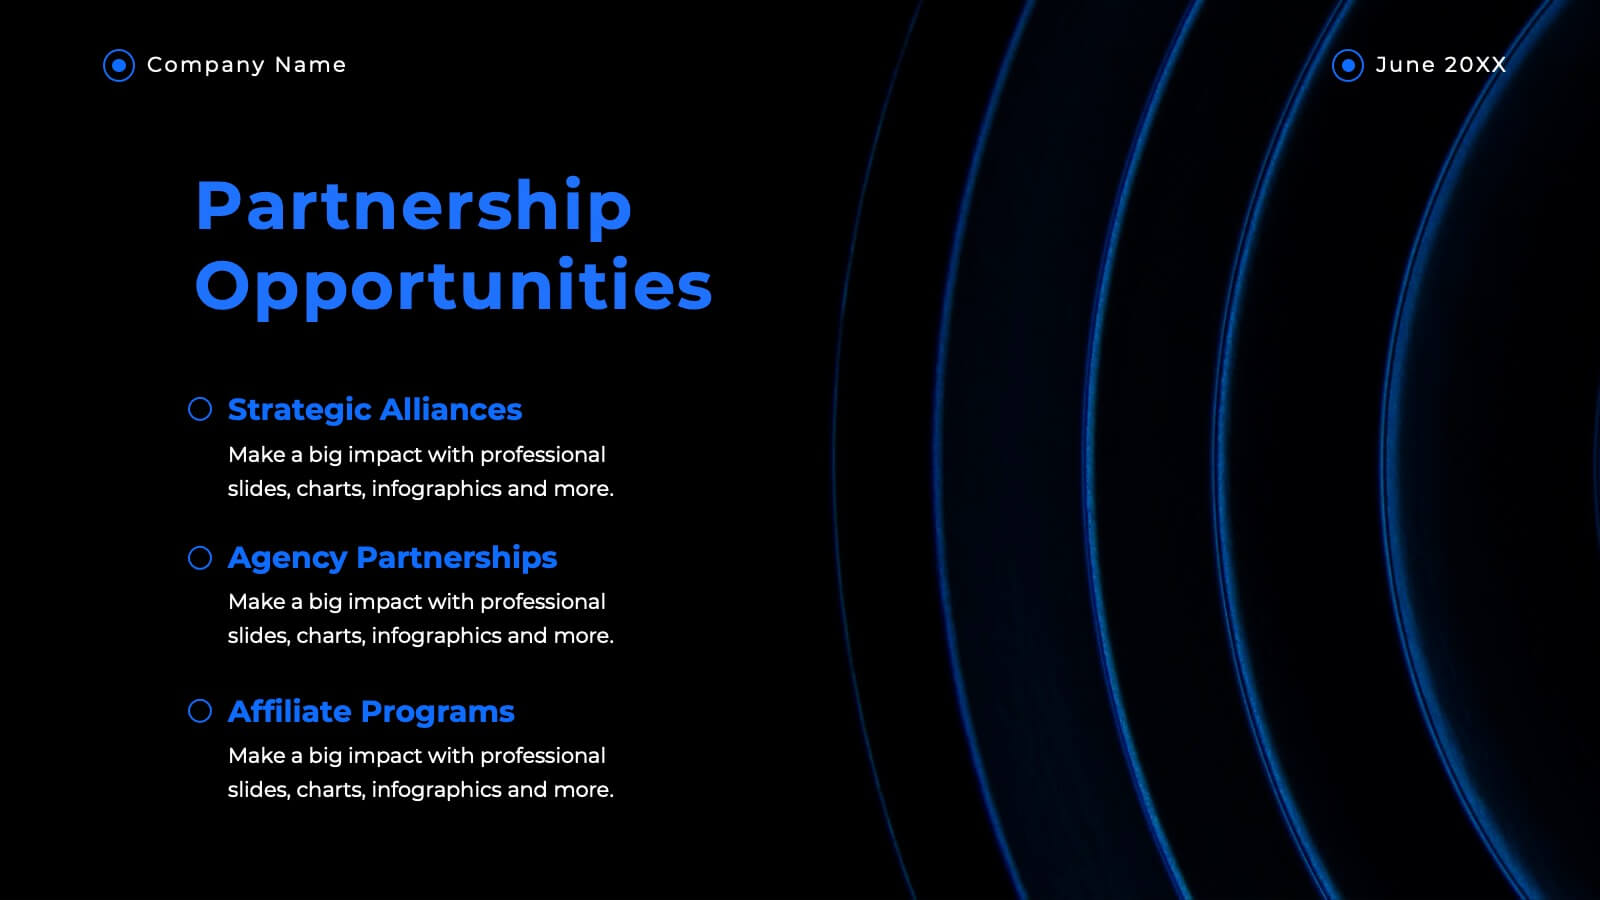
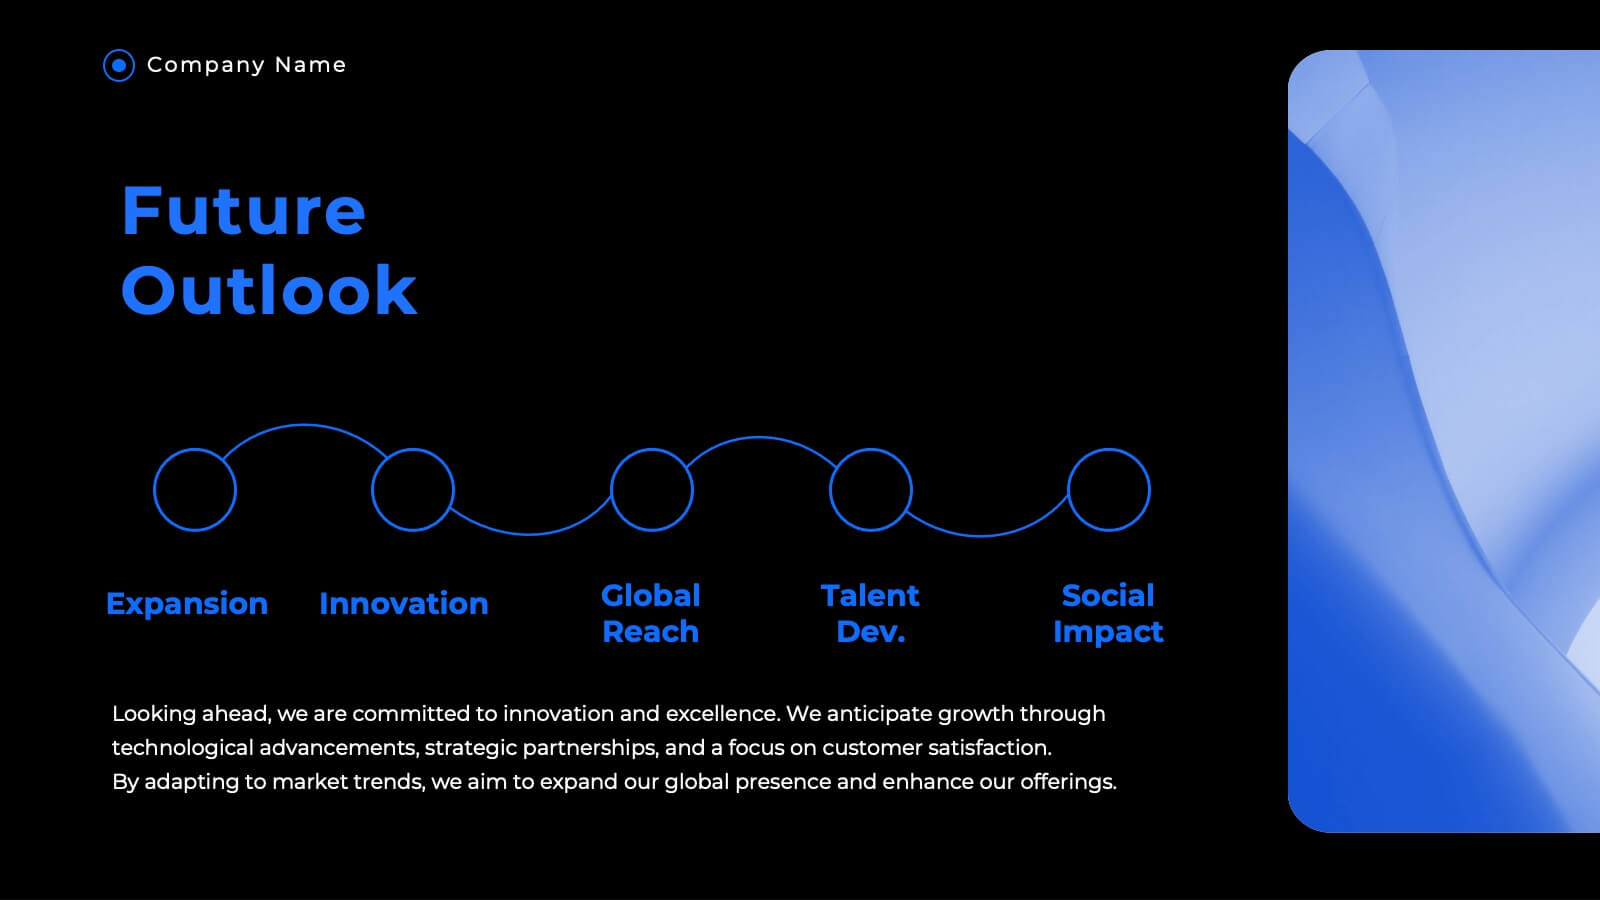
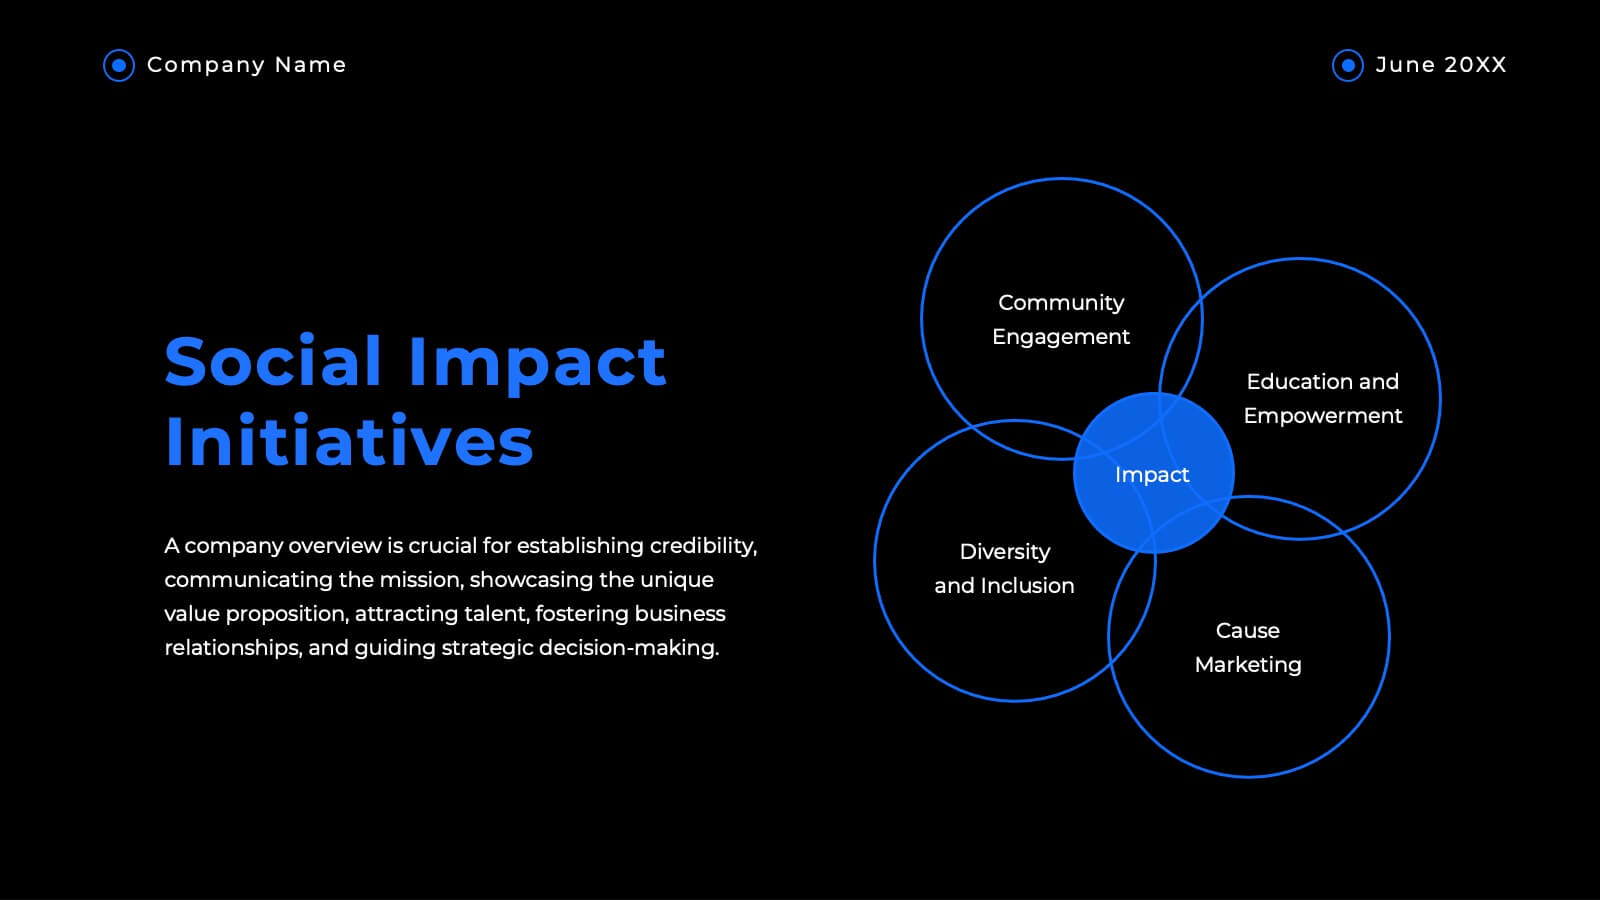
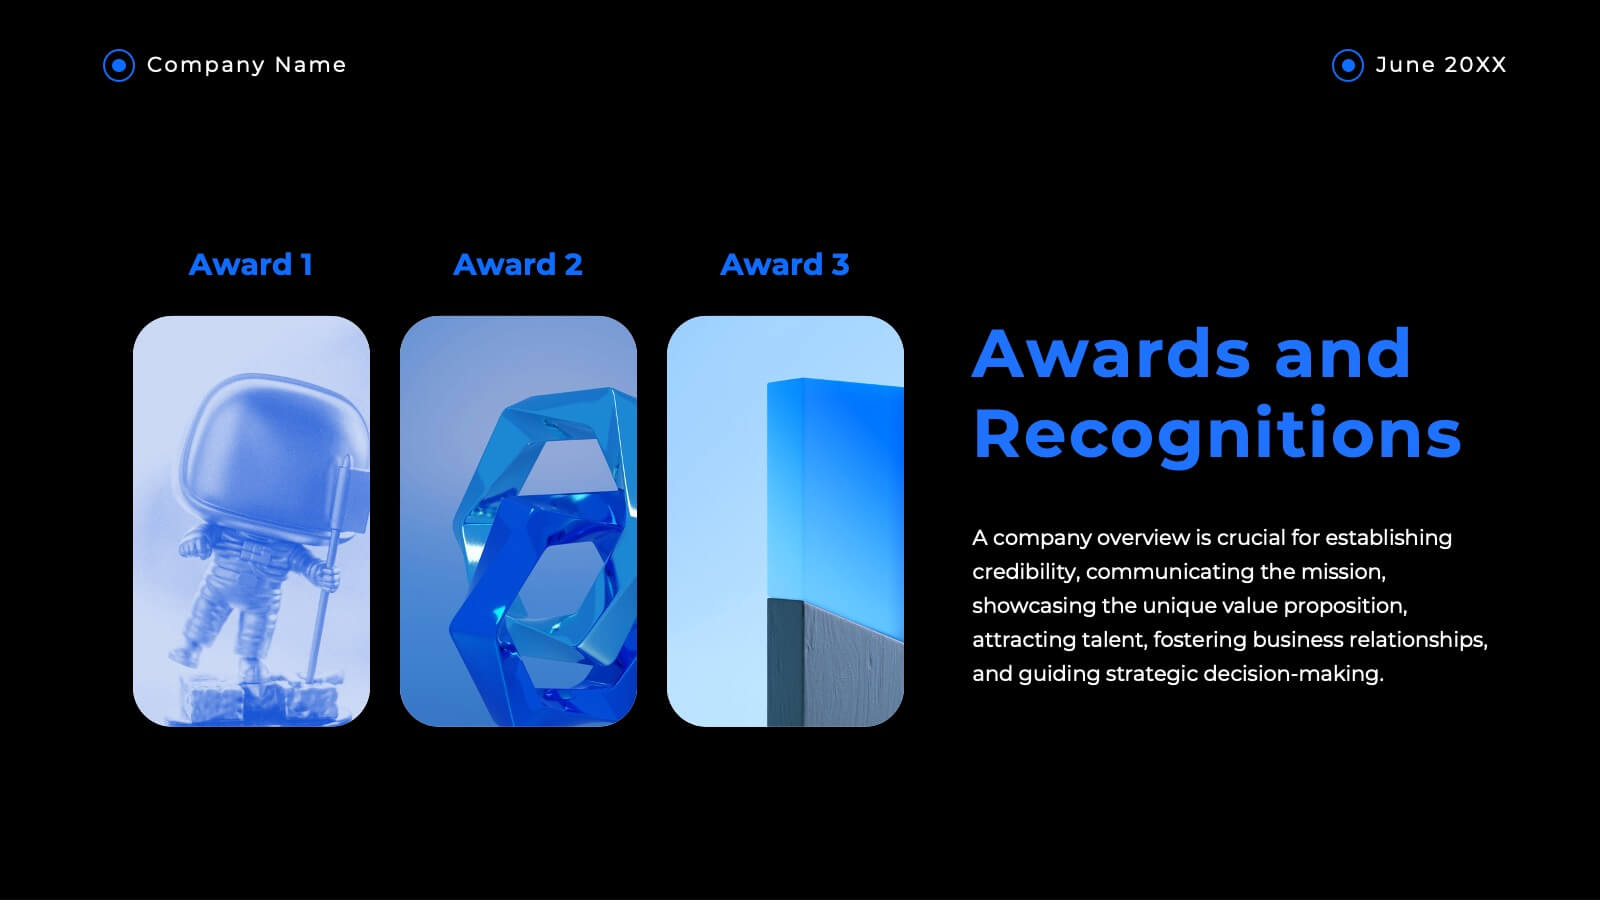
Ashen Sales Proposal Presentation
The Sales Proposal Presentation Template is designed to help you showcase your sales strategy effectively. With 20 fully customizable slides, it covers key areas such as market analysis, sales objectives, pricing strategy, and future opportunities. Ideal for professionals, it’s compatible with PowerPoint, Keynote, and Google Slides.


26 diapositivas
Warm Tones Real Estate Presentation
Create an engaging and inviting Warm Tone Real Estate presentation with this easy to use template. The color scheme of this welcoming template features warm tones to set the mood for a peaceful, natural environment. The cover slide features emerald green and brown, while the next two slides use warmer brown, tan shades, keeping the same theme going. Fully customizable, this template is ready to help you sell and promote properties quickly and easily. This layout is perfect for showcasing properties with a premium feel that’ll inspire confidence in both buyers and sellers alike.


5 diapositivas
Workplace Safety Guidelines and Protocols Presentation
Prioritize health and hazard awareness with the Workplace Safety Guidelines and Protocols presentation. Featuring a clean visual of a segmented fire extinguisher, this design clearly breaks down safety measures into five customizable steps. Ideal for internal training, HR onboarding, or compliance meetings, each section is paired with editable titles and descriptive placeholders. Communicate procedures like emergency response, equipment use, or safety checklists effectively. Compatible with PowerPoint, Keynote, and Google Slides, this template ensures your team stays informed and aligned.


7 diapositivas
Pyramid Scheme Infographic Presentation
A Pyramid Infographic is a great way to organize, highlight, and illustrate your ideas and content. This design uses visual hierarchy and colors to convey key information in an attractive way. The Pyramid incorporates colorful diagrams to allows your text to stand out while it is set against a white background. This is a simple, engaging design that can be easily edited. This is great for analyzing data and it is the perfect choice to impress the audience. It will surely help you convey your message in a much better way. It's a great way to communicate the key points of your Infographic.


6 diapositivas
Geographic Asia Overview Template Presentation
Discover insights across Asia with a clean, professional layout that brings your regional data to life. Perfect for showcasing demographics, market distribution, or geographic highlights, this visual map design ensures clarity and impact in every slide. Fully compatible with PowerPoint, Keynote, and Google Slides for effortless editing and presentation.


26 diapositivas
Personal Finance Management Presentation
Dive into the essentials of personal finance management with this comprehensive presentation template designed to empower individuals to achieve financial stability and growth. The template begins with an introduction that outlines the importance of effective financial management and the objectives of the presentation. It serves as a roadmap for those seeking to understand and enhance their financial literacy. In the main content section, the template offers detailed slides covering a variety of topics crucial for managing personal finances, such as budgeting strategies, savings plans, investment options, and debt management. Each slide is designed with clarity and focus, using engaging visuals and concise bullet points to explain complex financial concepts in an accessible manner. Features like comparison slides, process infographics, and timeline visuals help illustrate the progression and impact of good financial practices over time. The final segment ensures the presentation is practical for all users by confirming compatibility with popular platforms like PowerPoint, Google Slides, and Keynote. This ensures that the template can be easily accessed and utilized across different devices and settings, making it a versatile tool for individuals, financial advisors, or educational workshops looking to promote sound financial habits.


3 diapositivas
Corporate Sustainabilitiy Management Strategy Presentation
Drive your company’s future with a presentation that blends strategy, innovation, and sustainability. Designed to communicate eco-friendly initiatives and long-term business goals, it helps visualize performance, impact, and growth clearly. Fully customizable and compatible with PowerPoint, Keynote, and Google Slides for seamless, professional, and engaging sustainability presentations.
4 diapositivas
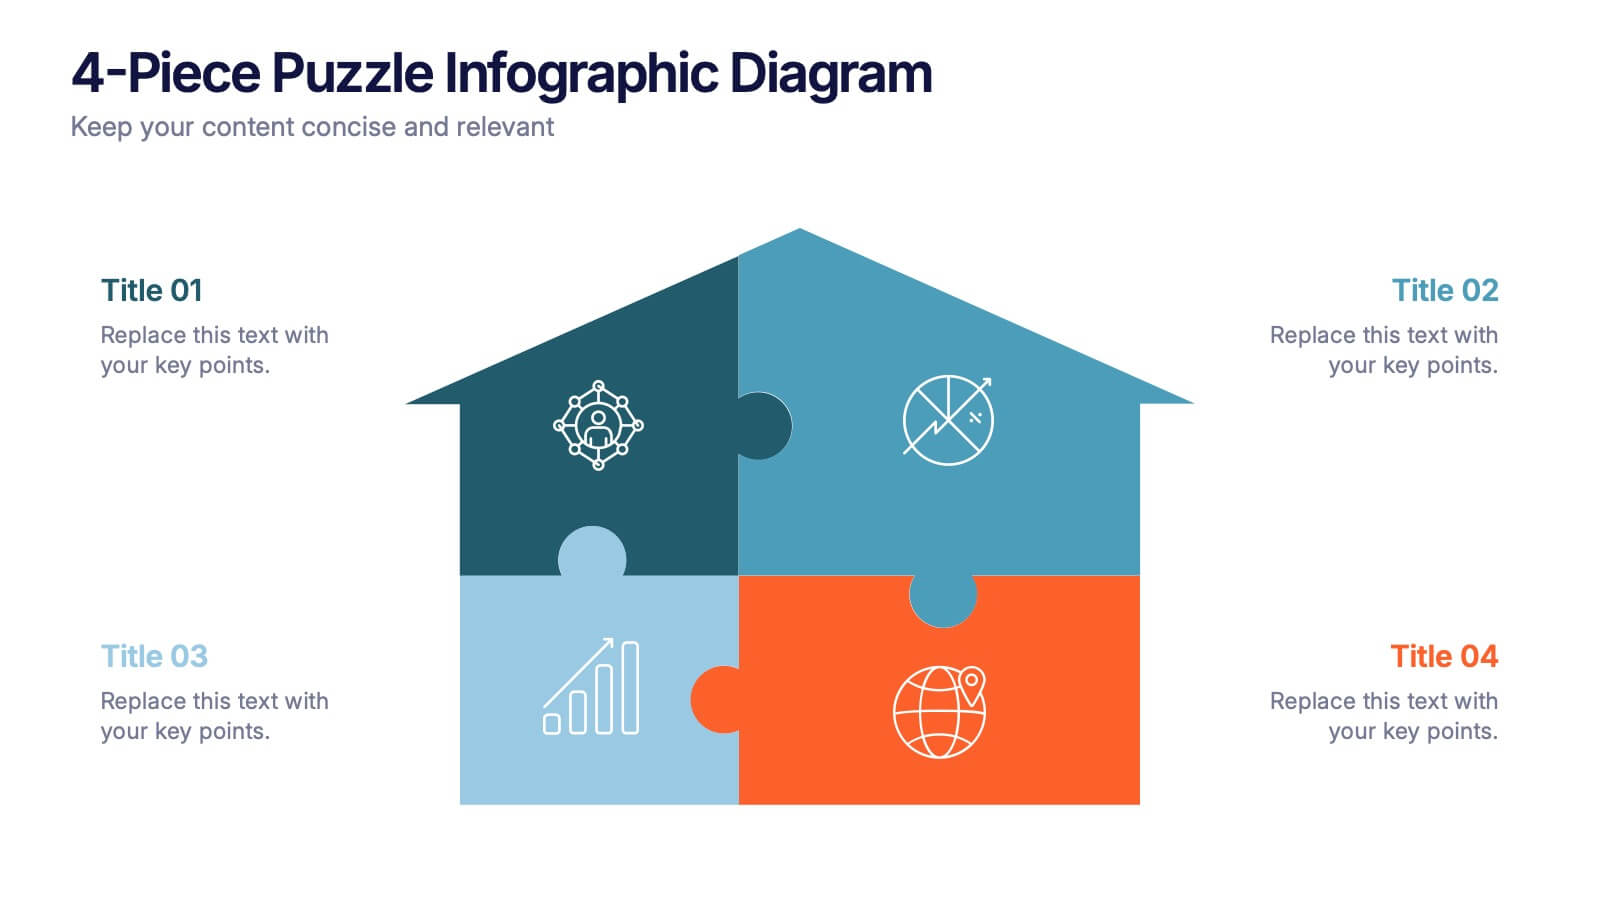
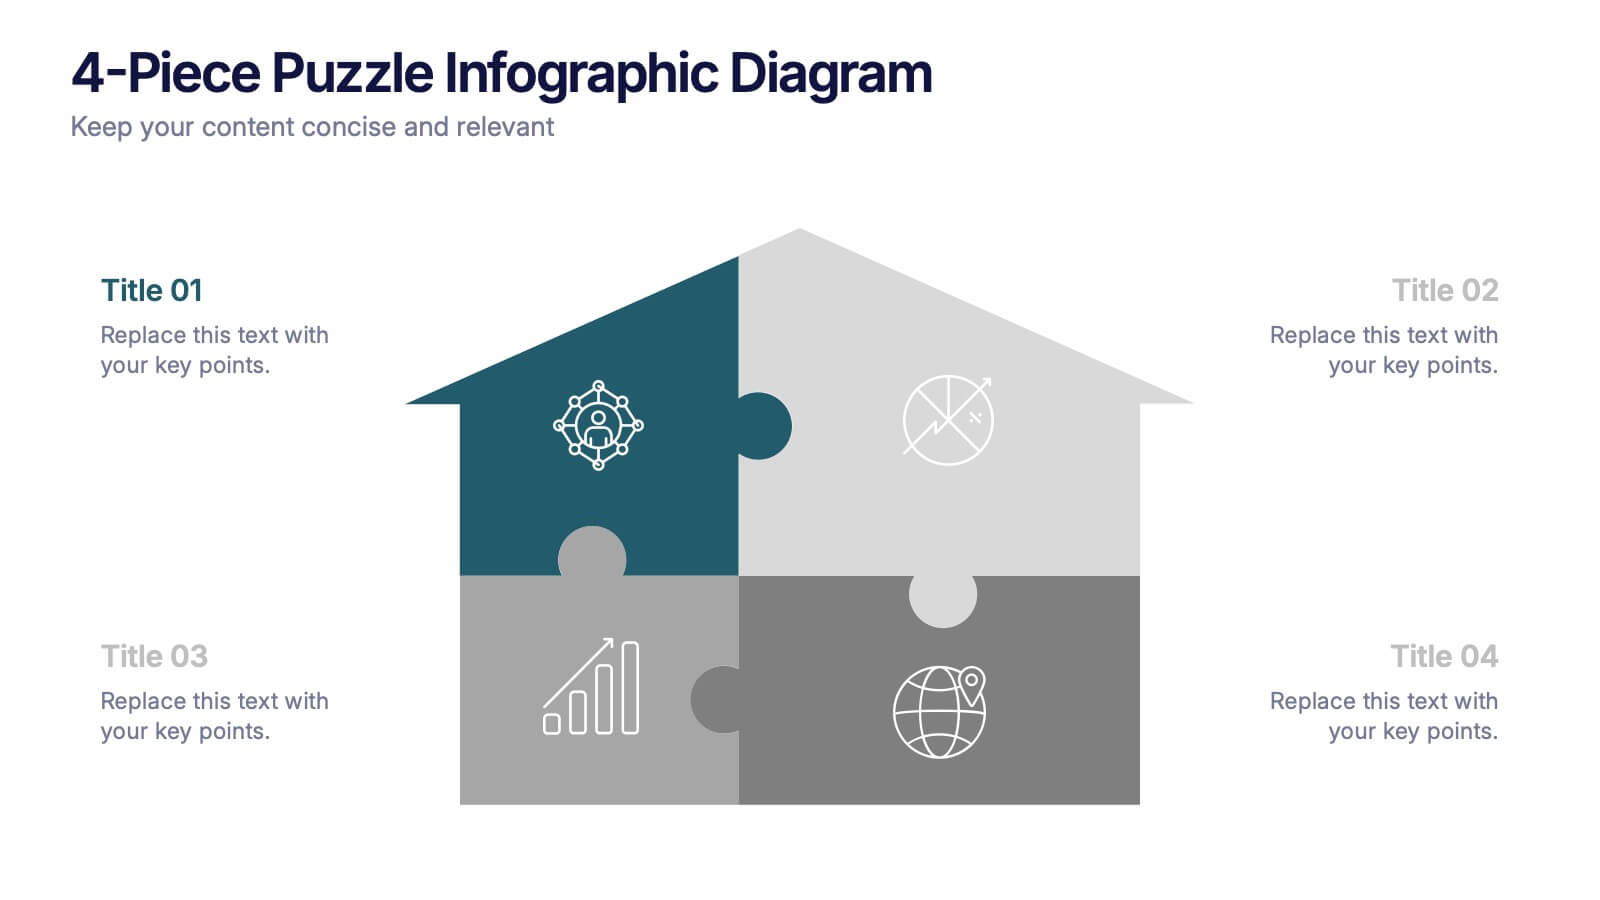
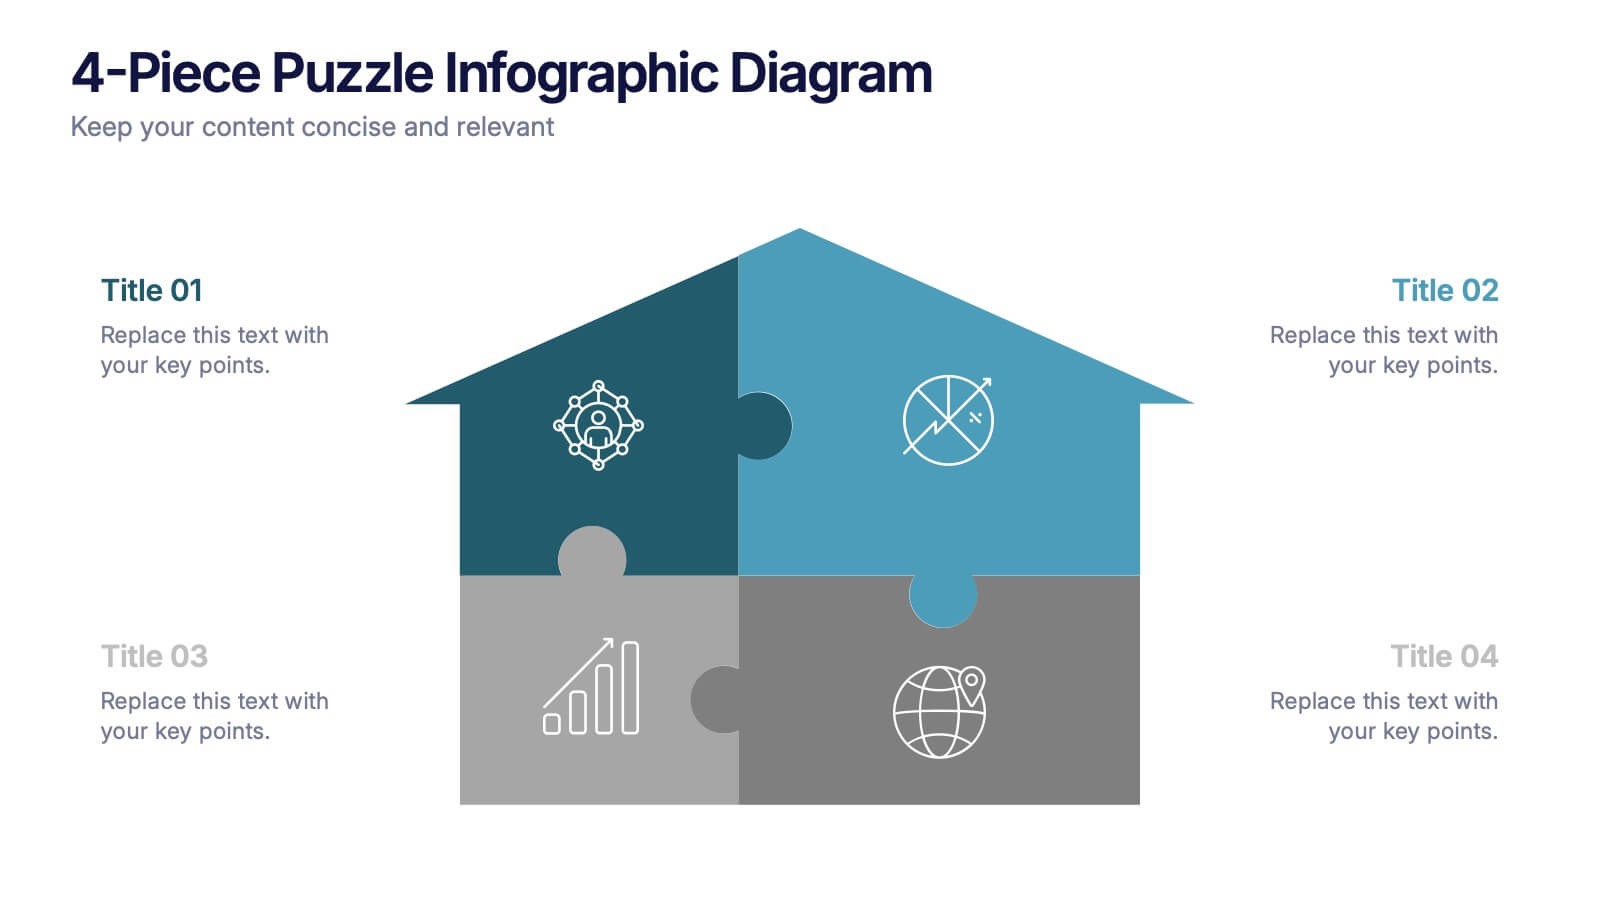
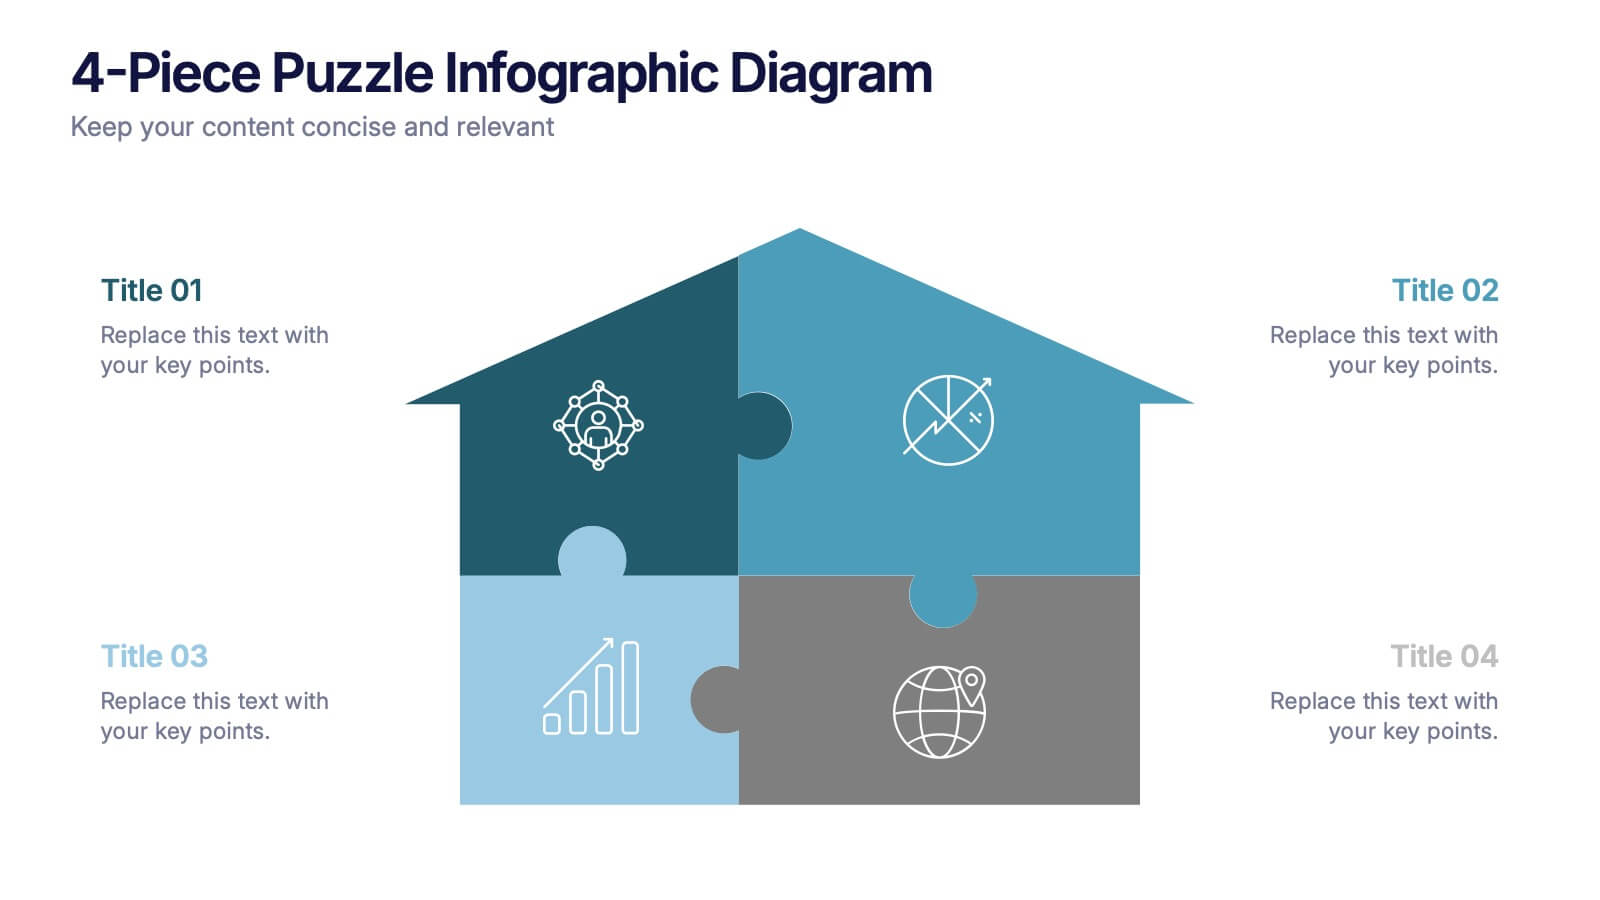
4-Piece Puzzle Infographic Diagram Presentation
Bring clarity and impact to your message with a visual layout that snaps big ideas together like a puzzle. This presentation helps you break complex concepts into four connected sections, making explanations easier and more engaging for any audience. Ideal for planning, insights, or strategy sessions. Fully compatible with PowerPoint, Keynote, and Google Slides.


6 diapositivas
Website Optimization and Traffic Insights Presentation
This infographic set helps break down complex analytics into bite-sized, visually engaging pieces. Use these slides to highlight traffic sources, performance metrics, user journeys, and conversion flows in a circular format that keeps viewers focused. These templates are fully customizable and compatible with PowerPoint, Keynote, and Google Slides.


6 diapositivas
Business Decision Flow Model Presentation
Make smarter choices with this Business Decision Flow Model presentation. Clearly map out key decisions, steps, and potential outcomes using a structured, color-coded flow. Perfect for strategy reviews, team meetings, and executive briefings. Fully editable in Canva, PowerPoint, and Google Slides for seamless customization.
22 diapositivas
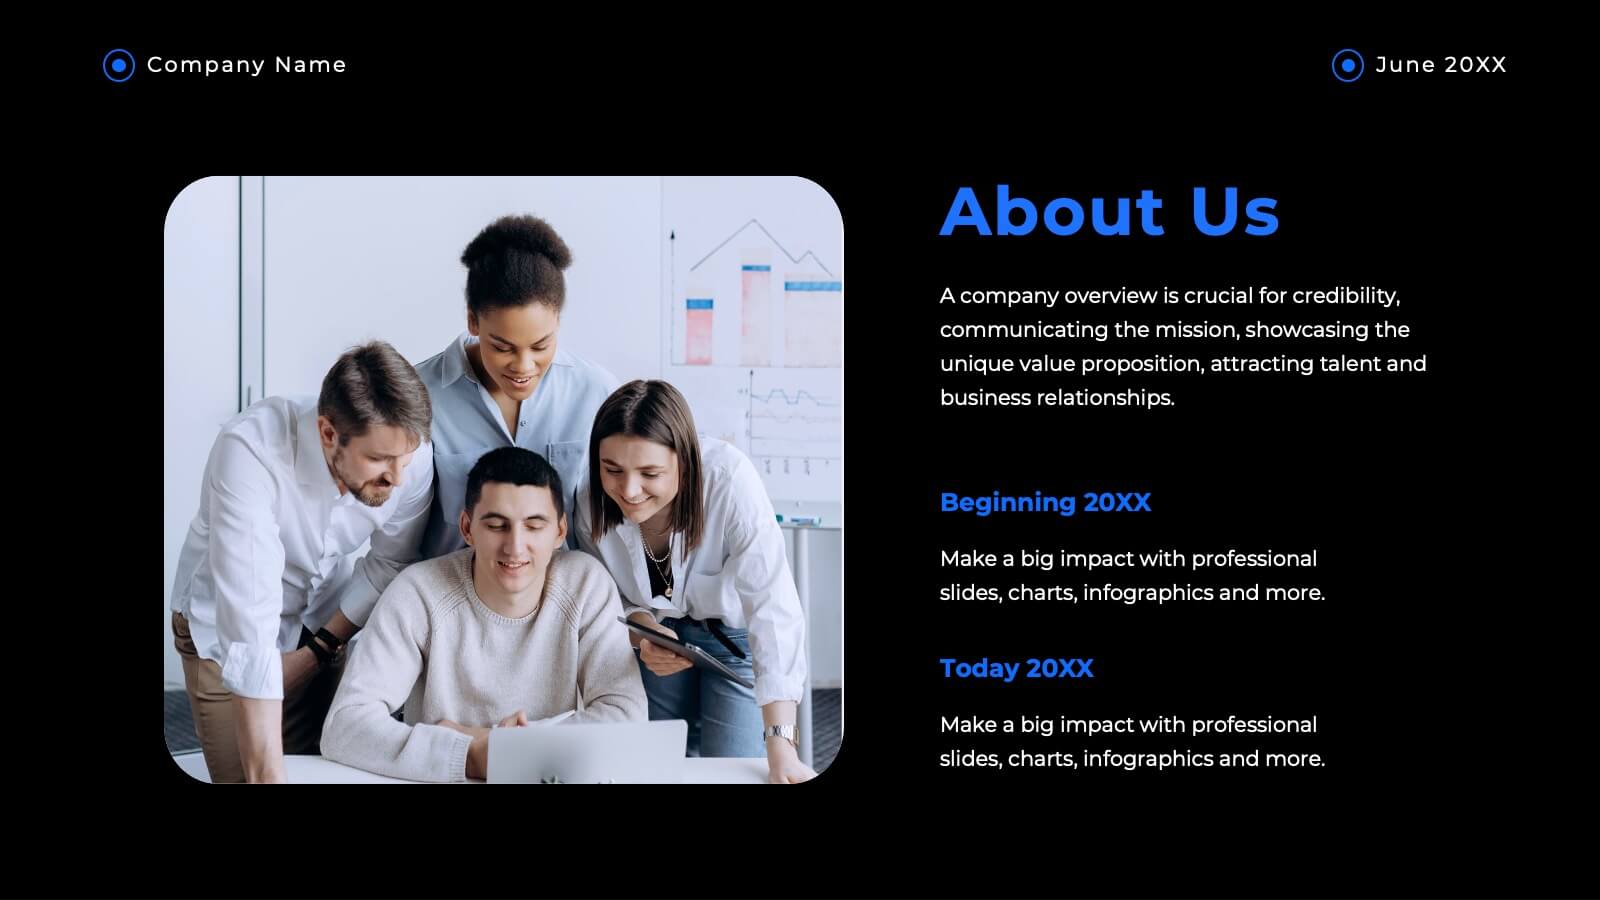
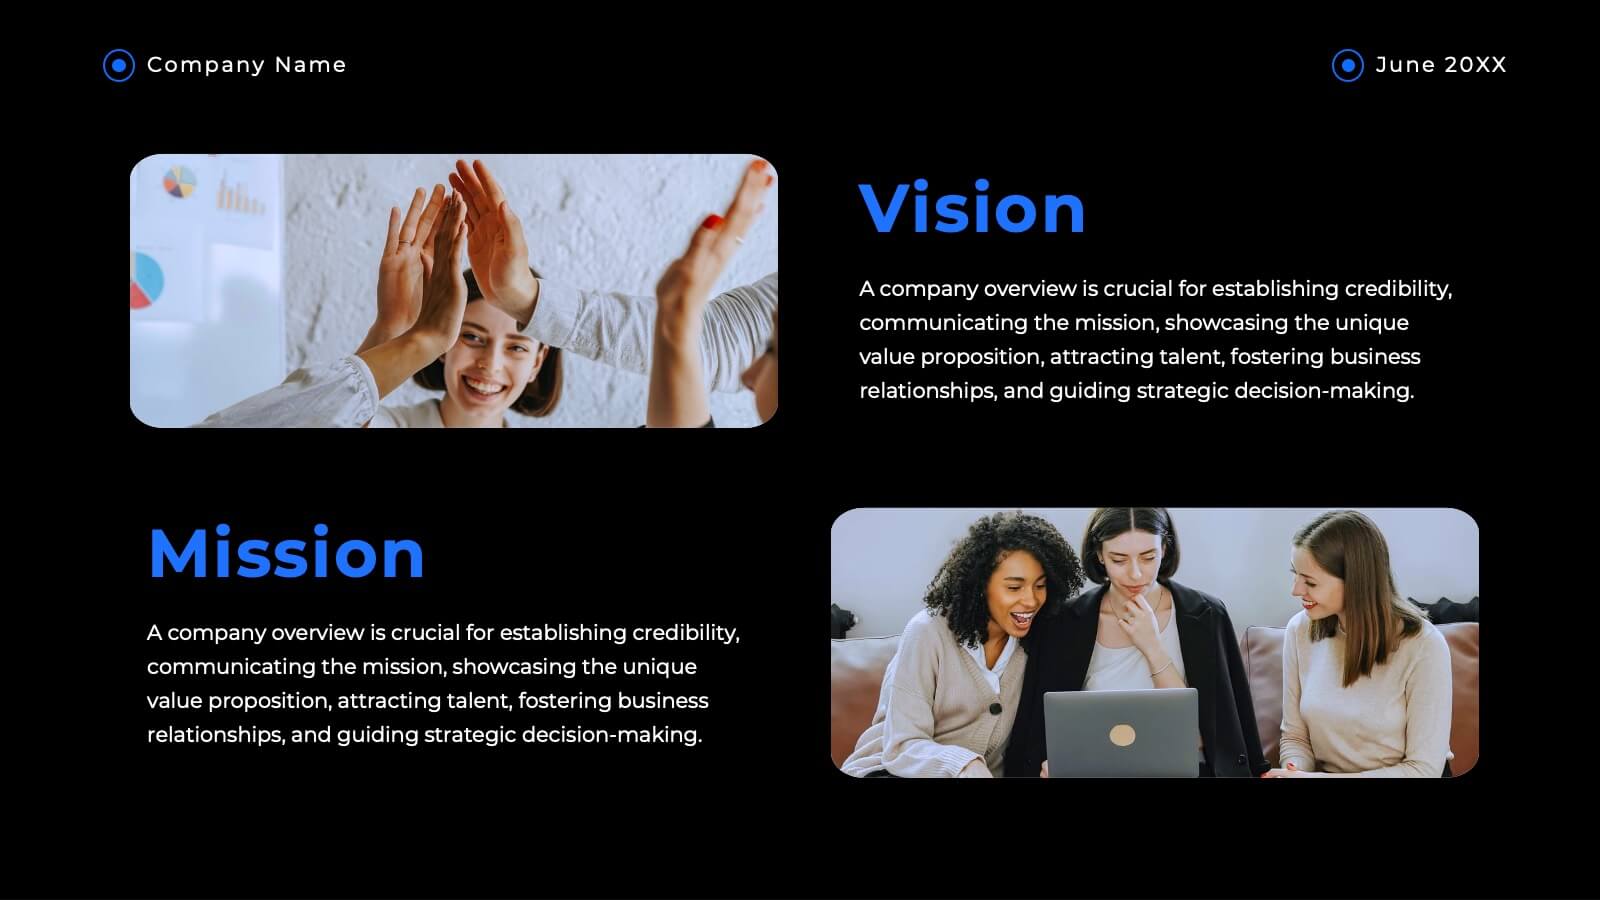
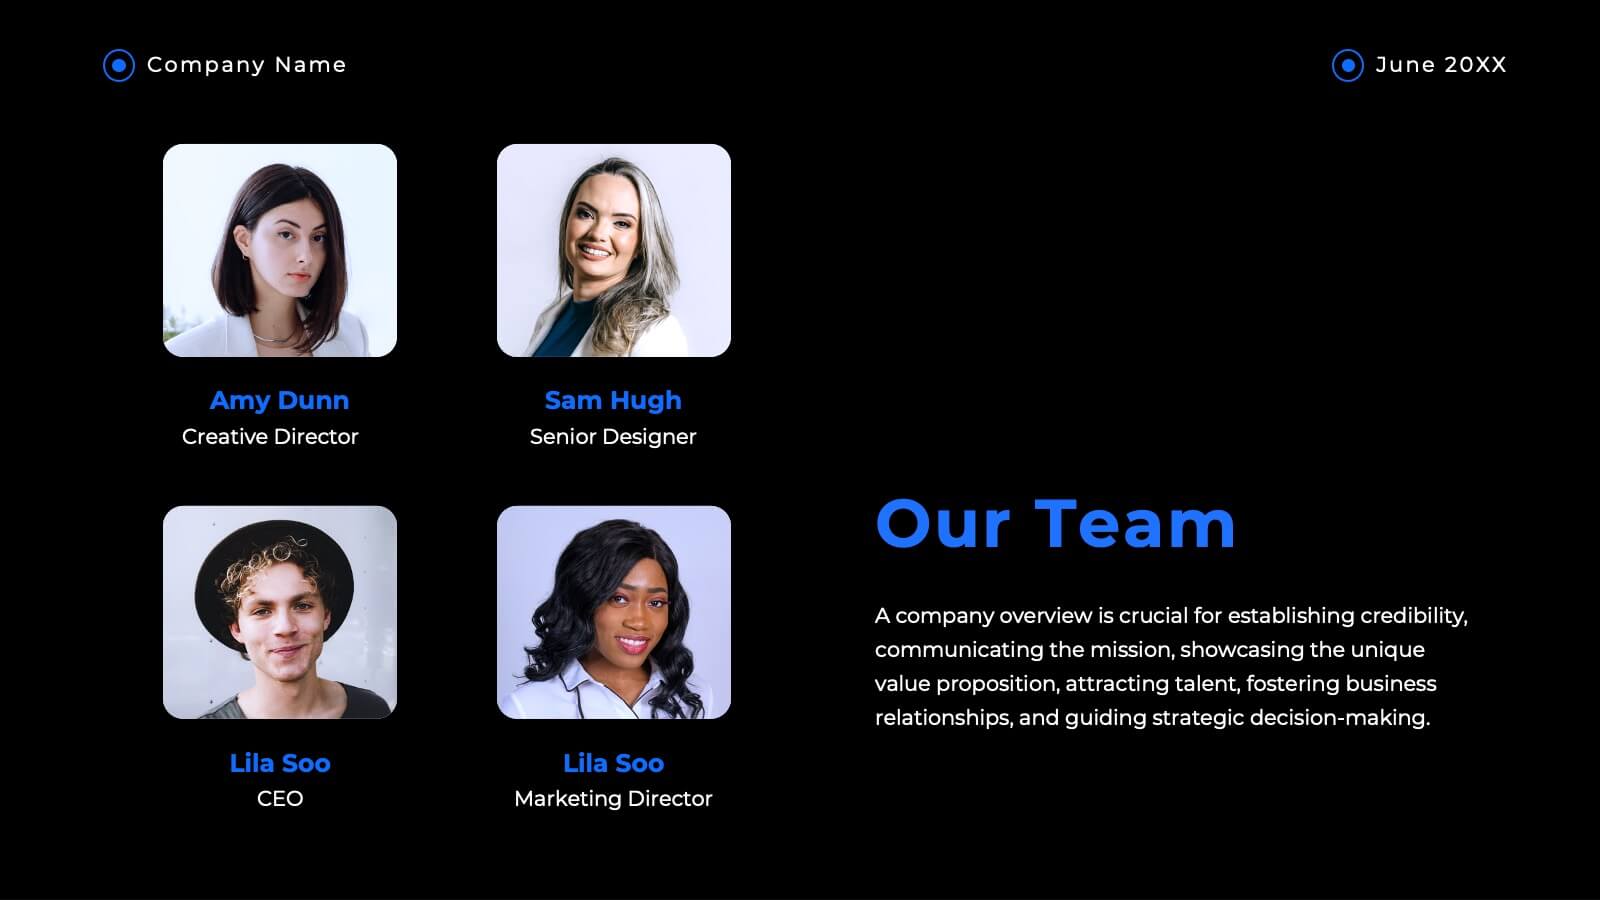
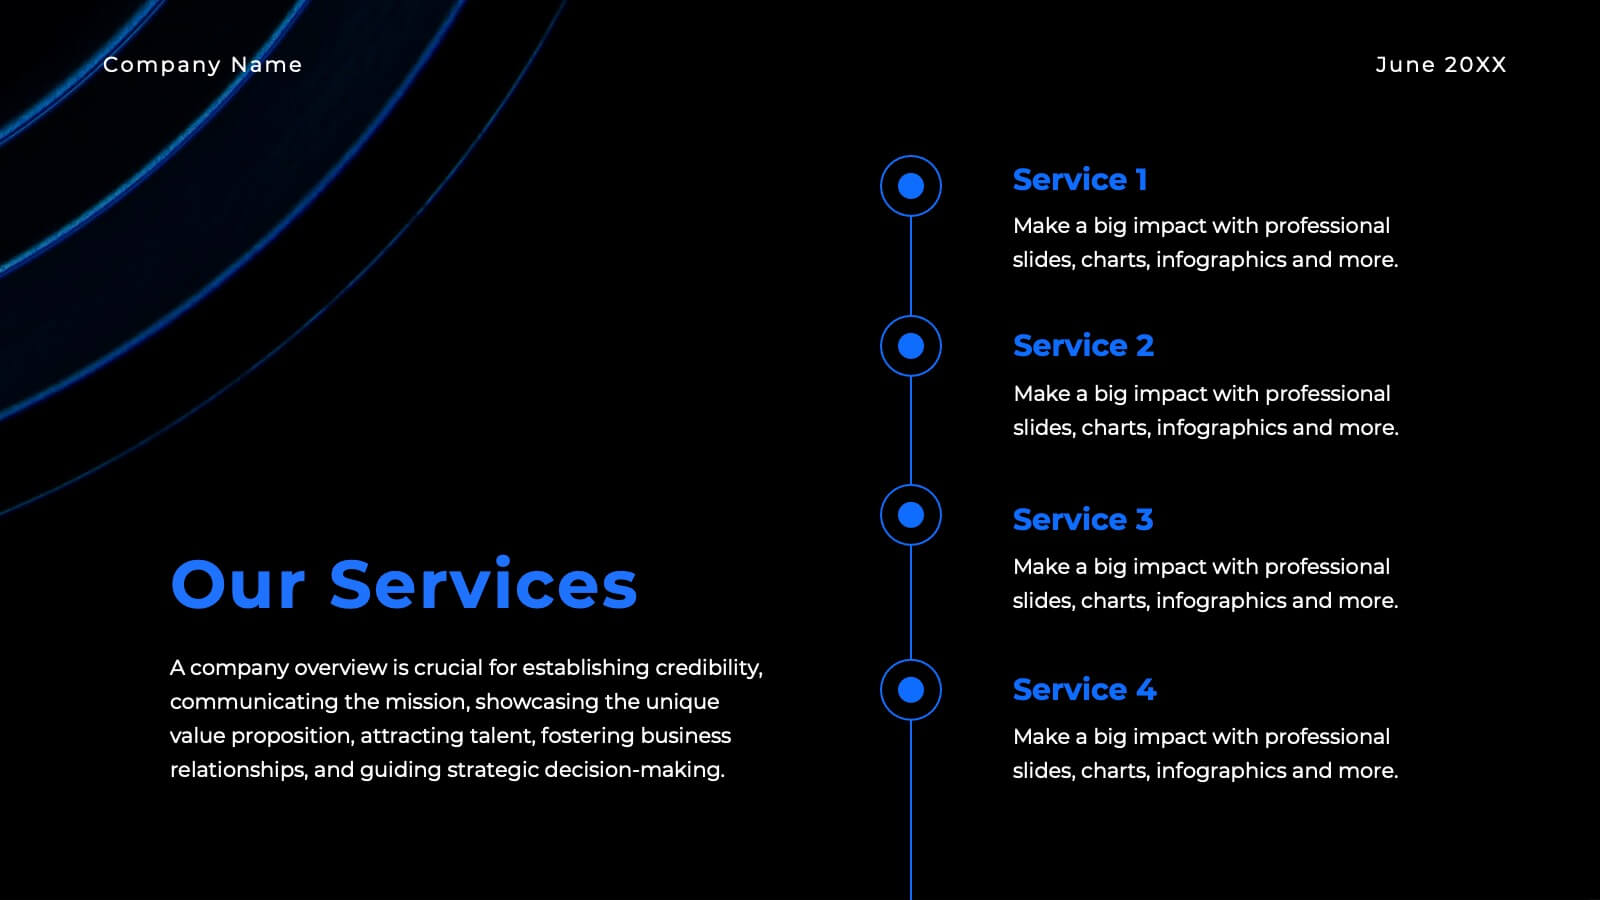
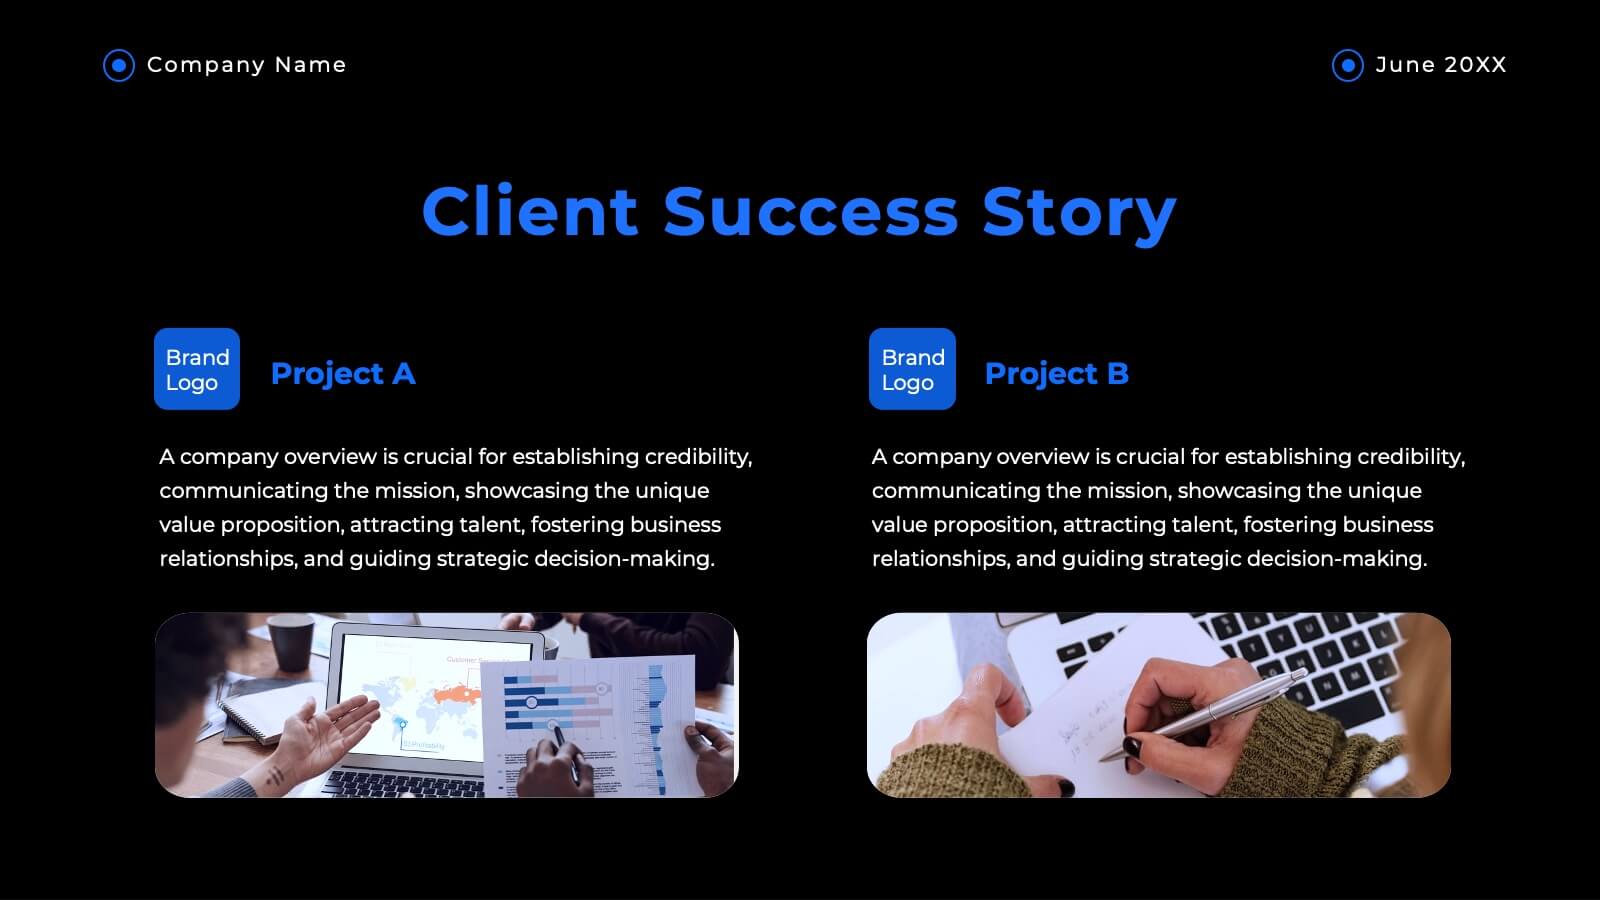
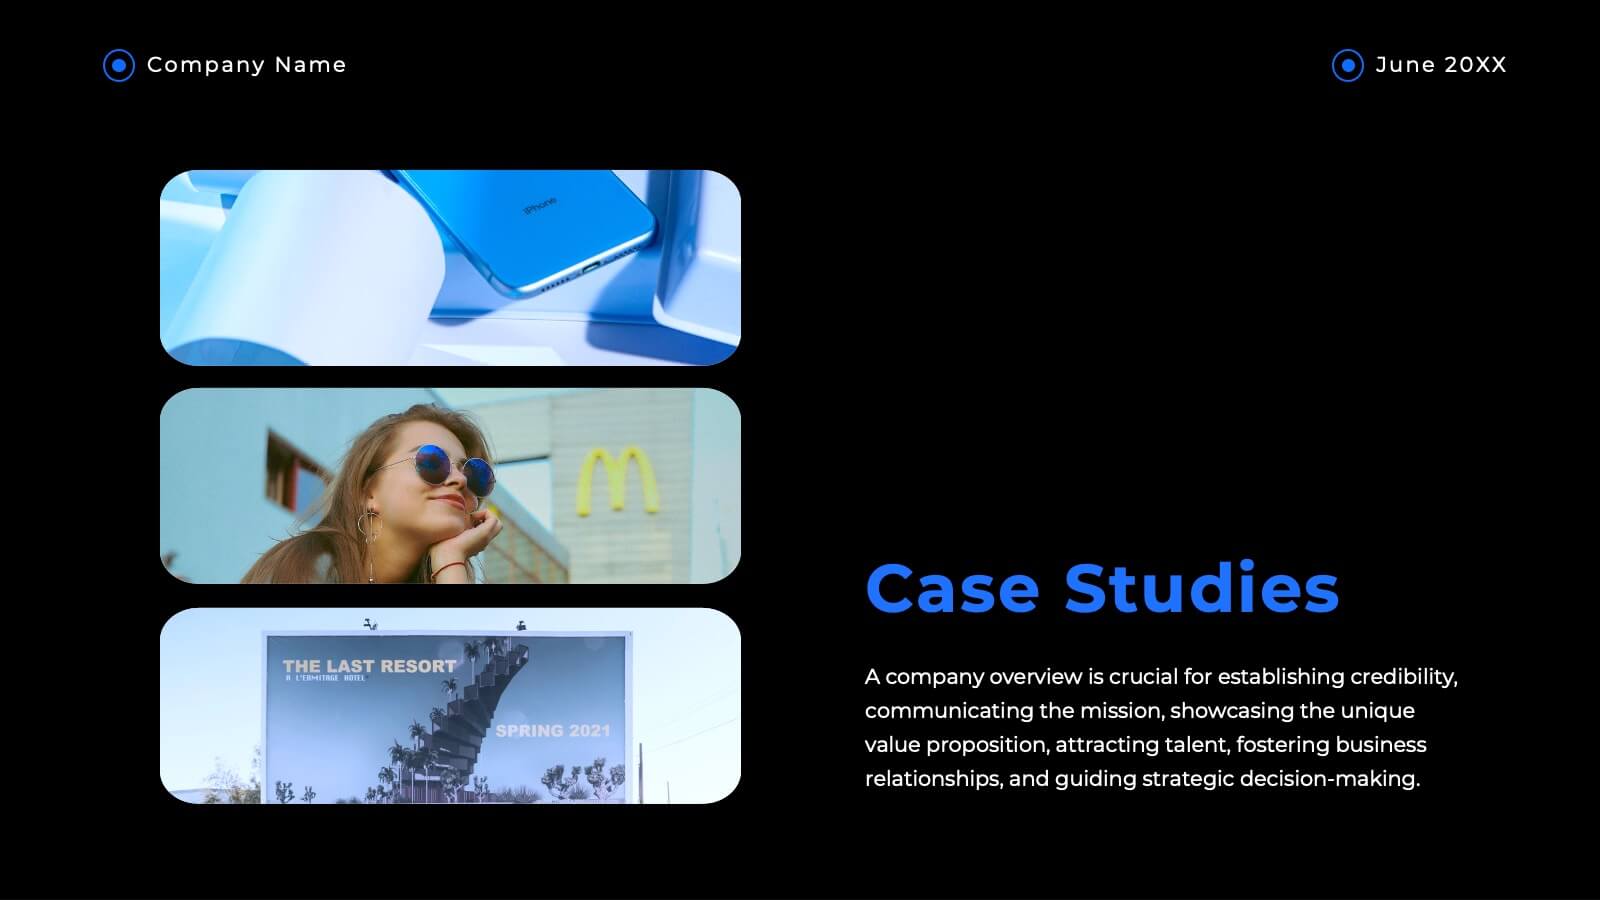
Haven Advertising Agency Proposal Presentation
Wow your clients with this sophisticated agency presentation template! Perfect for showcasing your services, client success stories, and market analysis. Ideal for agencies looking to impress and secure new business. Compatible with PowerPoint, Keynote, and Google Slides, this template ensures your proposals stand out with professional elegance. Perfect for any pitch or proposal.


5 diapositivas
Five-Step Process Improvement Presentation
Streamline operations with the Five-Step Process Improvement presentation. This template visually maps out key phases of business optimization, using a structured timeline to highlight each step's purpose and impact. Perfect for project managers, consultants, and corporate strategists, this design helps teams track progress and refine workflows effectively. Fully editable and compatible with PowerPoint, Keynote, and Google Slides for effortless customization.


22 diapositivas
Muse UX Case Study Presentation
Deliver compelling UX case studies with a sleek presentation template designed to highlight your design journey and results. Ideal for showcasing your user-centered approach, it includes dedicated slides for project overview, user research, personas, journey mapping, wireframes, prototyping, and user testing. Clearly communicate your design principles and decision-making processes with visual design elements and brand guidelines. With specific sections for feedback, accessibility considerations, and project outcomes, this template ensures every aspect of your UX process is captured in a structured and visually engaging manner. Whether you're presenting to clients, stakeholders, or design teams, this template is fully editable and compatible with PowerPoint, Google Slides, and Keynote. Its modern design and professional layout provide an effortless way to convey the value of your UX work, making a lasting impact on your audience. Tailor it to your brand, and elevate your case studies today!


5 diapositivas
Editable RACI Chart Presentation
Streamline your team’s responsibilities with this clean and easy-to-use RACI chart template! Perfect for project managers, this presentation helps define who is Responsible, Accountable, Consulted, and Informed for each task. Simplify workflows, boost collaboration, and keep everyone aligned. Fully editable and compatible with PowerPoint, Keynote, and Google Slides for seamless customization.


12 diapositivas
Editable Chart Presentation
Present your data with impact using the Editable Chart Presentation. This versatile slide set includes colorful bar and line charts designed for performance metrics, sales growth, or budget comparisons. Easily swap out values and labels to match your story. Fully editable in PowerPoint, Keynote, Google Slides, and Canva.


5 diapositivas
Feedback Collection Strategy Presentation
Engage your audience with a dynamic visual that simplifies how feedback is gathered and turned into meaningful action. This presentation helps illustrate communication loops, data flow, and process improvements with clarity and style. Fully editable and compatible with PowerPoint, Keynote, and Google Slides for seamless customization and professional delivery.