


Características


¿Tienes alguna pregunta?
Recomendar


6 diapositivas
Stakeholder Analysis and Engagement
Effectively map out internal and external stakeholders with this structured hexagon-based layout. This presentation highlights six key groups—Employee, Manager, Shareholder, Society, Media, and Customer—centered around your company. Ideal for corporate strategy, stakeholder engagement, or CSR planning. Fully customizable in PowerPoint, Keynote, and Google Slides.


21 diapositivas
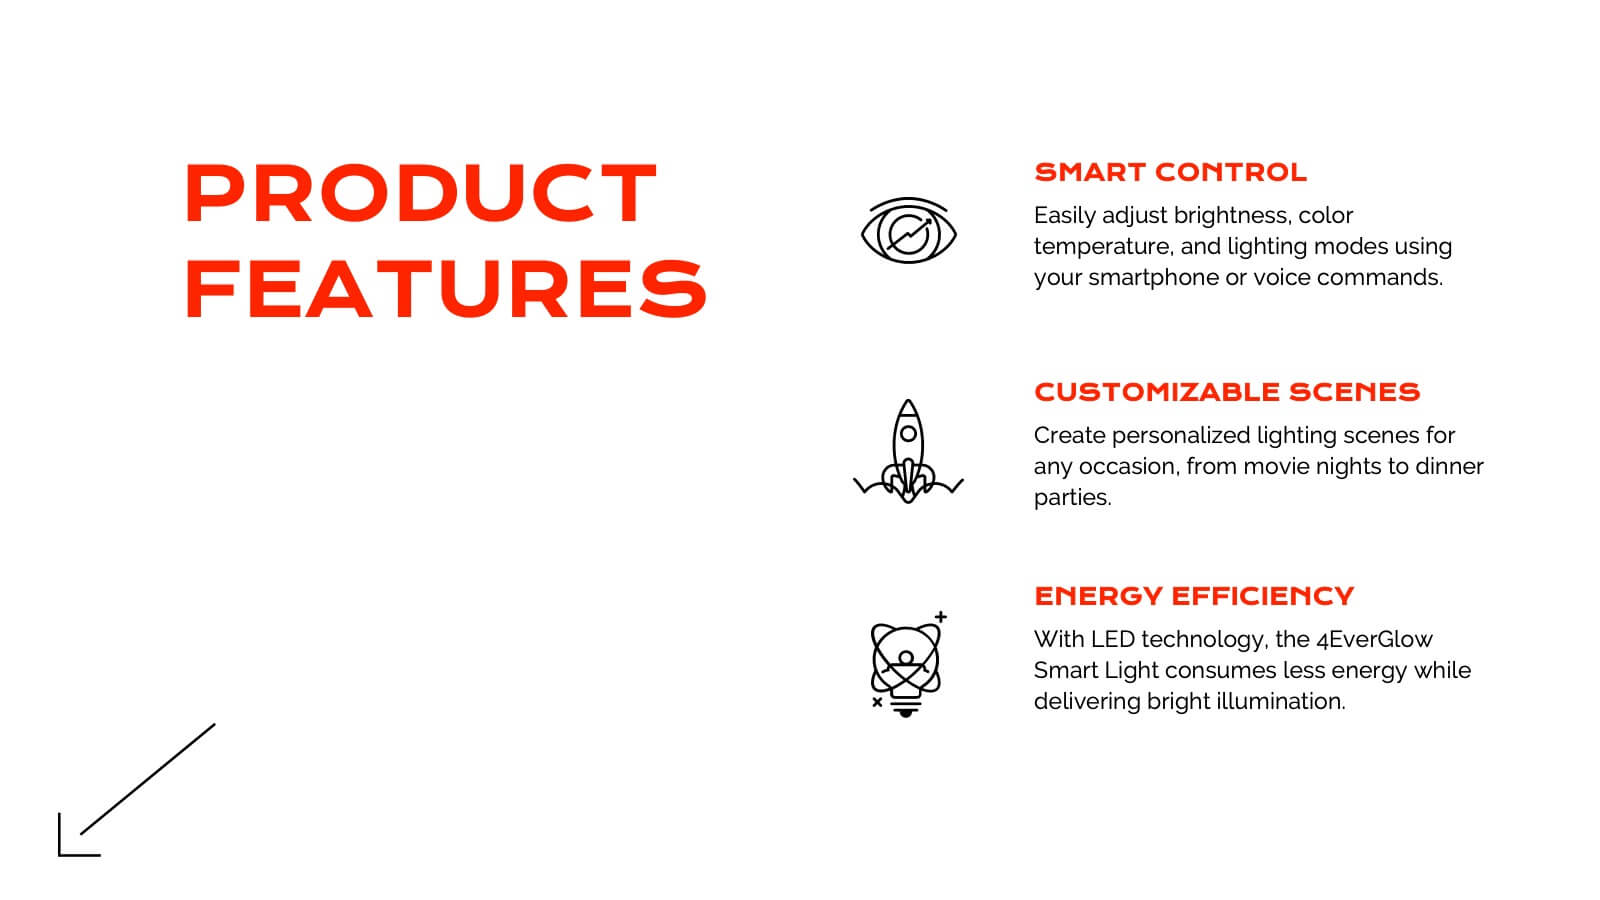
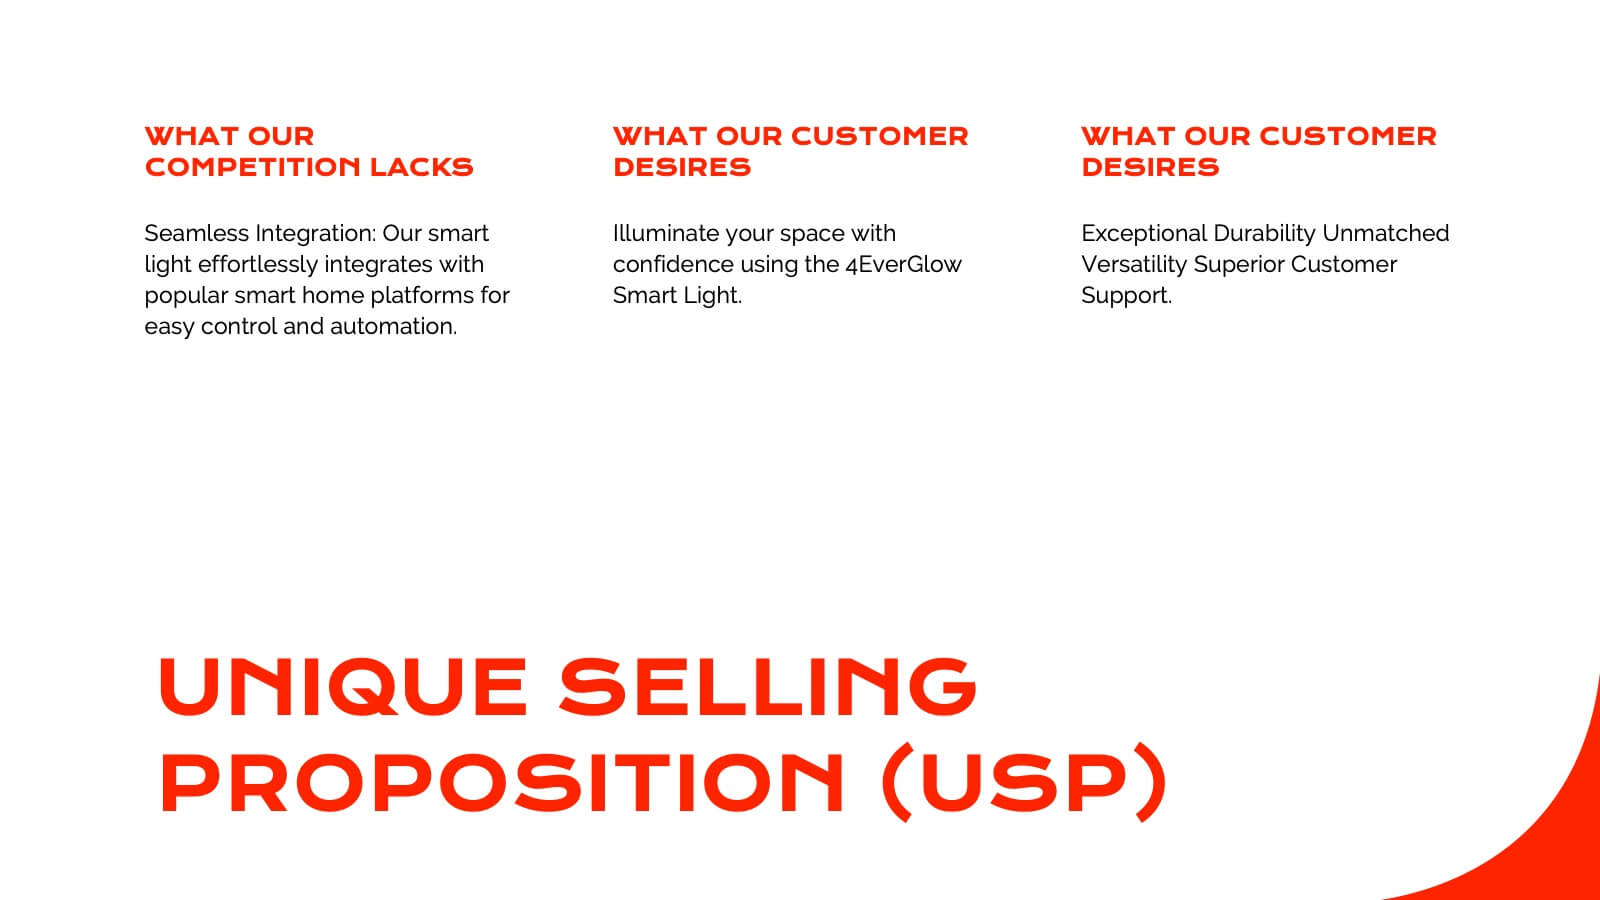
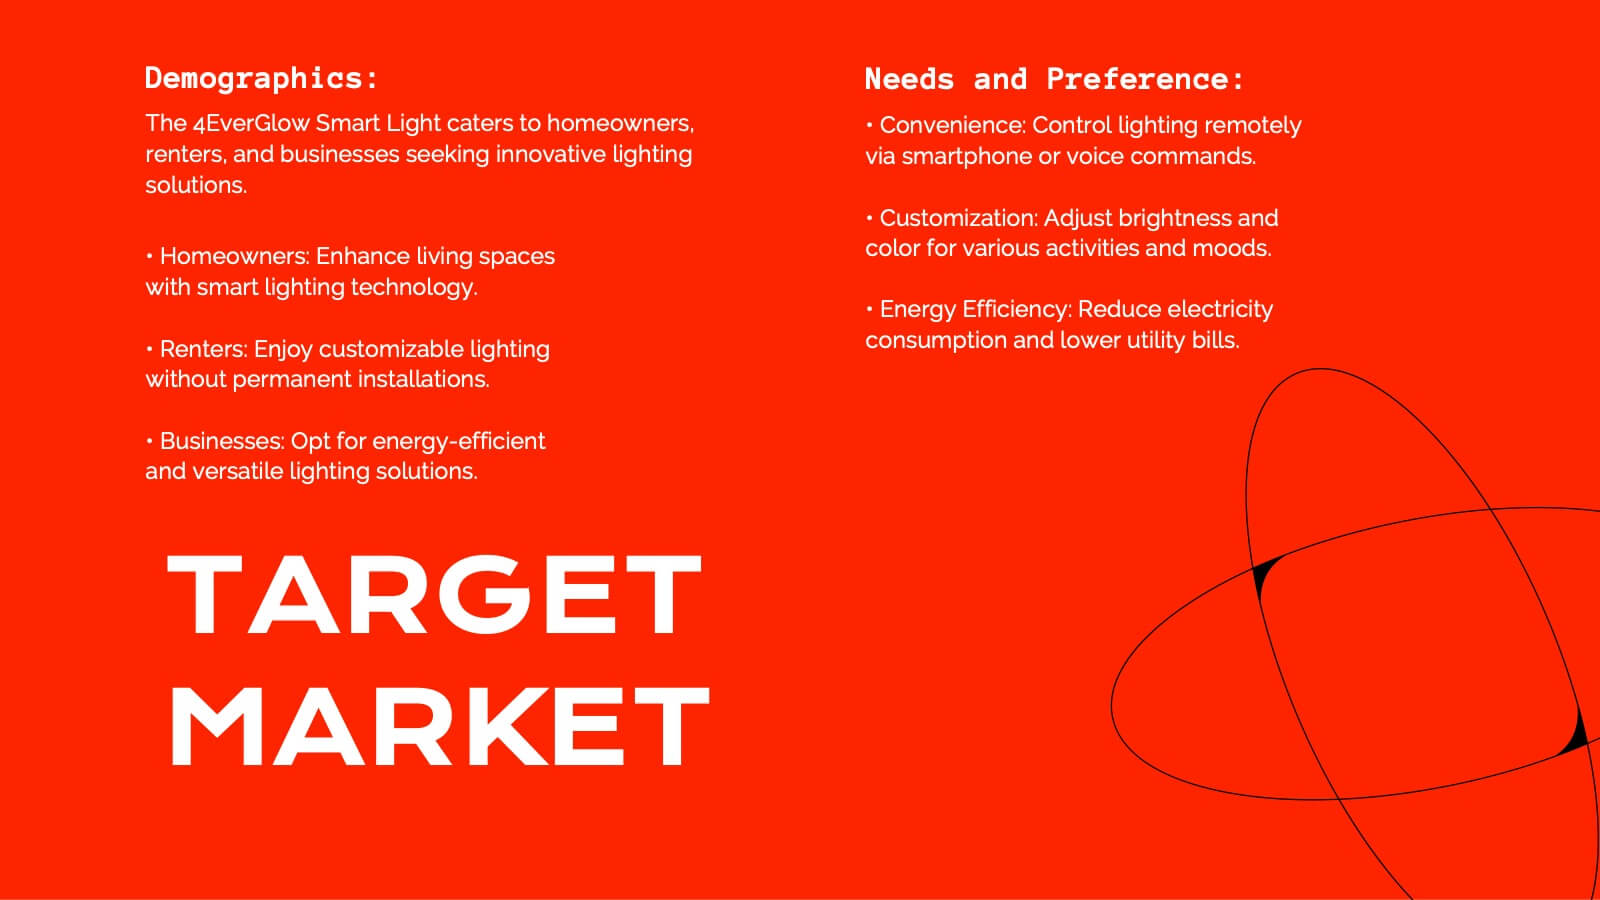
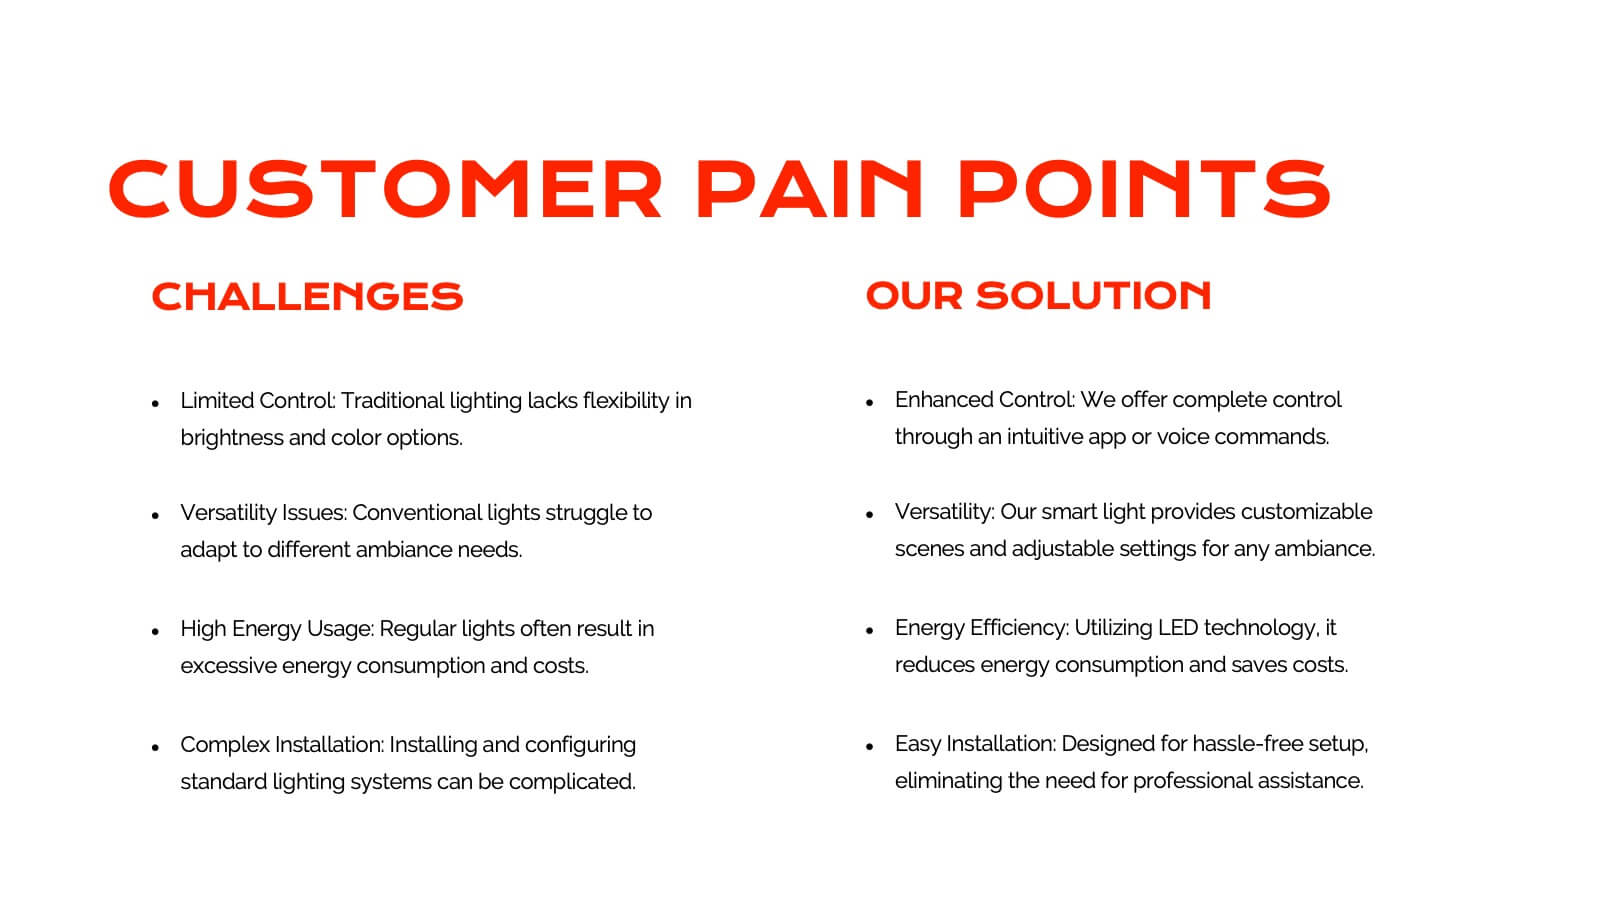
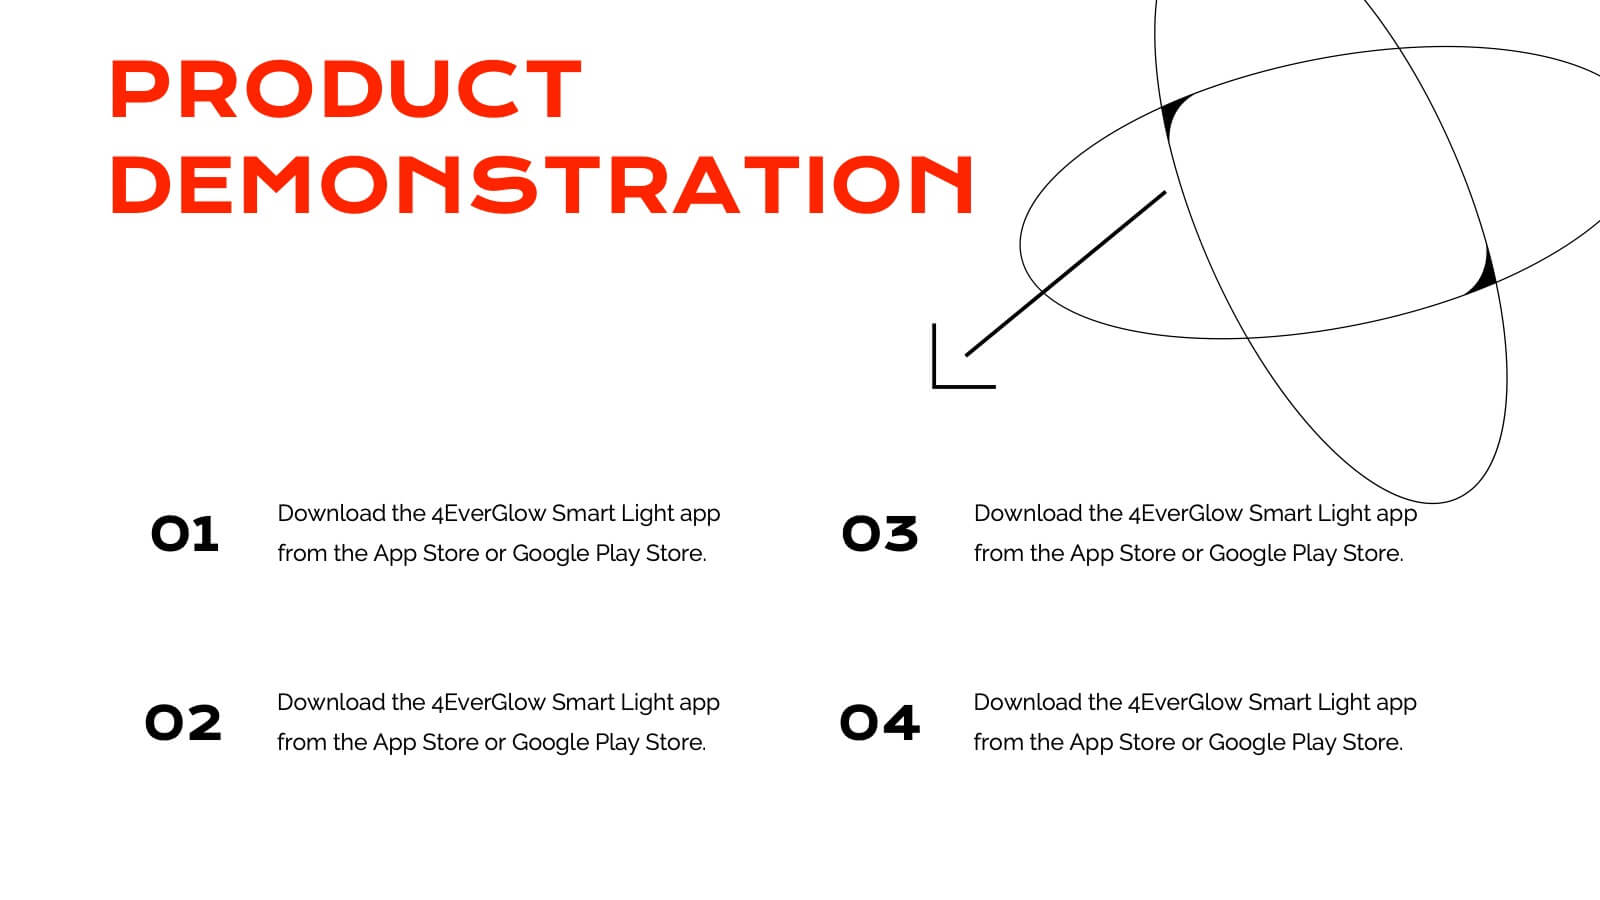
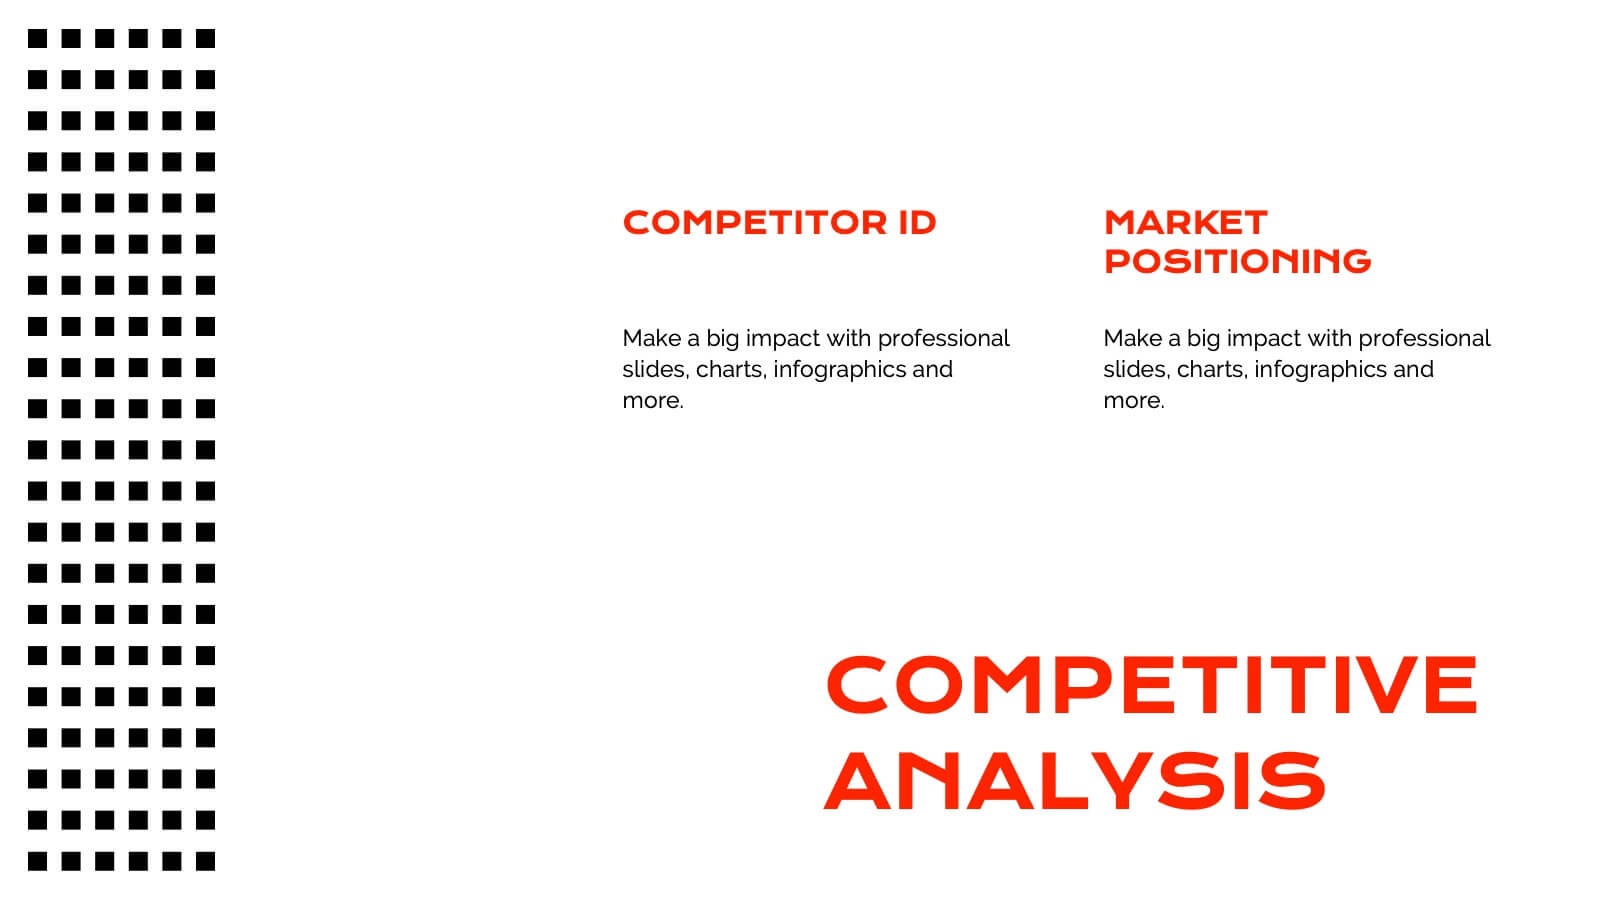
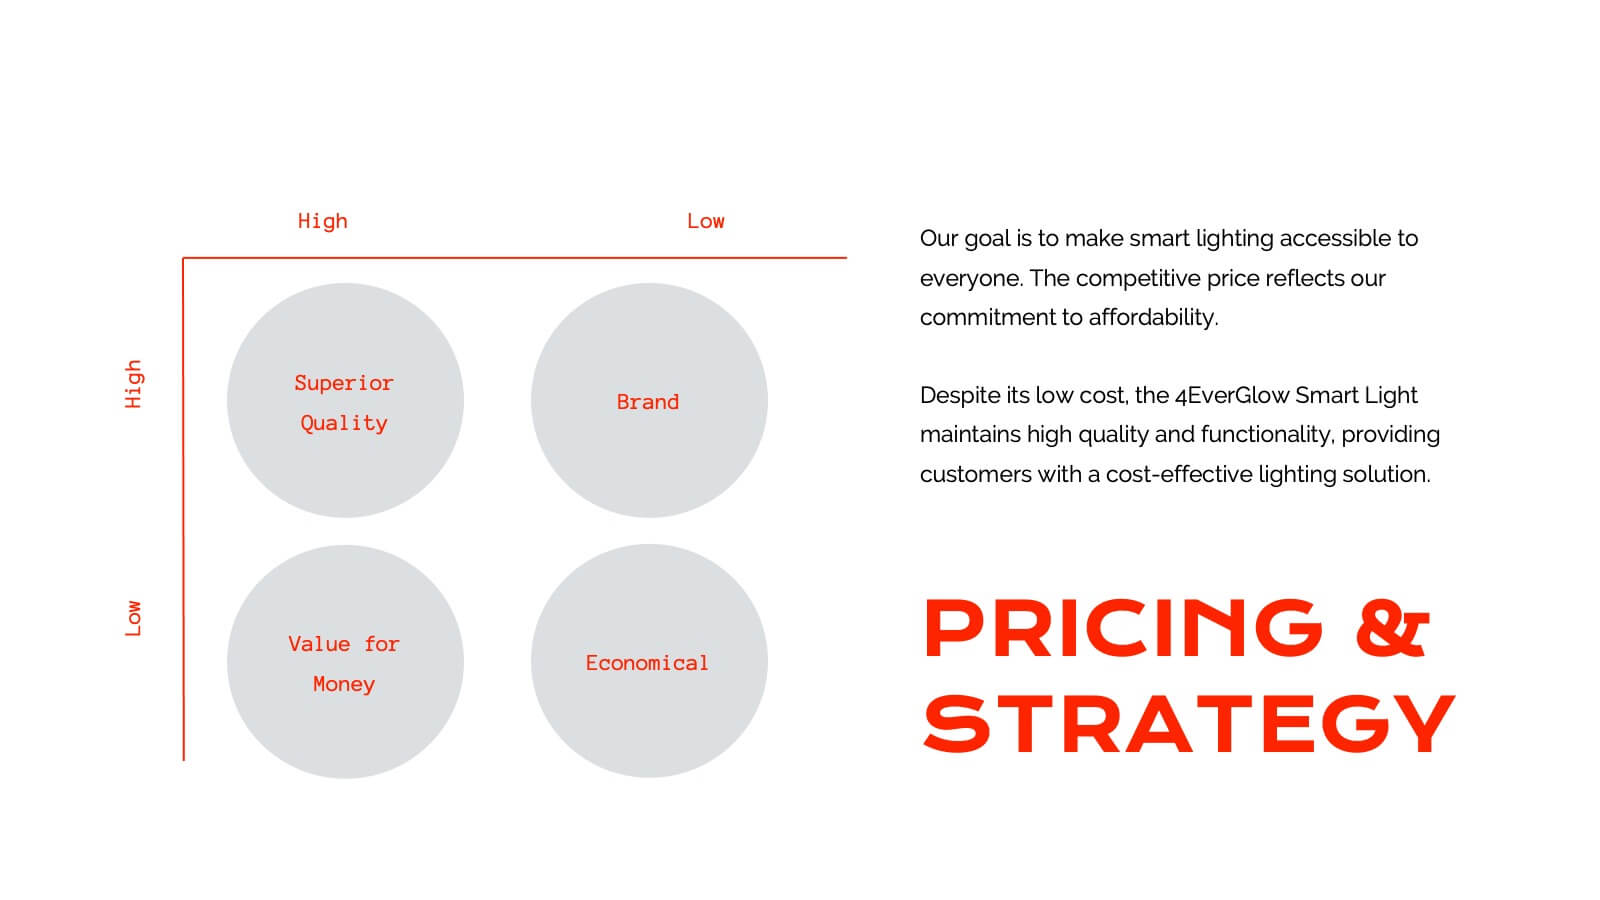
Juventas Product Roadmap Presentation
Get ready to dazzle your audience with a visually striking presentation that takes them through the entire product journey! This template covers essential areas such as product features, target market analysis, and competitive positioning. With its sleek, modern design, it's perfect for capturing attention and delivering clear information. Compatible with PowerPoint, Keynote, and Google Slides for effortless use across platforms.


7 diapositivas
Root Cause Analysis for Problem Solving Presentation
Identify and Resolve Issues Effectively with this Root Cause Analysis for Problem Solving presentation template. Designed to streamline complex problem-solving, this layout features clear visual markers, structured iconography, and step-by-step segmentation to help teams analyze causes, pinpoint bottlenecks, and implement solutions efficiently. Ideal for project managers, business analysts, and operational teams, this template is fully customizable and works seamlessly in PowerPoint, Keynote, and Google Slides, ensuring a professional and engaging presentation experience.


7 diapositivas
Bubble Map Diagram Presentation
A Bubble Map Infographic is a visual representation that uses bubbles to convey information. It is used to display geographic data, such as population density, sales figures, or distribution of resources. In this template the size of the bubbles represents the value of the data being presented, with larger bubbles indicating a higher value. The color of the bubbles may also be used to indicate different categories or levels of the data. This infographic can be customized with different colors, fonts, graphics, text boxes, charts, and other visual aids to suit all your needs.


23 diapositivas
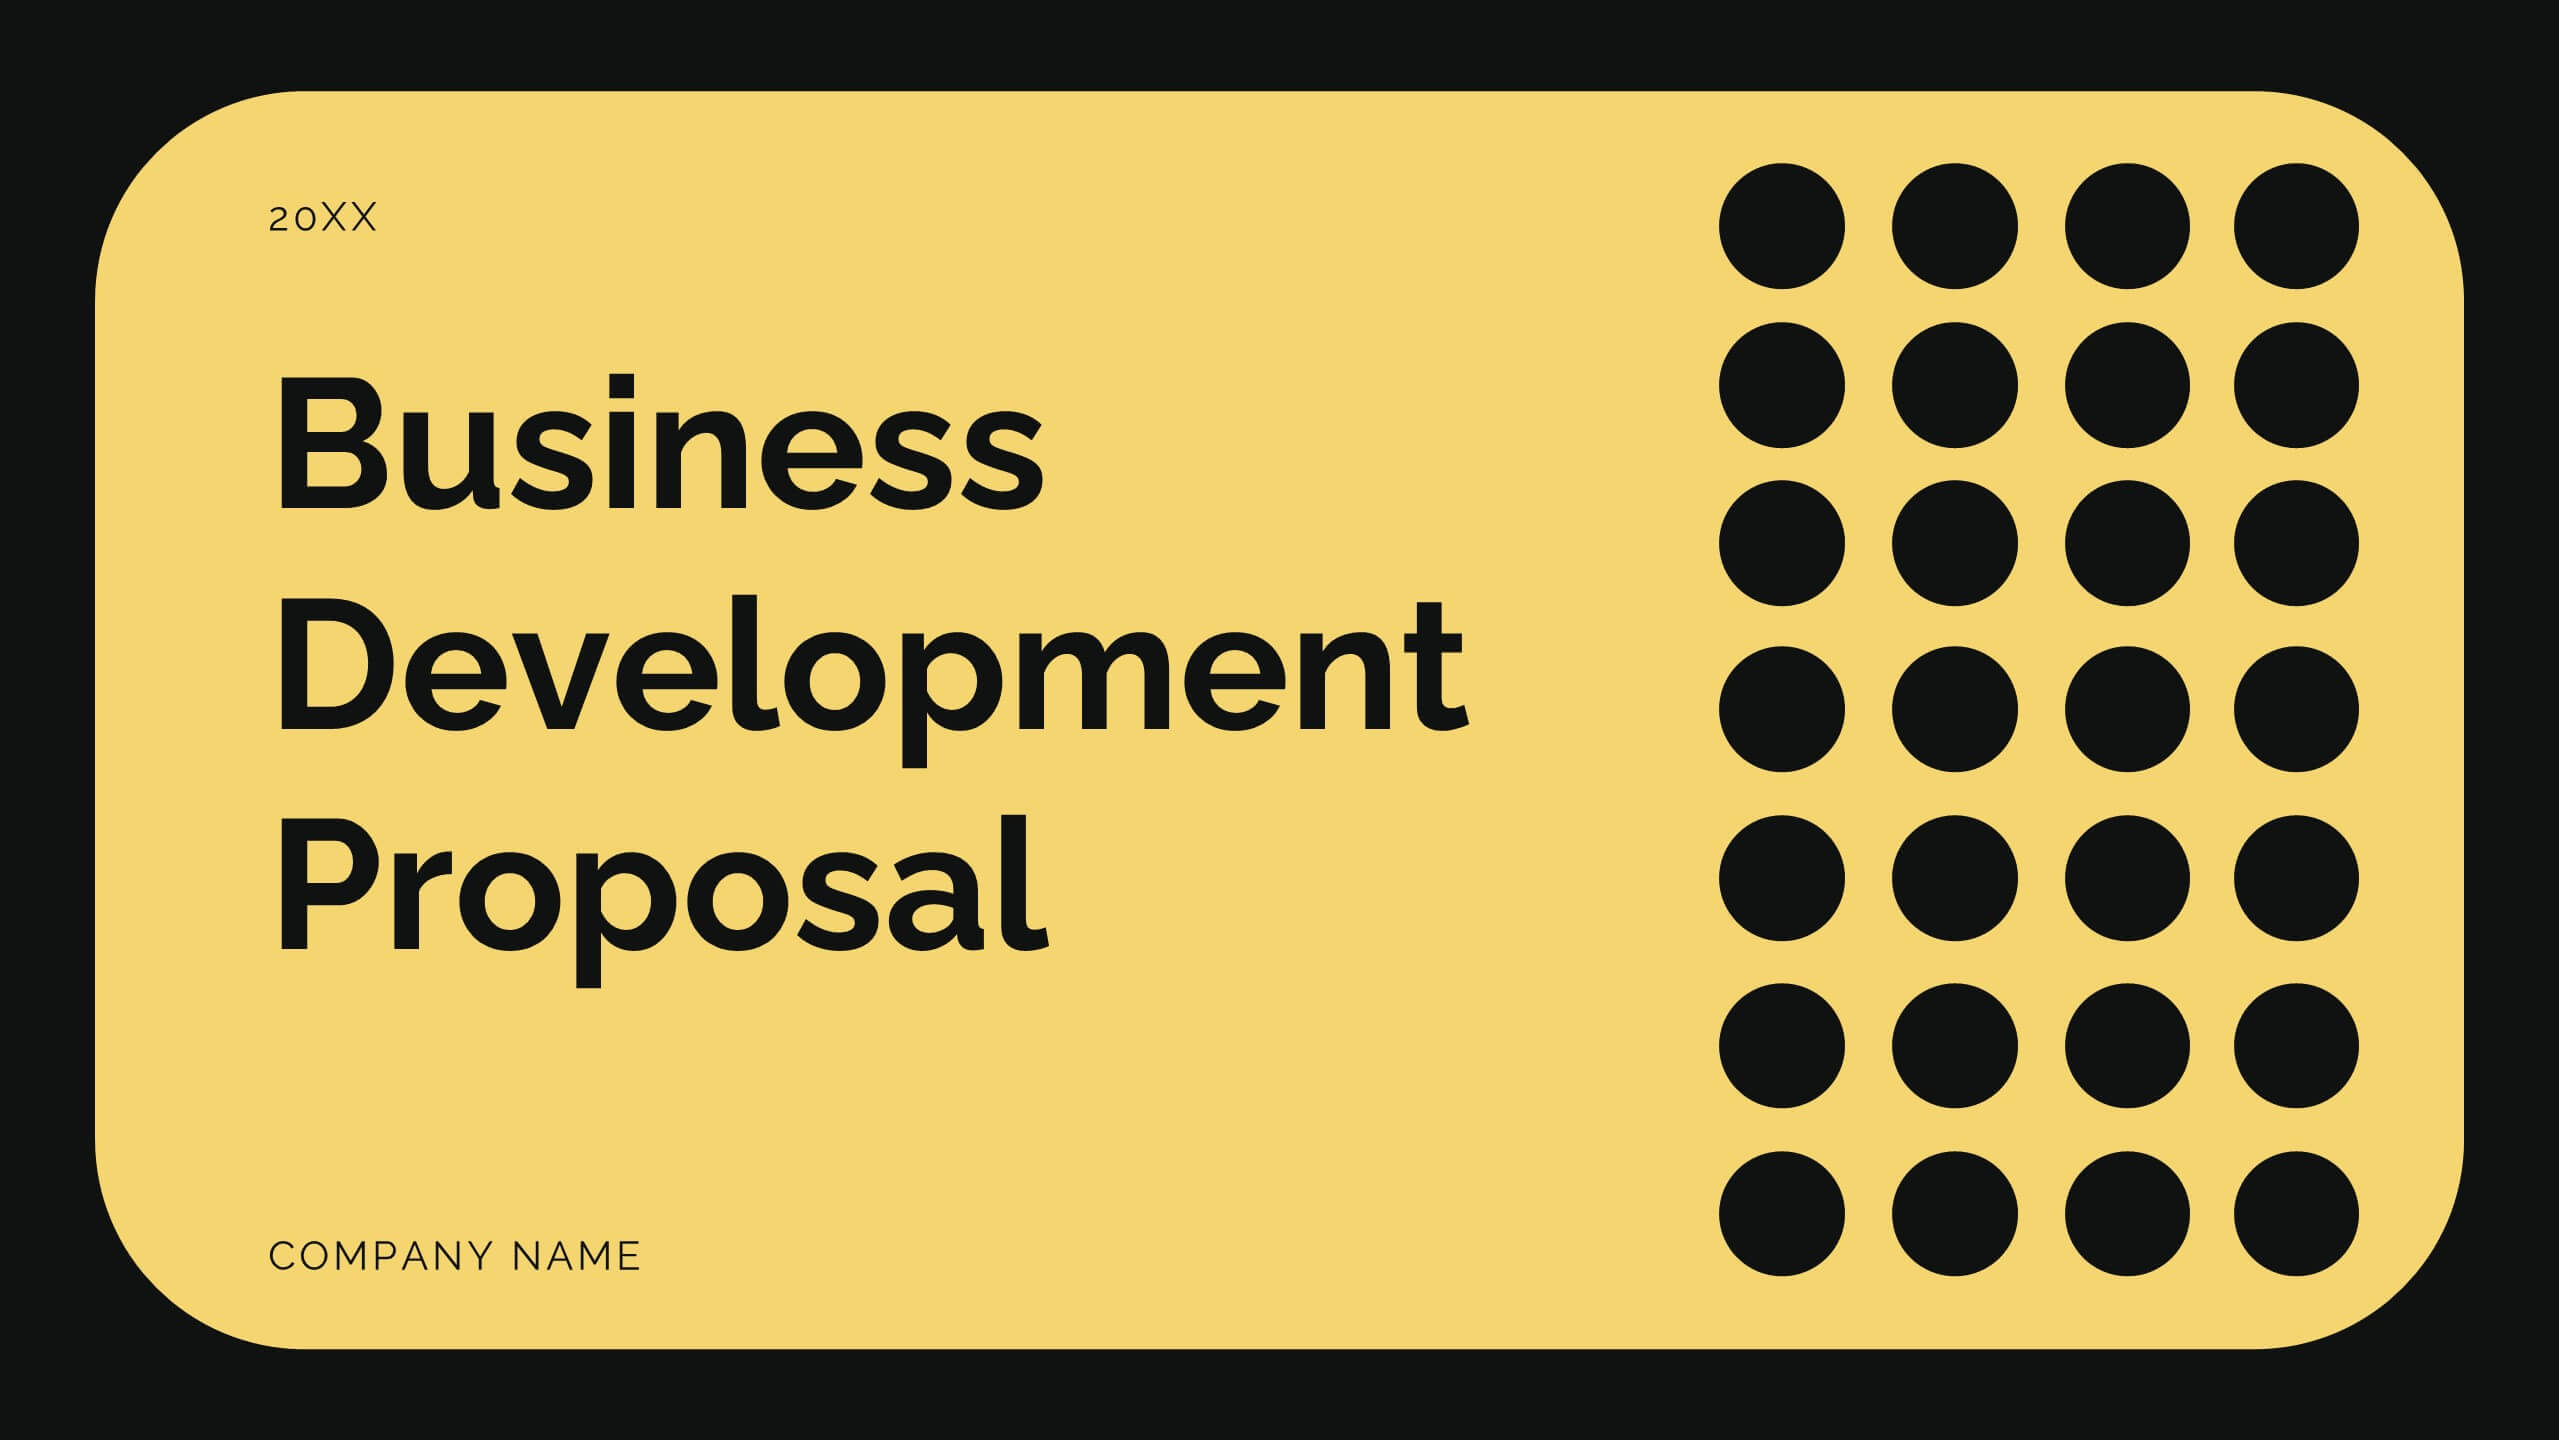
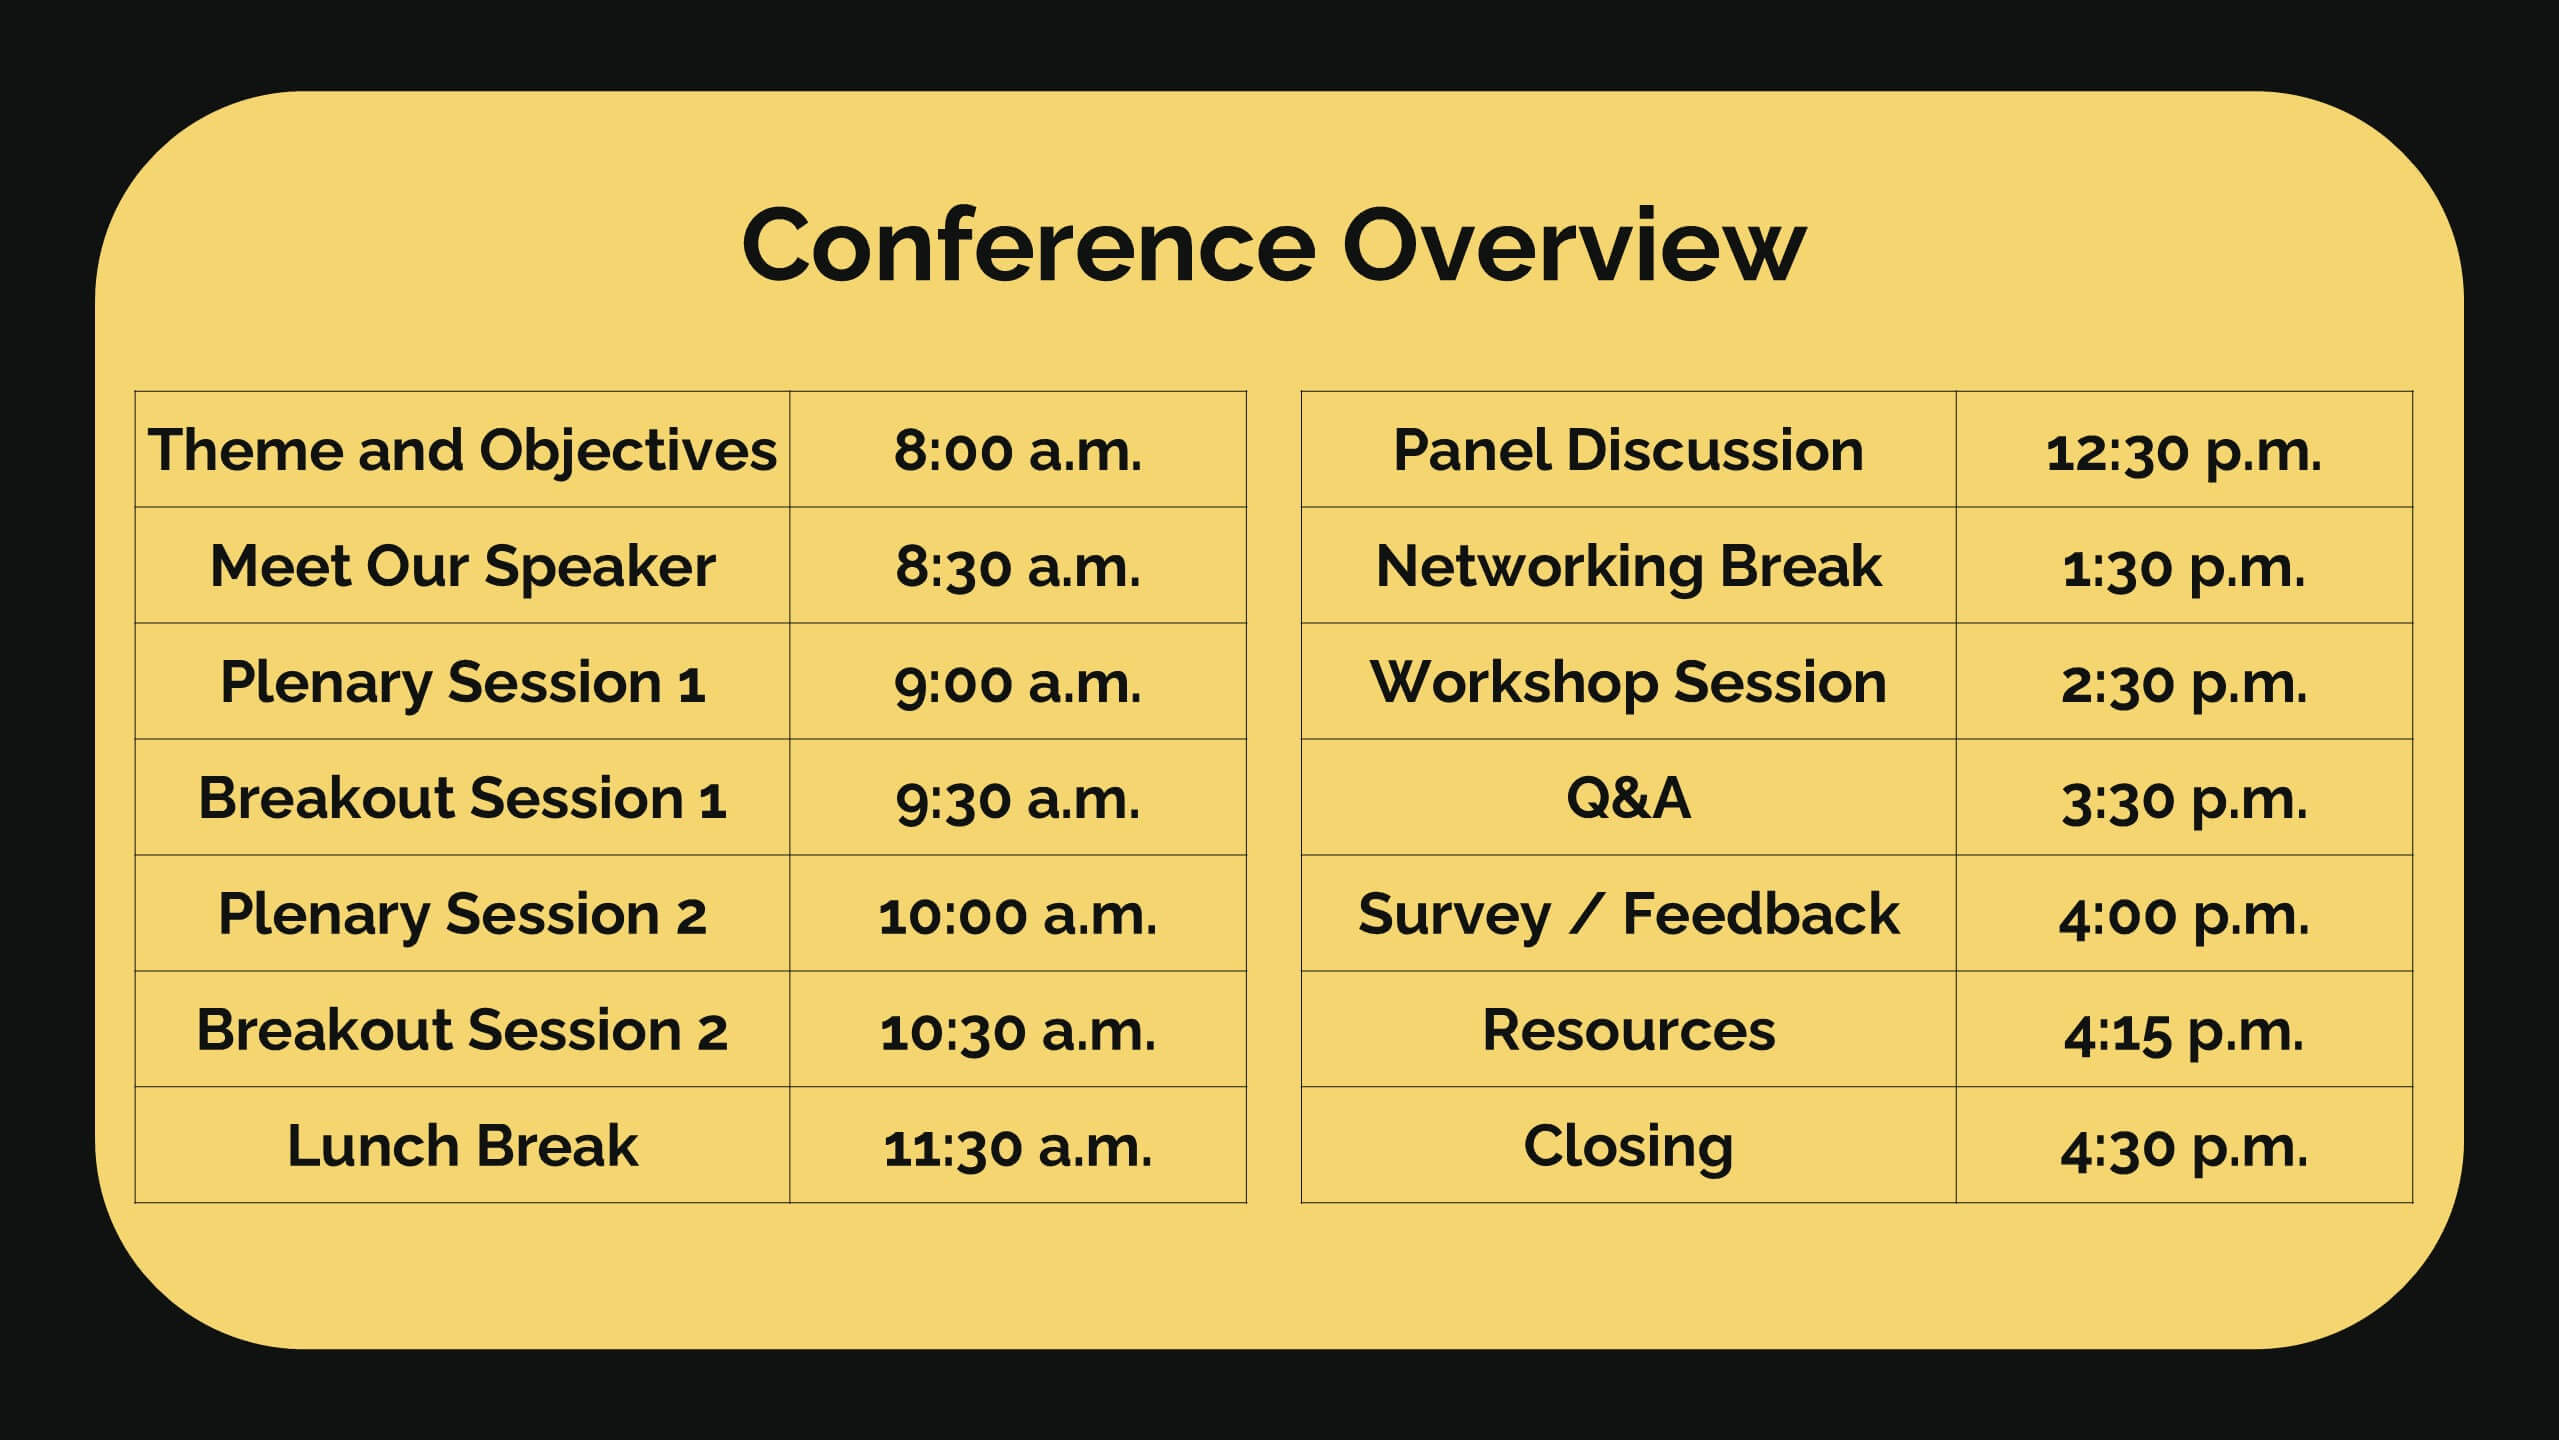
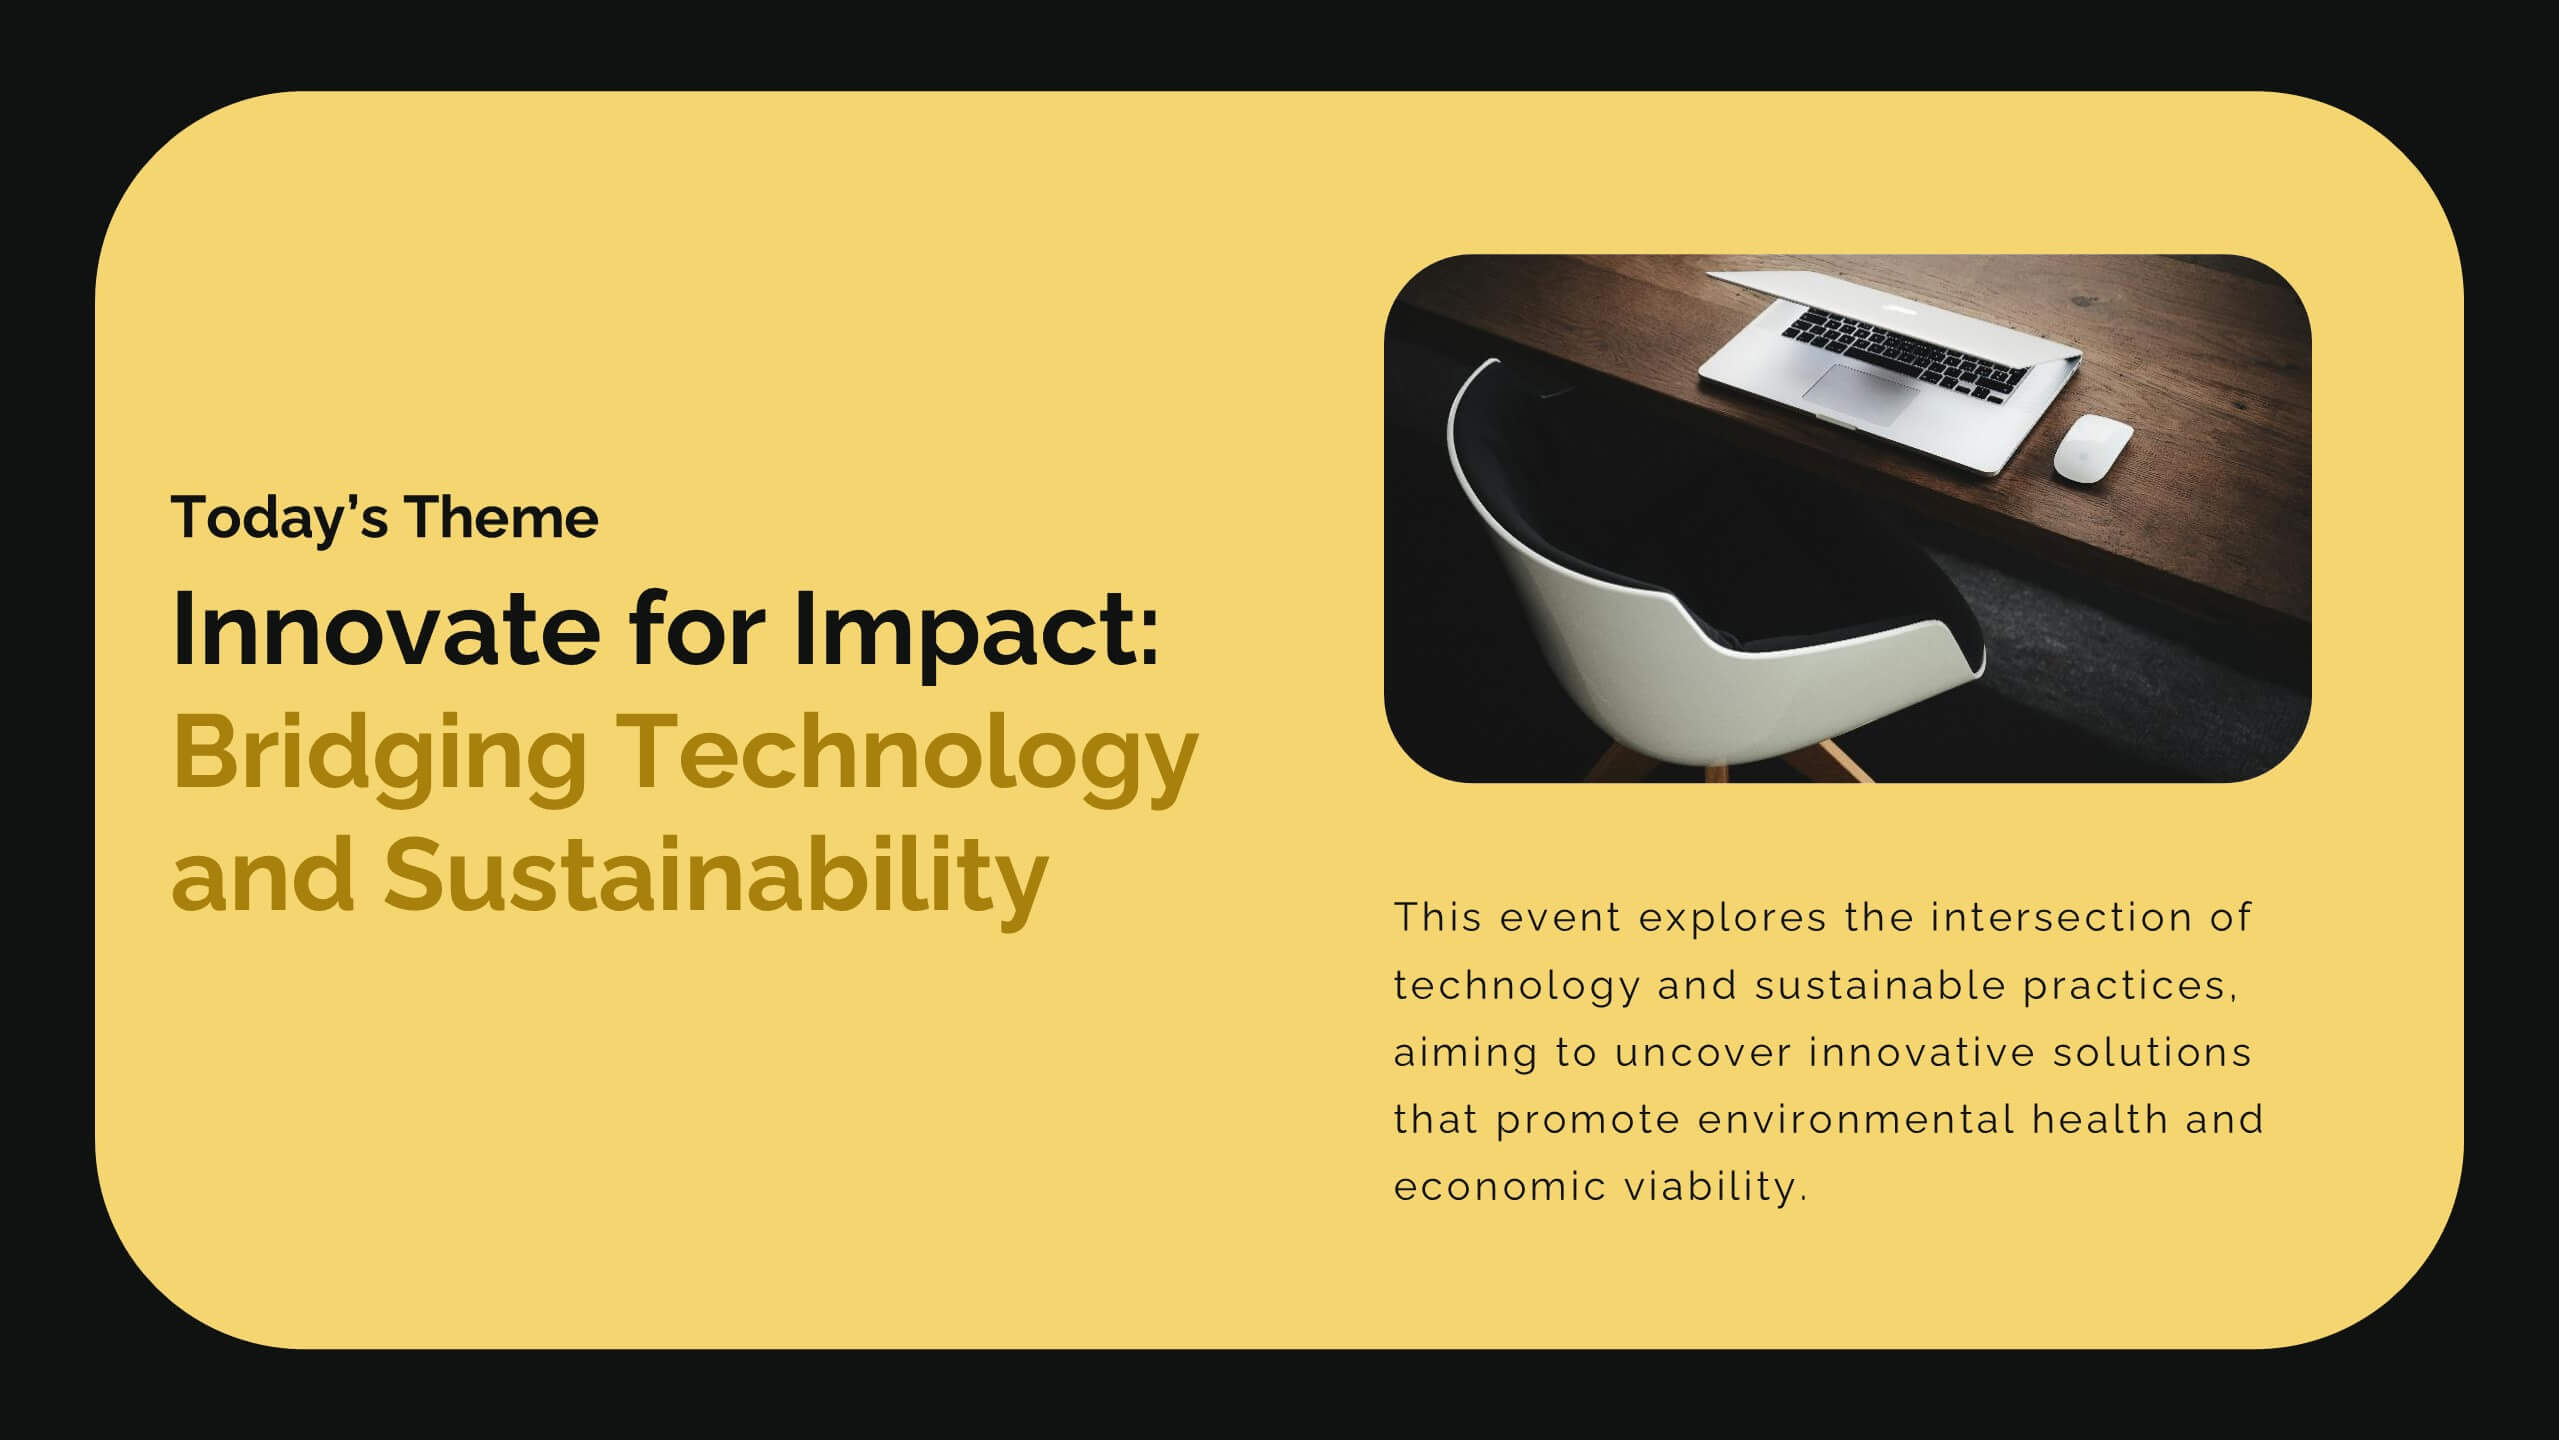
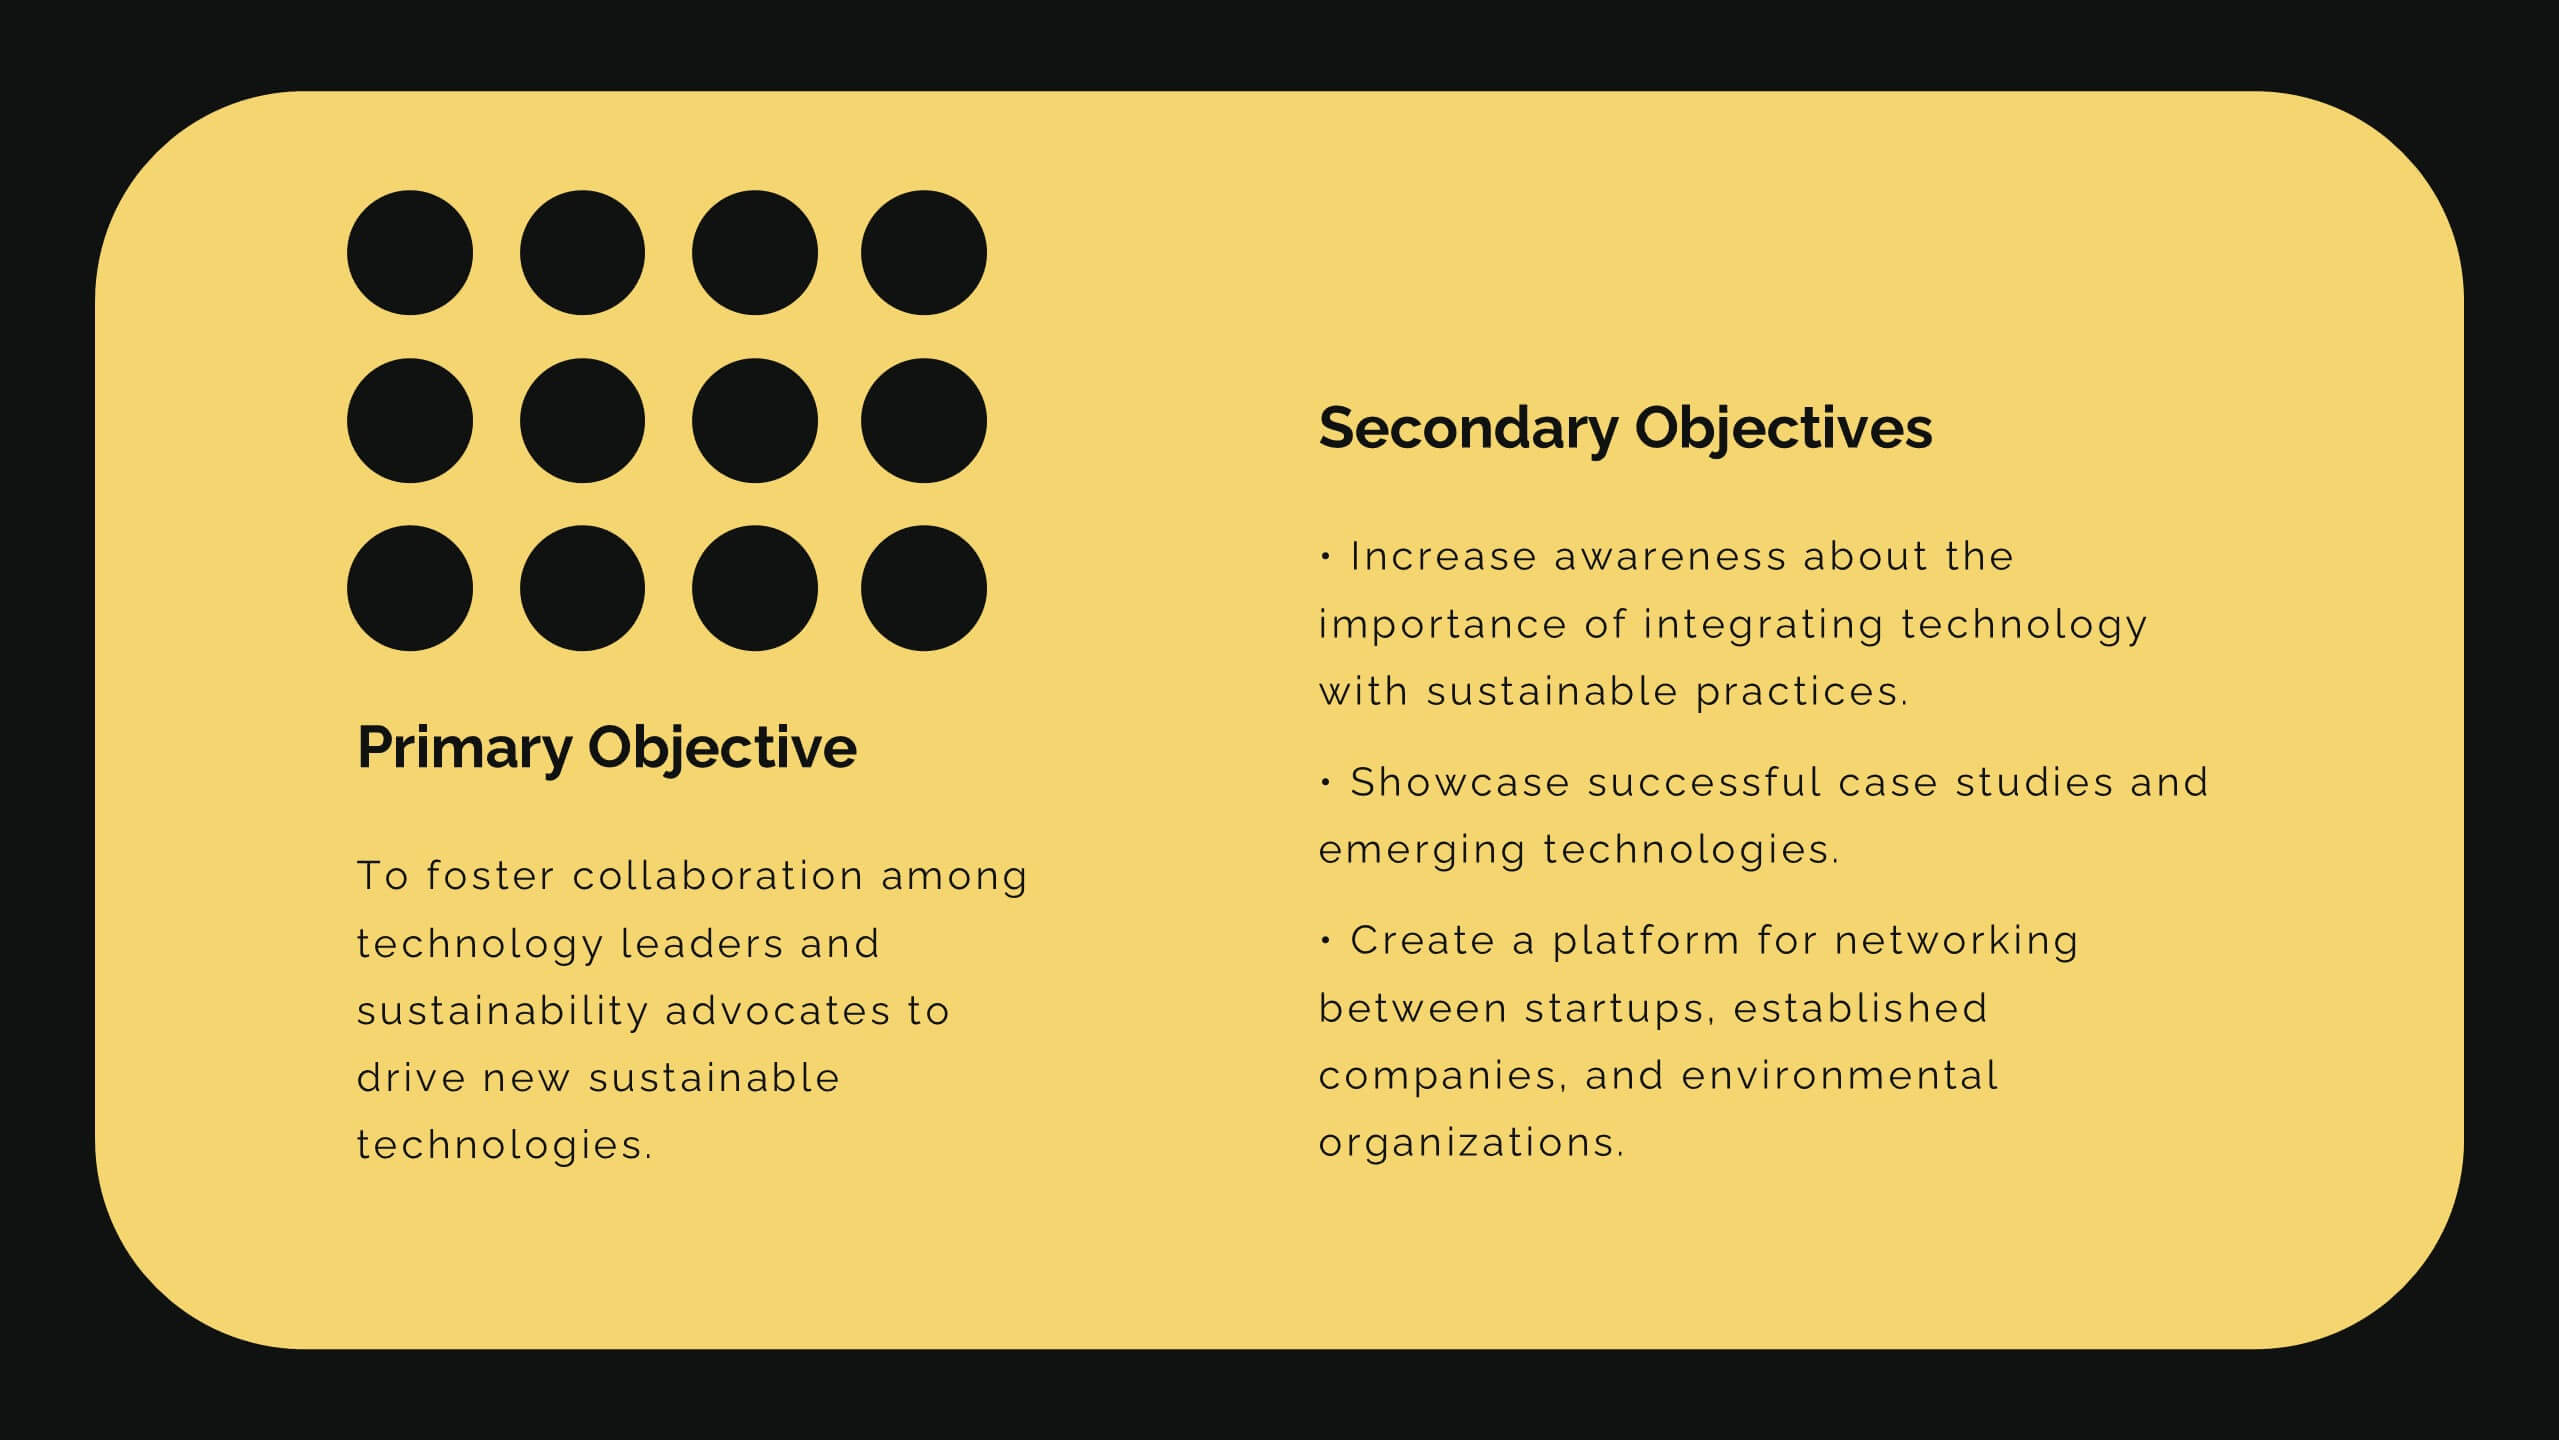
Diamond Business Development Proposal Presentation
Unlock the potential of your business proposals with this bold and engaging presentation template! Perfect for business development pitches, conferences, and workshops, it includes sections for speaker introductions, panel discussions, and session breakdowns. With its clean and professional design, this template ensures clarity and impact. Fully customizable and compatible with PowerPoint, Keynote, and Google Slides.


7 diapositivas
IT Architecture Services Infographic Presentation
An IT Architecture Infographic presents information related to the design, structure, and components of an organization's architecture. IT Architecture refers to the overall framework of an organization's IT systems and infrastructure. This template is designed to communicate the design, structure, and components of your organization's IT architecture. The template features a modern design with a blue color scheme, giving your presentation a professional and sleek look. It is compatible with Powerpoint, Keynote, and Google Slides, making it simple for you to create a professional presentation.


4 diapositivas
Sales Conversion with AIDA Stages Presentation
This modern presentation breaks down the AIDA model—Attention, Interest, Desire, and Action—using clean 3D cube visuals. Perfect for sales teams and marketers aiming to explain conversion funnels clearly. Fully customizable in Canva, making it easy to adapt to any brand or campaign strategy. Ideal for pitch decks and workshops.


5 diapositivas
Target Audience Analysis Slide Presentation
Discover who your audience truly is with this clear and visually balanced layout designed to simplify audience insights. Perfect for marketing plans, presentations, and strategy reports, it helps you visualize key demographics and behaviors effortlessly. Fully customizable and compatible with PowerPoint, Keynote, and Google Slides for easy editing.


6 diapositivas
RAPID Decision Infographic
The RAPID matrix is a decision-making framework used to clarify roles and responsibilities within a project or organization, especially when it comes to decision-making processes. The RAPID acronym stands for Responsible, Accountable, Consulted, Informed, and Decider. This infographic template is a visual tool that helps clarify roles and responsibilities within a project or process. This template is designed to define who is involved in each step of a task, who has decision-making authority, and who needs to be informed or consulted. Compatible with Powerpoint, Keynote, and Google Slides. Apply a color-coding scheme to visually distinguish different roles.


26 diapositivas
Crypto Currency Dark Presentation
Navigate the dynamic world of digital finance with our Crypto Currency presentation template, compatible with PowerPoint, Keynote, and Google Slides. This template is an invaluable tool for financial analysts, crypto enthusiasts, and educators in the realm of digital currencies. The design boasts a bold and modern aesthetic, with cryptocurrency motifs that capture the essence of this revolutionary market. With this template, you can present complex financial data and crypto concepts with clarity. Its range of slides includes comparative analyses, timeline infographics, and process diagrams, enabling a thorough exploration of the cryptocurrency landscape. The vibrant colors and creative graphics make it easy to highlight market trends, investment opportunities, and the technology behind cryptocurrencies. By using our Crypto Currency template, you'll engage and educate your audience on the nuances of blockchain and digital assets. Download it today to deliver a presentation that's as innovative and forward-thinking as the topic itself.


6 diapositivas
Hierarchy Level Infographic
Hierarchy level, also known as organizational hierarchy or hierarchical structure, refers to the arrangement of individuals and positions within an organization based on authority, responsibility, and reporting relationships. This infographic template helps to explain the different levels of hierarchy within an organization or a particular system. It is designed to provide a clear and concise overview of the hierarchical structure, allowing viewers to understand the relationships and roles of individuals at each level. This template is compatible with Powerpoint, Keynote, and Google Slides.


6 diapositivas
Execution Strategy and Action Plan Breakdown Presentation
Clarify your business roadmap with the Execution Strategy and Action Plan Breakdown Presentation. This template helps visualize each strategic step using a clean, linear layout with colorful icons. Perfect for outlining processes, task flows, or operational plans. Easily editable in Canva, PowerPoint, and Google Slides for maximum flexibility.


6 diapositivas
Canvas Breakdown for Startup Strategy Presentation
Break down your startup strategy with this streamlined canvas layout. Designed for clarity and flow, this slide presents six core components in a visually engaging format. Ideal for early-stage founders, innovation teams, and pitch decks, it simplifies complex business models into clear, actionable sections for strategic alignment and storytelling.


6 diapositivas
Business Performance Metric Presentation
Give your metrics a breath of fresh air with this modern, nature-inspired design. Perfect for presenting business KPIs, performance tracking, or growth data, this infographic layout uses vibrant pinwheel visuals to guide the viewer through key stats and insights. Fully compatible with PowerPoint, Keynote, and Google Slides for easy editing.


7 diapositivas
Funnel Web Infographic
Maximize your insights with our funnel web infographic. This template is a highly informative tool designed to help you illustrate and understand various processes, from sales pipelines to user engagement funnels. This funnel infographic is all about presenting data in an engaging, easy-to-digest manner. Ideal for marketing professionals, business strategists, and anyone looking to visualize multi-step processes. Compatible with Powerpoint, Keynote, and Google Slides. You can add a vibrant yet professional color scheme to ensure attention of information. Present your data in a visually captivating way!


6 diapositivas
Buyer Behavior Trends Infographic
Unlock the secrets of consumer psychology with our Buyer Behavior Trends Infographic Template. This template offers a compelling visual exploration of modern consumer trends, designed to capture and convey the nuances of buyer behavior in today’s fast-paced market. Featuring a sleek, modern design, each slide is tailored to present data effectively, from spending habits and brand loyalty to digital consumption and decision-making processes. Use this template to illustrate the underlying factors that influence consumer choices and how these trends shape the future of marketing. Perfect for marketers, researchers, and business strategists, this template allows you to customize layouts, colors, and fonts to align with your brand or study focus. It's an invaluable tool for presentations, reports, and digital content, helping you to communicate complex data in an accessible and engaging way.


6 diapositivas
Customer Feedback Infographic
Customer feedback refers to the opinions, comments, suggestions, and insights provided by customers about their experiences with a product, service, or company. This infographic template visually presents key insights and strategies for collecting and utilizing customer feedback effectively. This infographic will help you provide essential information for businesses to understand how customers perceive their offerings and how they can improve to better meet customer needs and expectations. The visual elements and a well-structured design will make the presentation engaging and accessible.