


Características


¿Tienes alguna pregunta?
Recomendar


6 diapositivas
Time Management Skills Infographic
Time Management refers to the process of planning and organizing your time effectively to accomplish tasks, achieve goals, and maximize productivity. This infographic template aims to help individuals improve their time management abilities. It provides practical tips, techniques, and strategies to effectively manage time and increase productivity. This template provides practical guidance on setting goals, prioritizing tasks, managing distractions, and optimizing productivity. This infographic will help your audience develop effective time management skills and make the most of their valuable time.


10 diapositivas
Marketing Funnel Diagram Presentation
Optimize your sales strategy with this Marketing Funnel Diagram template. Ideal for visualizing customer journeys, lead conversion, and sales processes, this design is fully editable to fit your business needs. Customize colors, text, and icons easily. Compatible with PowerPoint, Keynote, and Google Slides for seamless presentations and collaboration.


6 diapositivas
Profit Threshold Break-Even Calculation Presentation
Illustrate financial performance with this profit threshold timeline. The layout spans from big loss to high profit, marking each stage with flag icons and editable labels. Ideal for break-even analysis, sales strategies, or ROI comparisons. Easily customizable in PowerPoint, Keynote, and Google Slides to match your brand’s visual identity.


6 diapositivas
Innovation Ideas Infographics
Energize your presentations with our Innovation Ideas infographic, designed for full compatibility with Powerpoint, Keynote, and Google Slides. This vibrant and insightful infographic is the perfect addition for innovators, entrepreneurs, and educators looking to foster a culture of creativity and ideation. The infographic provides a visual exploration of the innovation process, from ideation to execution. It highlights key concepts and strategies that stimulate creative thinking and drive innovation within teams and organizations. With a focus on collaborative brainstorming and the incubation of ideas, it serves as a guide to developing groundbreaking concepts. Incorporating this infographic into your slides will help you effectively communicate the dynamics of successful innovation strategies. It’s ideal for workshops, team meetings, and academic courses that cover topics such as design thinking, innovation management, and product development. Use it to inspire your audience and to illustrate a roadmap for transforming ideas into tangible innovations.


7 diapositivas
Marketing Team Infographic
This collection showcases a series of slides dedicated to optimizing marketing team operations and strategies. Each template is designed to cater to various facets of marketing planning and execution, featuring layouts that help articulate team roles, campaign timelines, budget allocations, and performance metrics. The slides incorporate diverse visual elements, such as hierarchical diagrams, flow charts, and graphs, to ensure complex information is accessible and engaging. Customizable color palettes and design elements allow for seamless integration into existing corporate branding, making these templates not only functional but also aesthetically aligned with company standards. Ideal for marketing strategy presentations, team meetings, and stakeholder briefings, these slides facilitate a comprehensive overview of marketing efforts, pinpointing achievements and areas for improvement. The adaptability of these templates makes them an essential tool for marketing professionals aiming to communicate effectively and drive results.


20 diapositivas
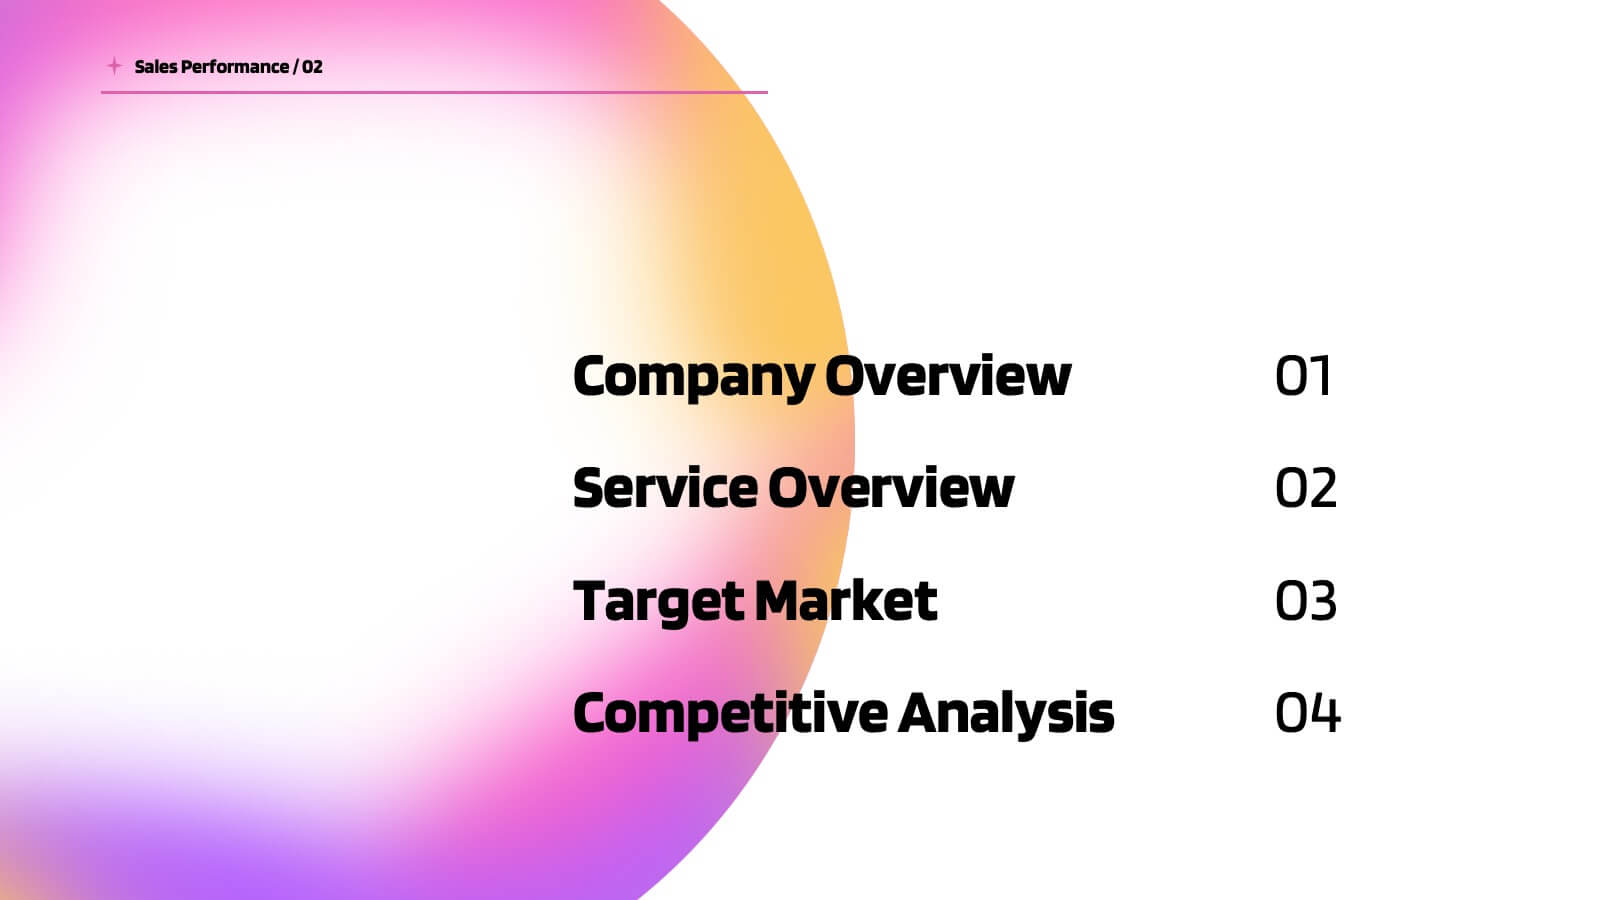
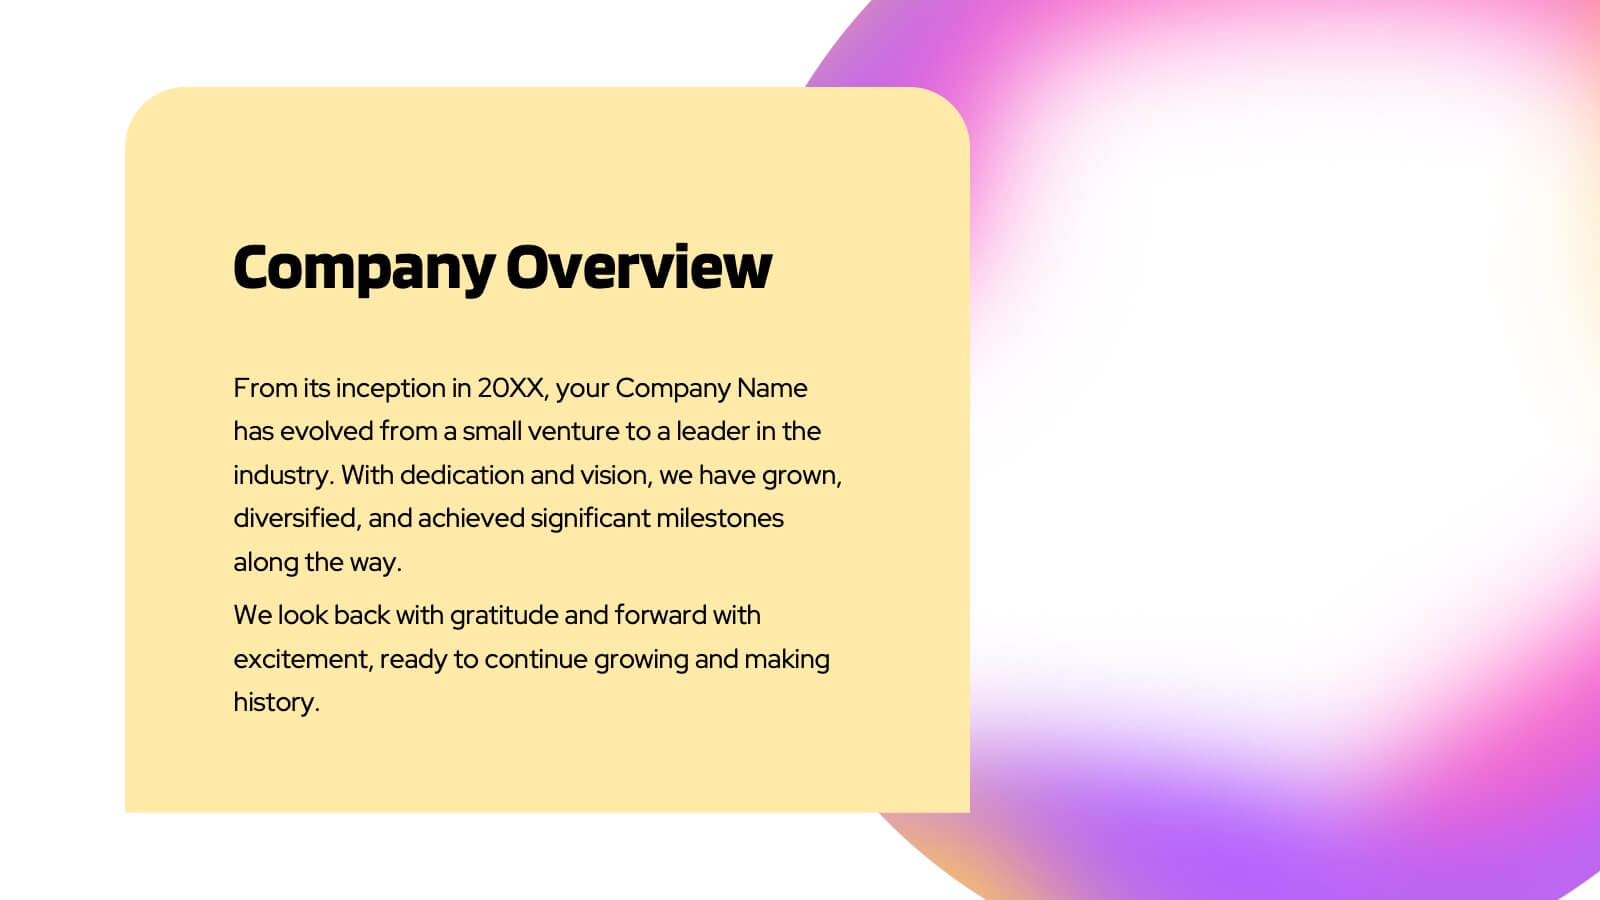
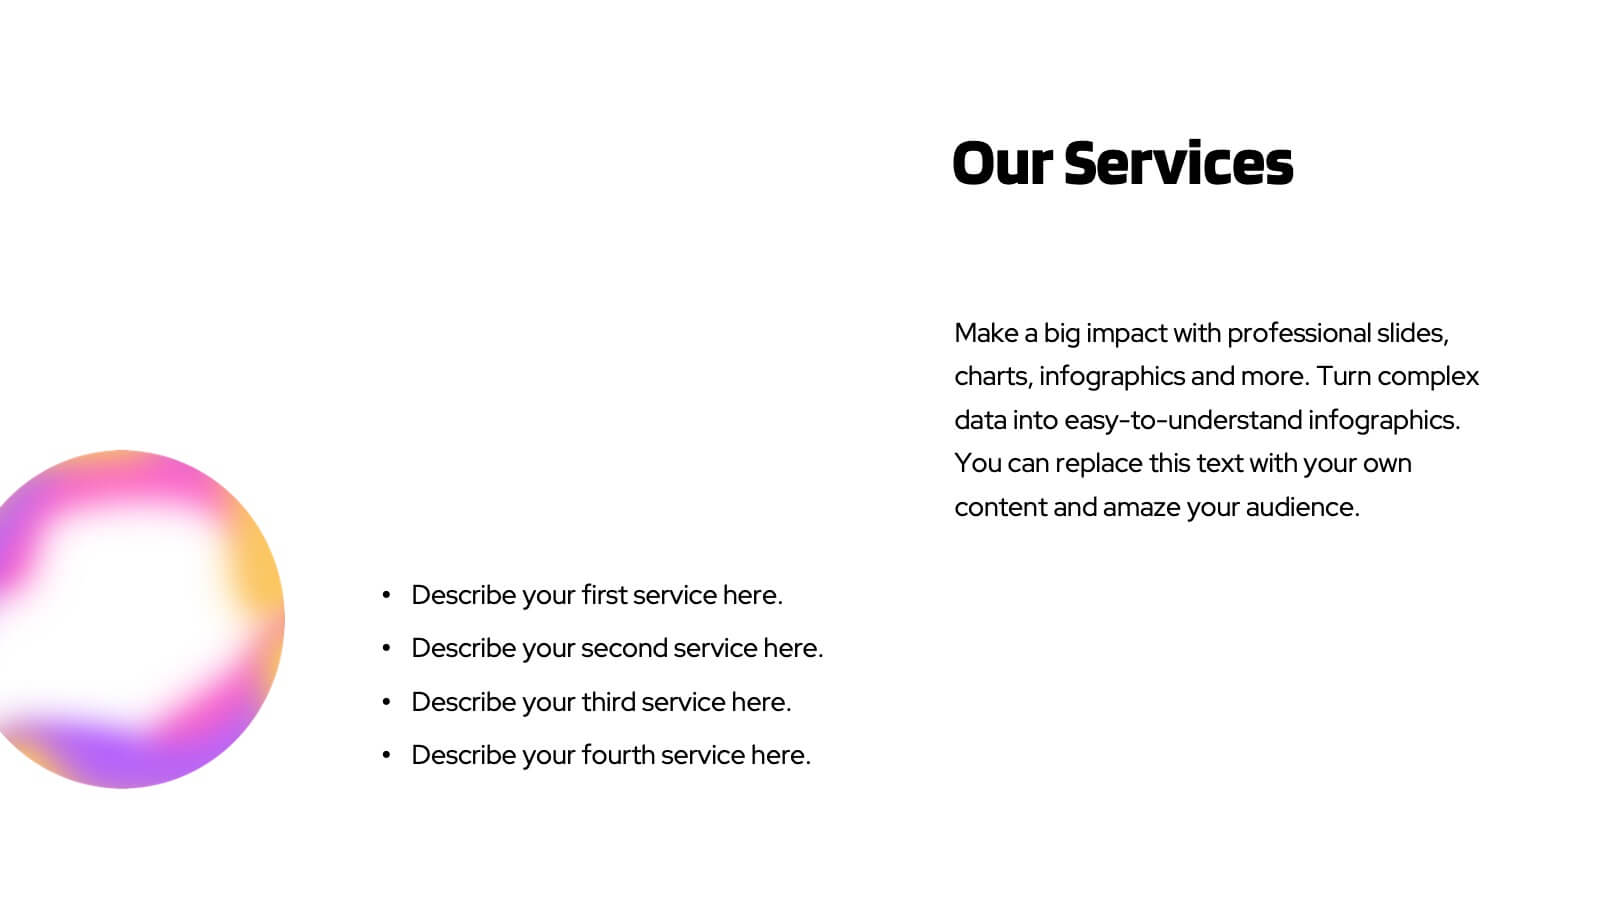
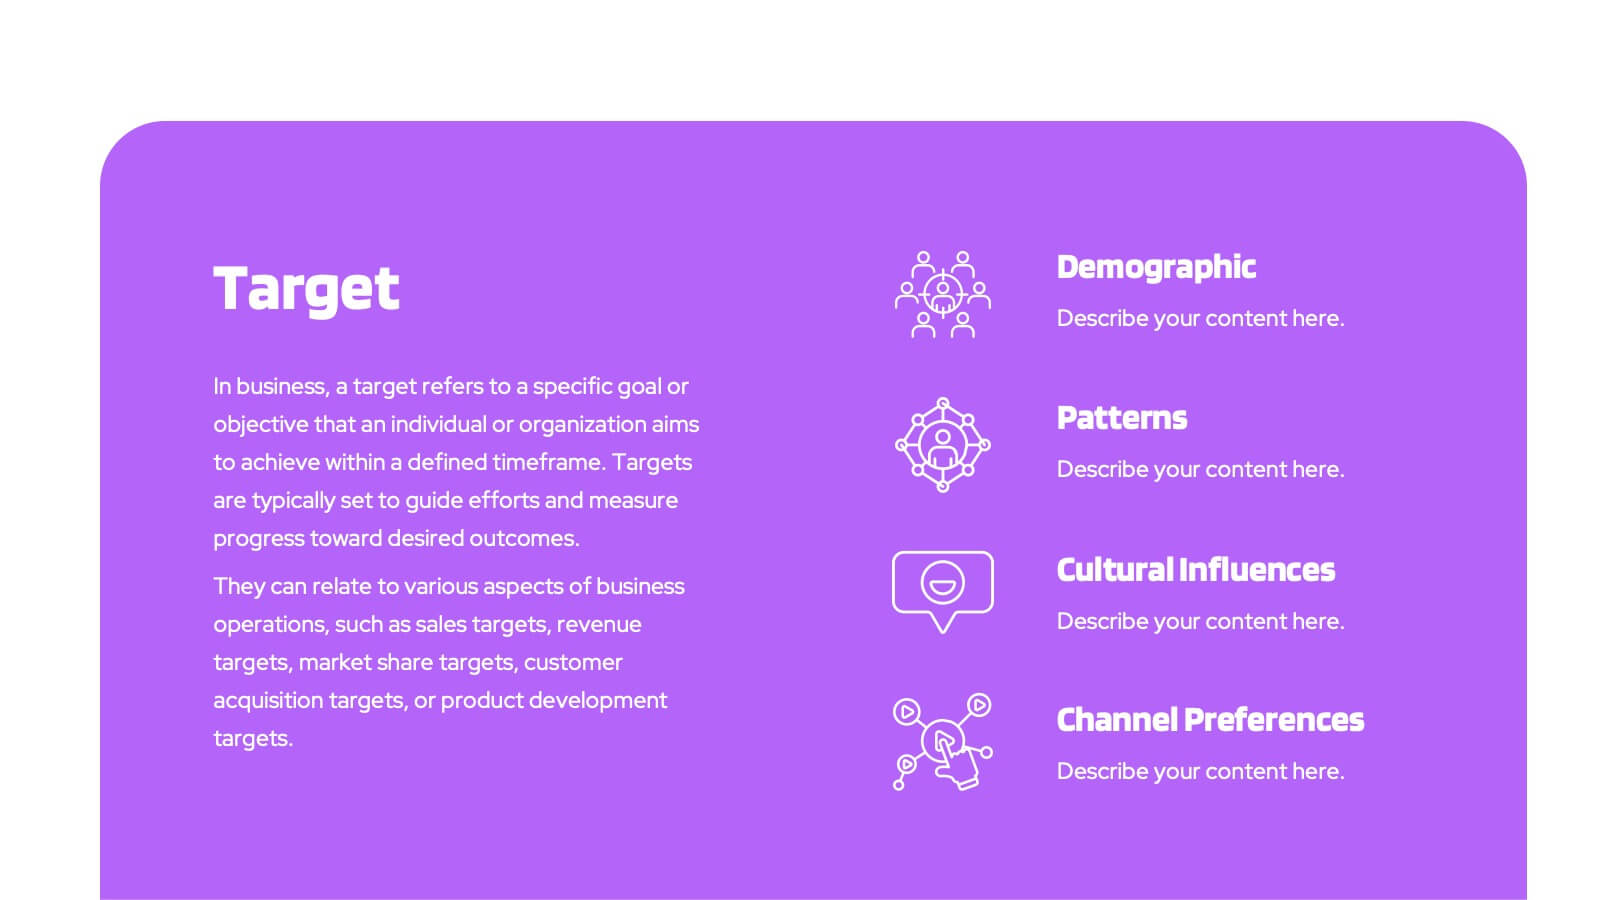
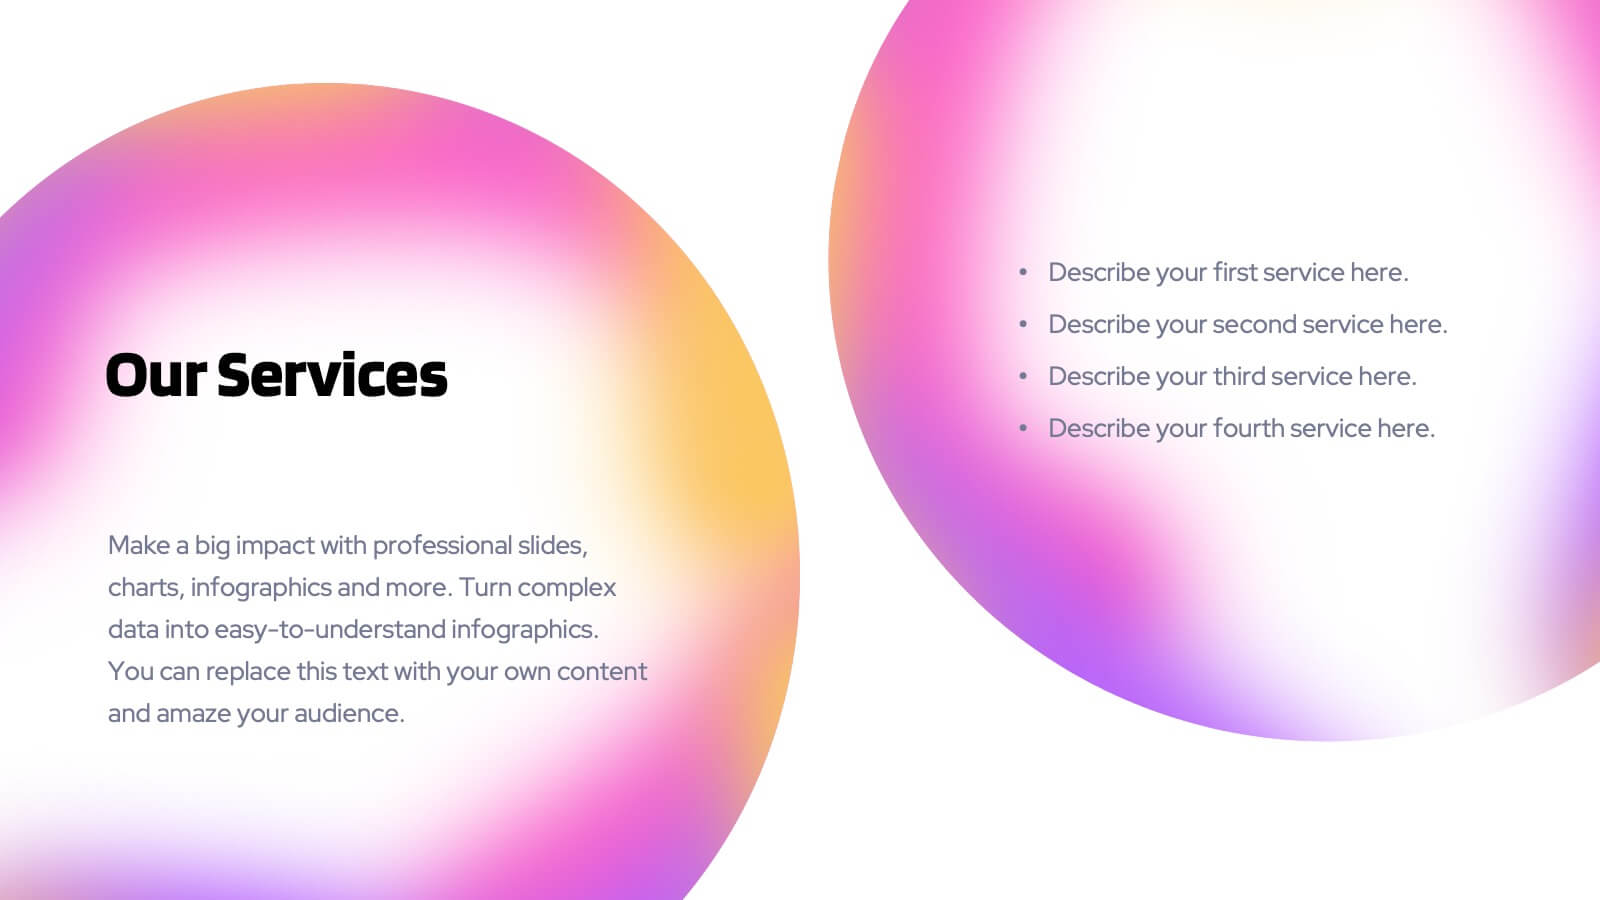
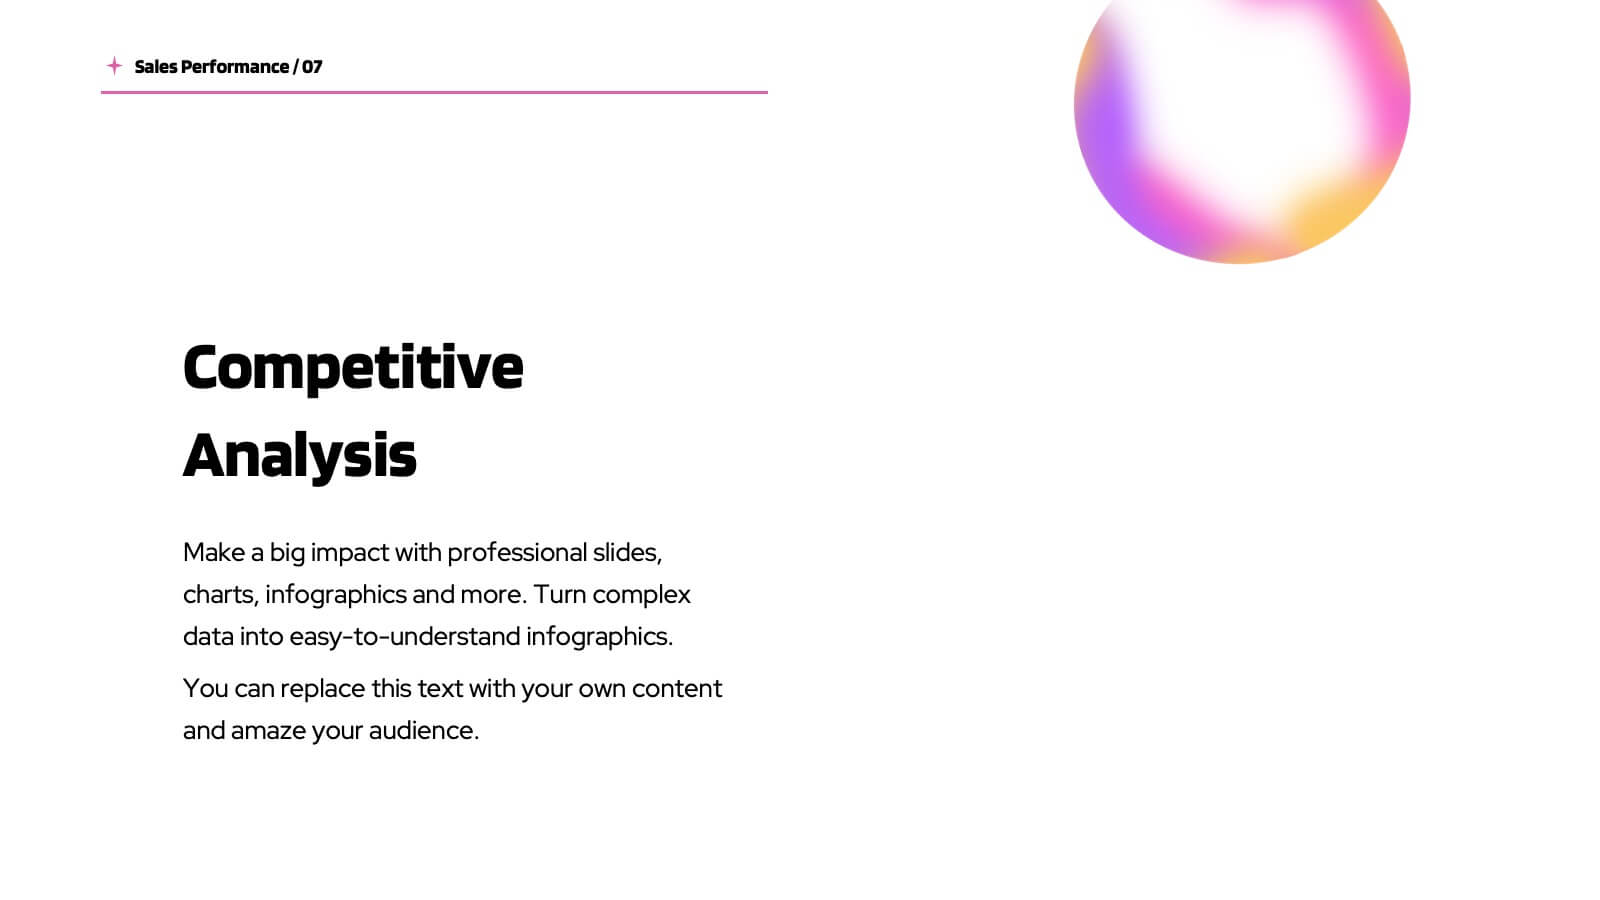
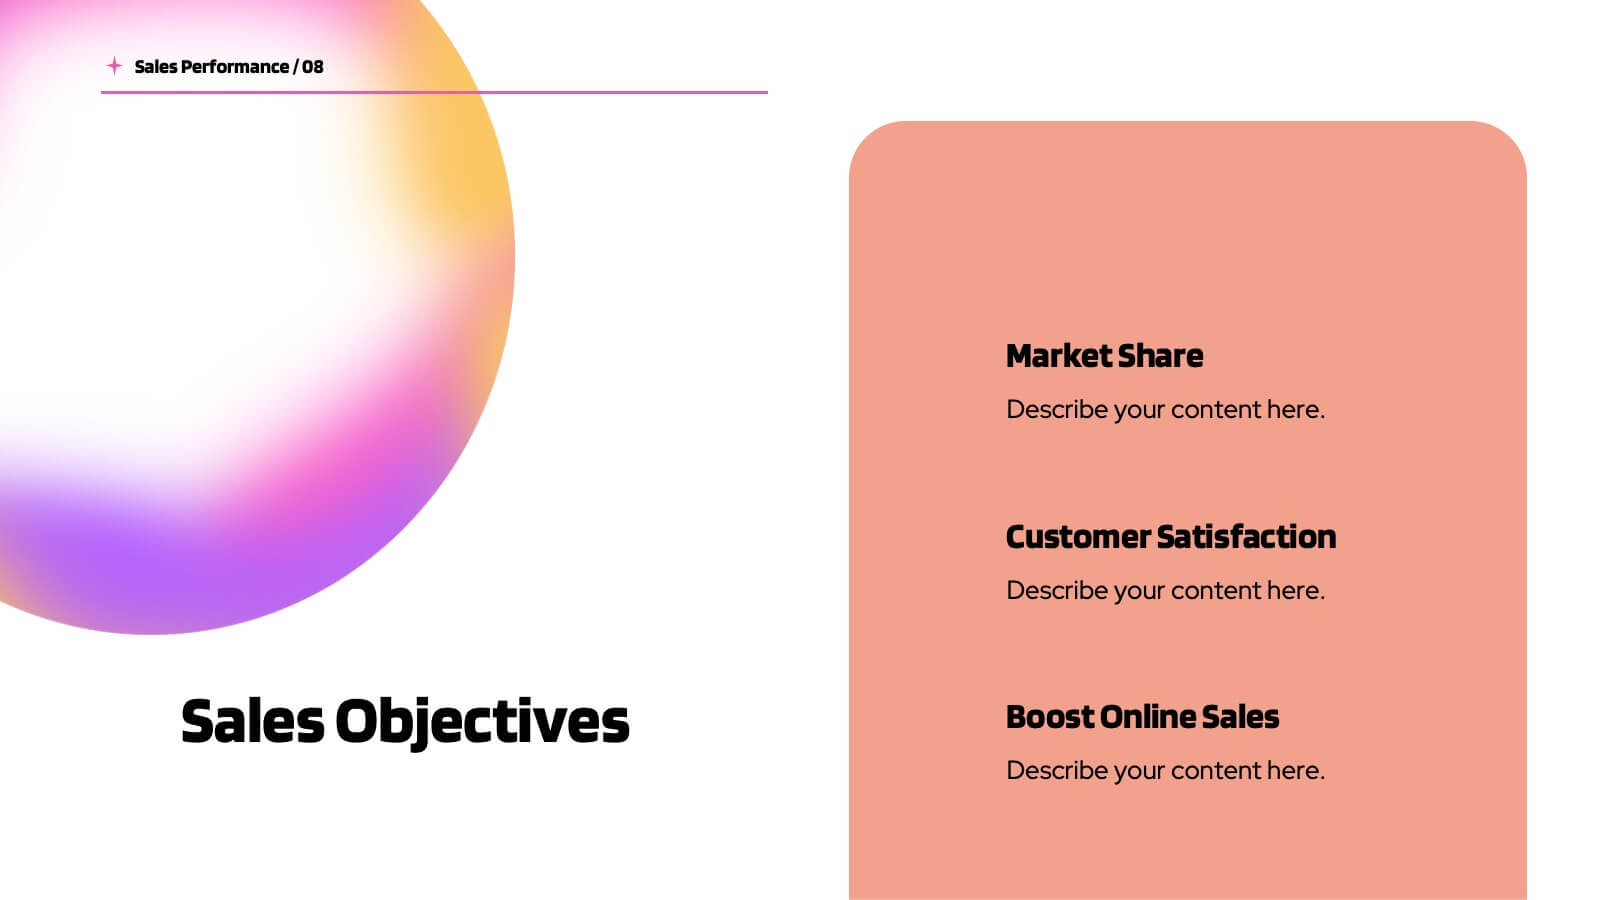
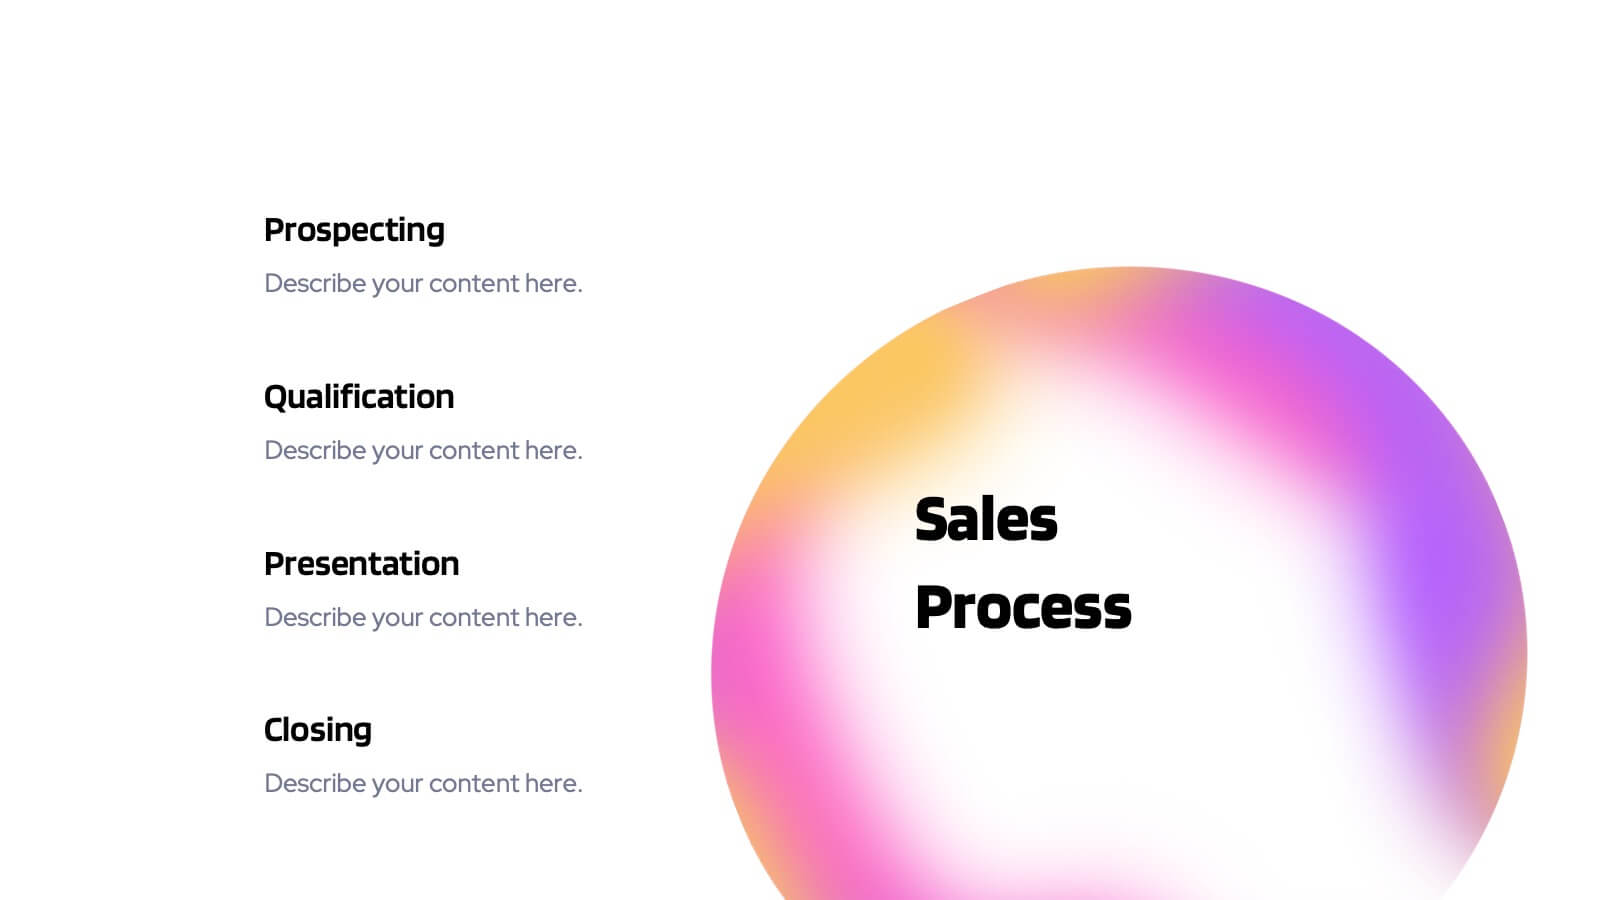
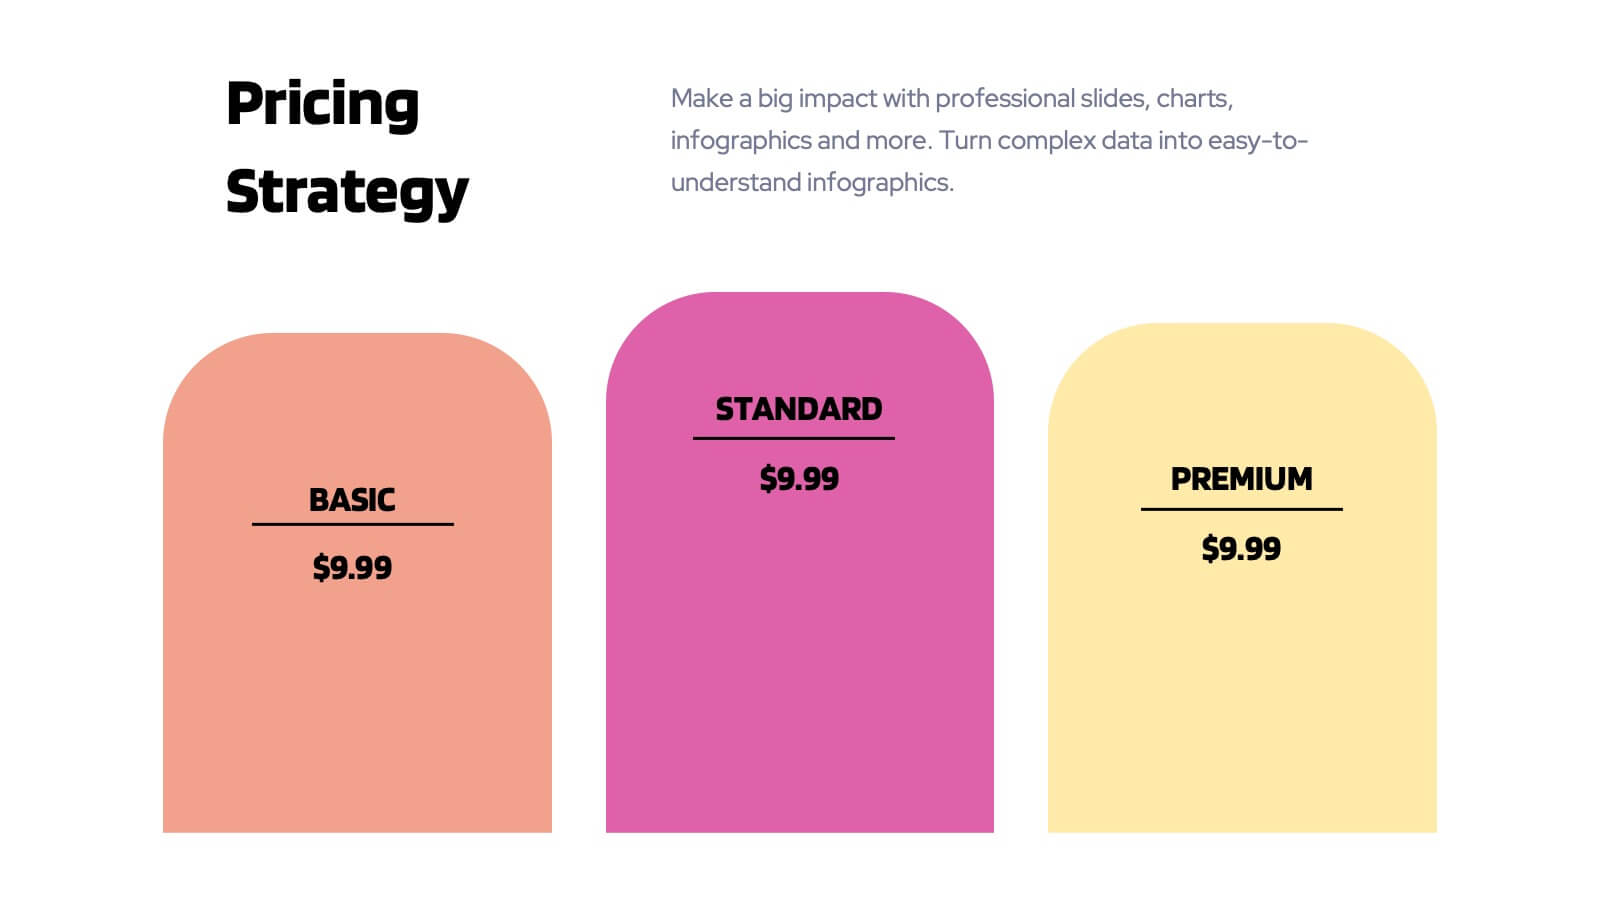
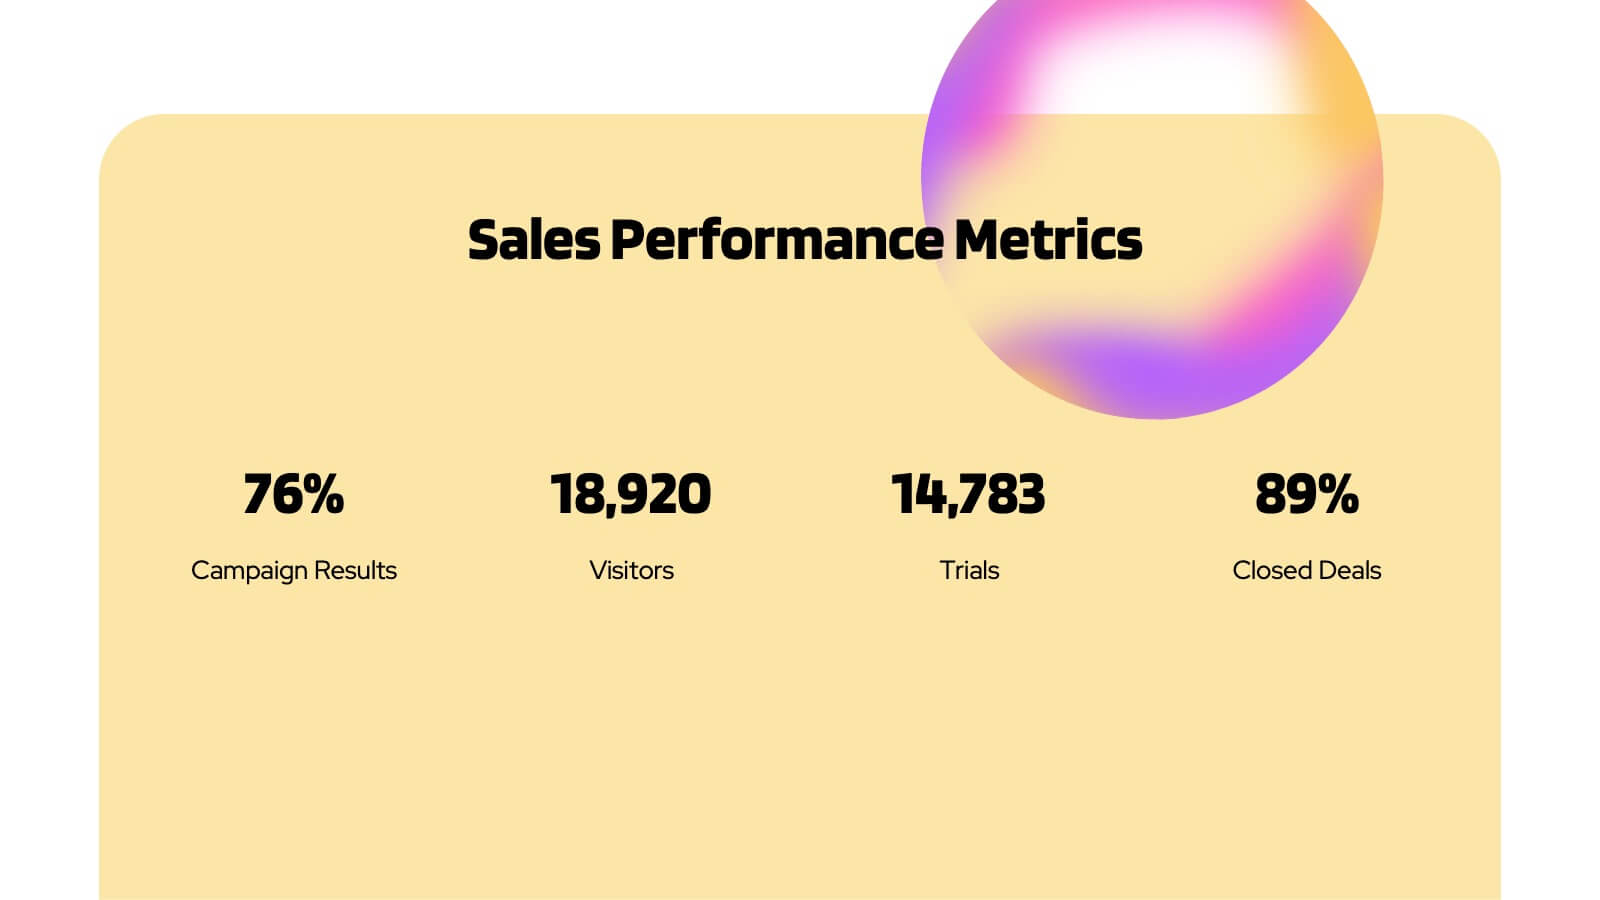
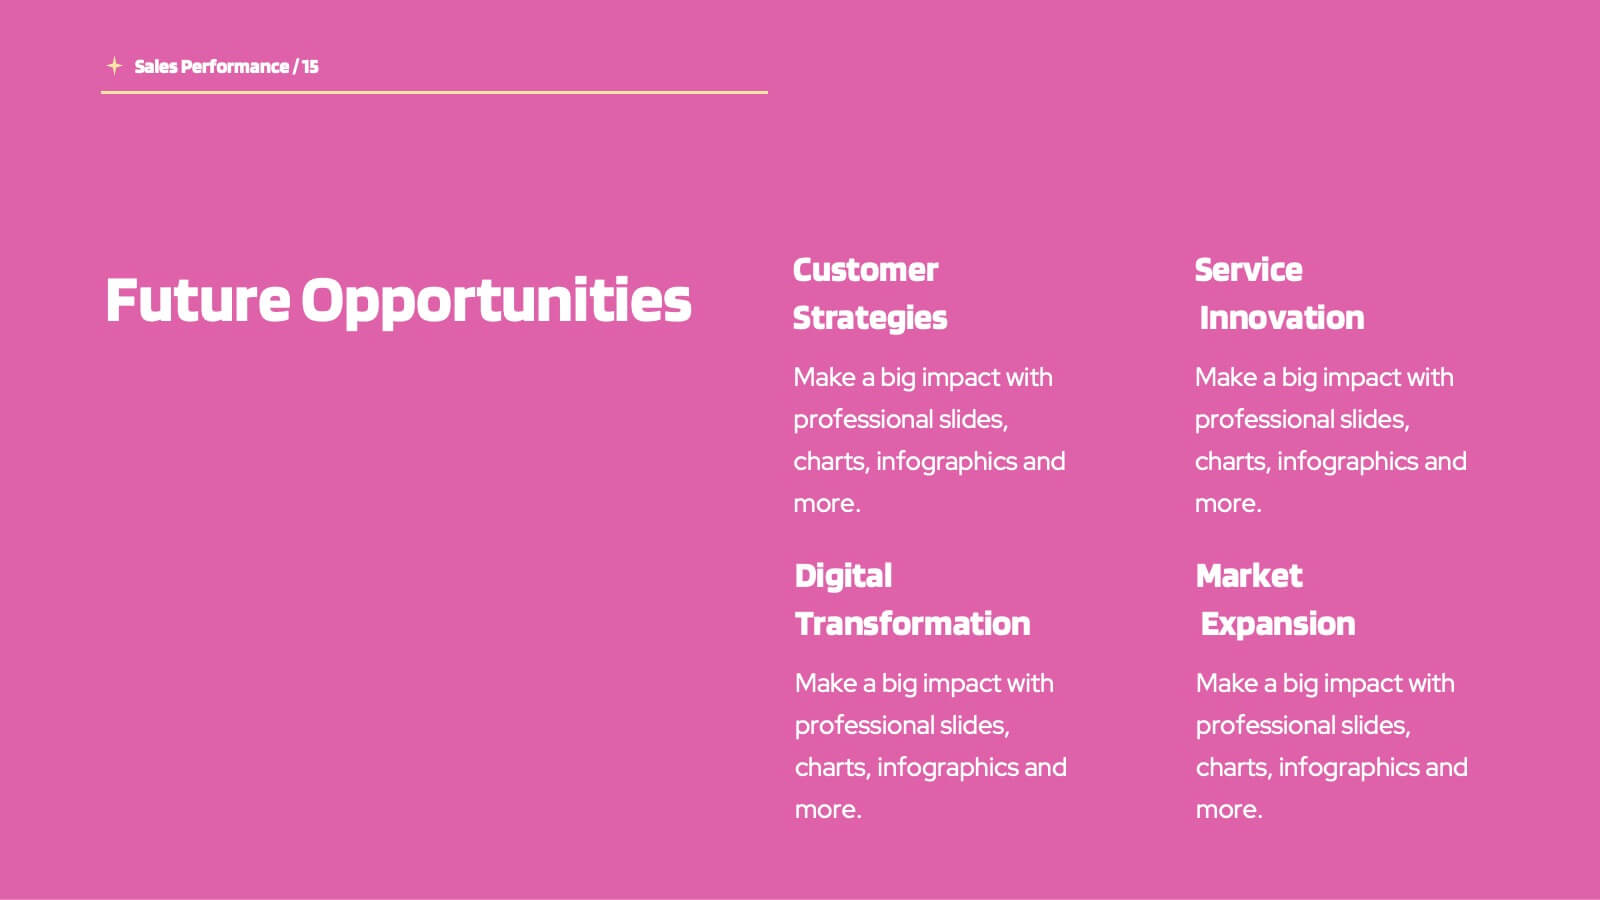
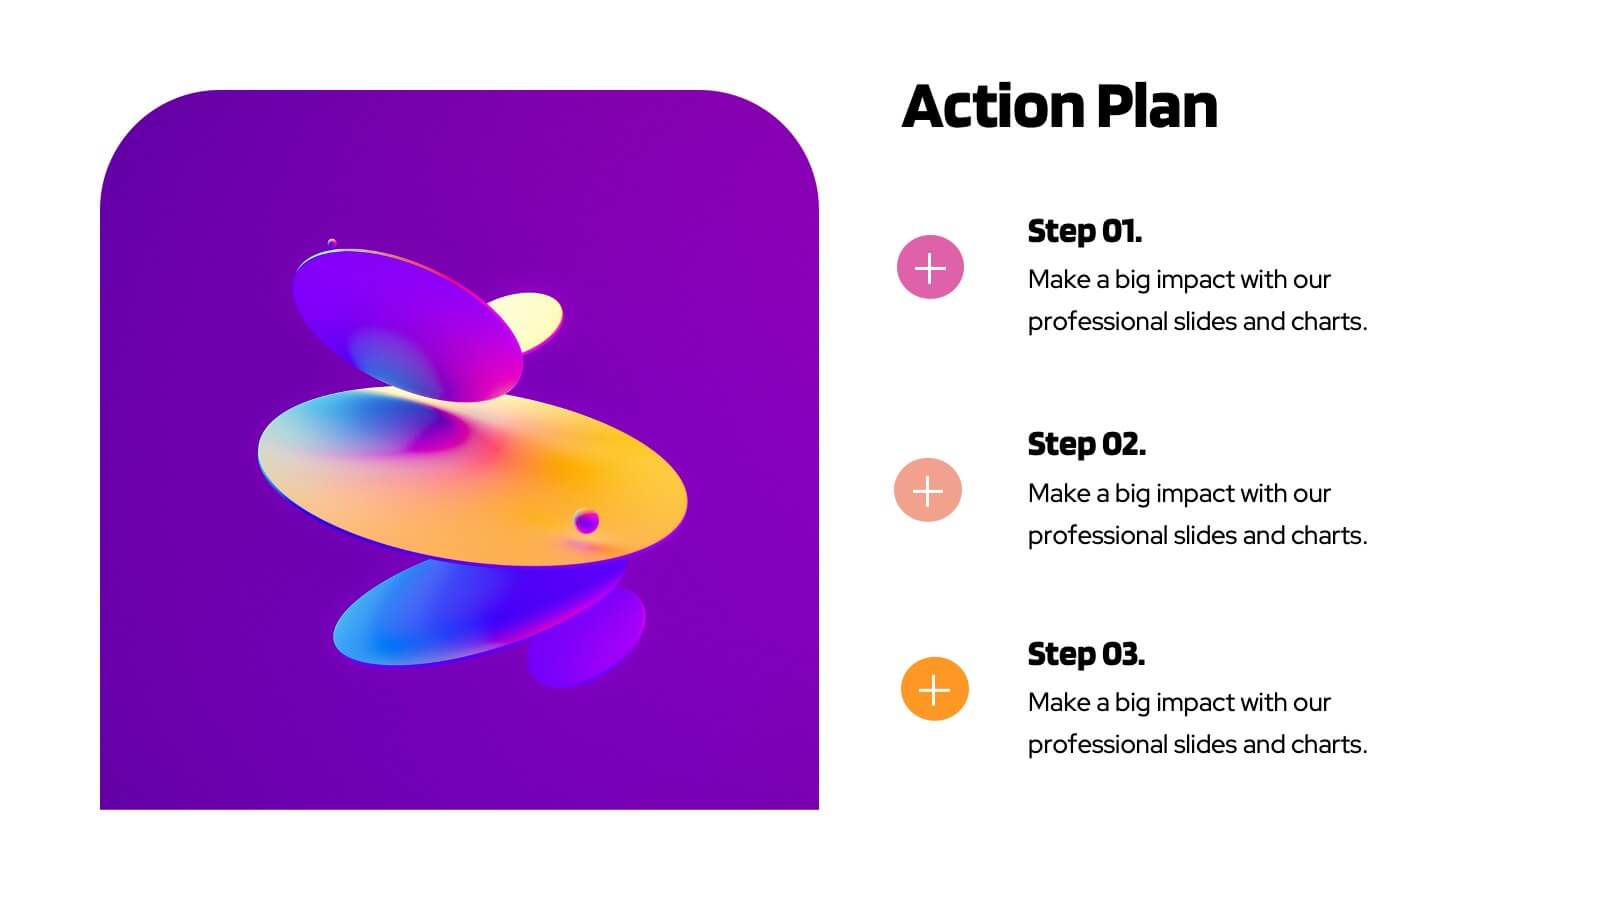
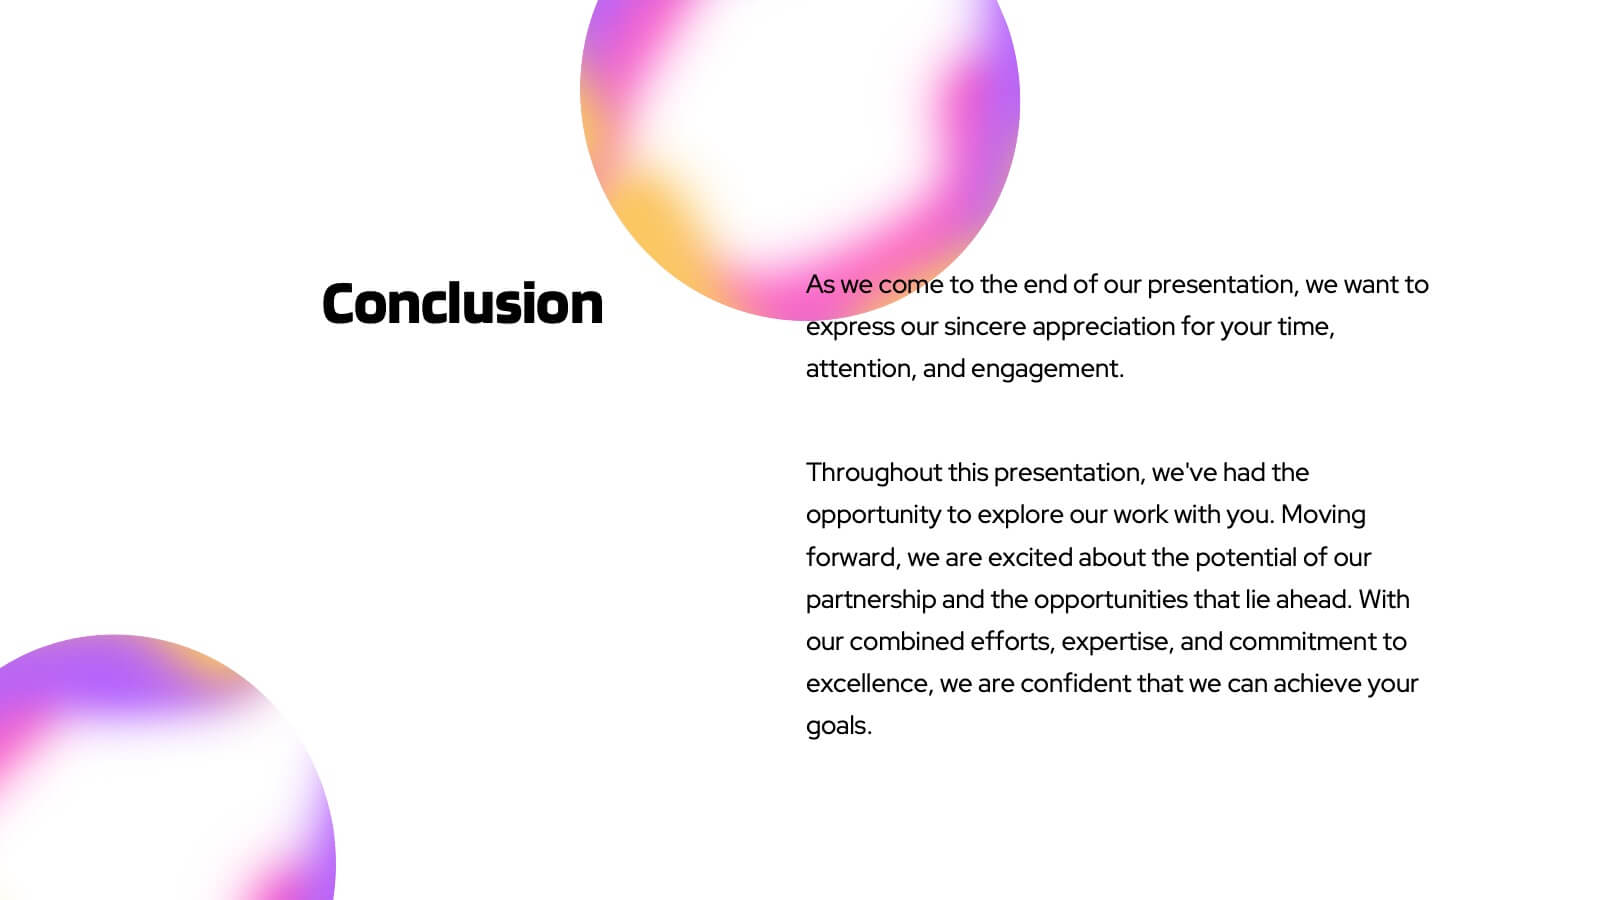
Planetary Sales Performance Report Presentation
Energize your sales efforts with this vivid sales performance presentation template. It includes sections for company overview, detailed sales metrics, and future goals, perfect for showcasing achievements. Compatible with PowerPoint, Google Slides, and Keynote, it’s designed to inform and motivate sales teams effectively.


6 diapositivas
Social Media Metrics Dashboard Presentation
Bring your analytics to life with a bold, visual dashboard that makes social performance easy to understand at a glance. This presentation helps you showcase engagement, growth, and platform insights with clean charts and organized data sections. Fully editable and compatible with PowerPoint, Keynote, and Google Slides.


6 diapositivas
Visual Business Concept Triangle
Communicate processes, concepts, or growth stages with this dynamic triangle layout. Perfect for highlighting five key ideas or steps in a sleek, professional way. Fully customizable in PowerPoint, Keynote, and Google Slides for easy personalization.


26 diapositivas
Briarfall Rebranding Project Plan Presentation
This Brand Presentation Template offers a modern and structured approach to showcasing your brand identity, values, and strategic direction. Covering essential elements like audience personas, brand positioning, touchpoints, and performance metrics, it's fully customizable and perfect for businesses looking to strengthen their brand presence. Compatible with PowerPoint, Keynote, and Google Slides.


7 diapositivas
Project Schedule Infographics
The Project Schedule Infographic offers a dynamic and clear visual representation of project timelines and tasks. Fully compatible with PowerPoint, Google Slides, and Keynote. It is designed to facilitate project managers, team leads, and members in tracking milestones and deadlines effectively. The infographic breaks down the week into individual days and assigns specific tasks and goals to each, allowing for a comprehensive overview of the project's progression. This schedule template is not only a tool for maintaining organization within a team but also acts as a communication aid to provide updates at a glance.


6 diapositivas
Virtual Team Collaboration and Productivity Presentation
Boost team synergy and streamline communication with this Virtual Team Collaboration and Productivity presentation. Designed around a 6-step path, this visual layout helps illustrate key strategies for remote teamwork, digital workflows, and efficient task distribution. Each step is clearly labeled with space for your insights, making it ideal for team training, project kickoff meetings, or collaboration tool tutorials. Fully editable and compatible with PowerPoint, Keynote, and Google Slides.


5 diapositivas
IT Service Operations Strategy Presentation
Streamline your IT presentations with the IT Service Operations Strategy Presentation template. This structured layout is designed to showcase key service operation metrics, strategies, and performance indicators in a visually engaging format. Ideal for IT teams, service managers, and business analysts, this slide helps simplify complex IT processes with clear data points and percentages. Fully customizable in PowerPoint, Keynote, and Google Slides for effortless adaptation to your needs.


4 diapositivas
Identifying Performance Gaps
Clearly showcase the steps needed to bridge critical performance gaps with this modern template. Ideal for strategic planning, business reviews, and goal-setting sessions. Highlight each stage of growth with dynamic visuals. Fully customizable for PowerPoint, Keynote, and Google Slides.


5 diapositivas
Beer Industry Infographics
The beer industry refers to the production, distribution, and sale of beer, which is a popular alcoholic beverage consumed worldwide. These vertical infographics provide key insights into the beer industry. They are designed to present data, facts, and trends in a visually engaging format, making it easy for viewers to understand and retain the information. The infographics feature a captivating design with beer-themed visuals, vibrant colors, and appealing typography. The visuals are carefully chosen to represent different aspects of the beer industry and create a cohesive and visually appealing infographic.


8 diapositivas
Cooperative Team Collaboration Strategy Presentation
Illustrate your teamwork dynamics with this interconnected diagram that visually represents synergy, communication flow, and shared responsibilities. Ideal for project planning, remote team updates, or stakeholder presentations. Fully editable in PowerPoint, Keynote, and Google Slides—adjust icons, colors, and text effortlessly to fit your narrative.


20 diapositivas
Fenrir Investor Pitch Presentation
Deliver a compelling and persuasive pitch with this sleek and professional investor pitch deck! It covers essential sections like problem and solution, market opportunity, business model, financials, and growth strategy to ensure your vision is clearly communicated. Ideal for startup fundraising or business presentations, this template is fully compatible with PowerPoint, Keynote, and Google Slides.


6 diapositivas
3D Diagram Slide Presentation
Bring your ideas to life with this modern 3D visual layout that adds depth and clarity to any concept. Ideal for breaking down complex information into four connected sections, it enhances understanding through visual hierarchy. Fully customizable and compatible with PowerPoint, Keynote, and Google Slides for effortless use.