


Características


¿Tienes alguna pregunta?
Recomendar


4 diapositivas
Cause-Effect Relationships Bowtie Format Presentation
Clearly illustrate the connection between causes and outcomes with the Cause-Effect Relationships Bowtie Format Presentation. Designed to simplify complex business logic, this layout uses a symmetrical bowtie shape to contrast contributing factors with resulting effects. Ideal for strategy, operations, or risk analysis. Fully editable in Canva, PowerPoint, Google Slides, and Keynote.


8 diapositivas
Financial Year in Review Annual Report
Showcase your company’s financial performance with clarity using this Financial Year in Review Annual Report slide. Featuring a dynamic line graph, currency visuals, and segmented insights, this slide is perfect for summarizing revenue trends and year-end highlights. Fully customizable in PowerPoint, Keynote, and Google Slides.


6 diapositivas
Business Strategy Pyramid Presentation
Outline your strategic priorities with clarity using the Business Strategy Pyramid Presentation. This template features a five-step 3D pyramid that highlights key business goals, initiatives, or stages. Each layer includes icons and numbered sections for easy interpretation. Ideal for strategy meetings, executive briefings, and growth plans. Fully editable in PowerPoint, Keynote, and Google Slides.


5 diapositivas
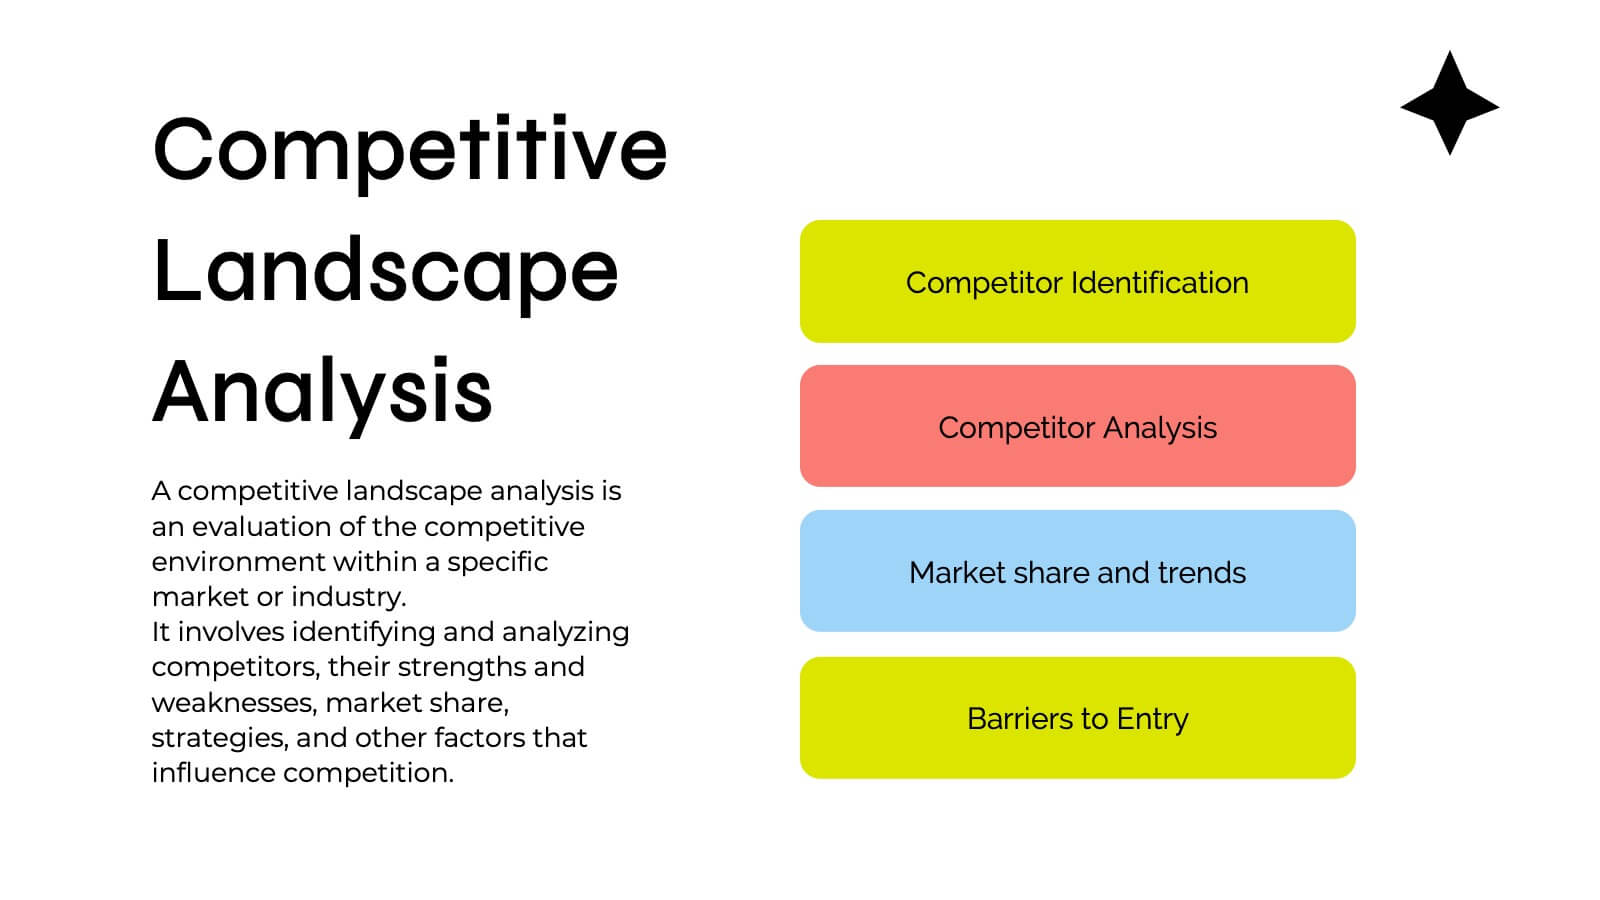
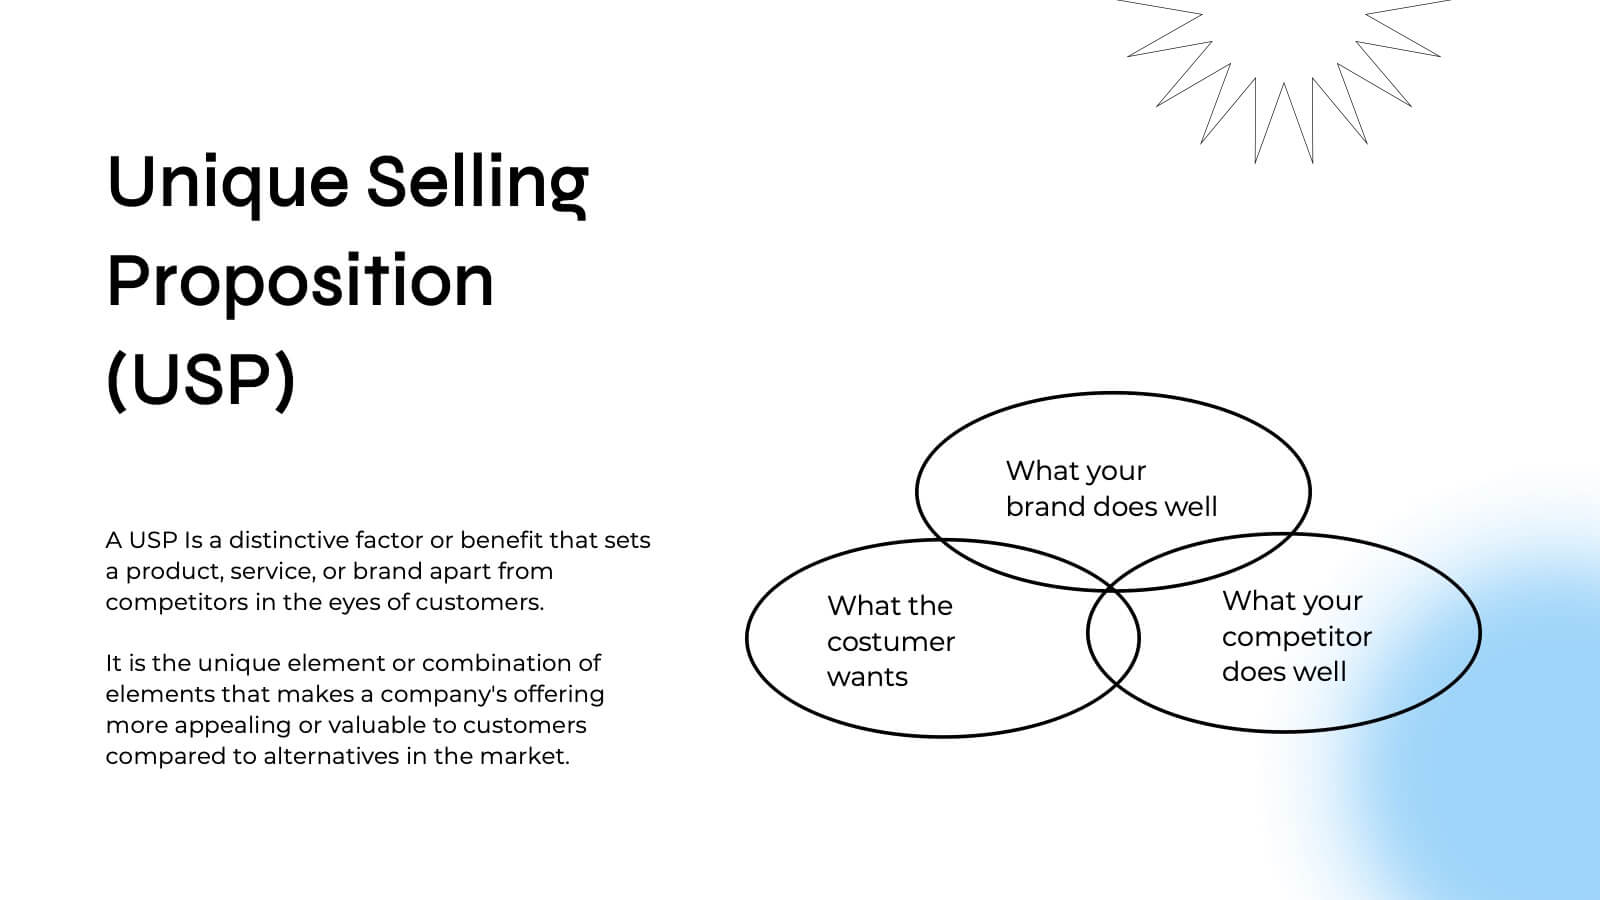
Business Innovation Strategy Presentation
Present a compelling Business Innovation Strategy with this modern infographic. Designed to highlight key insights, innovative solutions, and strategic approaches, this template is perfect for business professionals, consultants, and startups. Fully editable and compatible with PowerPoint, Keynote, and Google Slides.


4 diapositivas
Data Table Infographic Presentation
Organize complex information clearly with the Data Table Infographic Presentation. This slide design features a structured table layout paired with icon-labeled column headers for visual clarity. Ideal for presenting statistics, performance metrics, survey data, or structured comparisons. Highlighted headers draw attention to key sections, making your data easy to digest. Fully editable in PowerPoint, Keynote, and Google Slides.


4 diapositivas
Risk Assessment Matrix Presentation
Highlight and evaluate business uncertainties with this Risk Assessment Matrix Presentation. Featuring a clean grid layout and color-coded risk levels, this template allows you to map out potential risks by likelihood and impact. Use the customizable labels, percentages, and legend to make your analysis clear and actionable. Ideal for project managers, consultants, or strategy teams. Compatible with PowerPoint, Keynote, and Google Slides.


7 diapositivas
Progress Infographic Presentation Template
Our Progress template is designed with a simple layout for presenting your infographic with flow charts and progress bars. This layout is made to be used as a presentation layer so that you can easily change text and images from one slide to the next. It comes with useful icons and illustrations to help you create a more informative presentation. This is a well-organized template for PowerPoint presentations. It allows you to present important information with clear and concise structure. With its useful design and features, you can create an engaging presentation in just minutes.


4 diapositivas
E-Learning Course Design Overview Presentation
Spark curiosity from the very first slide with a clean, modern layout that explains how effective online learning experiences are planned and delivered. This presentation walks through key elements of course structure, content flow, and learner engagement in a simple, visual way. Fully compatible with PowerPoint, Keynote, and Google Slides.


5 diapositivas
Health Awareness Campaign Presentation
Bright and uplifting, this slide brings awareness to important health causes through a clean ribbon-focused layout that’s easy to read and visually engaging. It helps present key messages, statistics, or campaign steps clearly while keeping the design calm and supportive. Fully compatible with PowerPoint, Keynote, and Google Slides.


7 diapositivas
Pyramid Scheme Infographic Presentation
A Pyramid Infographic is a great way to organize, highlight, and illustrate your ideas and content. This design uses visual hierarchy and colors to convey key information in an attractive way. The Pyramid incorporates colorful diagrams to allows your text to stand out while it is set against a white background. This is a simple, engaging design that can be easily edited. This is great for analyzing data and it is the perfect choice to impress the audience. It will surely help you convey your message in a much better way. It's a great way to communicate the key points of your Infographic.


8 diapositivas
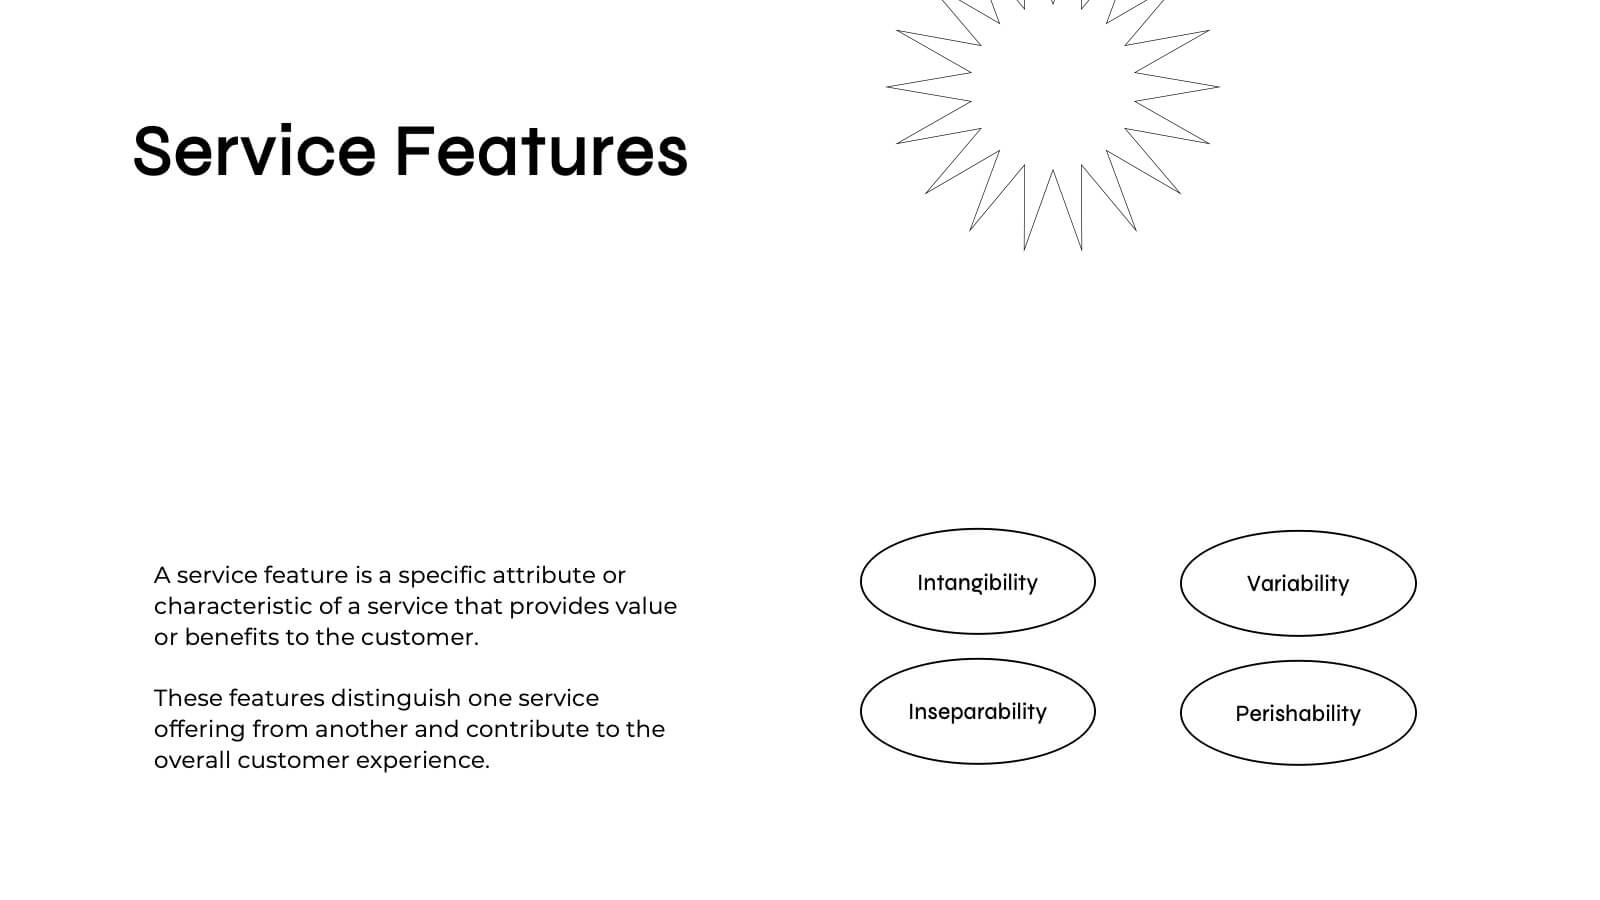
Brainstorming Visualization
Spark creativity with the Brainstorming Visualization Presentation—a dynamic diagram built to energize your ideation process. Featuring a lightning bolt cloud as the central symbol, this layout radiates out to four key thought nodes, each with space to highlight insights, solutions, or topics. Ideal for team ideation, strategic planning, or mind mapping. Fully editable in PowerPoint, Keynote, and Google Slides.

22 diapositivas
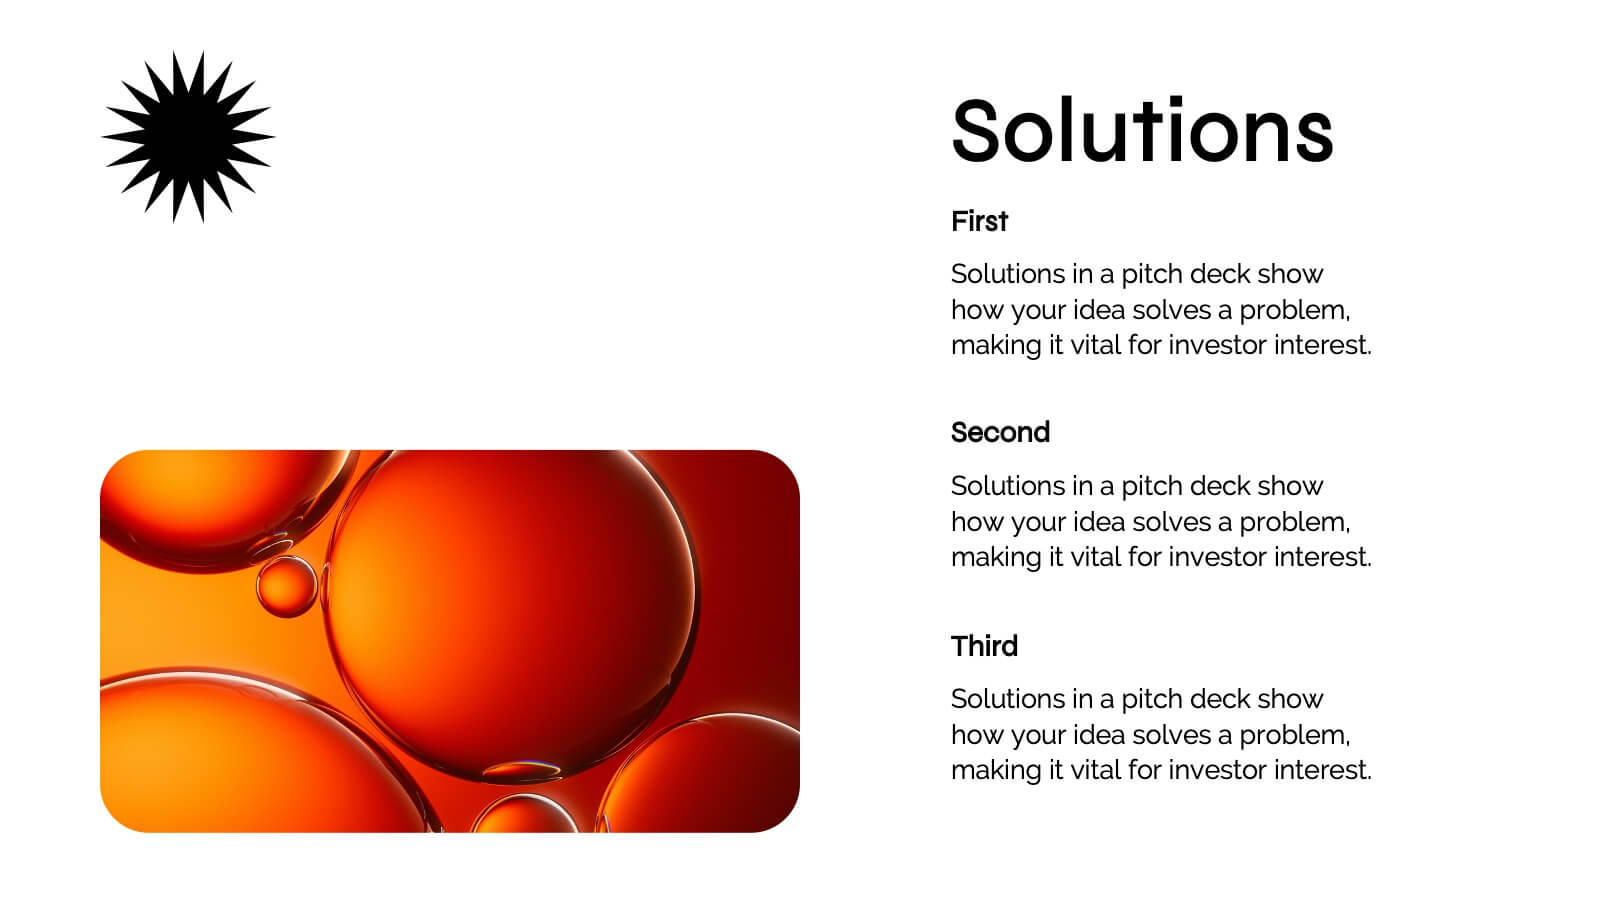
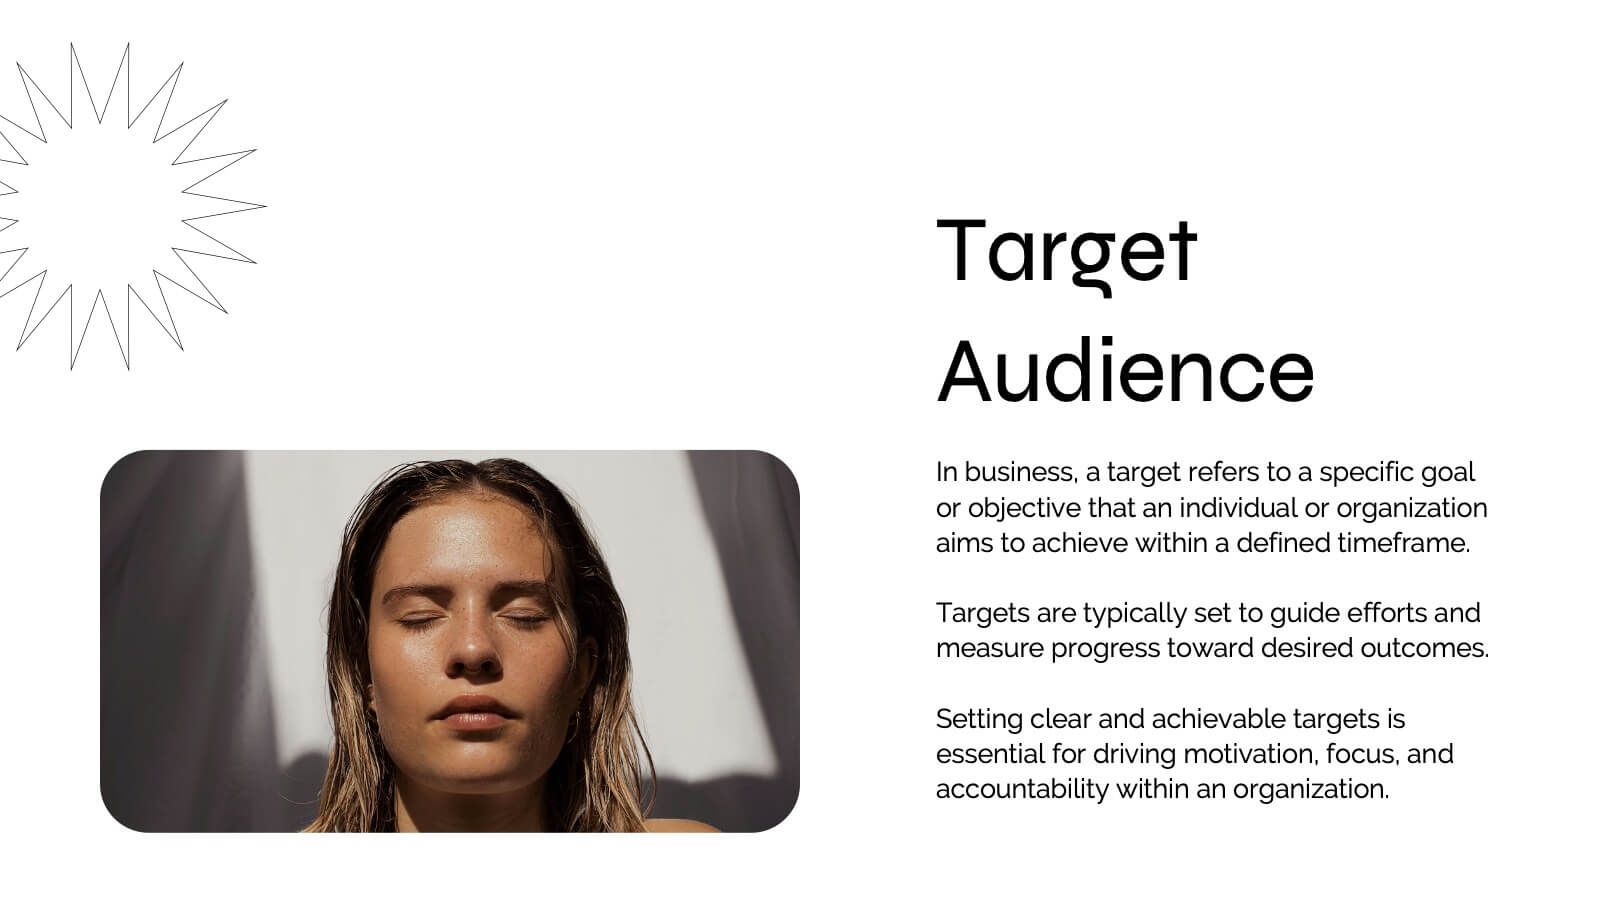
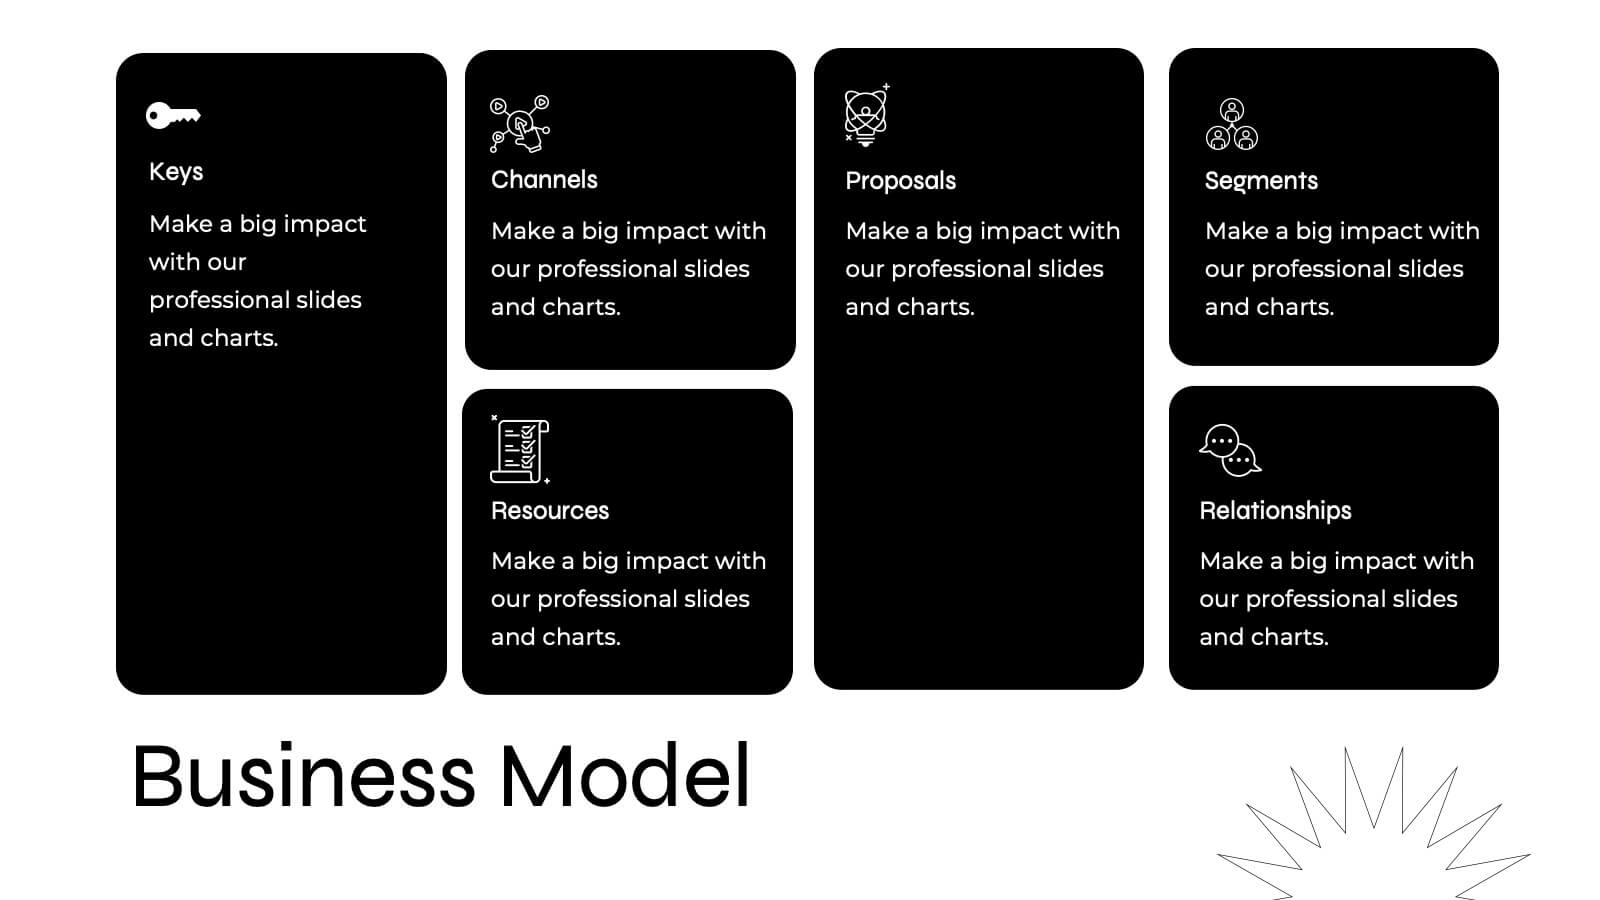
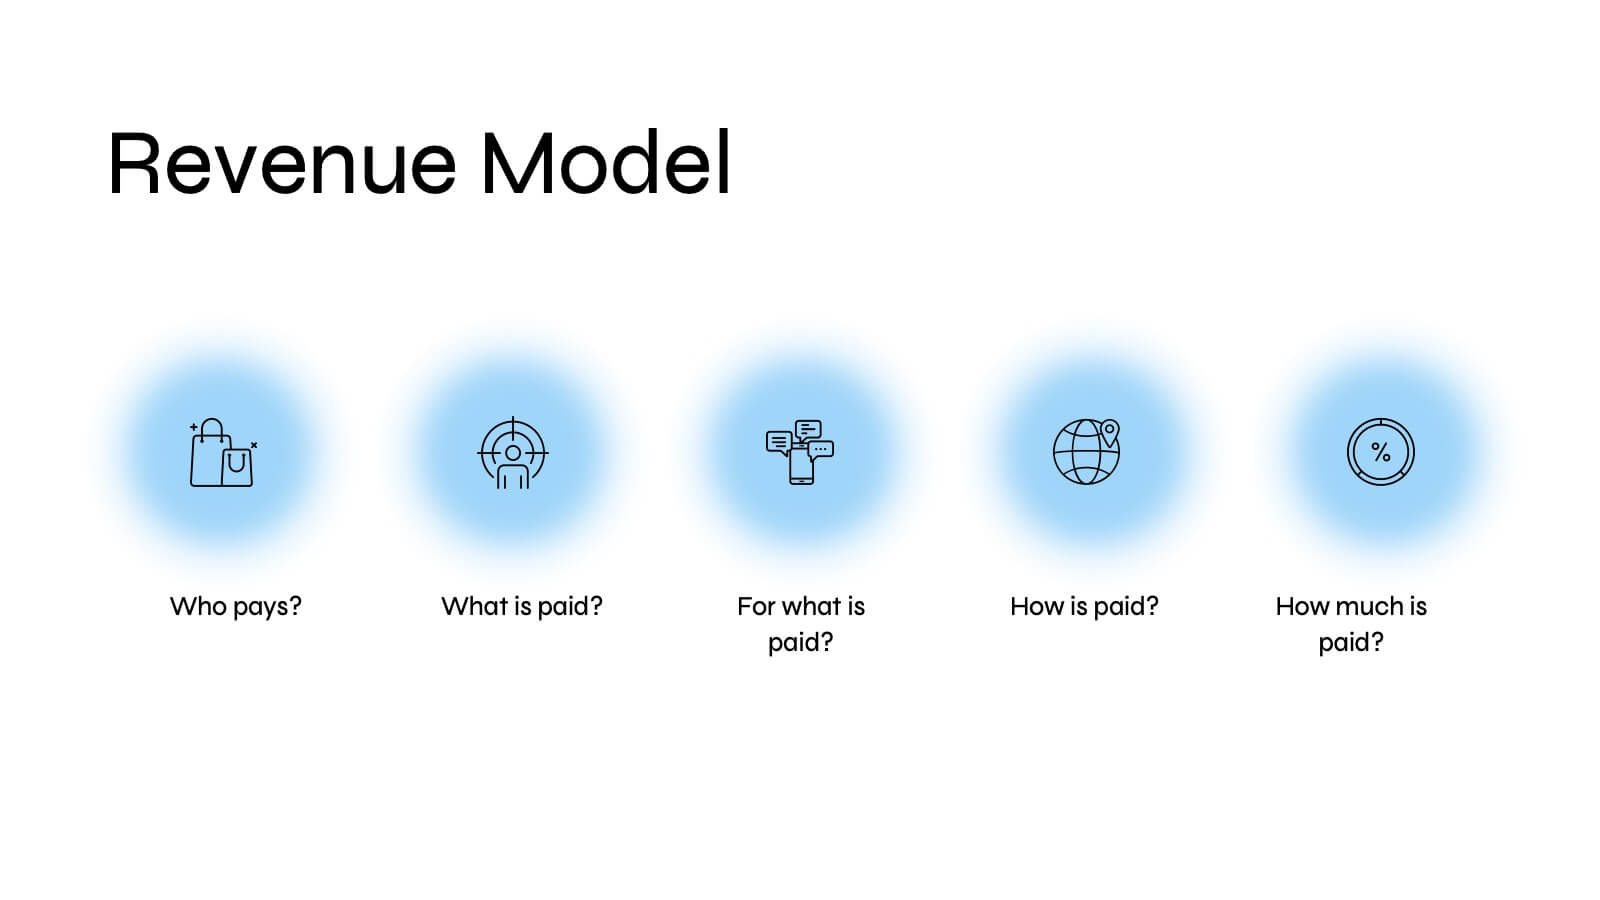
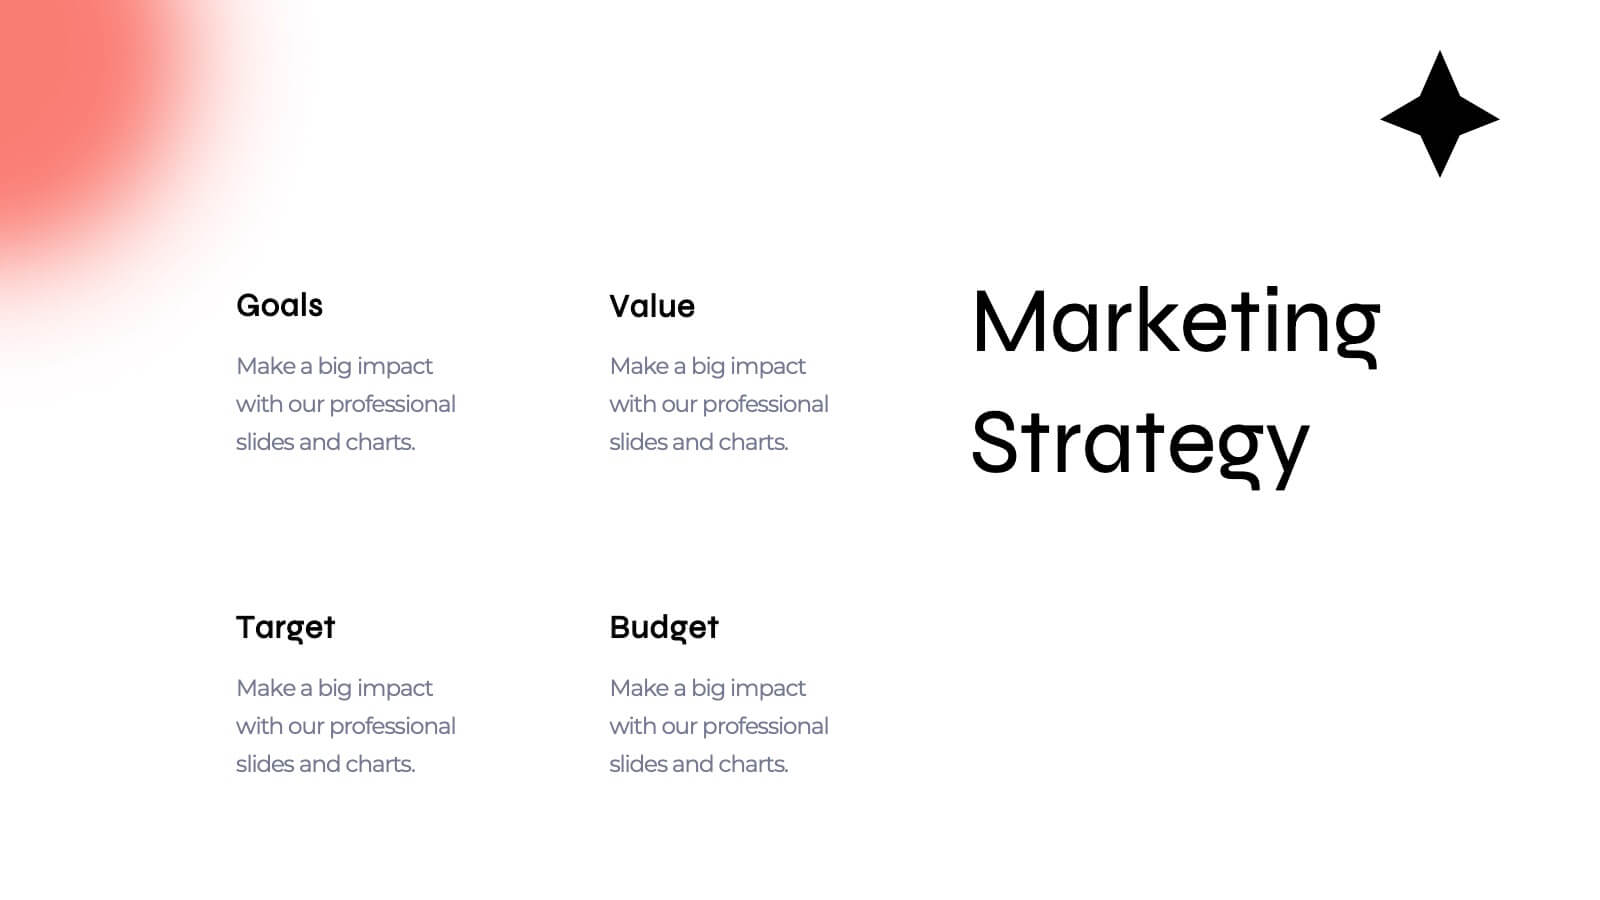
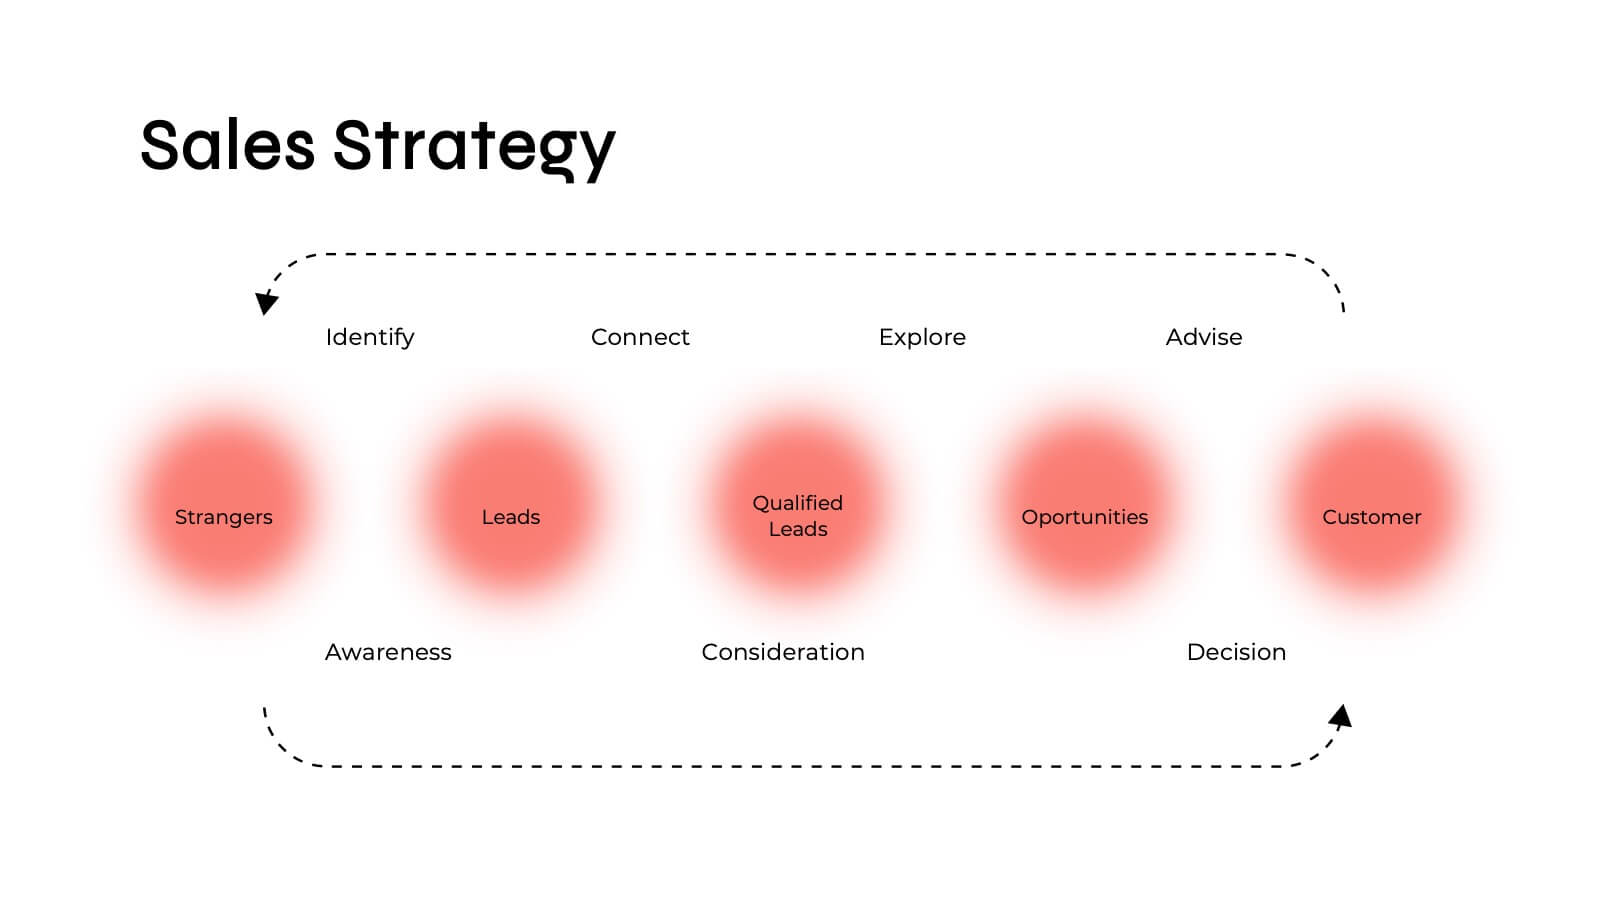
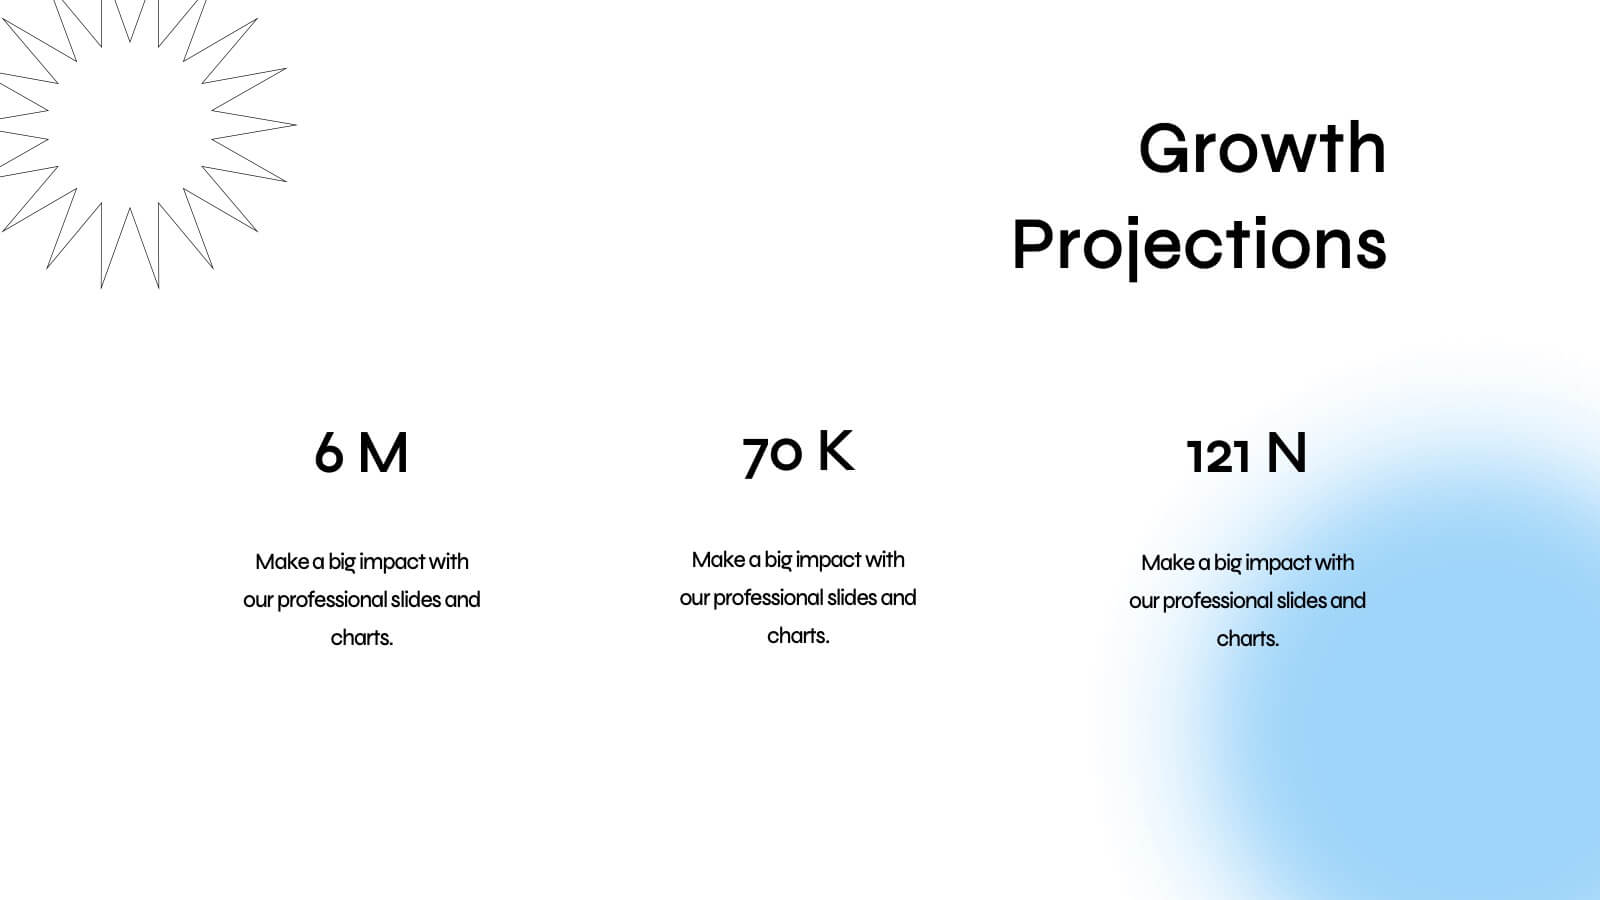
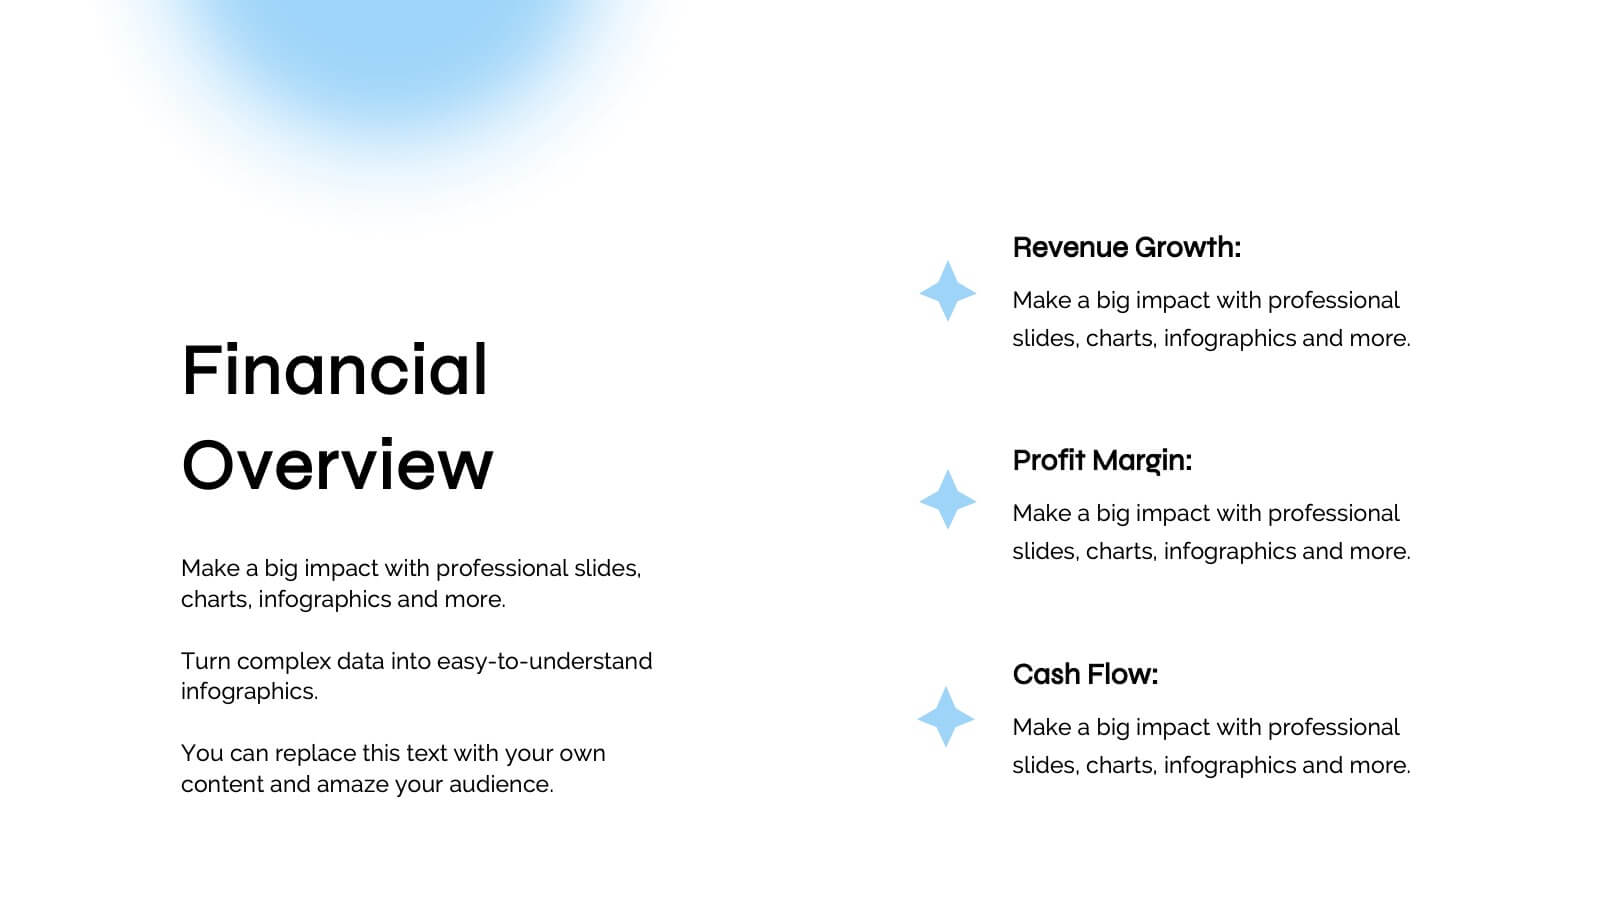
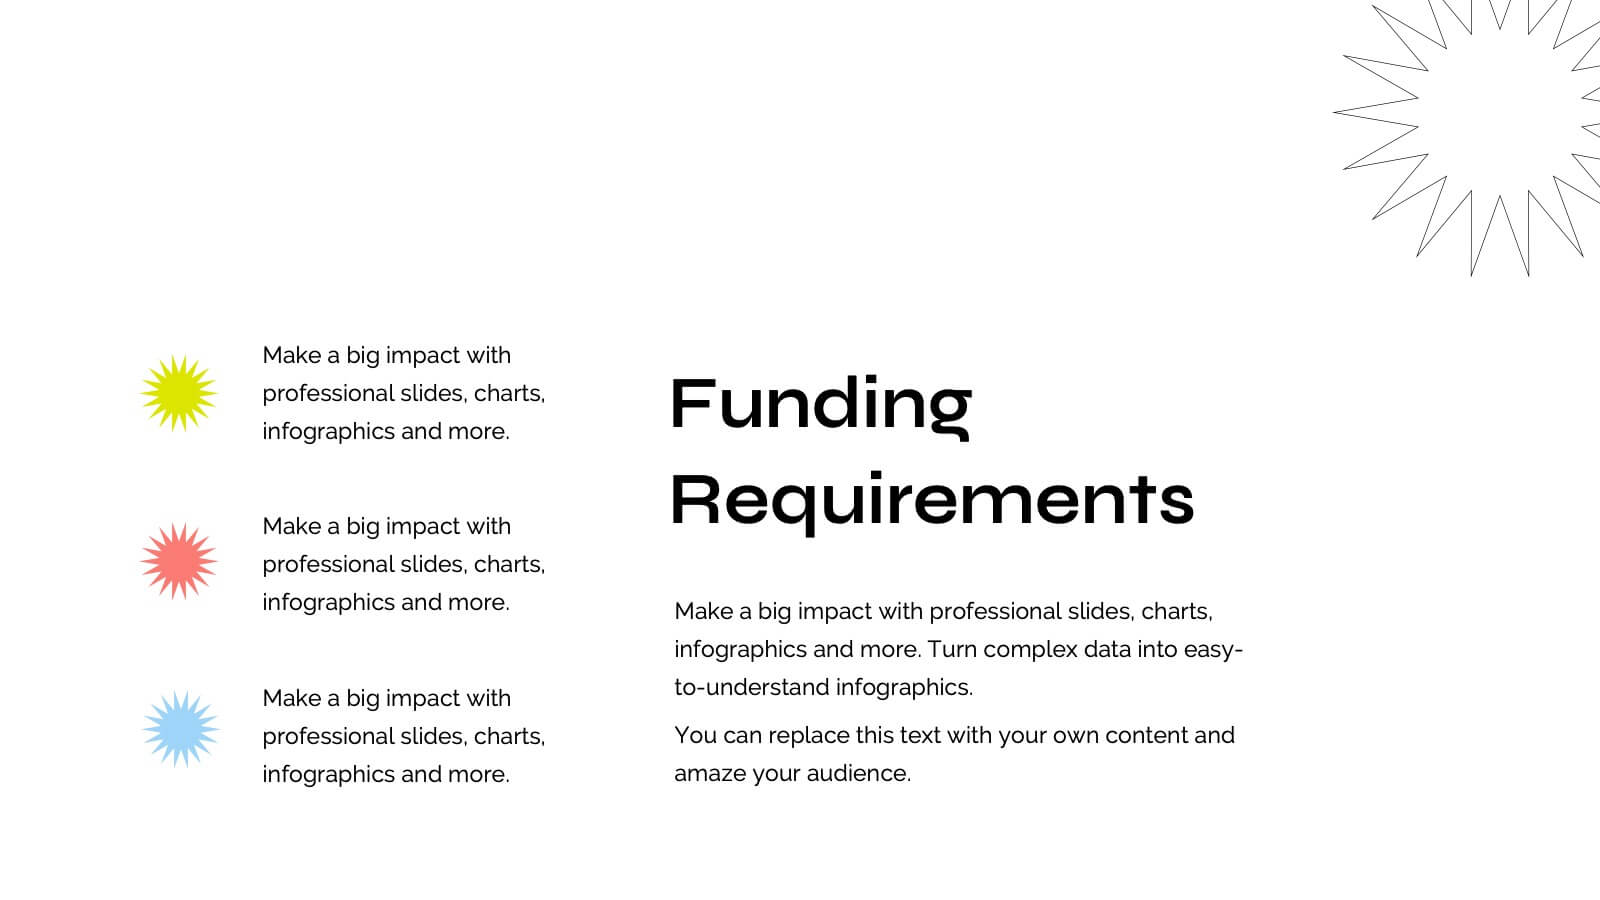
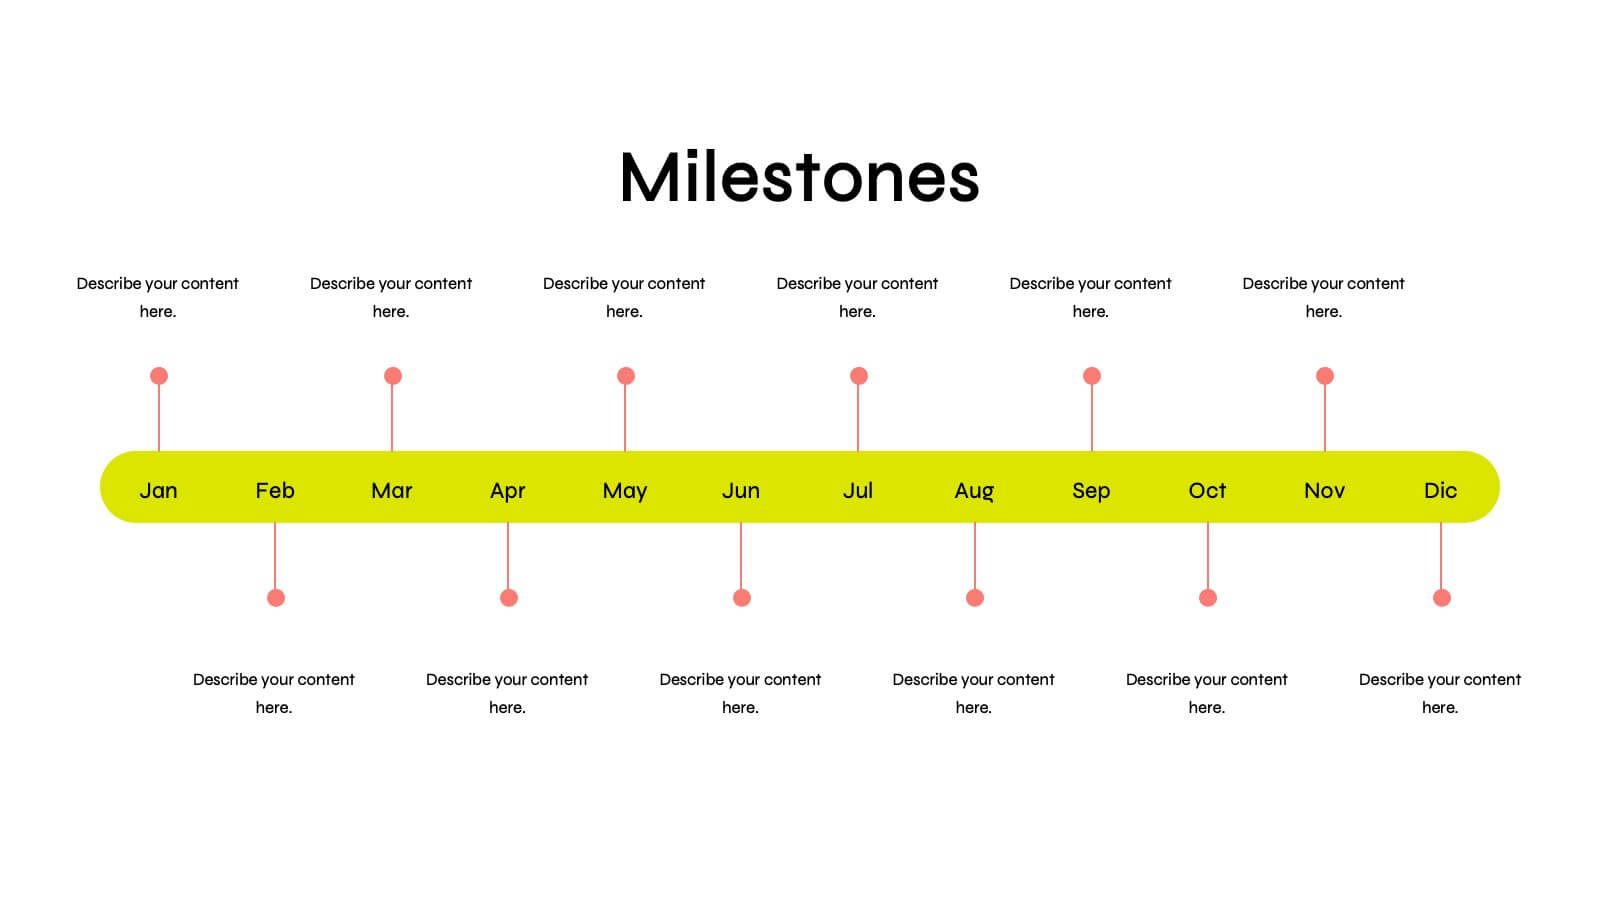
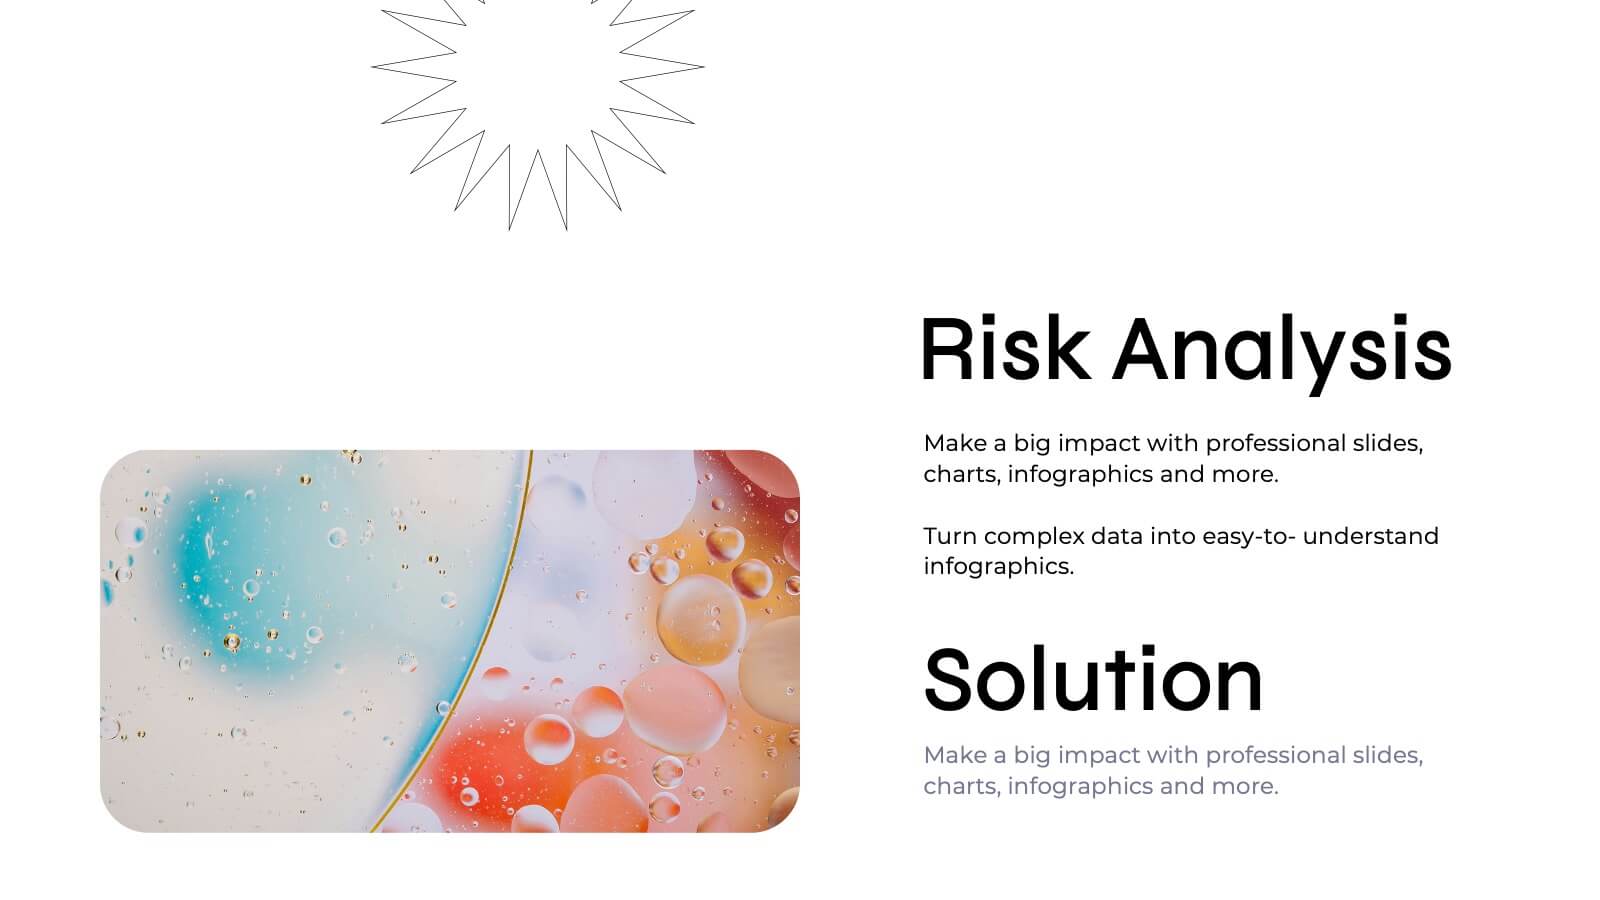
Quirinus Investor Pitch Presentation
Ready to impress investors and stakeholders? This sleek and modern pitch deck template covers all the essentials, from problem statements and market opportunities to revenue models and growth projections. Each slide is designed to convey clear and compelling information for maximum impact. Fully compatible with PowerPoint, Keynote, and Google Slides, making it the perfect tool for your next product launch!


5 diapositivas
E-Learning and Digital Education Trends Presentation
Stay ahead in the digital learning space with the E-Learning and Digital Education Trends Presentation template. Designed for educators, trainers, and e-learning professionals, this modern and insightful layout highlights key trends, innovative tools, and strategies in online education. With fully customizable elements, you can tailor the slides to your audience’s needs. Compatible with PowerPoint, Keynote, and Google Slides for a seamless presentation experience.


6 diapositivas
Strategic Task and To-Do List Slide Presentation
Keep your team aligned and on track with the Strategic Task and To-Do List Slide Presentation. This layout is ideal for showcasing action items, project priorities, and status updates using a visual notepad style. Color-coded sections and checkmark indicators make it easy to communicate task progress. Fully customizable in PowerPoint, Keynote, and Google Slides.


4 diapositivas
Culinary Business Branding Deck Presentation
Visualize your culinary identity with the Culinary Business Branding Deck Presentation. Designed with a segmented chef hat illustration, this slide helps you showcase four brand pillars—perfect for restaurants, food startups, and culinary consultants. Use it to highlight your cuisine focus, customer experience, service style, and ambiance. Fully editable in PowerPoint, Keynote, Google Slides, and Canva.


7 diapositivas
Lean Business Model Infographic
Step into the dynamic world of lean startup methodology with our lean business model infographic. Utilizing a striking palette of oranges, blacks, and other vivid colors, this infographic simplifies the intricate components of the lean canvas. It's an invaluable asset for entrepreneurs, business educators, and startup enthusiasts. By offering a bird's-eye view of a startup's proposition, it ensures stakeholders align their strategies efficiently. Regardless of the platform - be it PowerPoint, Keynote, or Google Slides - this infographic seamlessly adapts, enhancing your presentation's professional appeal.


6 diapositivas
Prevention and Support Breast Cancer Strategy Presentation
Deliver powerful insights with the Prevention and Support Breast Cancer Strategy Presentation. Designed for impact, this layout uses gender icons, ribbons, and clear percentage visuals to present awareness, research data, and healthcare strategies. Ideal for advocacy groups, nonprofit campaigns, or medical briefings. Fully editable in PowerPoint, Keynote, Google Slides, and Canva.