


Características


¿Tienes alguna pregunta?
Recomendar


8 diapositivas
Business Risk Identification and Management
Simplify complex risk factors with this visually engaging diagram. This template uses overlapping circular segments to categorize and assess risk impact across four business areas—ideal for project managers, analysts, and consultants. Customizable progress bars help communicate risk levels with clarity. Compatible with PowerPoint, Keynote, and Google Slides.


28 diapositivas
Hawking Brand Strategy Report Presentation
Introduce your brand's vision with this polished and professional strategy report presentation template. Designed for businesses, marketers, and branding agencies, it features comprehensive sections for communicating your brand identity, goals, and market positioning. This template highlights areas such as brand philosophy, target audience insights, competitive analysis, and visual identity systems. Showcase your brand’s unique selling proposition with engaging slides dedicated to colors, typography, logos, and packaging. With layouts tailored for presenting data, strategies, and case studies, you’ll ensure every aspect of your brand resonates clearly. Compatible with PowerPoint, Google Slides, and Keynote, this template is fully customizable to match your style and branding needs. Its clean, modern design and easy-to-edit structure make it a versatile choice for strategy reports, pitches, or team presentations. Elevate your branding efforts and communicate your story with confidence and clarity.


7 diapositivas
Prime Numbers Infographic Presentation
A numbers infographic is a visual representation of information using graphical elements such as charts, graphs, and diagrams. A well-crafted template is a powerful tool for conveying insights into your data. Numbers have the ability to transform your data into useful insights that can help you make an informed decision. This numbers infographics is made with different type of charts and diagrams, which will help you establish a relation between numbers and words. This fully editable template is designed to present numbers, data and statistics in a creative way unique to your brand.


7 diapositivas
Progress Energy Infographic
Progress generally refers to forward movement or advancement towards a goal, or improvement. This is a dynamic infographic designed to visually represent your journey towards success and growth. This template serves as a visual roadmap, allowing you to showcase milestones, achievements, and key steps toward your objectives in a clear and captivating manner. Compatible with Powerpoint, Keynote, and Google Slides. This easily illustrates the impact of your progress. This infographic is designed to showcase your achievements, marking key milestones that demonstrate your progress and the impact they've had on your journey.


5 diapositivas
Business Advantages and Benefits Presentation
Showcase your company's strengths with this modern Business Advantages and Benefits Presentation. Featuring a sleek puzzle-style design, this slide is perfect for illustrating interconnected benefits, core features, or success factors. Ideal for business proposals, team briefings, and client meetings, the layout is fully customizable in PowerPoint, Keynote, or Google Slides to match your brand colors and message.


12 diapositivas
Market Research Data Insights Presentation
Gain Valuable Market Insights! The Market Research Data Insights Presentation is designed to help businesses analyze trends, customer behavior, and competitive landscapes. Featuring a structured circular layout, this template ensures data is easy to interpret and present. Fully customizable and compatible with PowerPoint, Keynote, and Google Slides for seamless editing.


21 diapositivas
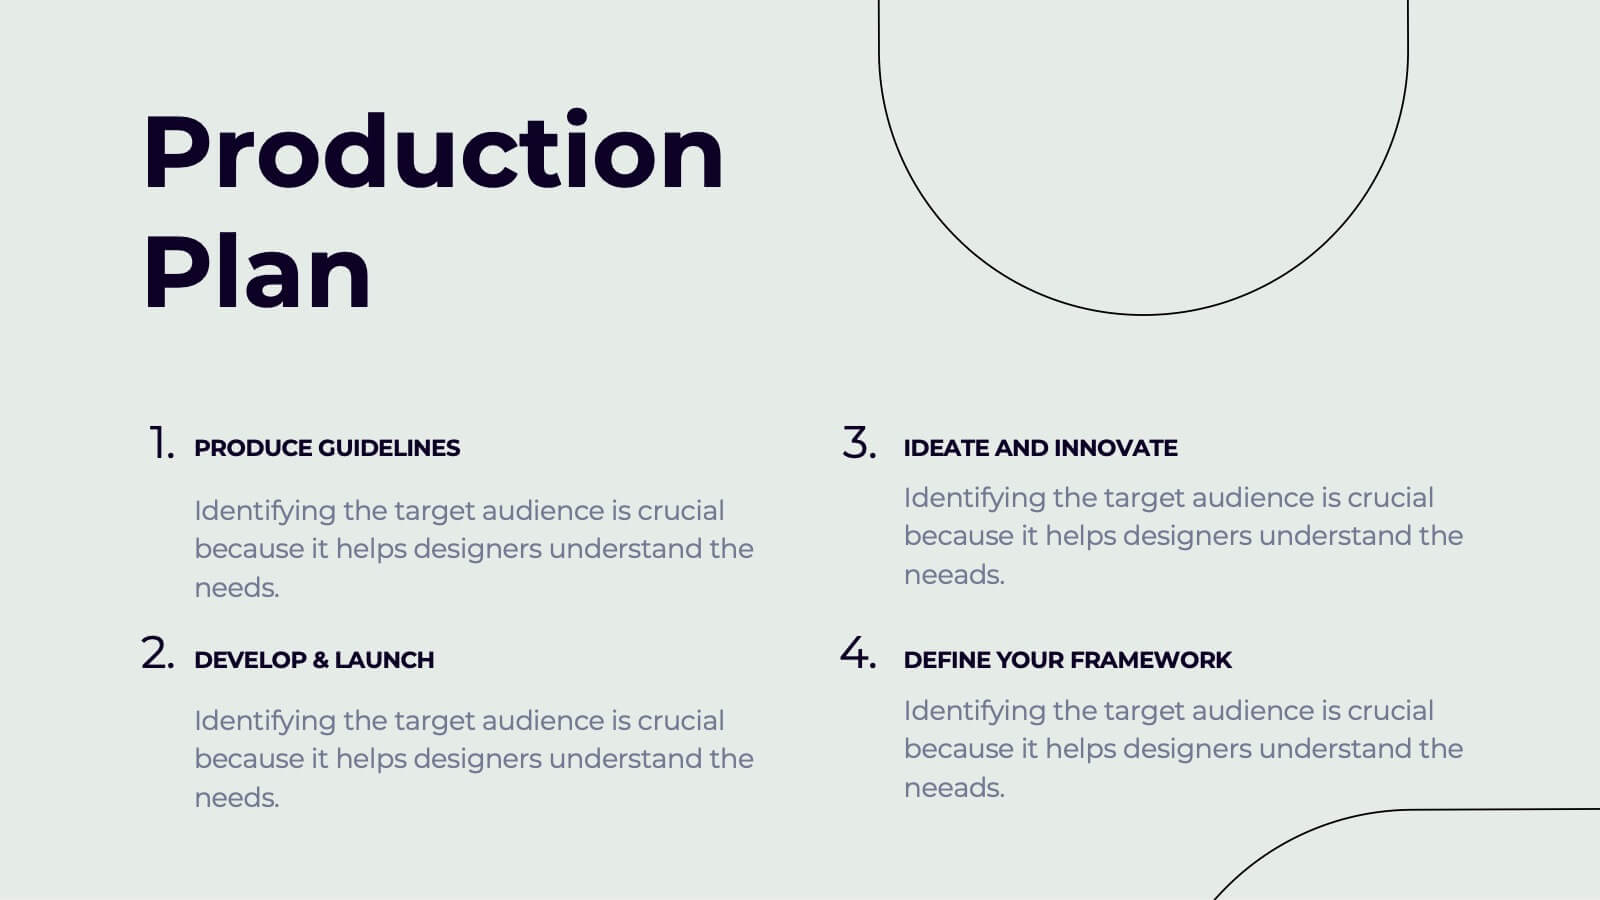
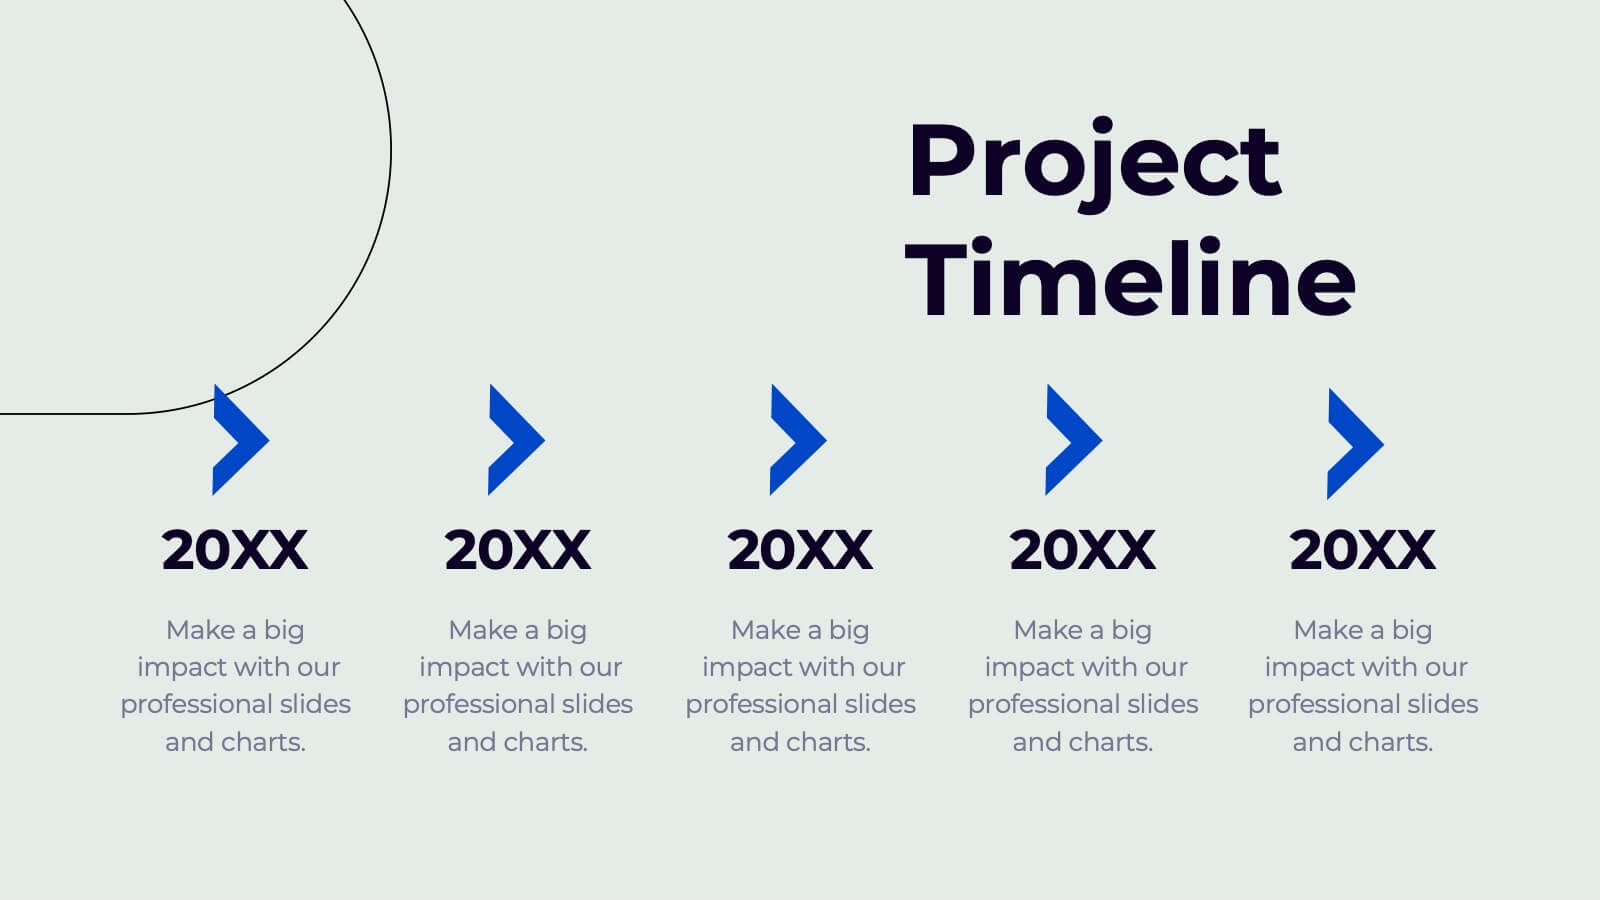
Yeti Creative Design Report Presentation
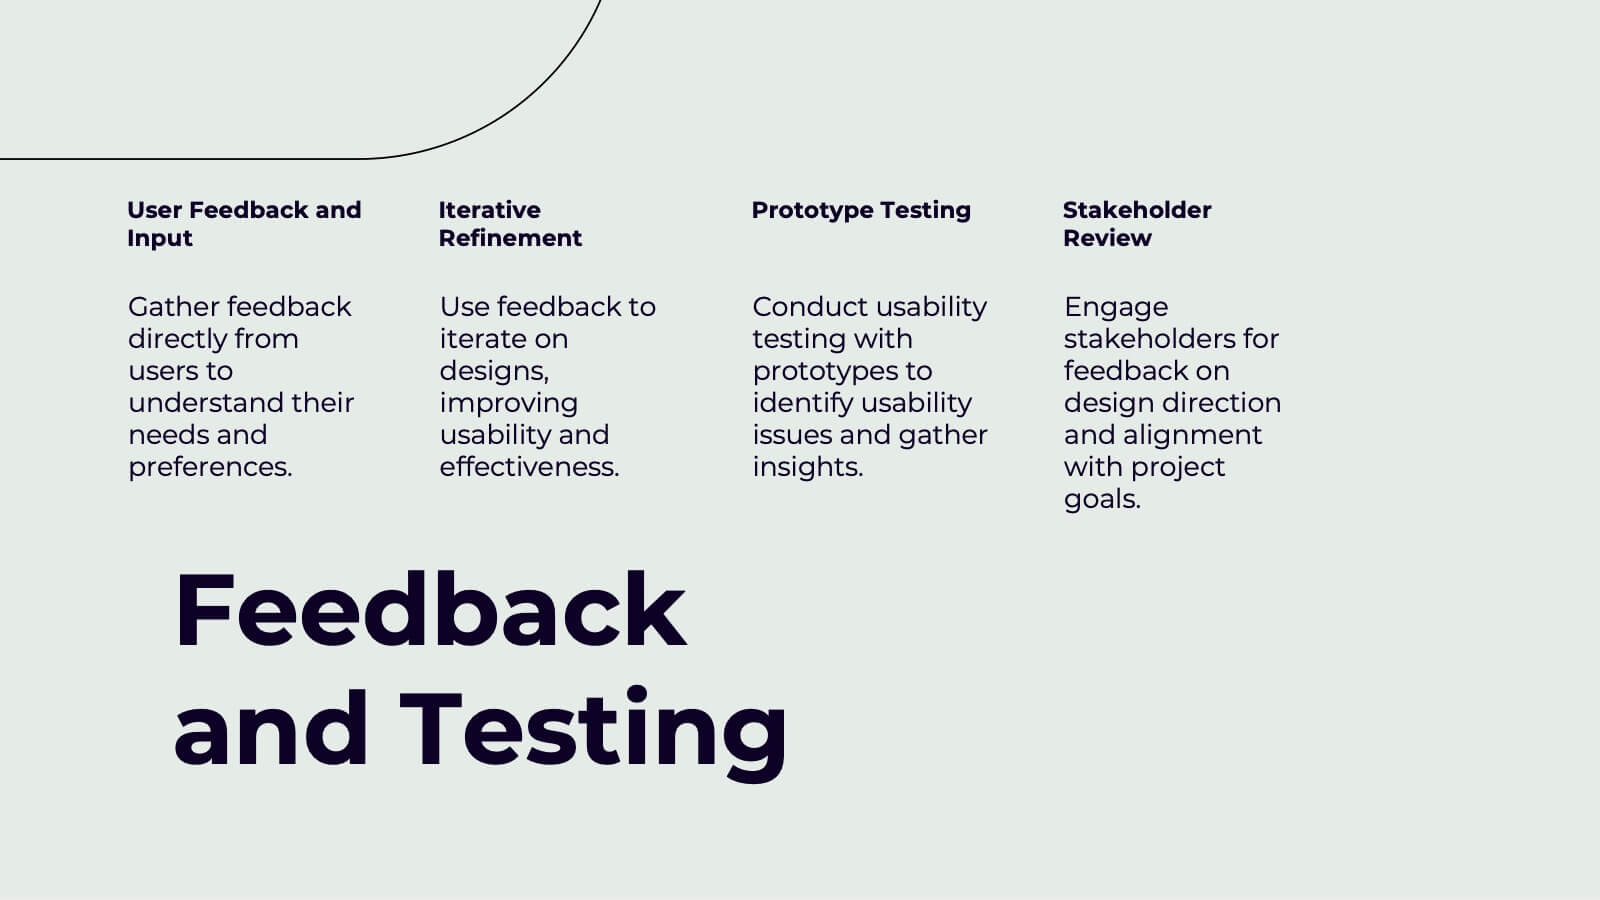
This modern design report template covers everything from concept development to design iterations and feedback testing. It’s visually striking, with sections for color schemes, typography, textures, and production plans. Ideal for showcasing creative projects and delivering professional presentations. Compatible with PowerPoint, Keynote, and Google Slides for ease of use.


6 diapositivas
Title Hierarchy Infographic
The collection of slides is designed to efficiently convey key themes with a striking visual appeal, ensuring that crucial topics are presented with clarity and emphasis. Each slide utilizes bold typography and a unique color palette to draw attention and maintain viewer engagement. The designs incorporate dynamic shapes and minimalist layouts, enhancing the presentation's readability while emphasizing important content. This set is ideal for professionals aiming to present complex ideas in a clear and memorable way during meetings or in corporate documents. It supports various communicative goals, such as introducing concepts, outlining challenges, or promoting organizational initiatives, making it a versatile tool for enhancing message delivery in any professional setting.


2 diapositivas
Professional Cover Slide Design Presentation
Make a bold first impression with this clean and modern cover slide layout. Featuring a split design with customizable photo space and a vibrant call-to-action label, this slide balances professionalism with creativity. Perfect for proposals, company overviews, or keynote introductions. Easily personalize the title, color palette, and image. Fully compatible with PowerPoint, Keynote, and Google Slides.


12 diapositivas
Digital Marketing Strategy Presentations
Turn complex campaigns into captivating visuals with this modern, data-driven layout designed for marketing professionals. Perfect for outlining strategies, performance metrics, and digital funnels, it keeps information clear and visually engaging. Easily customizable and fully compatible with PowerPoint, Keynote, and Google Slides for seamless editing across your favorite platforms.


26 diapositivas
Understanding Cryptocurrency Presentation
Step into the future of finance with this engaging presentation on cryptocurrency. Covering key topics like blockchain technology, digital wallets, market trends, and security best practices, this template helps simplify complex concepts for any audience. Fully customizable and compatible with PowerPoint, Keynote, and Google Slides for a seamless and informative presentation experience.


7 diapositivas
Job Title Infographic
The slides displayed offer a range of stylish and clear title designs for various business and creative presentations, ideal for introducing key concepts and sections within a professional document or presentation. Each slide is crafted to represent themes such as annual reports, digital strategies, and project retrospectives, as well as specialized areas like web design, strategic planning, and SEO. The designs incorporate modern aesthetics with clean lines, bold color palettes, and minimalist graphic elements, ensuring that the titles are not only eye-catching but also effectively convey the subject matter. This variety allows presenters to choose a slide that best fits the tone and topic of their presentation, making each section distinct and engaging for the audience. These slides are perfect for professionals looking to present complex information in an accessible and visually appealing format.


6 diapositivas
Branching Structure Tree Chart Presentation
Visualize ideas, processes, or team structures with the Branching Structure Tree Chart Presentation. This elegant tree diagram layout allows you to display six key points or stages branching out naturally from a central concept. Ideal for organizational charts, decision flows, or brainstorming visuals. Fully editable in PowerPoint, Keynote, and Google Slides.


4 diapositivas
Team OKRs Alignment Slide Presentation
Bring clarity and collaboration to your team’s goals with a clean, connected layout that visualizes how objectives lead to measurable results. Perfect for aligning departments, tracking progress, or sharing performance updates, this presentation turns strategy into action. Fully compatible with PowerPoint, Keynote, and Google Slides for easy customization.


6 diapositivas
Clinical Case and Research Presentation
Bring science to life with a presentation that blends precision and clarity. Perfect for showcasing clinical findings, lab results, and research data, this professional layout helps communicate complex studies with ease and visual balance. Fully customizable and compatible with PowerPoint, Keynote, and Google Slides for seamless editing and presentation.


7 diapositivas
Sustainability Risk Management Infographic
Elevate your presentations with our Sustainability Risk Management infographic, compatible with Powerpoint, Keynote, and Google Slides. This infographic is a vital tool for professionals dedicated to showcasing the importance of sustainable practices and risk mitigation in their organizations. It's crafted to display the interconnectivity between environmental, social, and governance (ESG) factors and business operations. Our Sustainability Risk Management infographic effectively breaks down complex sustainability challenges into digestible parts. It's an invaluable resource for corporate strategists, environmental consultants, and policy makers. By simplifying the communication of sustainability data, it encourages stakeholder engagement and facilitates strategic planning sessions. The design of the infographic ensures that sustainability goals and risk assessments are presented in an engaging and memorable manner. It supports your narrative by visually guiding your audience through the elements of sustainability that are pivotal for risk management. By integrating this infographic into your slide decks, you can confidently convey the message that responsible management is key to long-term success.


5 diapositivas
E-Learning and Digital Education Trends Presentation
Stay ahead in the digital learning space with the E-Learning and Digital Education Trends Presentation template. Designed for educators, trainers, and e-learning professionals, this modern and insightful layout highlights key trends, innovative tools, and strategies in online education. With fully customizable elements, you can tailor the slides to your audience’s needs. Compatible with PowerPoint, Keynote, and Google Slides for a seamless presentation experience.