


Características


¿Tienes alguna pregunta?
Recomendar


7 diapositivas
Sports Management Infographic
Sports management involves planning, organizing, and coordinating activities related to sports and recreation. Step into the dynamic world of sports with our engaging sports management infographic. This template isn't just a game plan; it's a visual journey through the strategies, insights, and principles that drive success in the thrilling realm of sports management. Compatible with Powerpoint, Keynote, and Google Slides. Use this template to explore winning strategies, leadership insights, and the dynamics of this exciting field, and gear up to manage sports with precision, passion, and finesse.


26 diapositivas
Financial Literacy Simple Presentation
Our "Financial Literacy" template is a must-have for anyone teaching money management, savings, and investment strategies. Compatible with PowerPoint, Keynote, and Google Slides, it makes financial education accessible and engaging. Introduce the basics with "Financial Literacy: Creating a Smarter Tomorrow" and outline your agenda with the "Table of Contents." The "Meet Our Team" slide can spotlight your financial experts, and the "Three Option Slide" breaks down key concepts like budgeting, saving, and investing. The "This is your big image slide" can visualize financial goals, while "Earn, Save, Invest, Protect." reinforces sound financial habits. Use "This is your Chart Slide" to present data on spending patterns and "Brain Infographic" to explore the psychology of spending. The template's clean design and customizable features make it easy to tailor your financial literacy presentation to any audience, ensuring that your message on smart money management is clear and impactful.


5 diapositivas
Pet Care Infographics
Pet care refers to the practices and actions taken to ensure the well-being, health, and happiness of pets. These vertical infographic templates are perfect for providing essential information and tips for pet owners to ensure the well-being and proper care of their furry companions. This infographic is designed to present key aspects of pet care in a concise and engaging manner, making it a valuable resource for pet owners, veterinarians, pet stores, or any organization related to pet care. Compatible with Powerpoint, Keynote, and Google Slides. Use the text boxes and graphs to promote responsible pet ownership and provide valuable information about pet care.


5 diapositivas
Tips for Recycling Infographics
Recycling is an important practice that helps reduce waste, conserve resources, and protect the environment. These vertical infographics are designed to educate and encourage individuals on effective recycling practices. These provides a comprehensive overview of recycling and offers practical tips to help people incorporate recycling into their daily lives. This aims to educate and inspire individuals to take an active role in recycling and waste reduction. These are the perfect tools to raise awareness about waste management, and encourage sustainable behaviors. Compatible with Powerpoint, Keynote, and Google Slides.


6 diapositivas
SMART Goal Setting Process Presentation
Clearly define and communicate your business goals with the SMART Goal Setting Process slide. This layout visually breaks down the SMART framework—Specific, Measurable, Achievable, Relevant, and Time-bound—using icons, headers, and editable descriptions for each section. Ideal for strategy planning, goal tracking, and team alignment. Easily customizable in PowerPoint, Keynote, and Google Slides to suit any industry or project.


6 diapositivas
Target Audience Segmentation Strategy
Break down your audience with clarity using the Target Audience Segmentation Strategy Presentation. This slide features a vibrant vertical funnel layout, ideal for displaying five customer segments or persona categories. Each layer is numbered and color-coded, with connected callout areas for detailed insights. Perfect for marketers, campaign strategists, or product teams presenting customer journey data, audience demographics, or behavioral insights. Fully customizable in PowerPoint, Keynote, and Google Slides—easily align the design with your brand colors and content structure.


6 diapositivas
Regional Finance Infographic
Regional finance plays a vital role in fostering economic growth, attracting investments, and improving the overall well-being of communities within a specific region. This infographic template focuses on financial trends, insights, and data related to specific regions or countries. It is designed to help businesses, organizations, or financial professionals analyze and understand the financial landscape of a particular region. The data-driven content in this template is suitable for businesses or individuals seeking insights to make informed decisions regarding investments, market entry, or financial planning in a specific region.


26 diapositivas
Strategic Partnership Building Presentation
Forge ahead into the world of collaboration with a presentation template designed to underscore the power of strategic partnerships. This suite of slides is the perfect toolkit for professionals seeking to illustrate the synergy between entities and the innovative outcomes of such alliances. The design is both sleek and inviting, with soft curves and a cool color palette that conveys a sense of harmony and cooperation. Highlight your organization's leaders with personalized bio slides, and utilize a range of charts and graphs to demonstrate the mutual benefits and shared objectives of your partnerships. Whether mapping out the journey of a collaboration, detailing the process of integration, or sharing success stories, these slides are created to facilitate clear and impactful communication. The template is thoughtfully adaptable to Keynote, Google Slides, and PowerPoint, ensuring your message of unity and cooperative success resonates across any platform.

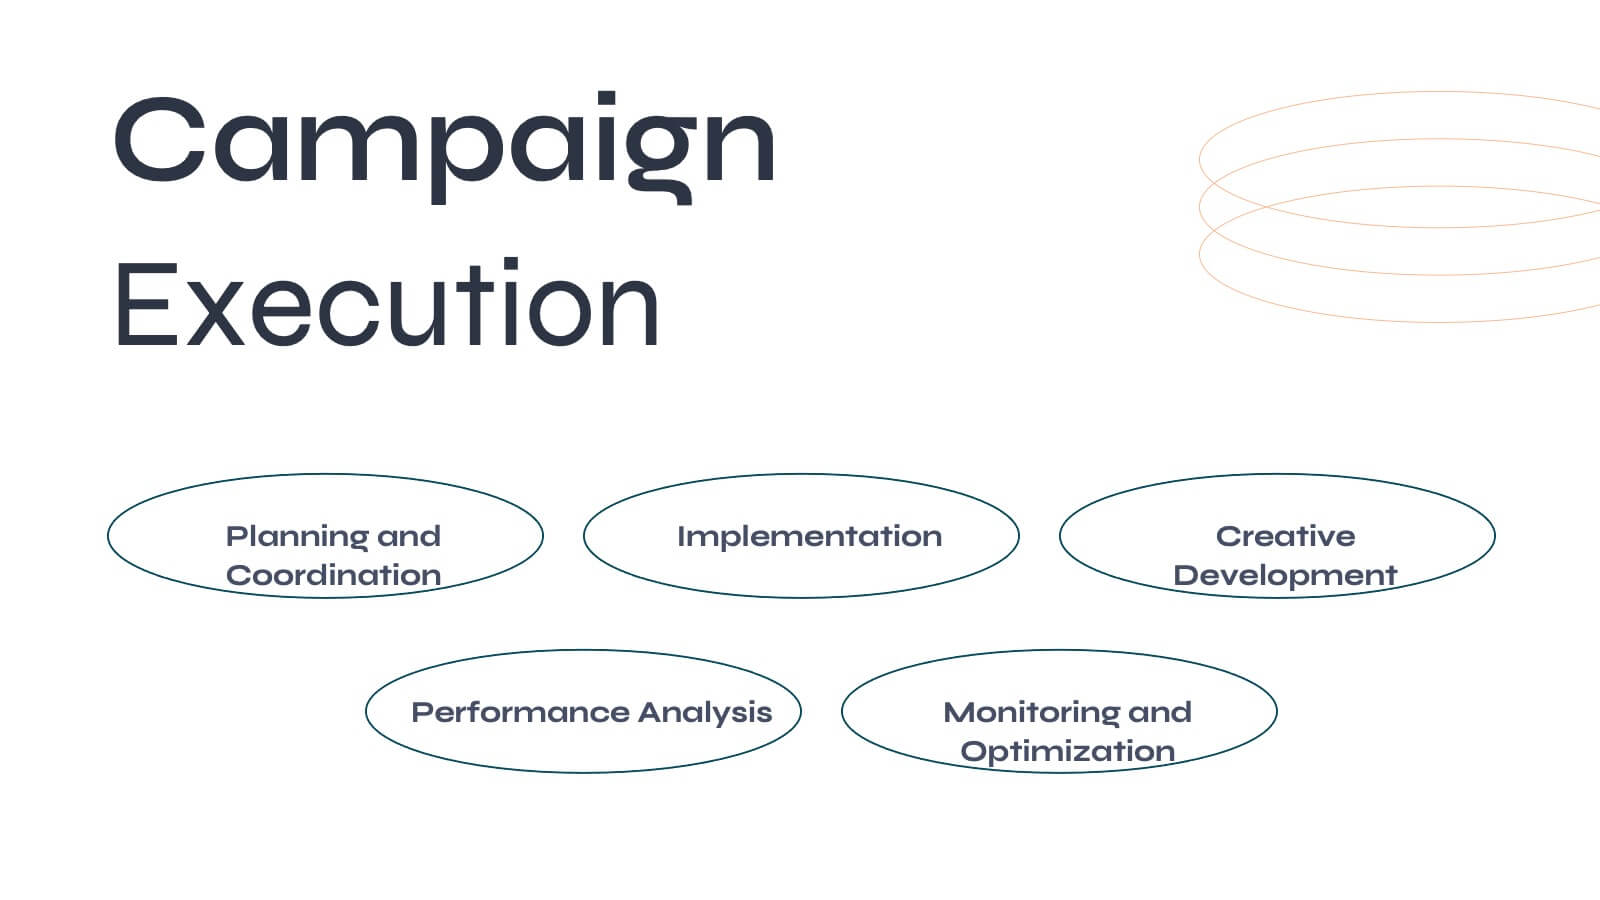

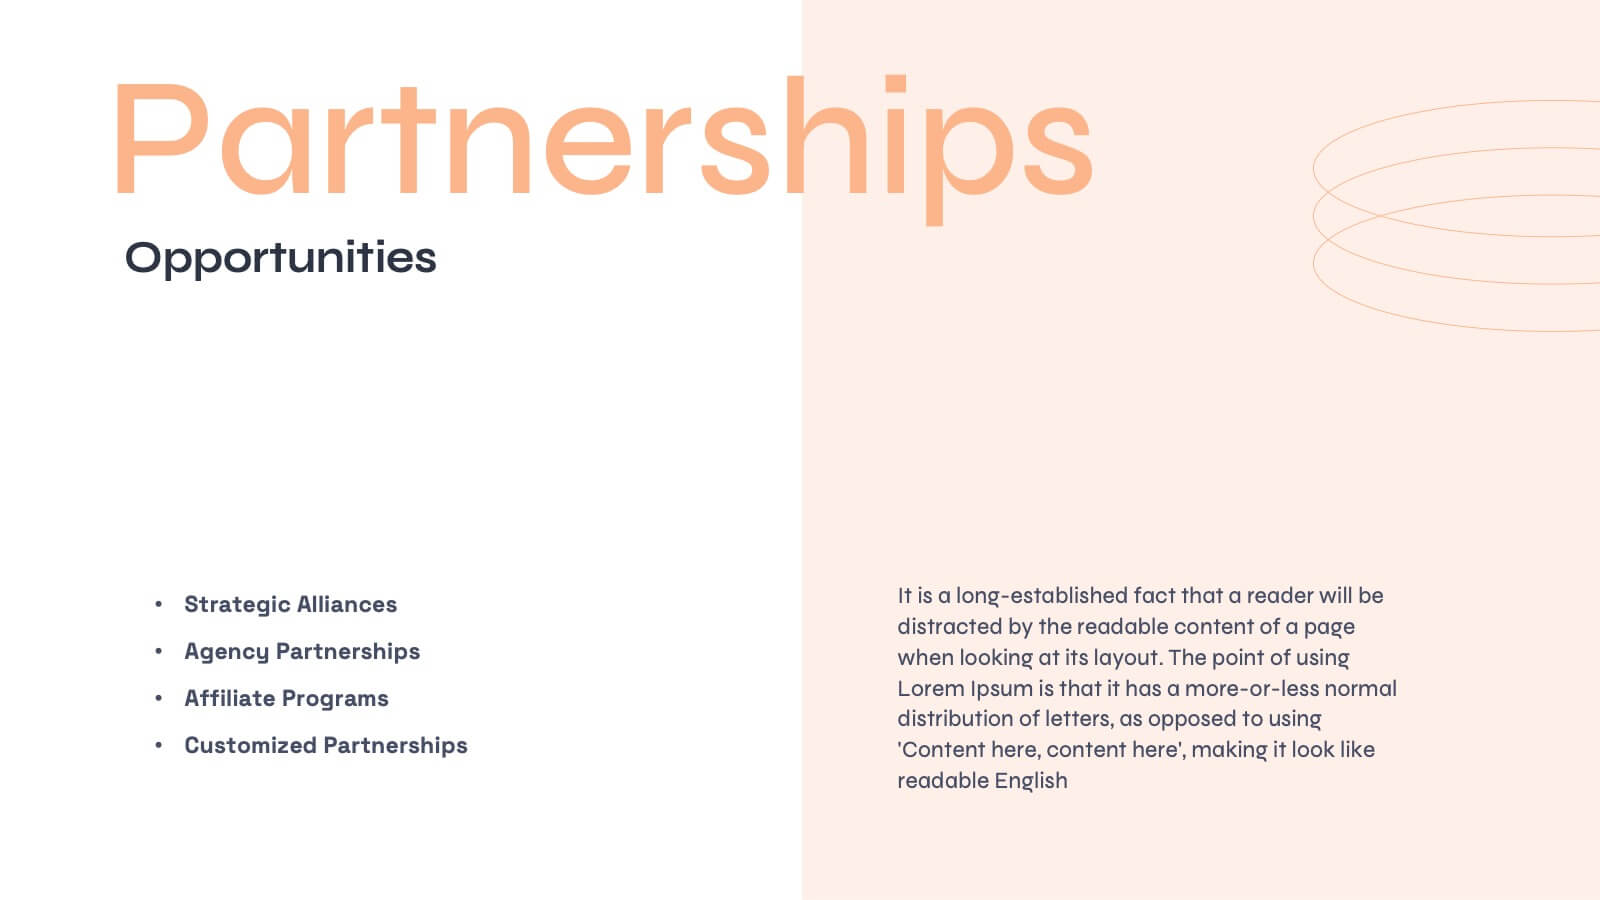

22 diapositivas
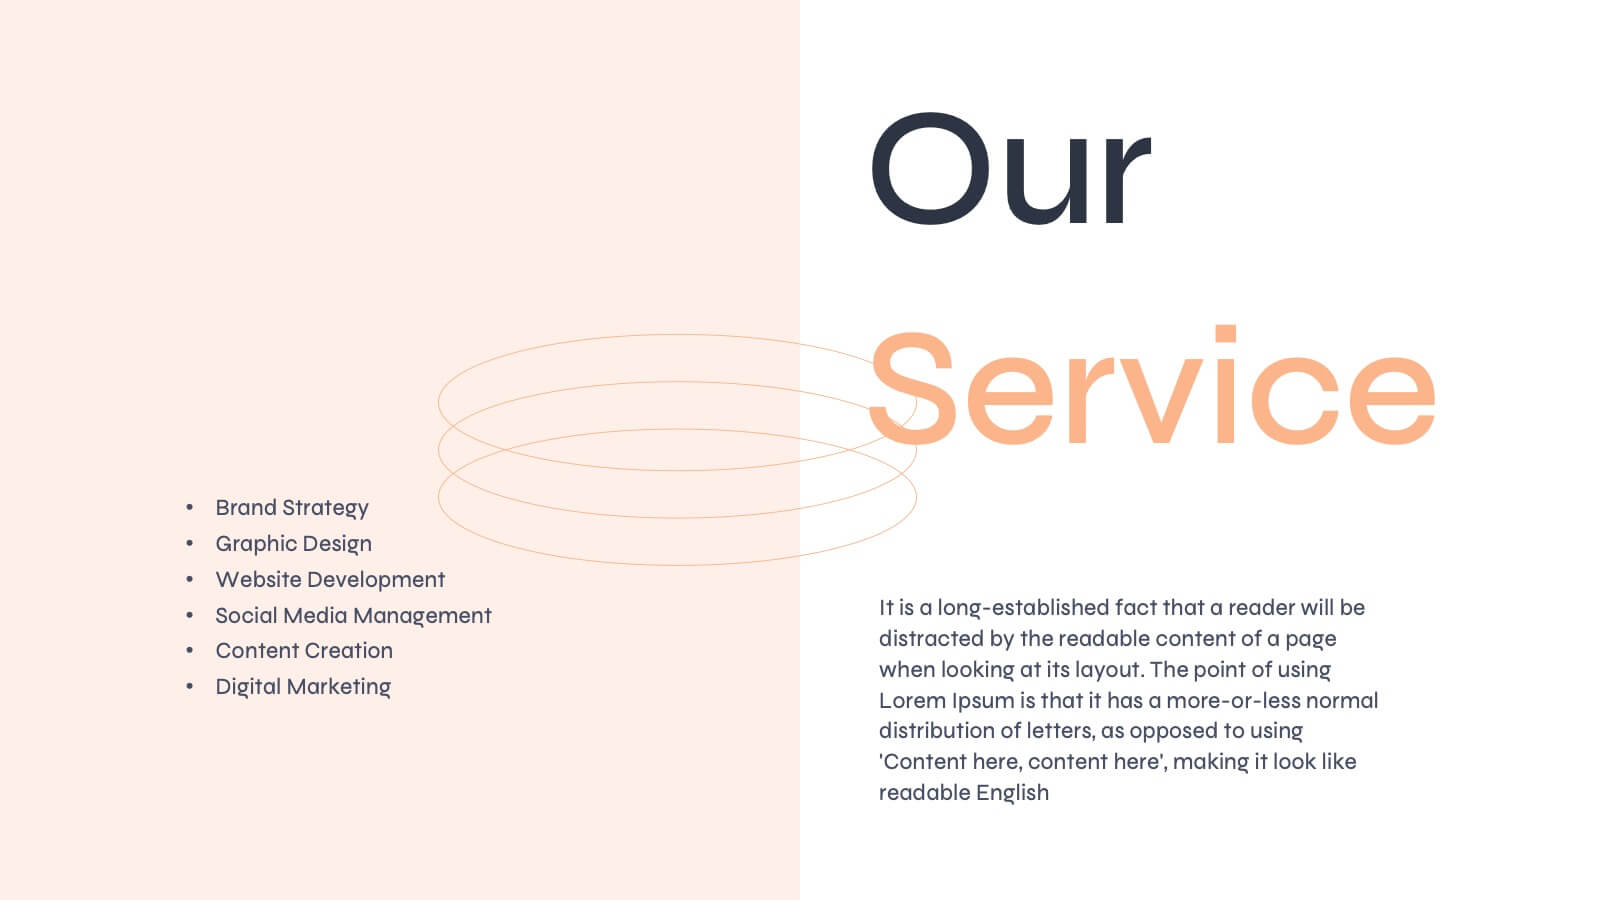
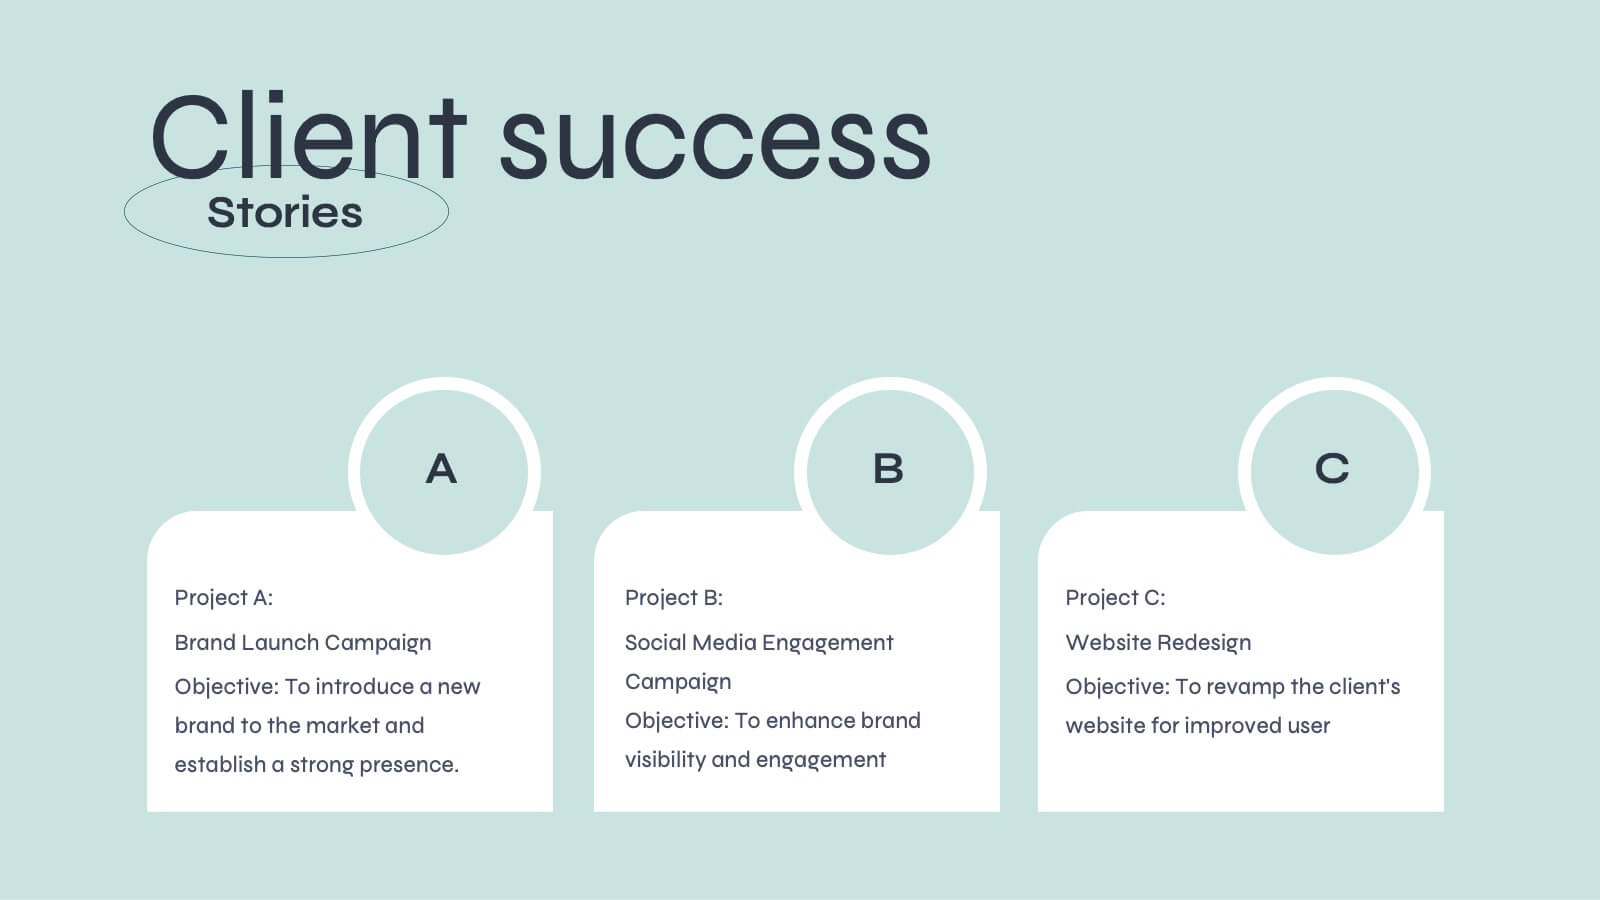
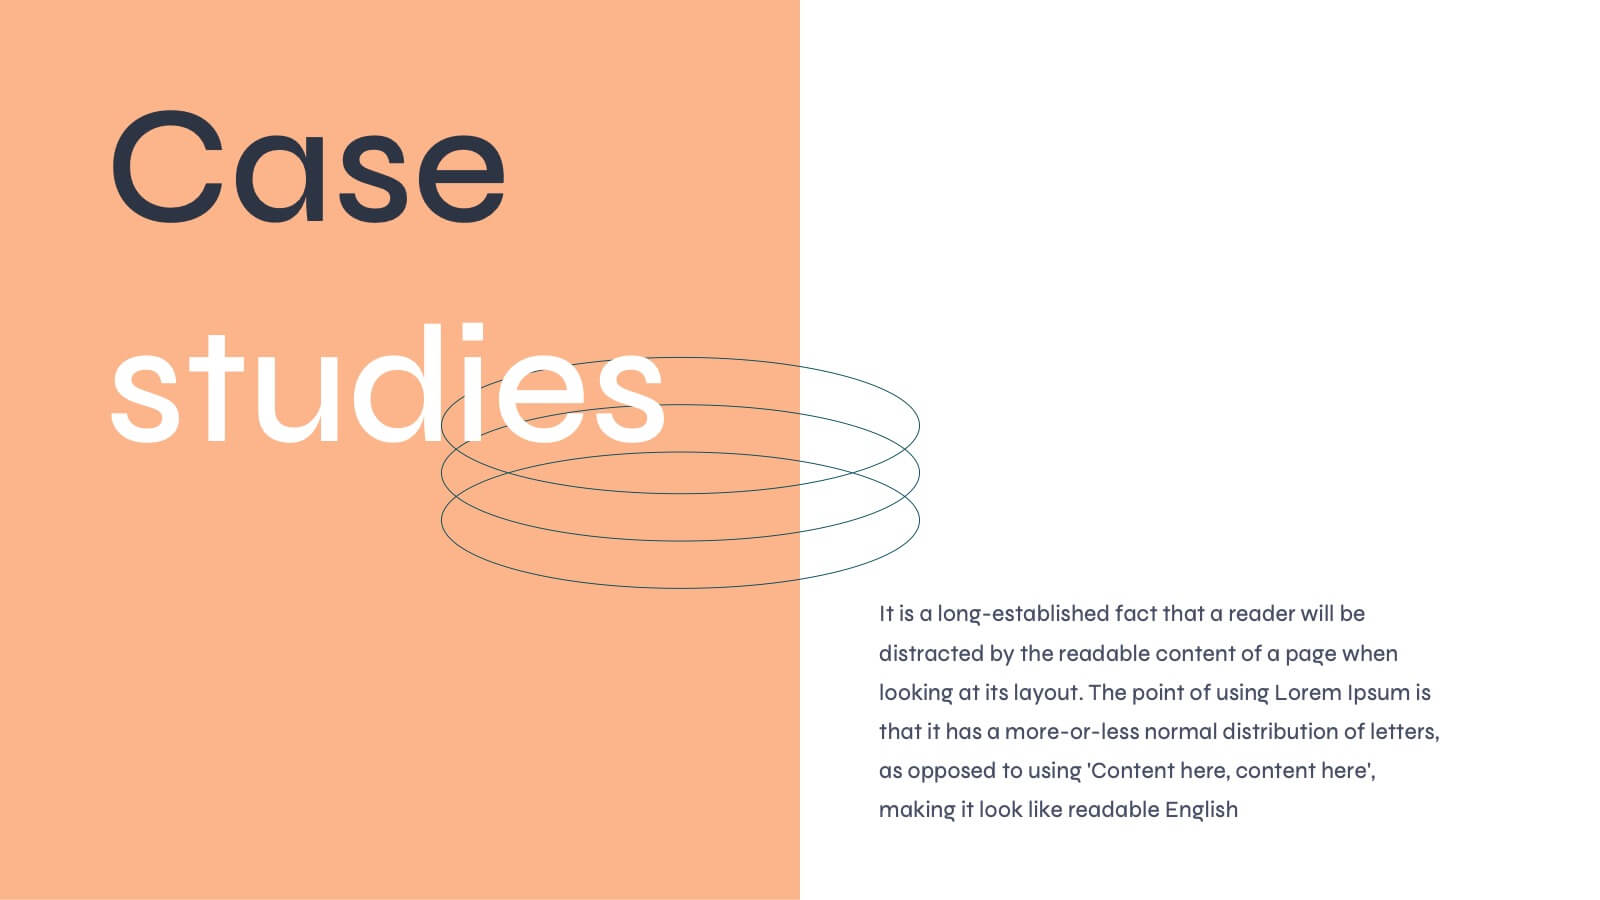
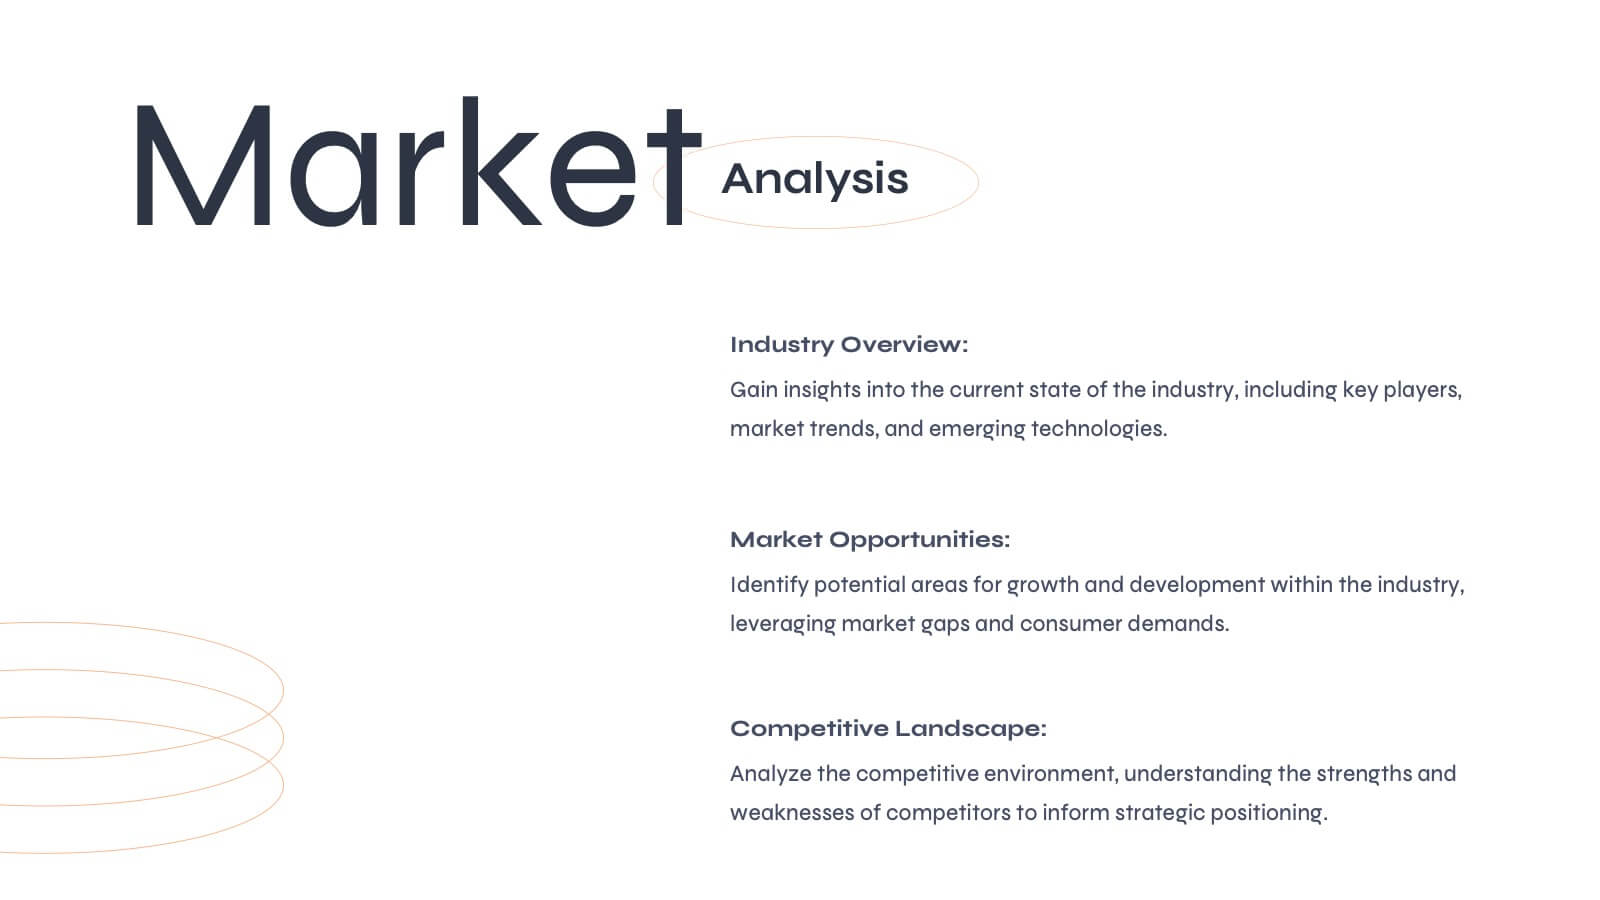
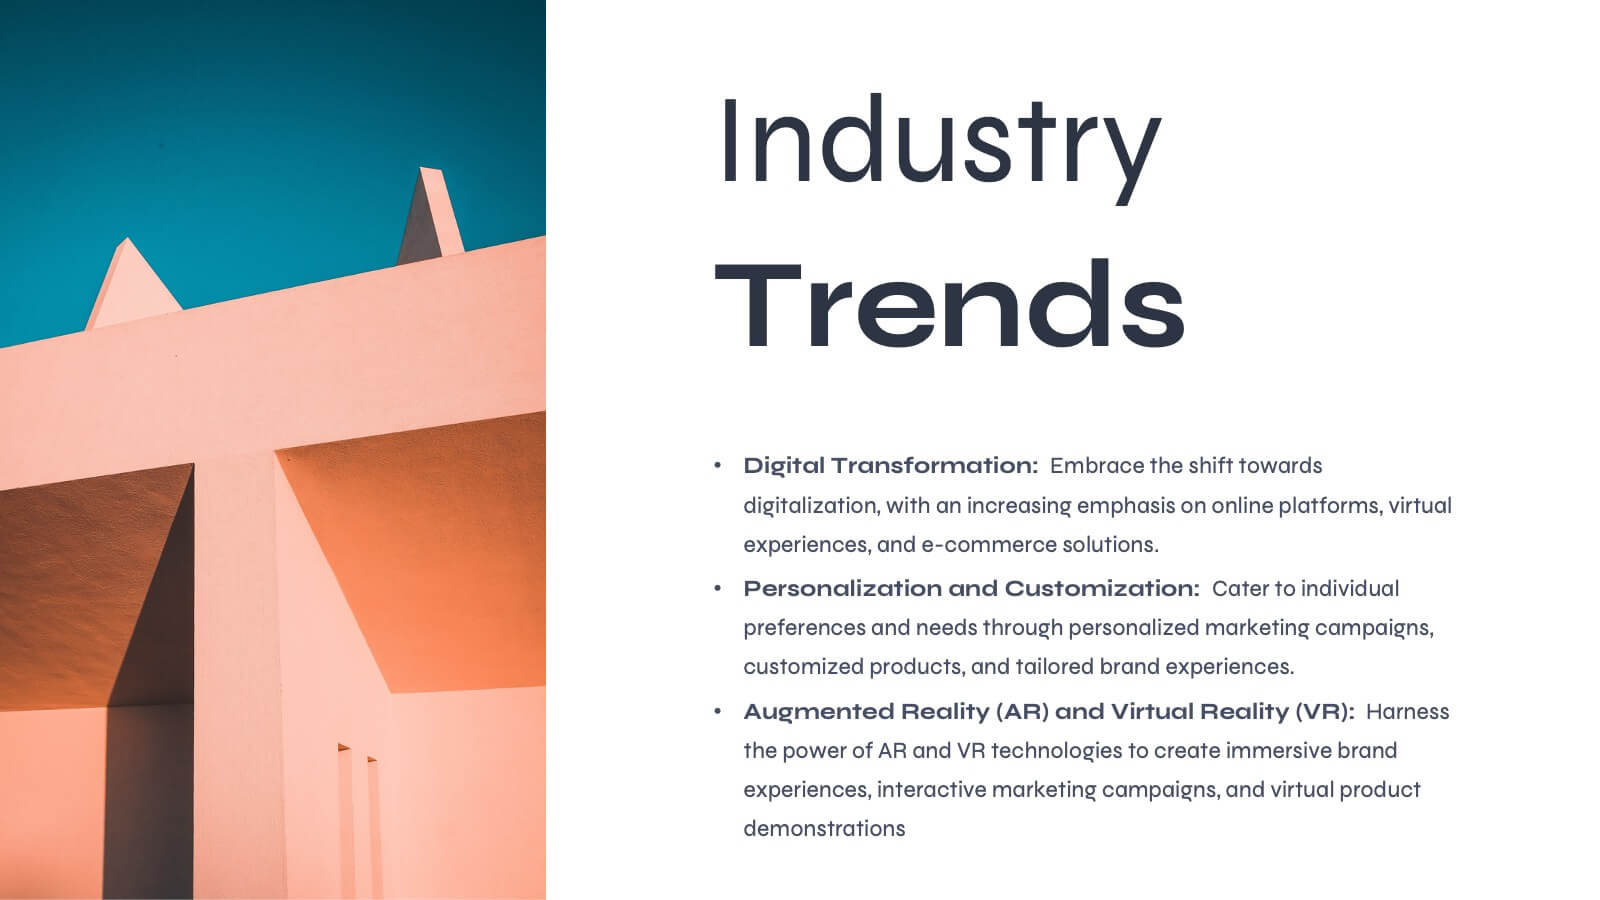
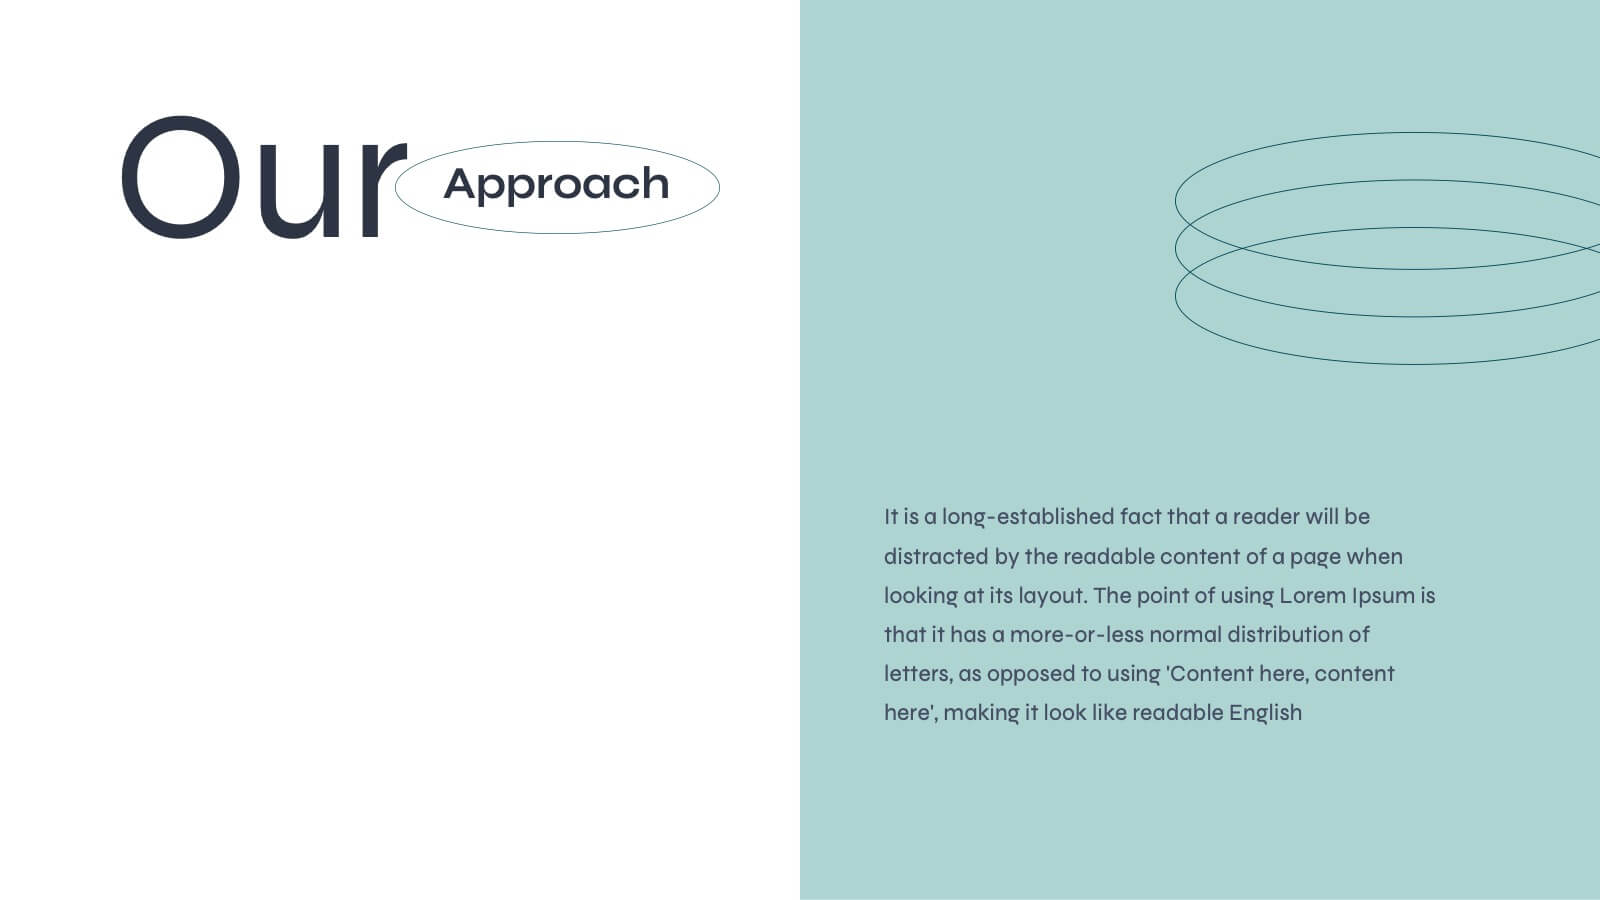
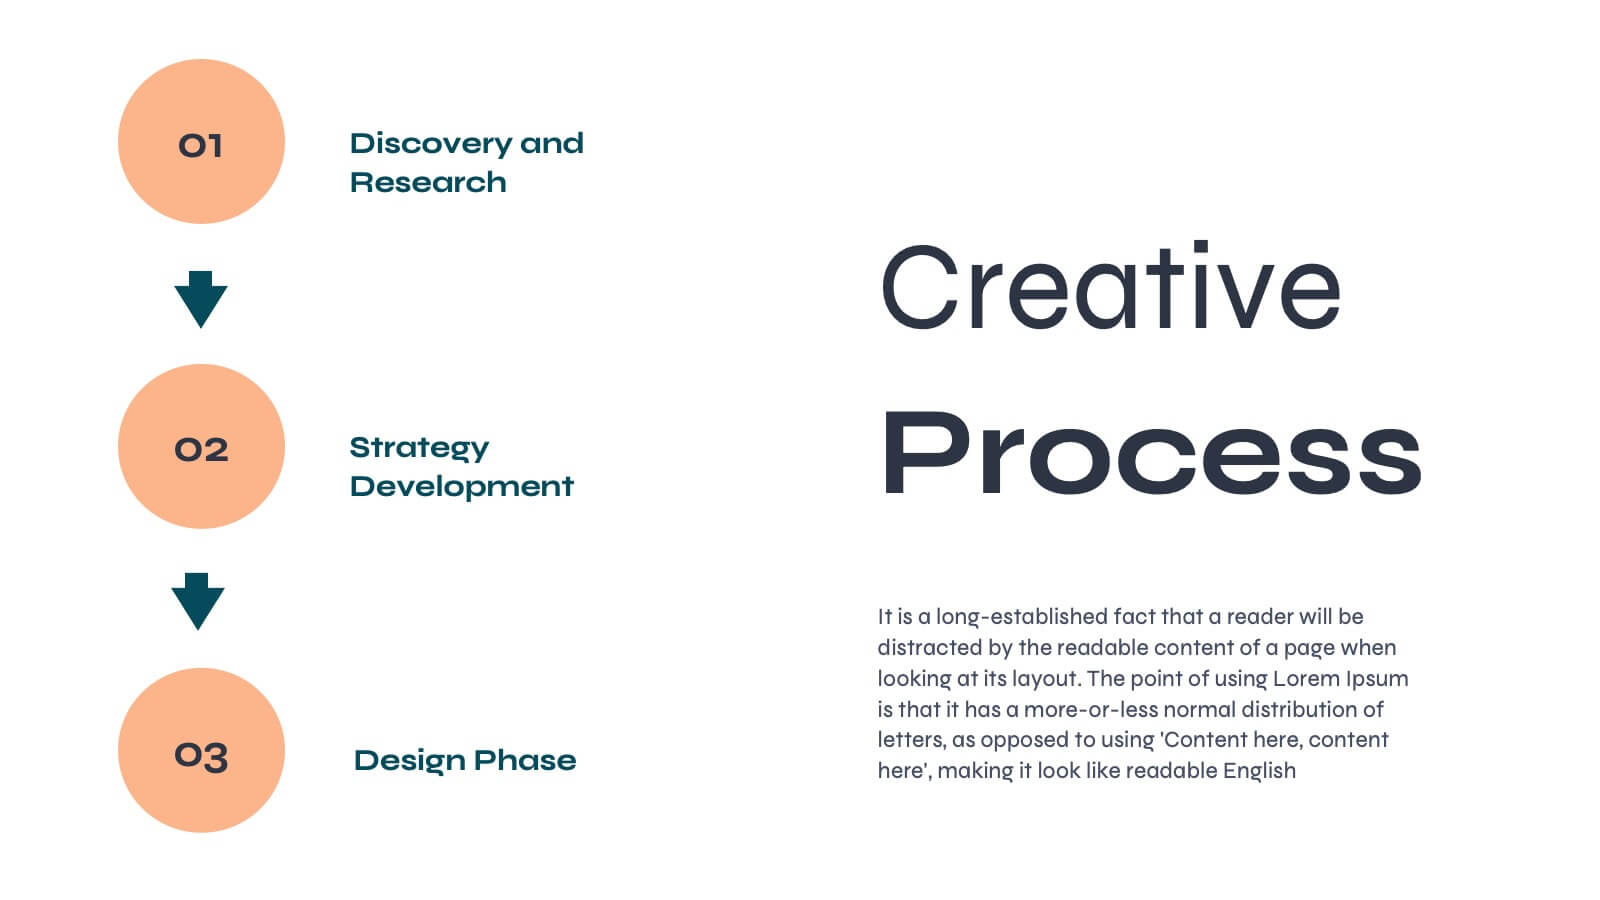
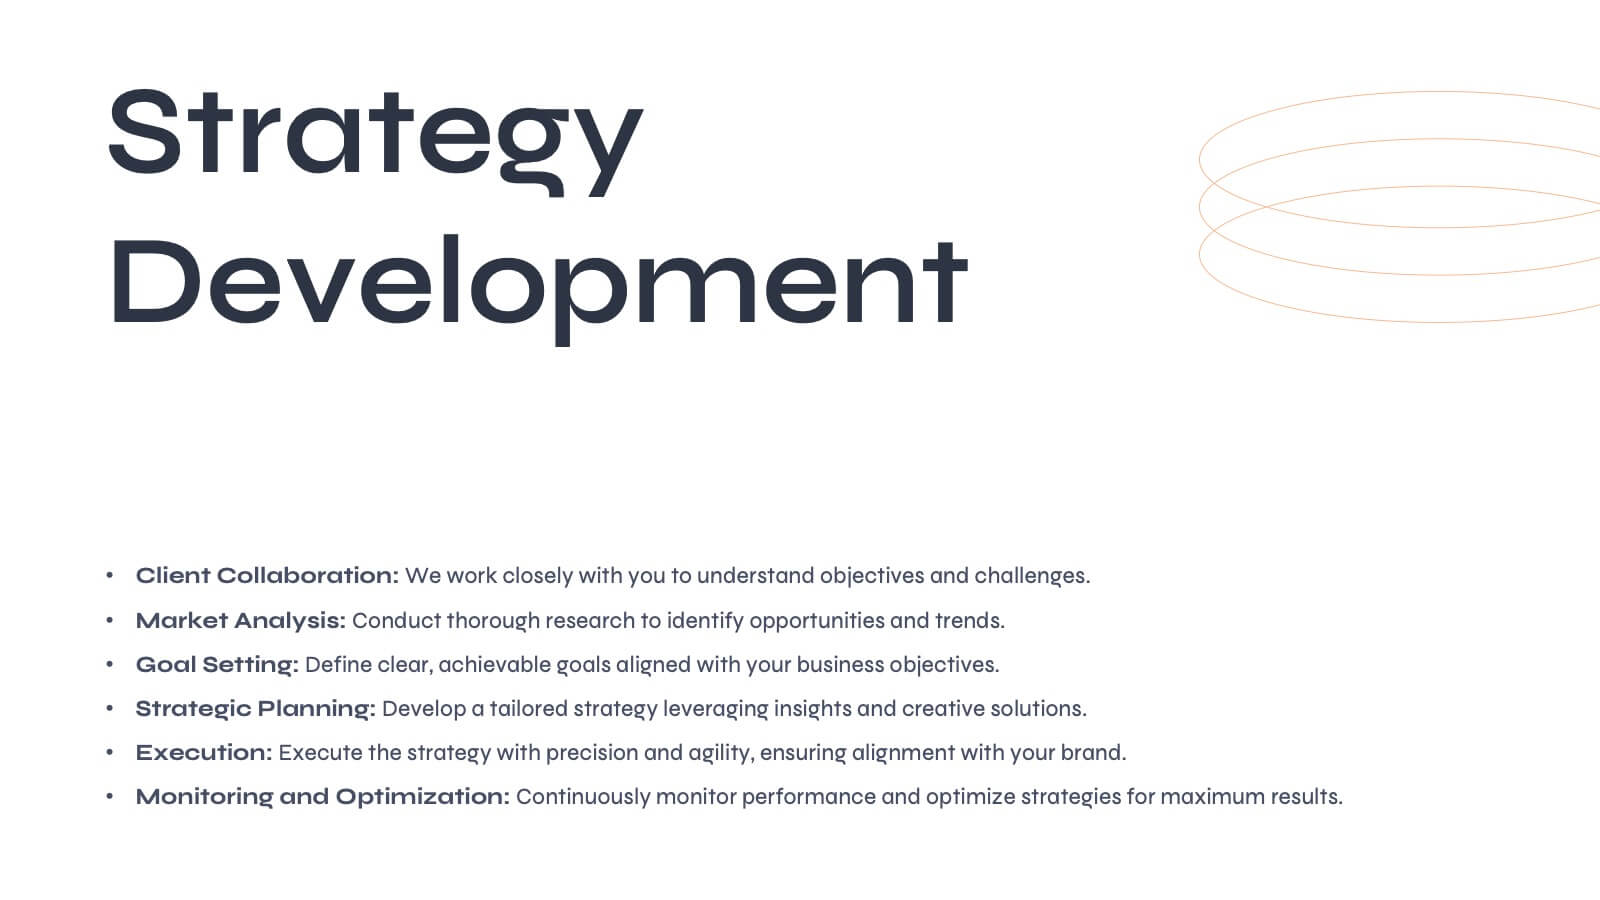
Aurora Agency Portfolio Presentation
Showcase your agency's strengths with this polished, modern presentation template. Perfect for presenting market analysis, client success stories, and creative processes, it features a clean and professional design. Highlight your team's expertise and strategic approach to impress potential clients. Compatible with PowerPoint, Keynote, and Google Slides, it ensures seamless presentations on any platform.


6 diapositivas
Shopping Pricing Tables Infographic
Pricing tables are visual tools commonly used on websites, product pages, and marketing materials to showcase different pricing options for products or services. This infographic template displays different pricing plans or packages offered by a business or service provider. This provides a clear comparison of features, benefits, and costs, helping viewers make informed decisions about which option best suits their needs and budget. This infographic is designed to help customers quickly compare features, costs, and benefits of each plan, aiding in their decision-making process. Compatible with Powerpoint, Keynote, and Google Slides.


6 diapositivas
Project Stakeholder Mapping
Visualize stakeholder relationships with this dynamic swirl-style infographic. Designed to showcase six key entities—Society, Media, Customer, Shareholder, Manager, and Employee—this layout emphasizes the interconnected roles within project environments. Perfect for stakeholder mapping, project planning, or communication strategies. Editable in PowerPoint, Keynote, and Google Slides.


3 diapositivas
Decision-Making Bowtie Framework Presentation
Break down complex decisions with clarity using the Decision-Making Bowtie Framework Presentation. This template lets you visually weigh options, outcomes, and impacts from both sides of a decision point, making it ideal for strategic planning, risk assessment, and executive reporting. Compatible with PowerPoint, Keynote, and Google Slides.


12 diapositivas
Personal Portfolio Presentation
Our Personal Portfolio Presentation template is designed for professionals looking to make a strong impression with a sleek and engaging portfolio. This comprehensive template provides an excellent framework to showcase your personal brand, professional journey, and achievements. The opening slide, with your name boldly presented, acts as your introduction. It's followed by a 'Get to know me' section that offers a glimpse into your personality and work ethic. The 'Skills' slide is a visually impactful way to present your competencies, while the 'Experience' slide chronologically outlines your professional milestones. Featuring sections for detailed case studies, showcased projects, and educational background, this template helps you tell your story in a cohesive and captivating manner. The 'Recognitions' slide allows you to highlight awards and honors, adding credibility to your profile. Ending with a compelling 'Let's work together!' call-to-action, this template is adaptable to PowerPoint, Keynote, and Google Slides, perfect for anyone looking to stand out in their field.


22 diapositivas
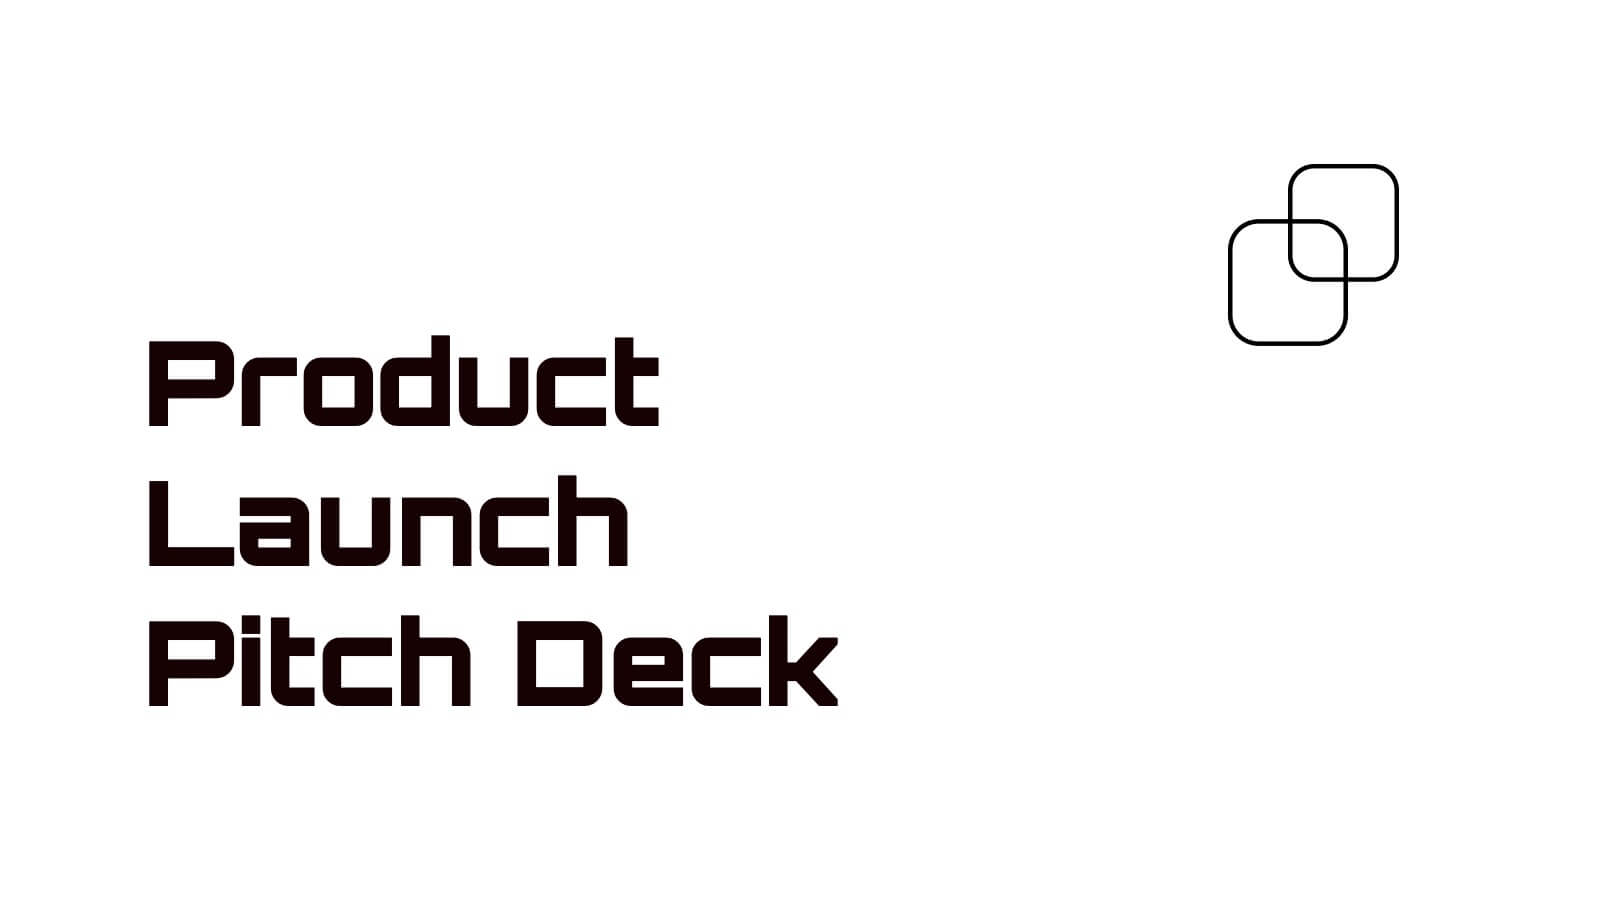
Pearl Product Launch Pitch Deck Presentation
Make your product launch shine with this sleek, pearl-inspired presentation! Perfect for pitching your product’s unique value, market positioning, and growth potential, this template is designed to captivate investors and stakeholders. Its elegant, minimalist layout keeps your message front and center. Compatible with PowerPoint, Keynote, and Google Slides.


6 diapositivas
United States Coronavirus Map
A United States Coronavirus Map is a graphical representation that displays the spread of the coronavirus (COVID-19) across the United States. This infographic template may use different colors, shades, or symbols to indicate the severity of COVID-19 cases in different areas. Darker colors may represent higher case numbers, while lighter colors may represent lower case numbers. These maps are valuable tools to track the progression of the virus, identify hotspots, and make informed decisions related to public health. This can also help raise awareness about the importance of preventive measures and promote data-driven strategies to control the spread.


6 diapositivas
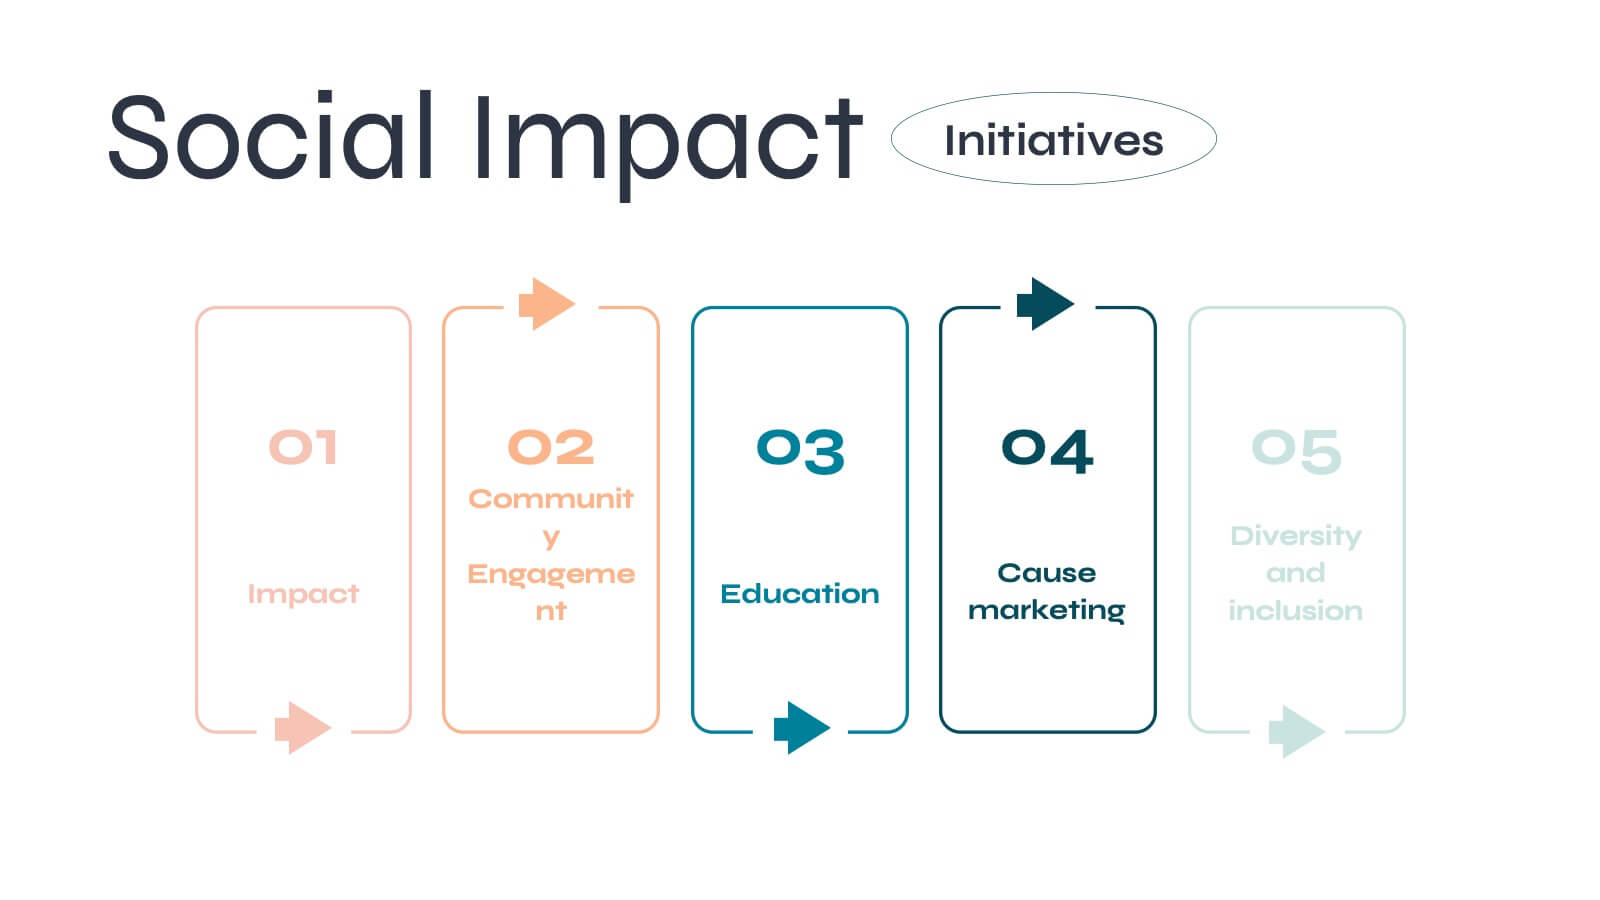
Eco-Initiatives and Sustainability Efforts Presentation
Highlight your green strategy with the Eco-Initiatives and Sustainability Efforts Presentation. This template features a clean, icon-based layout to showcase up to six key eco-friendly actions or goals. Ideal for CSR reports, environmental planning, or internal sustainability updates. Fully editable in PowerPoint, Google Slides, and Canva.


26 diapositivas
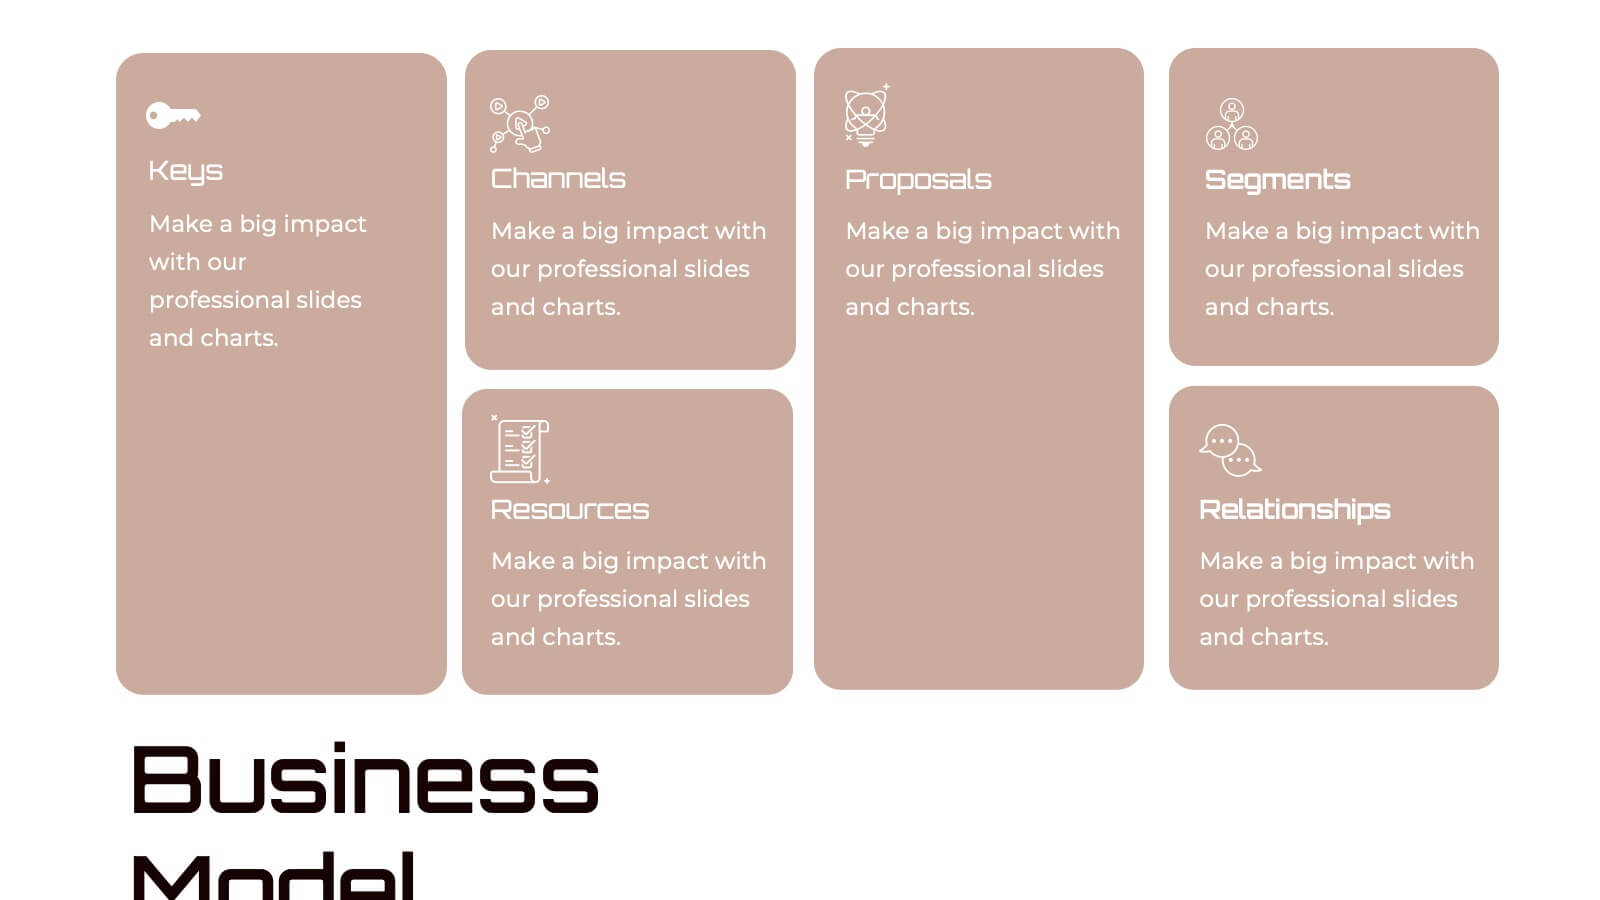
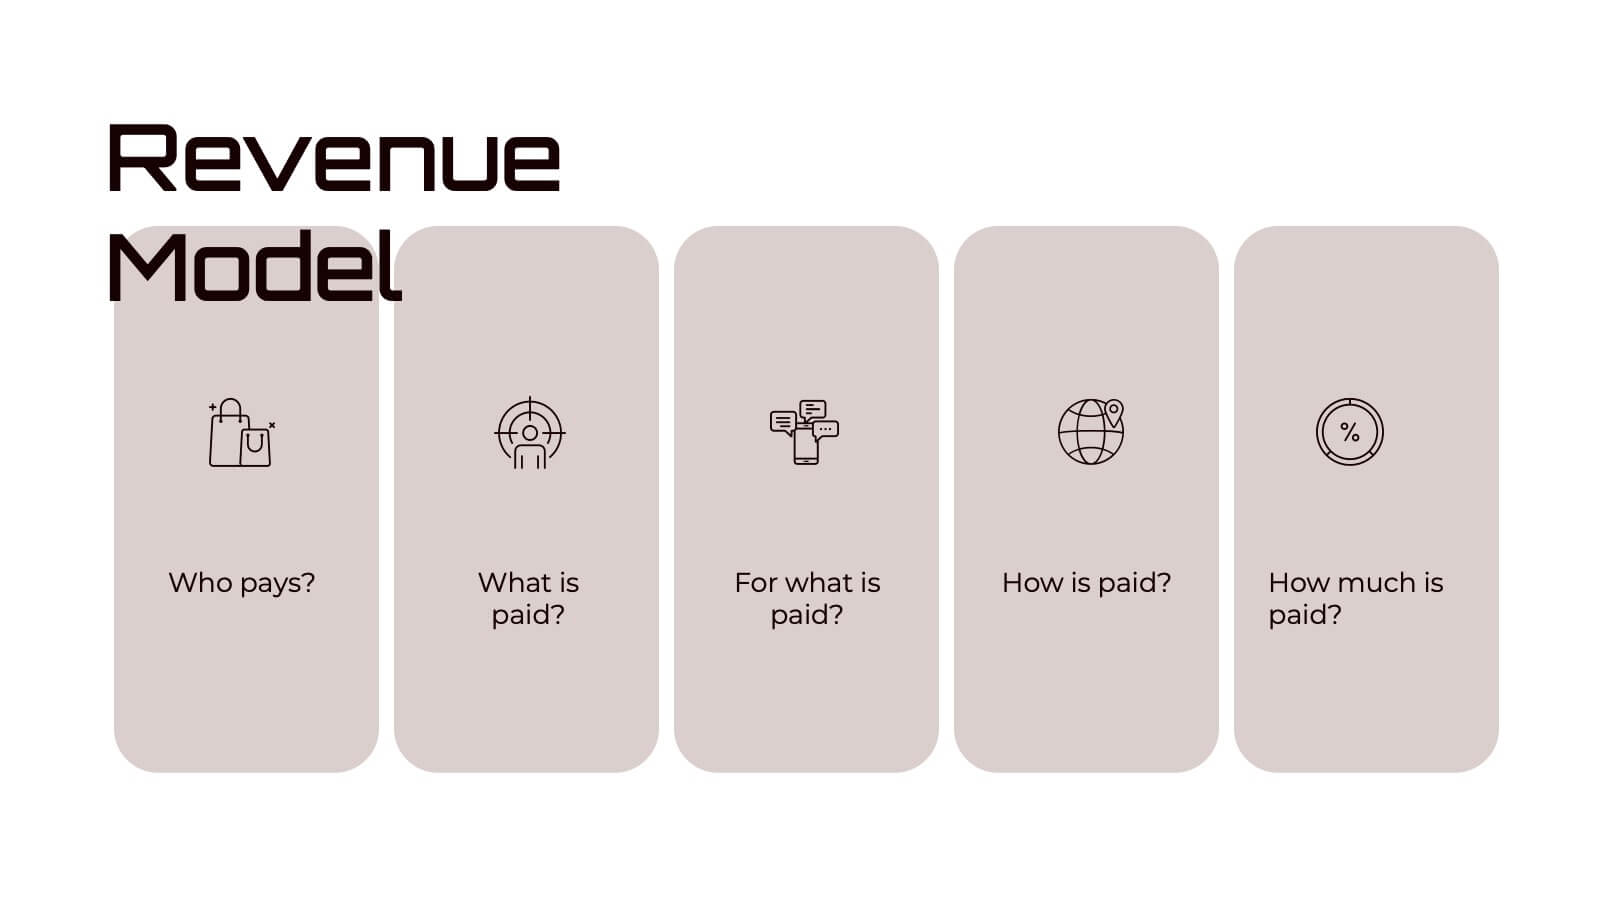
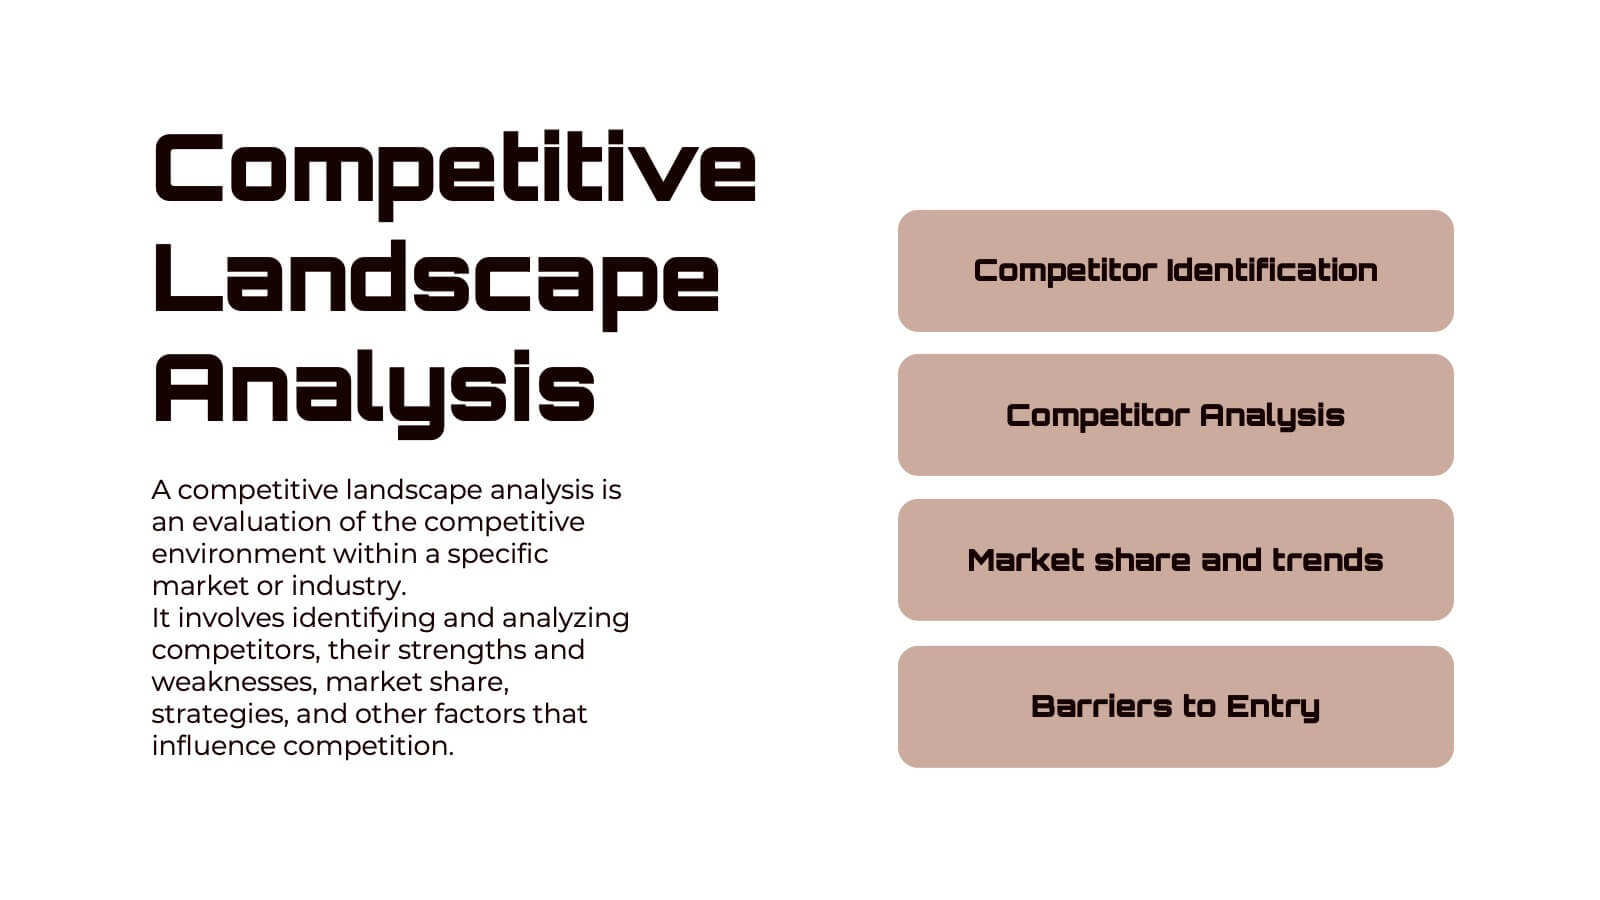
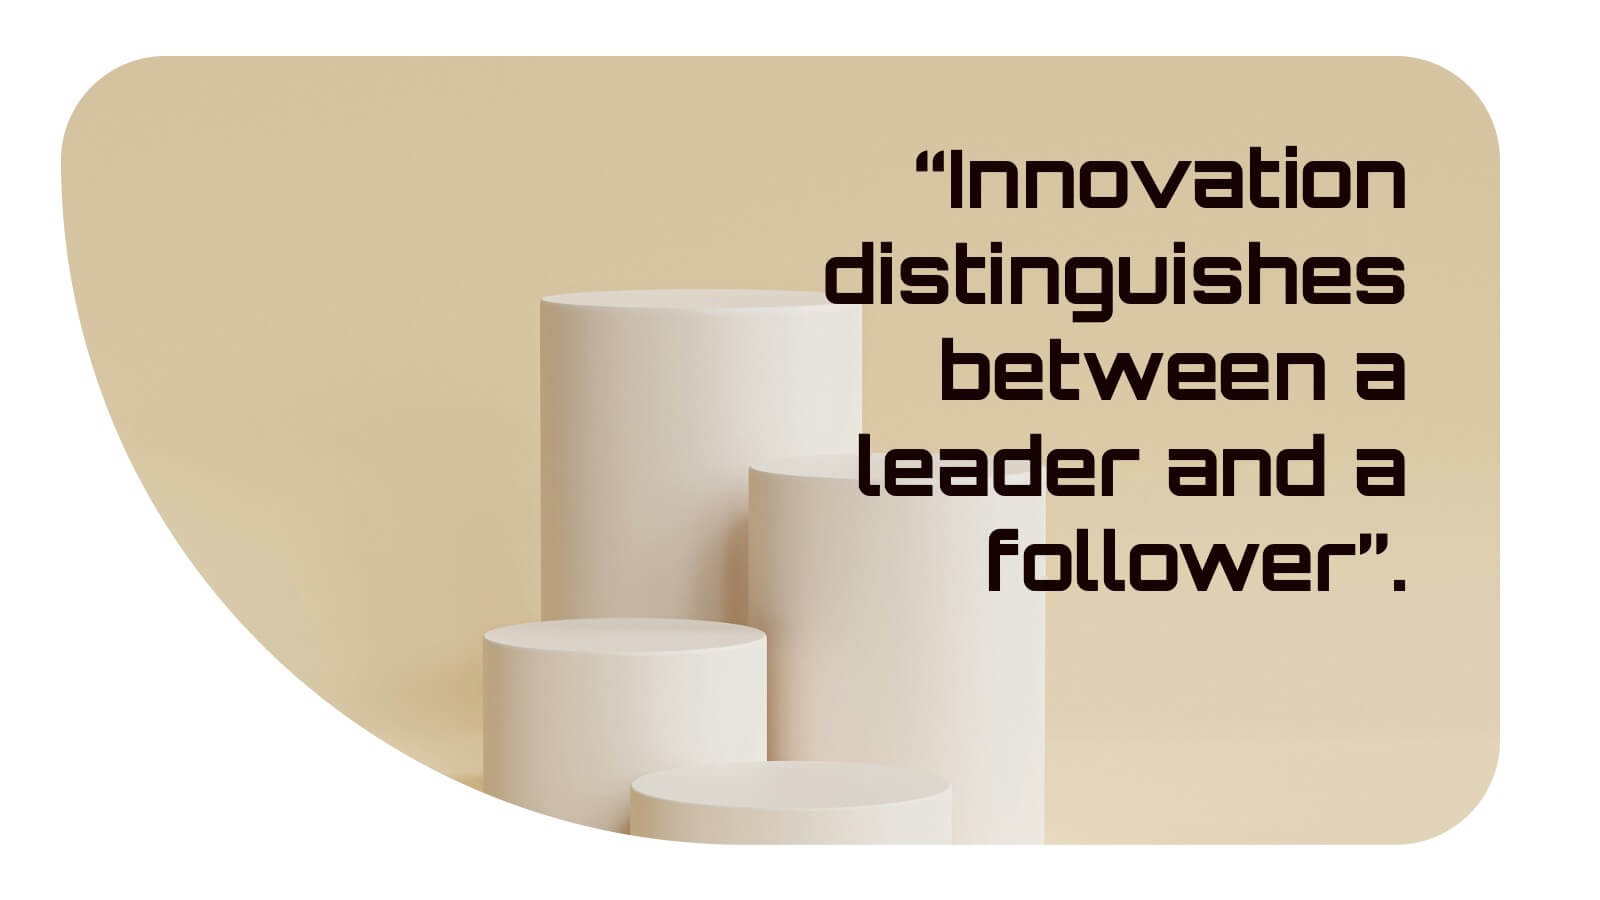
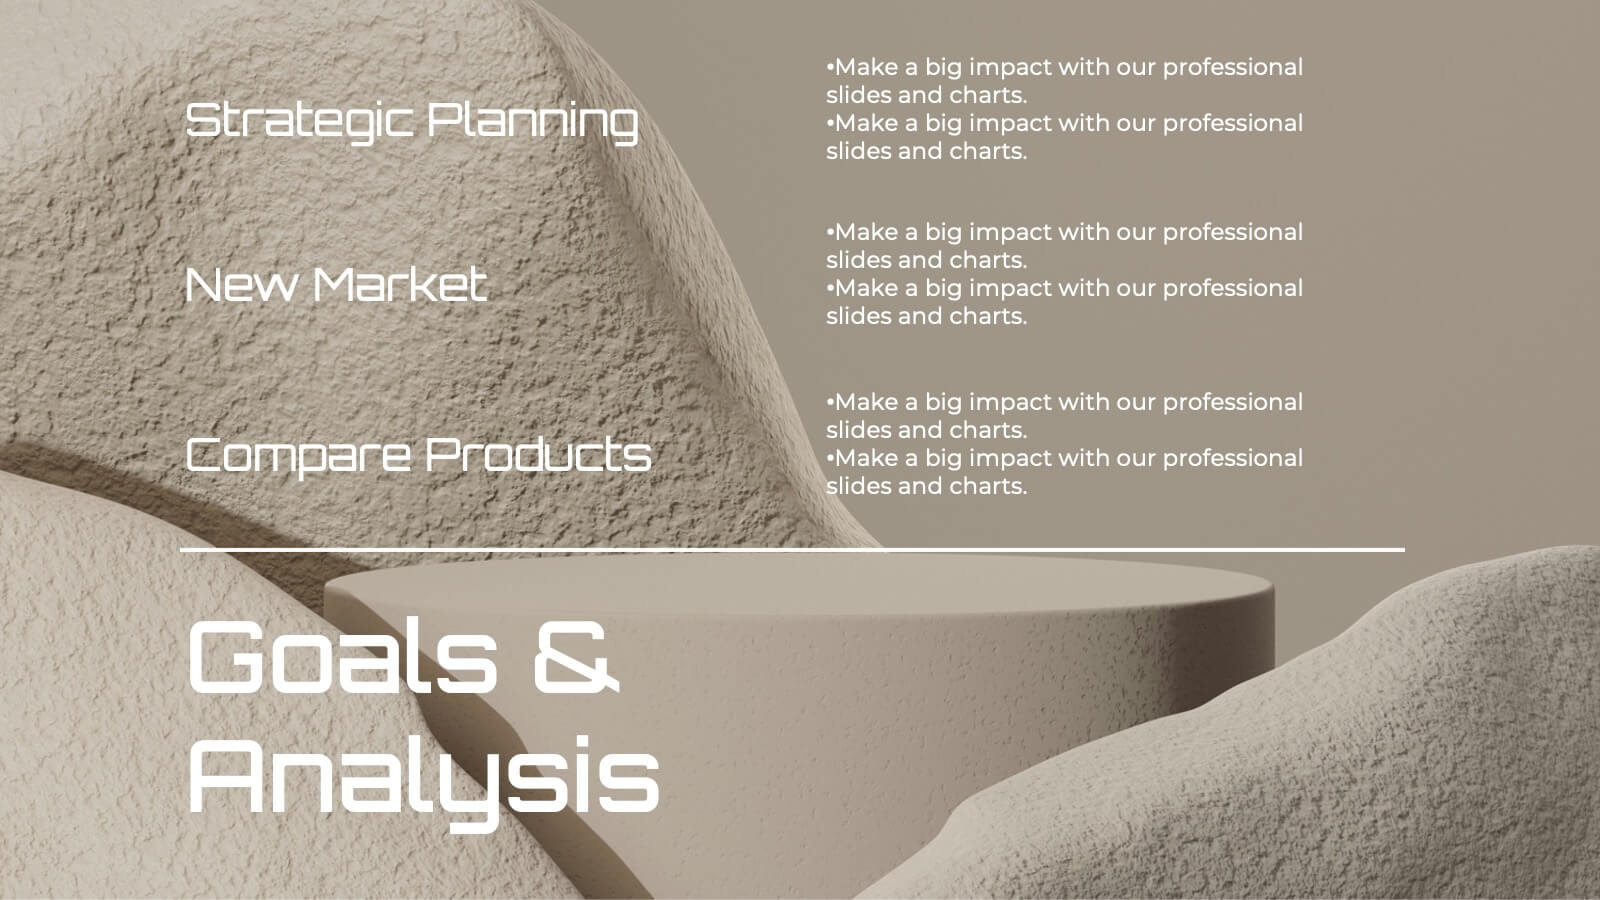
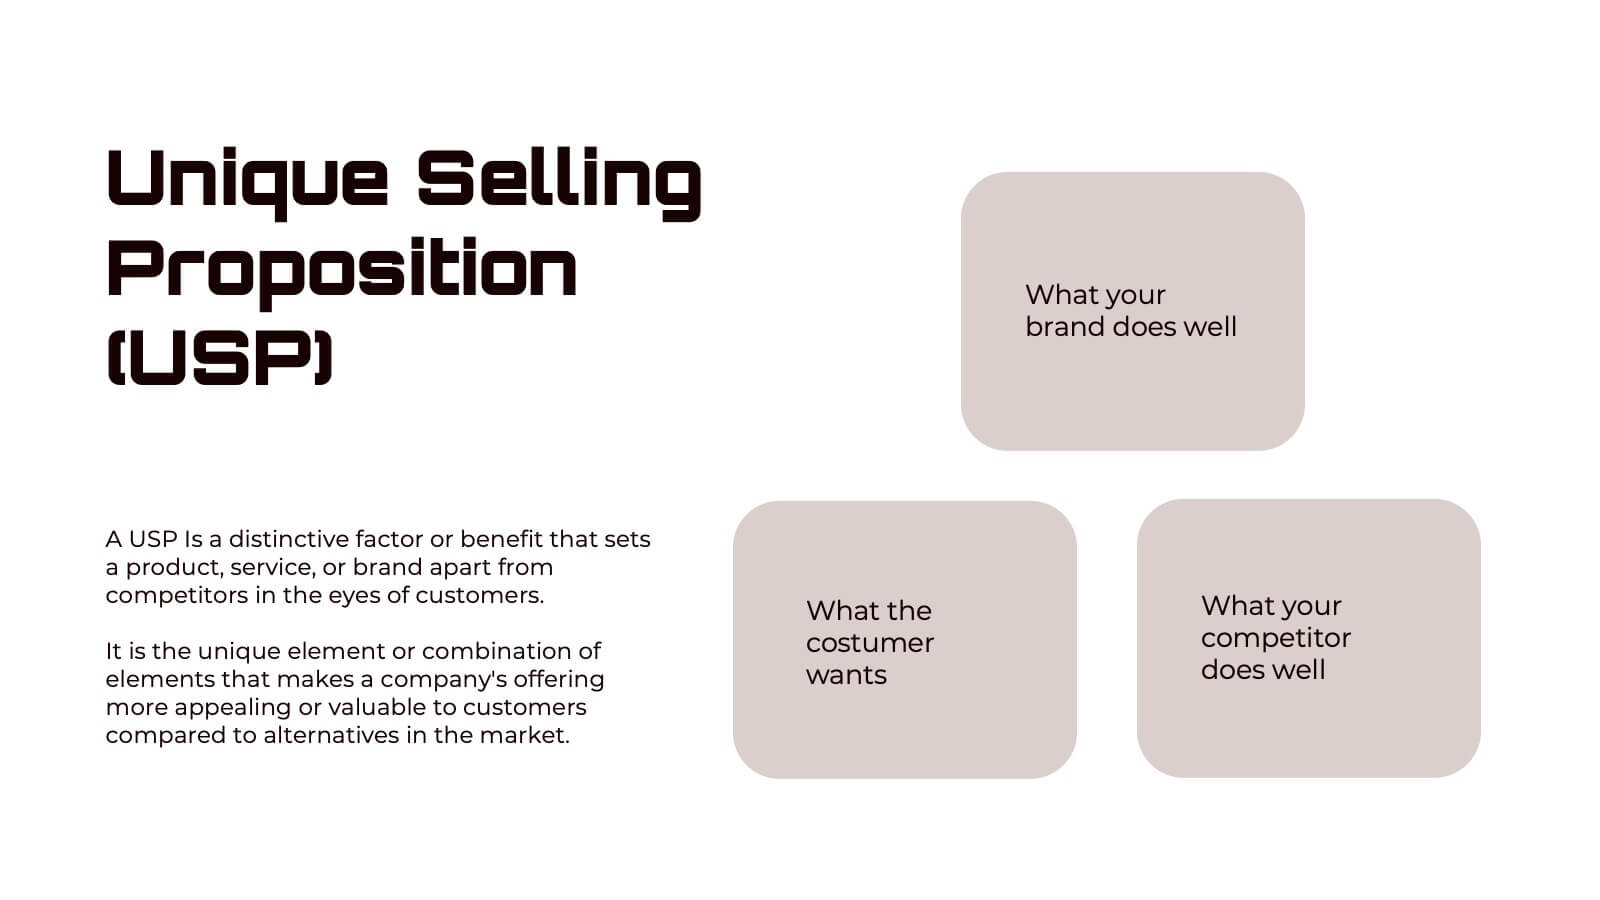
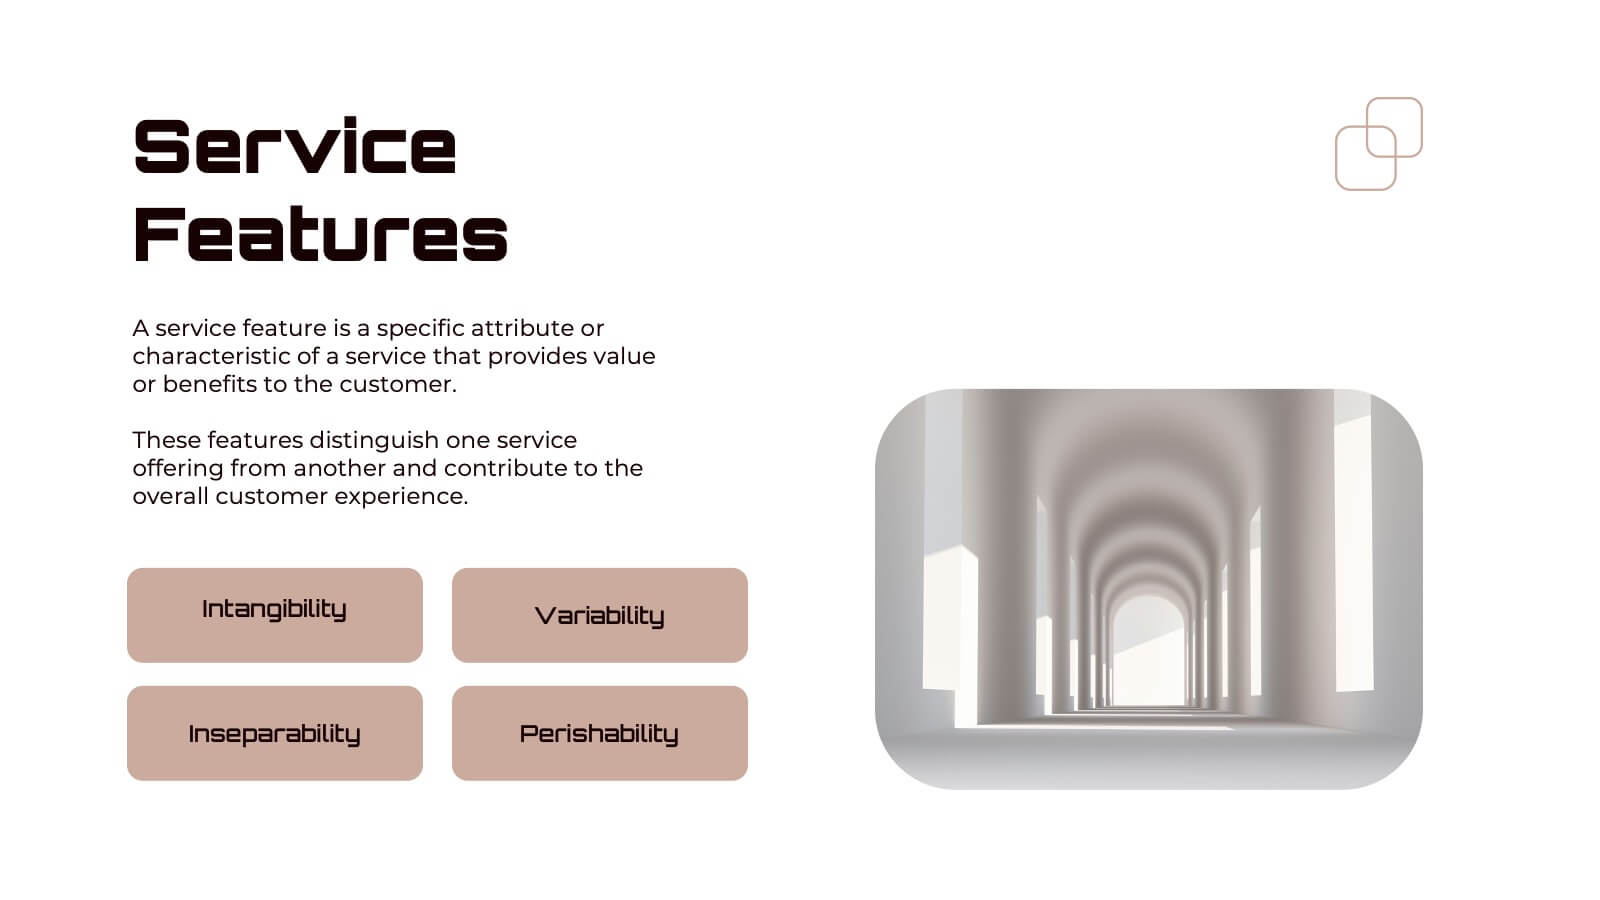
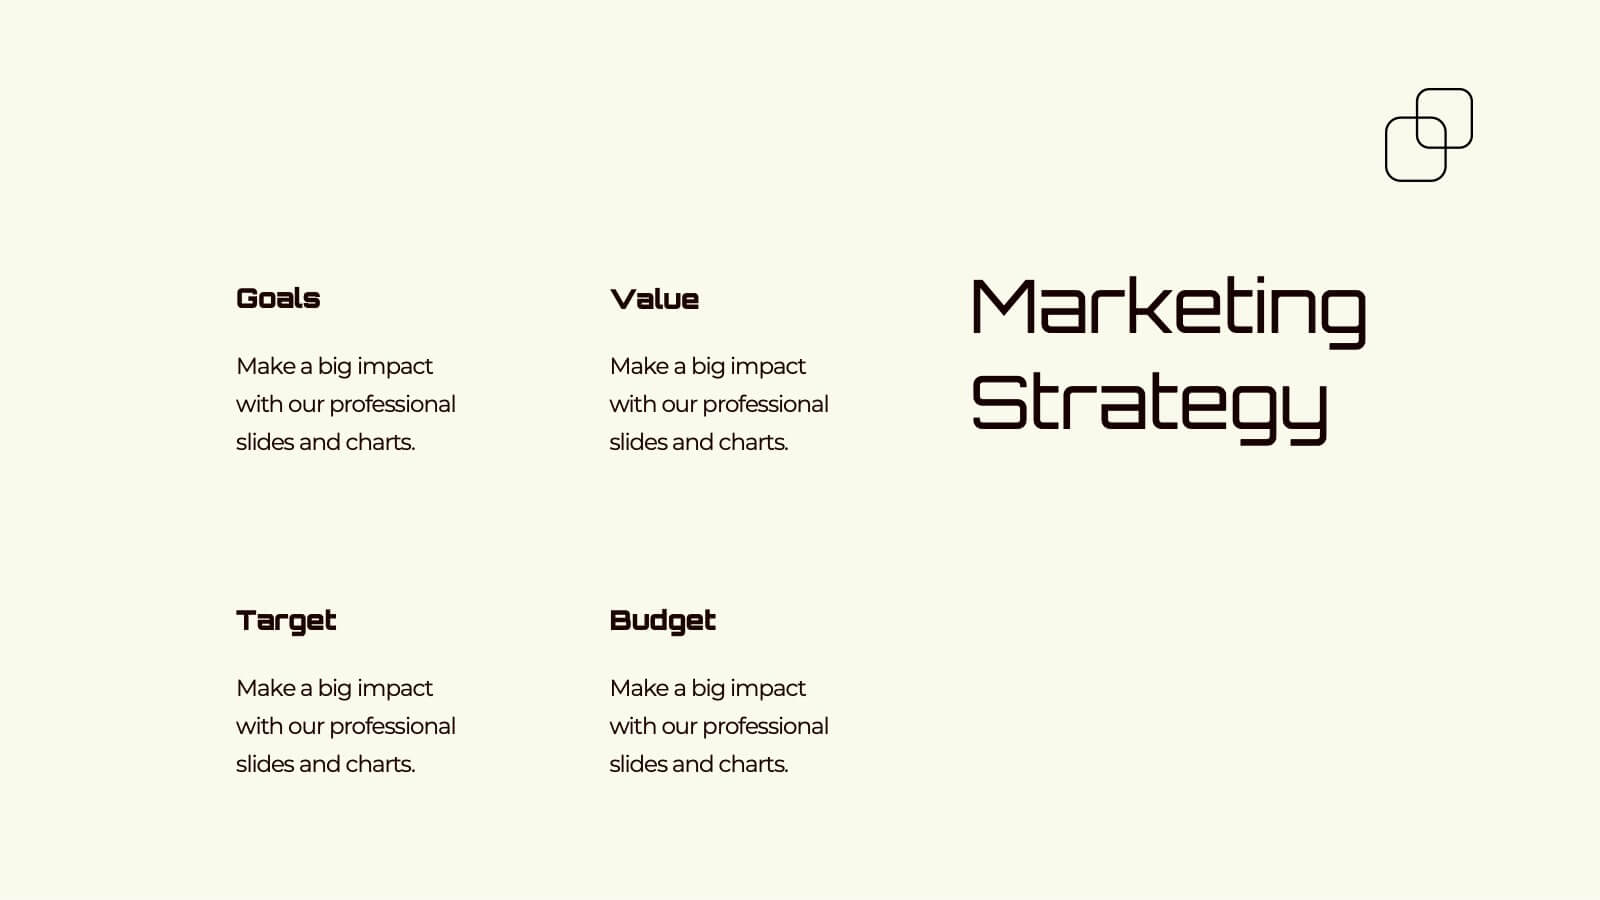
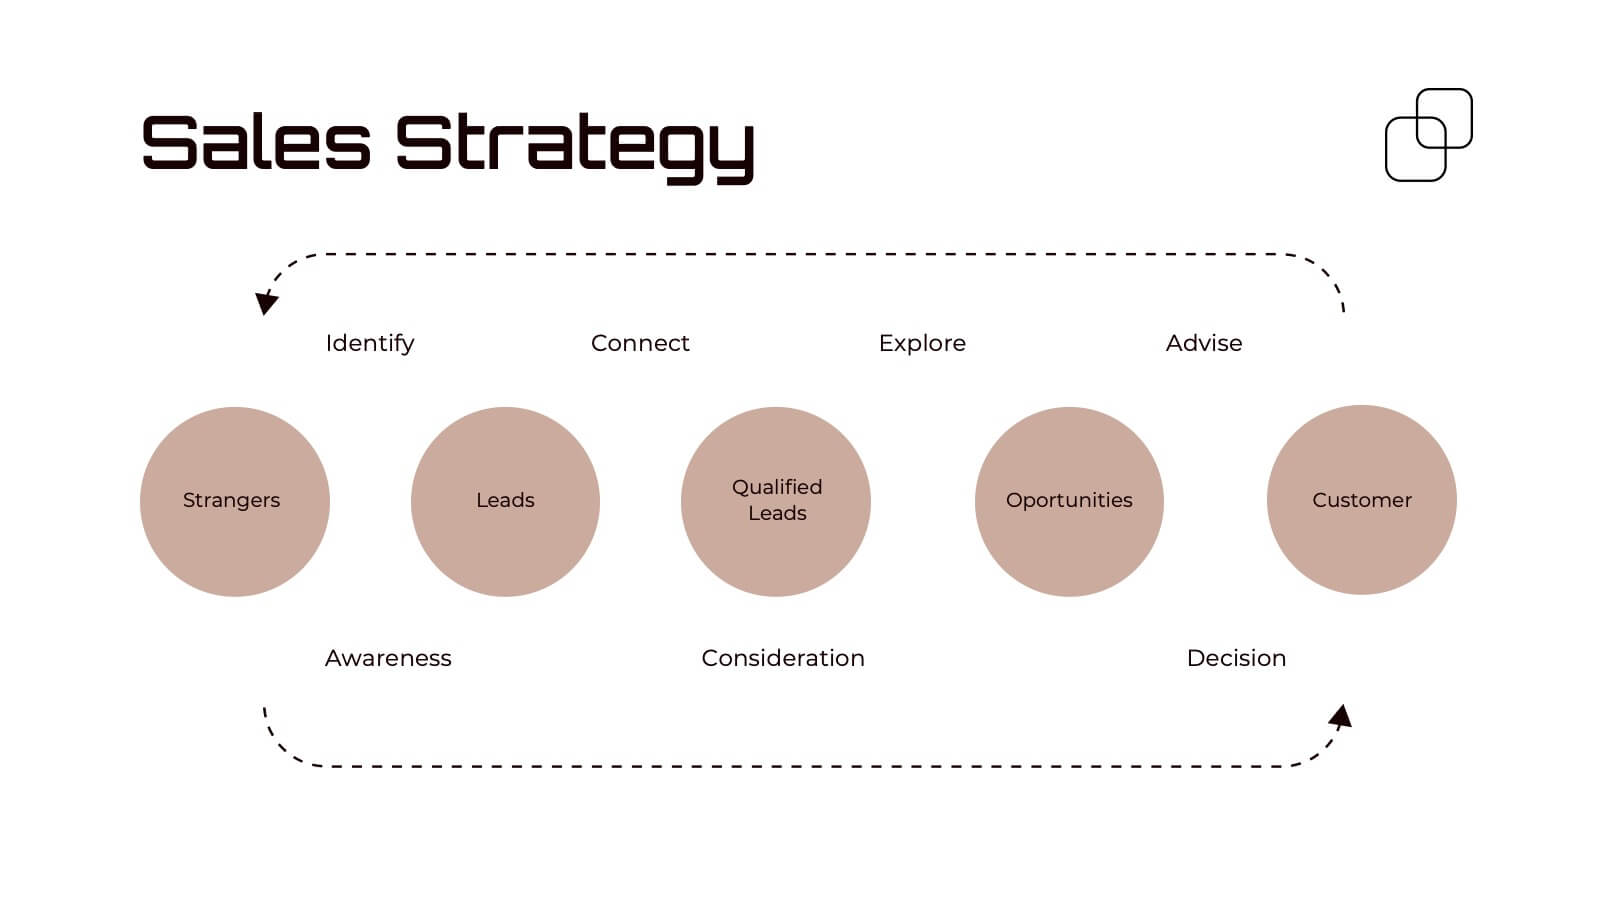
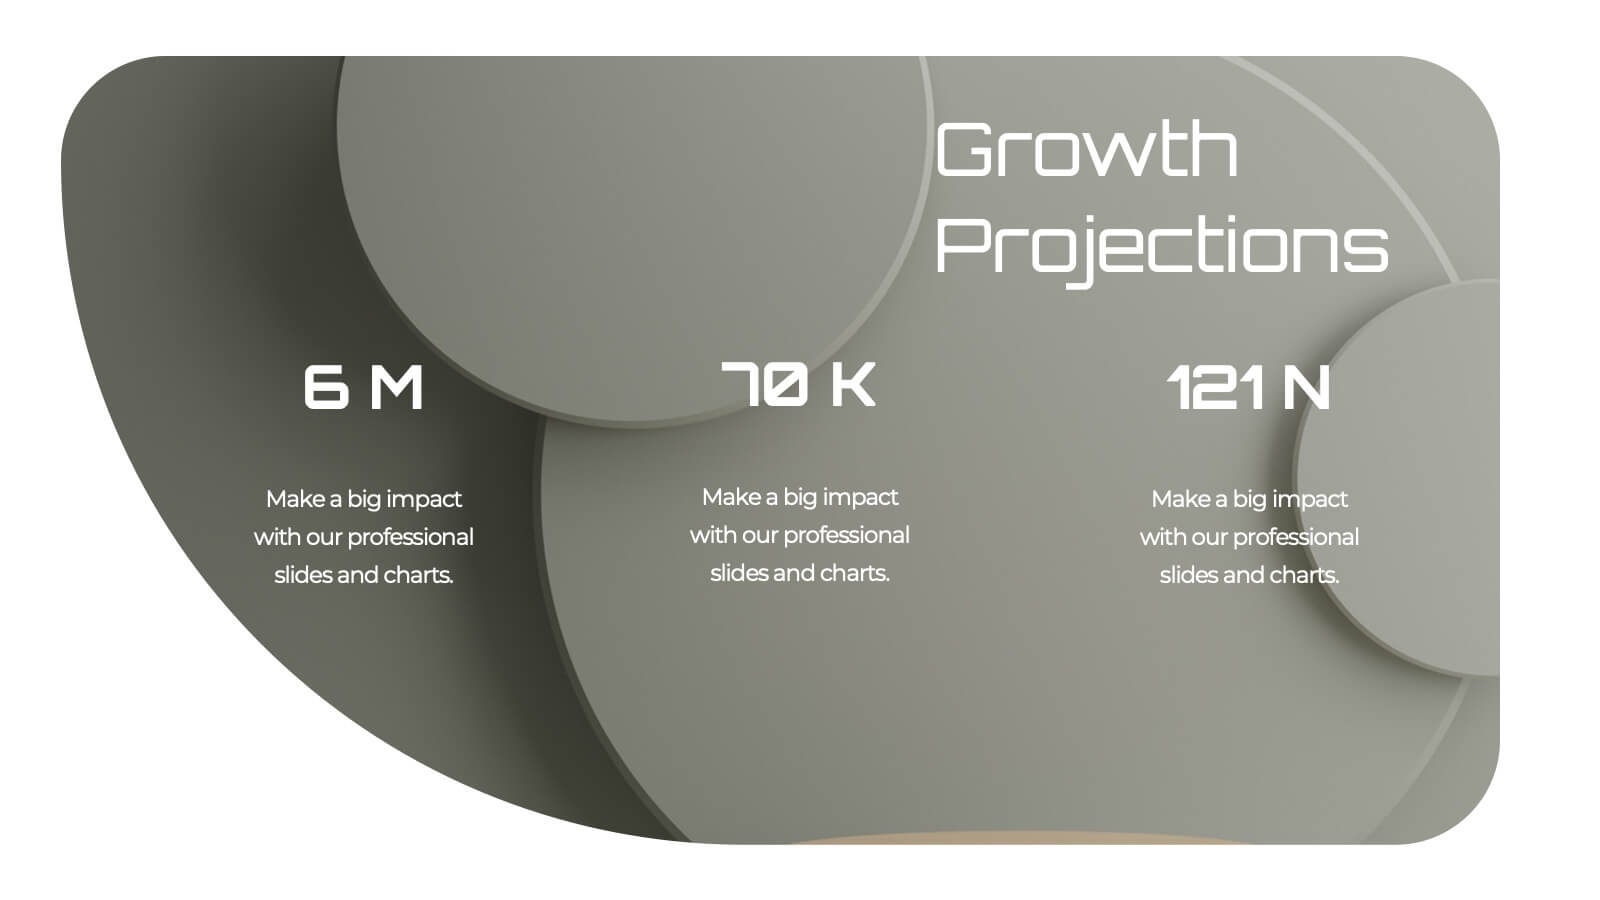
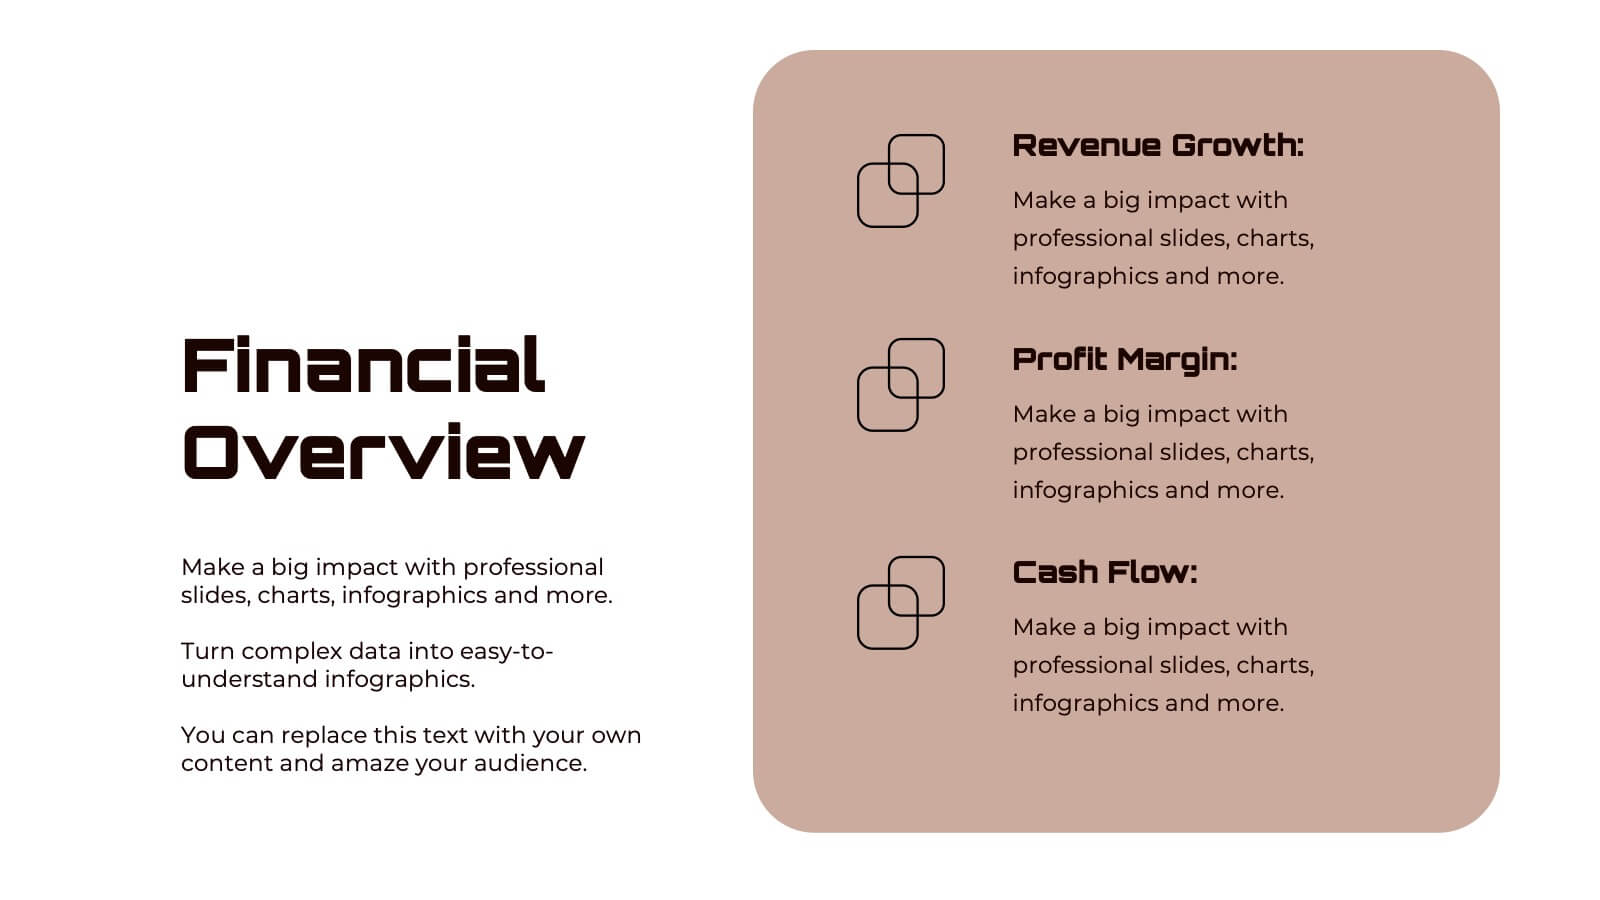
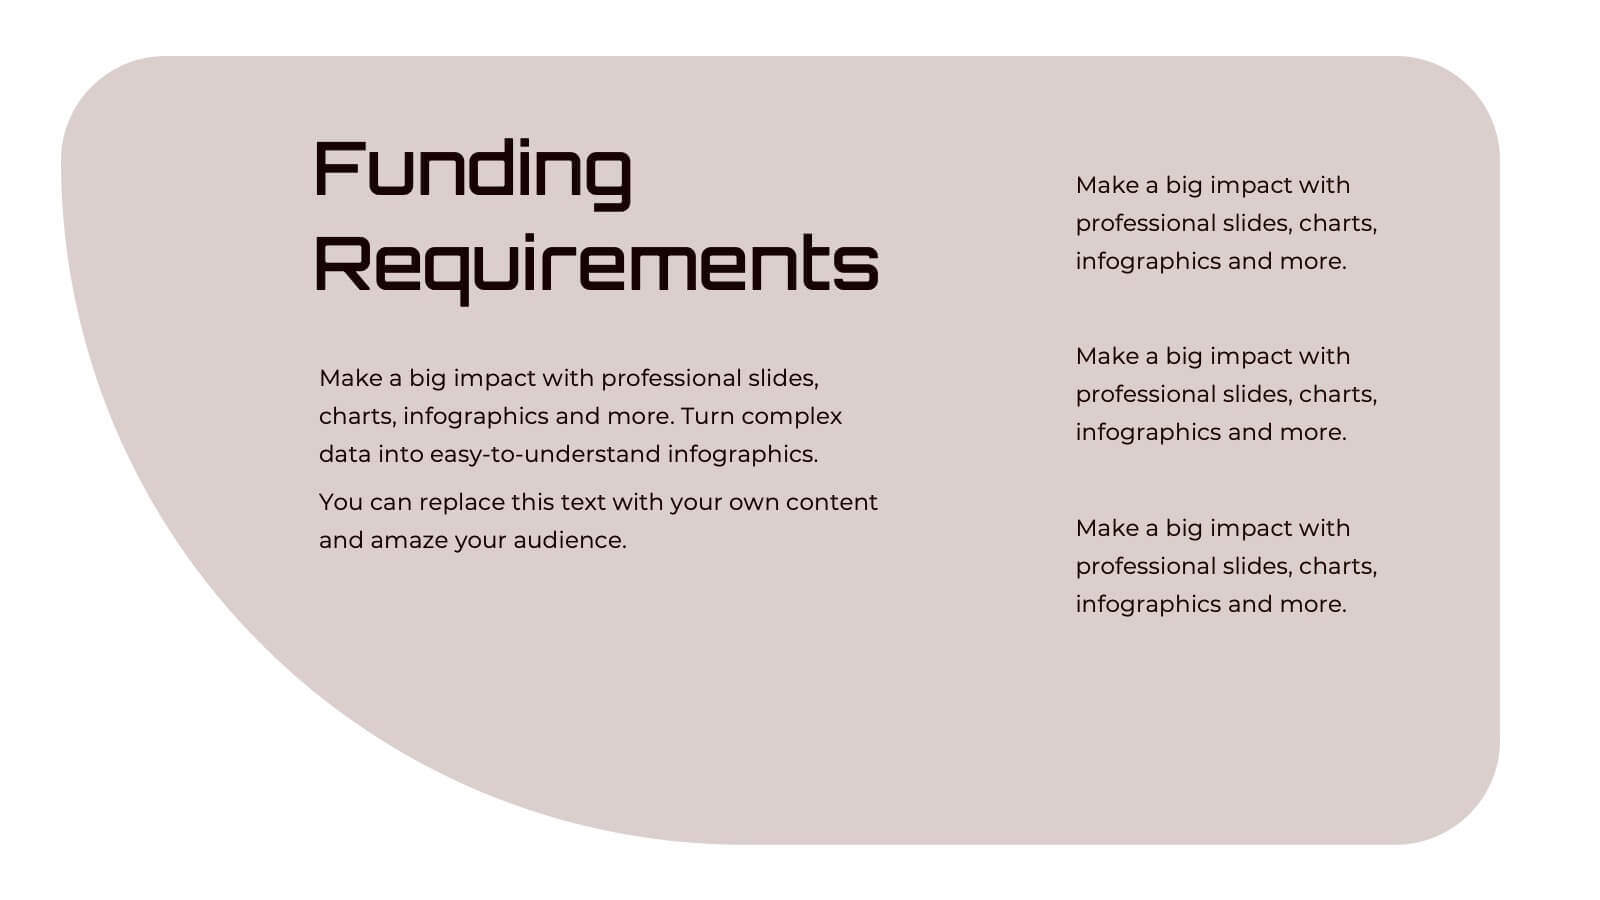
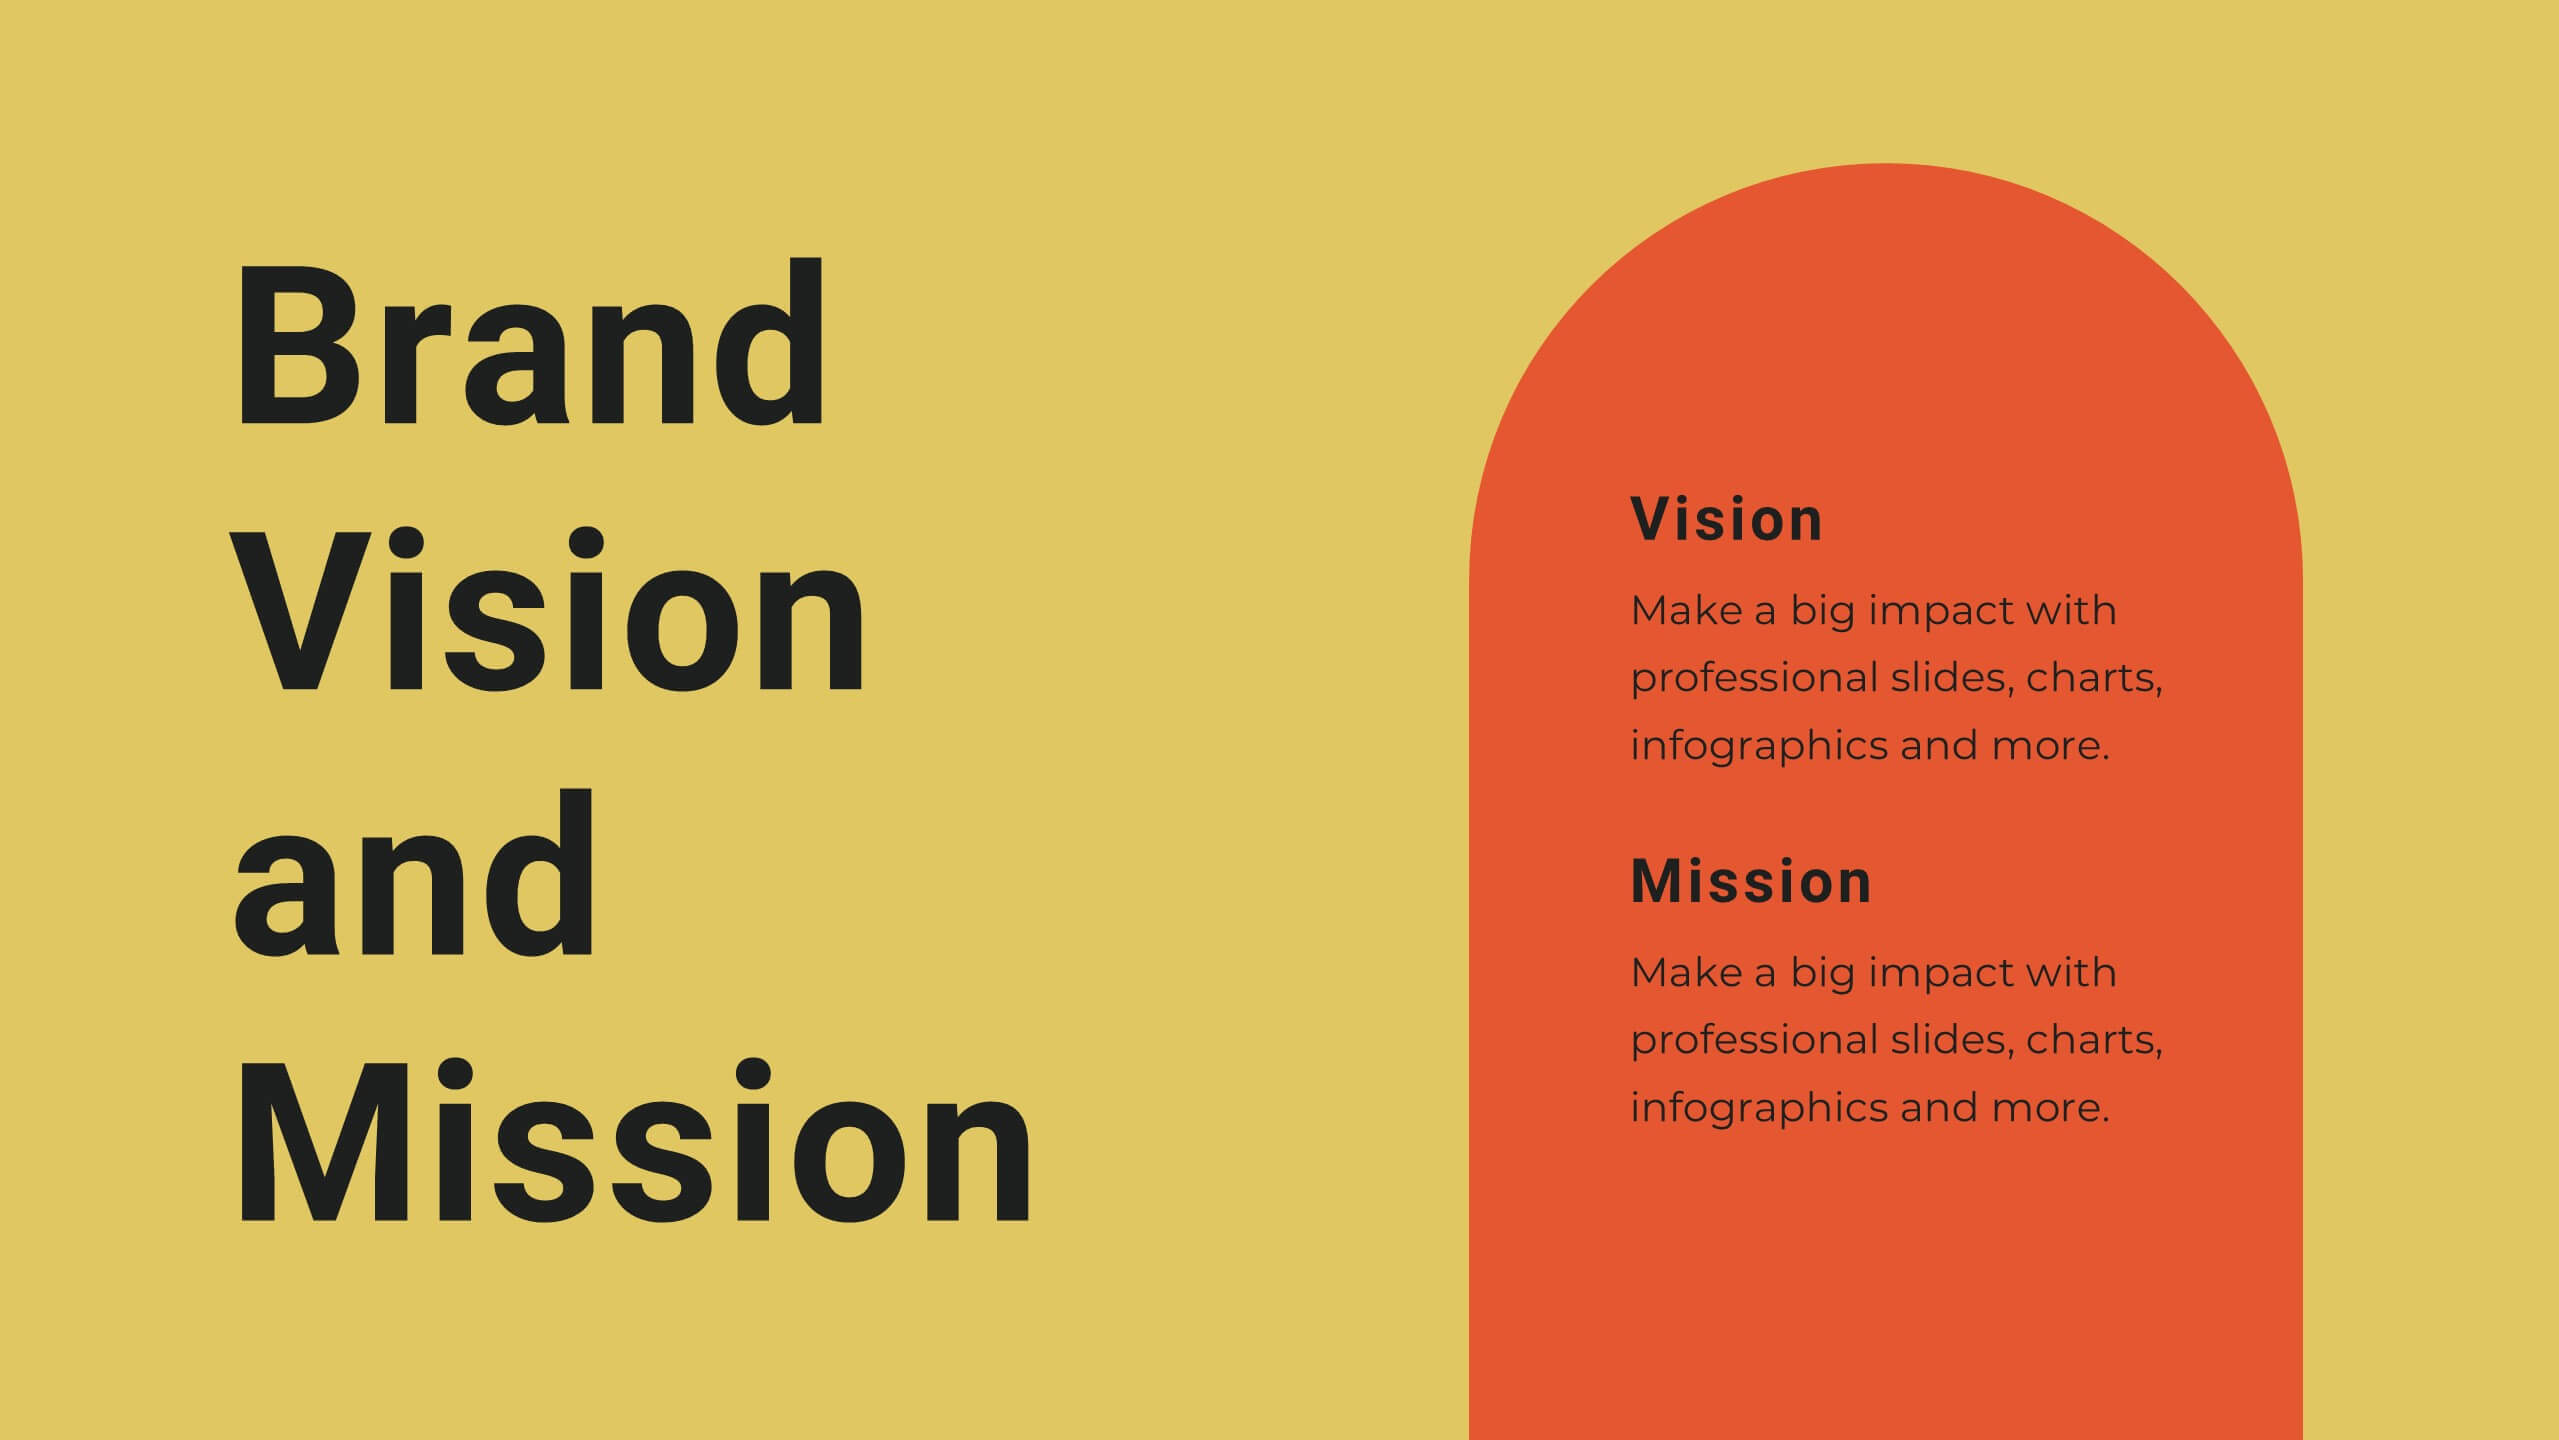
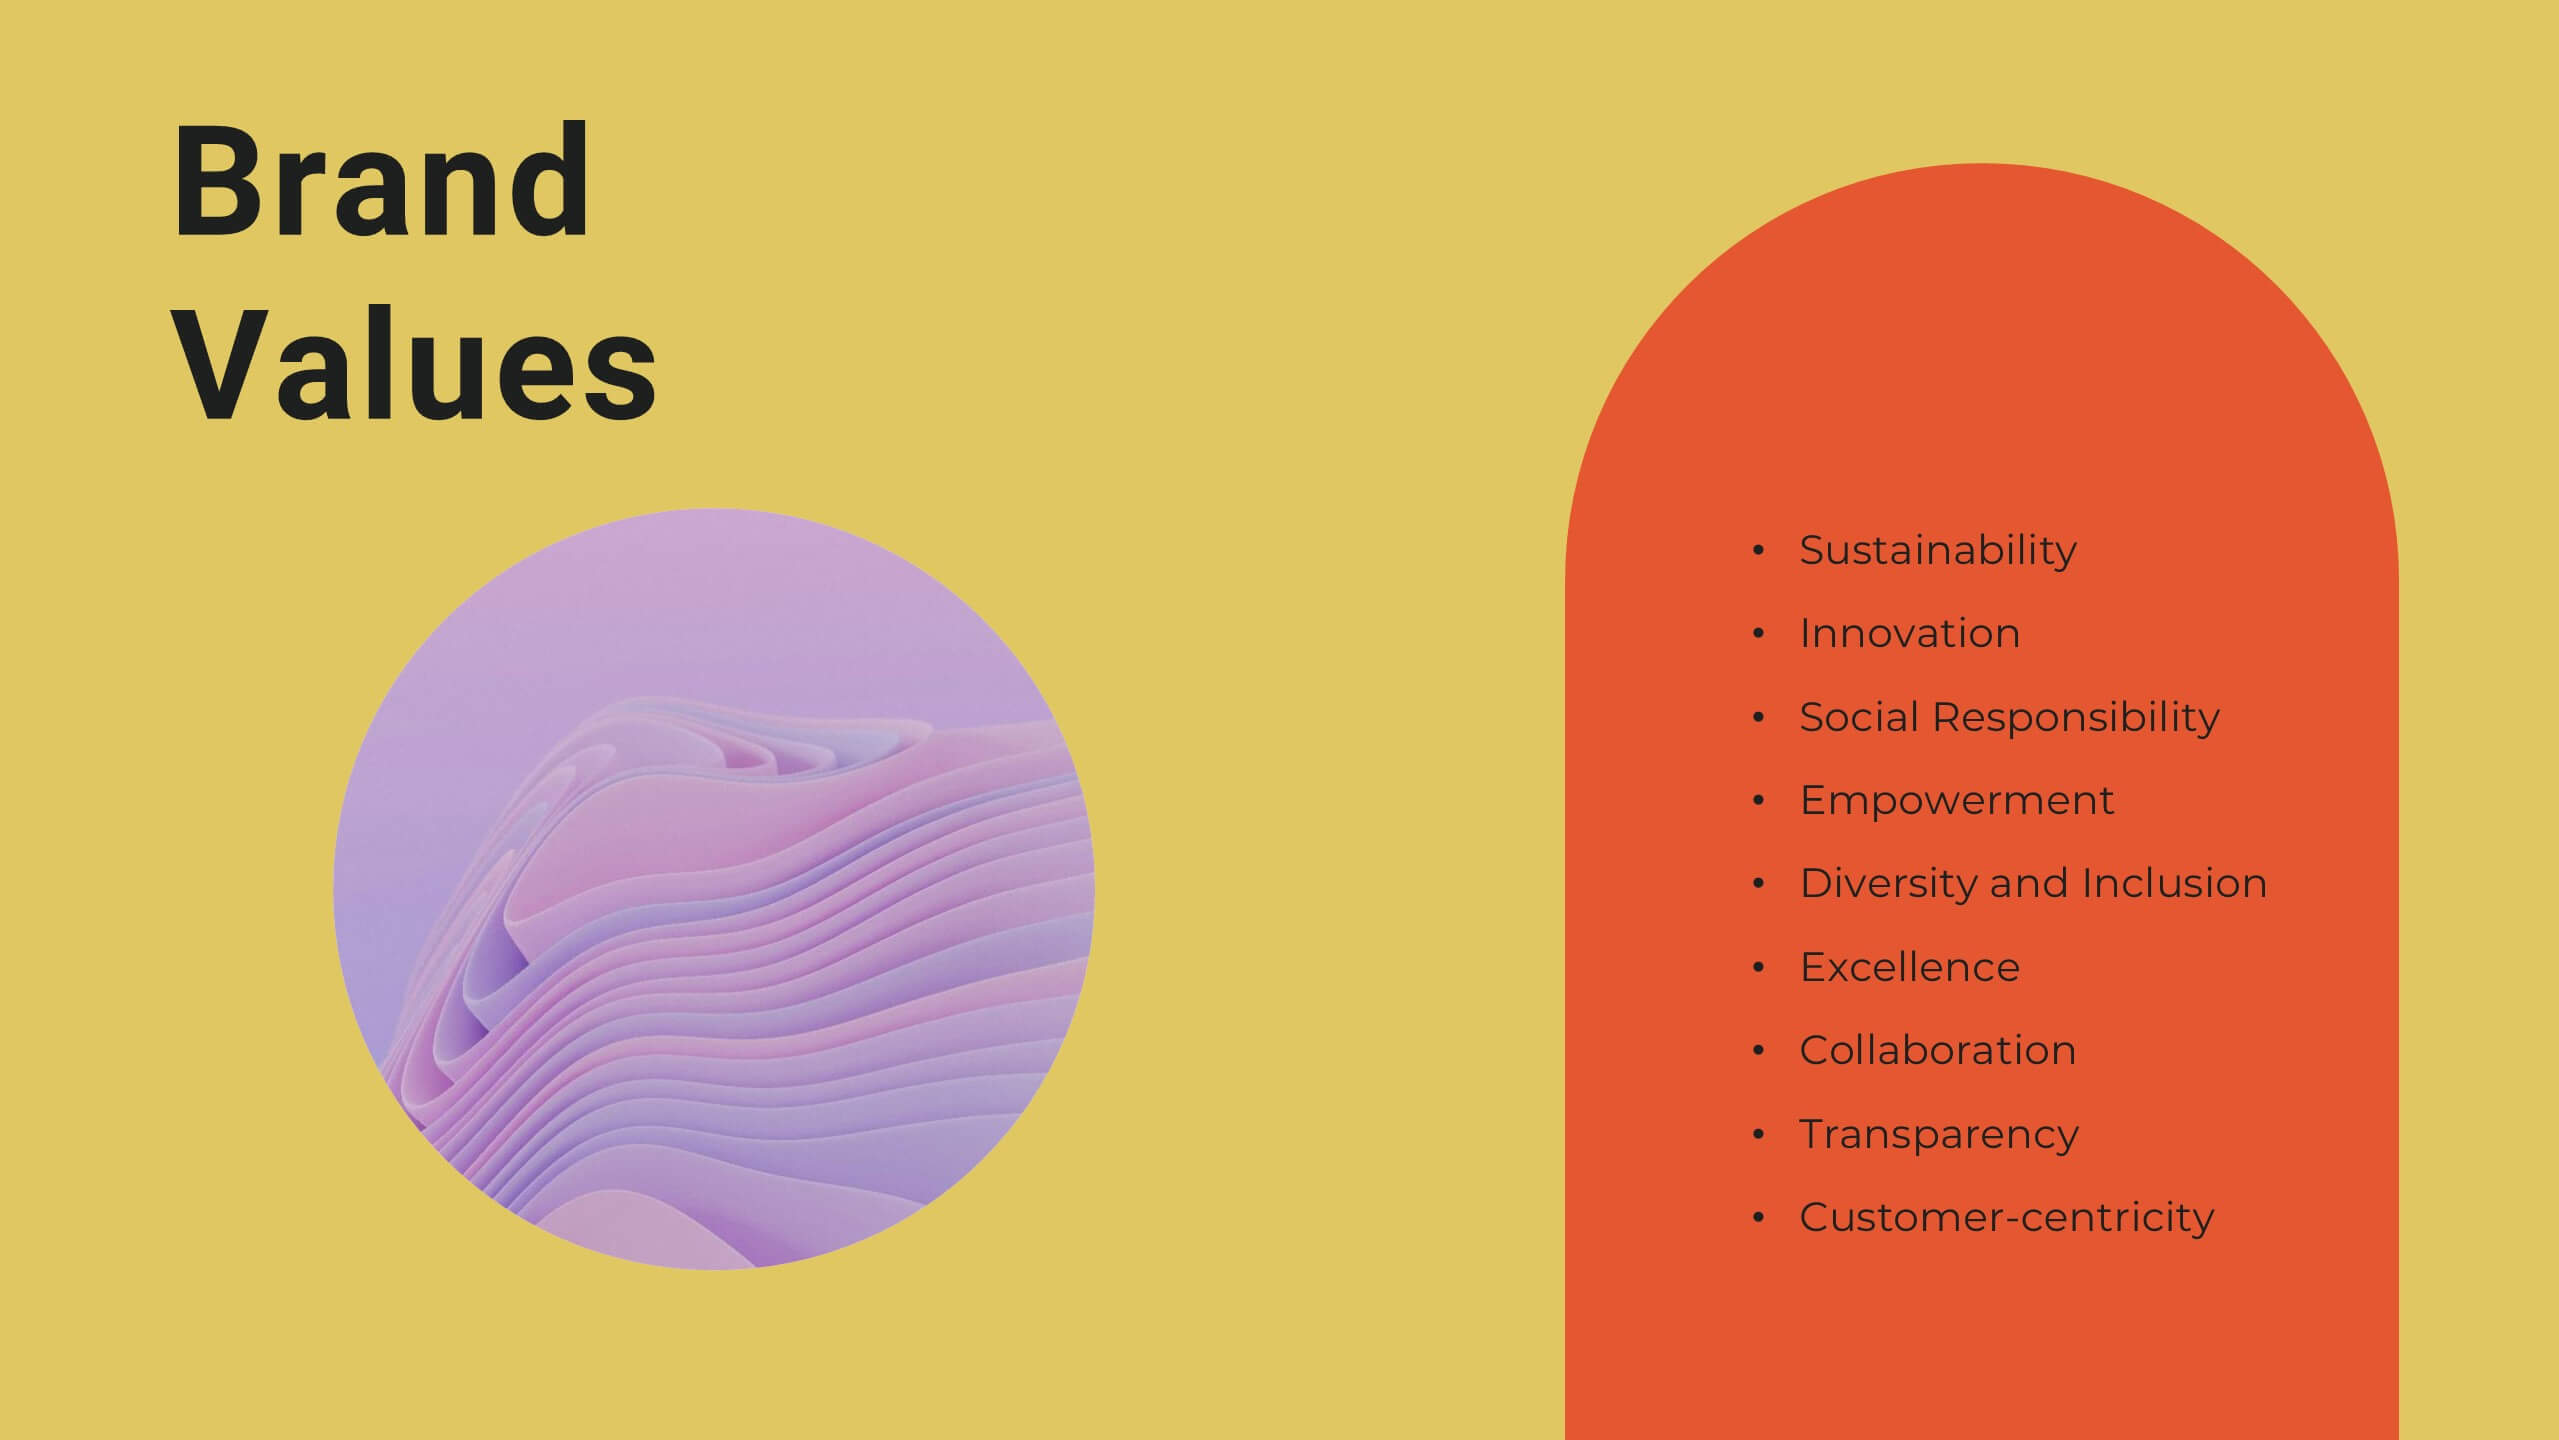
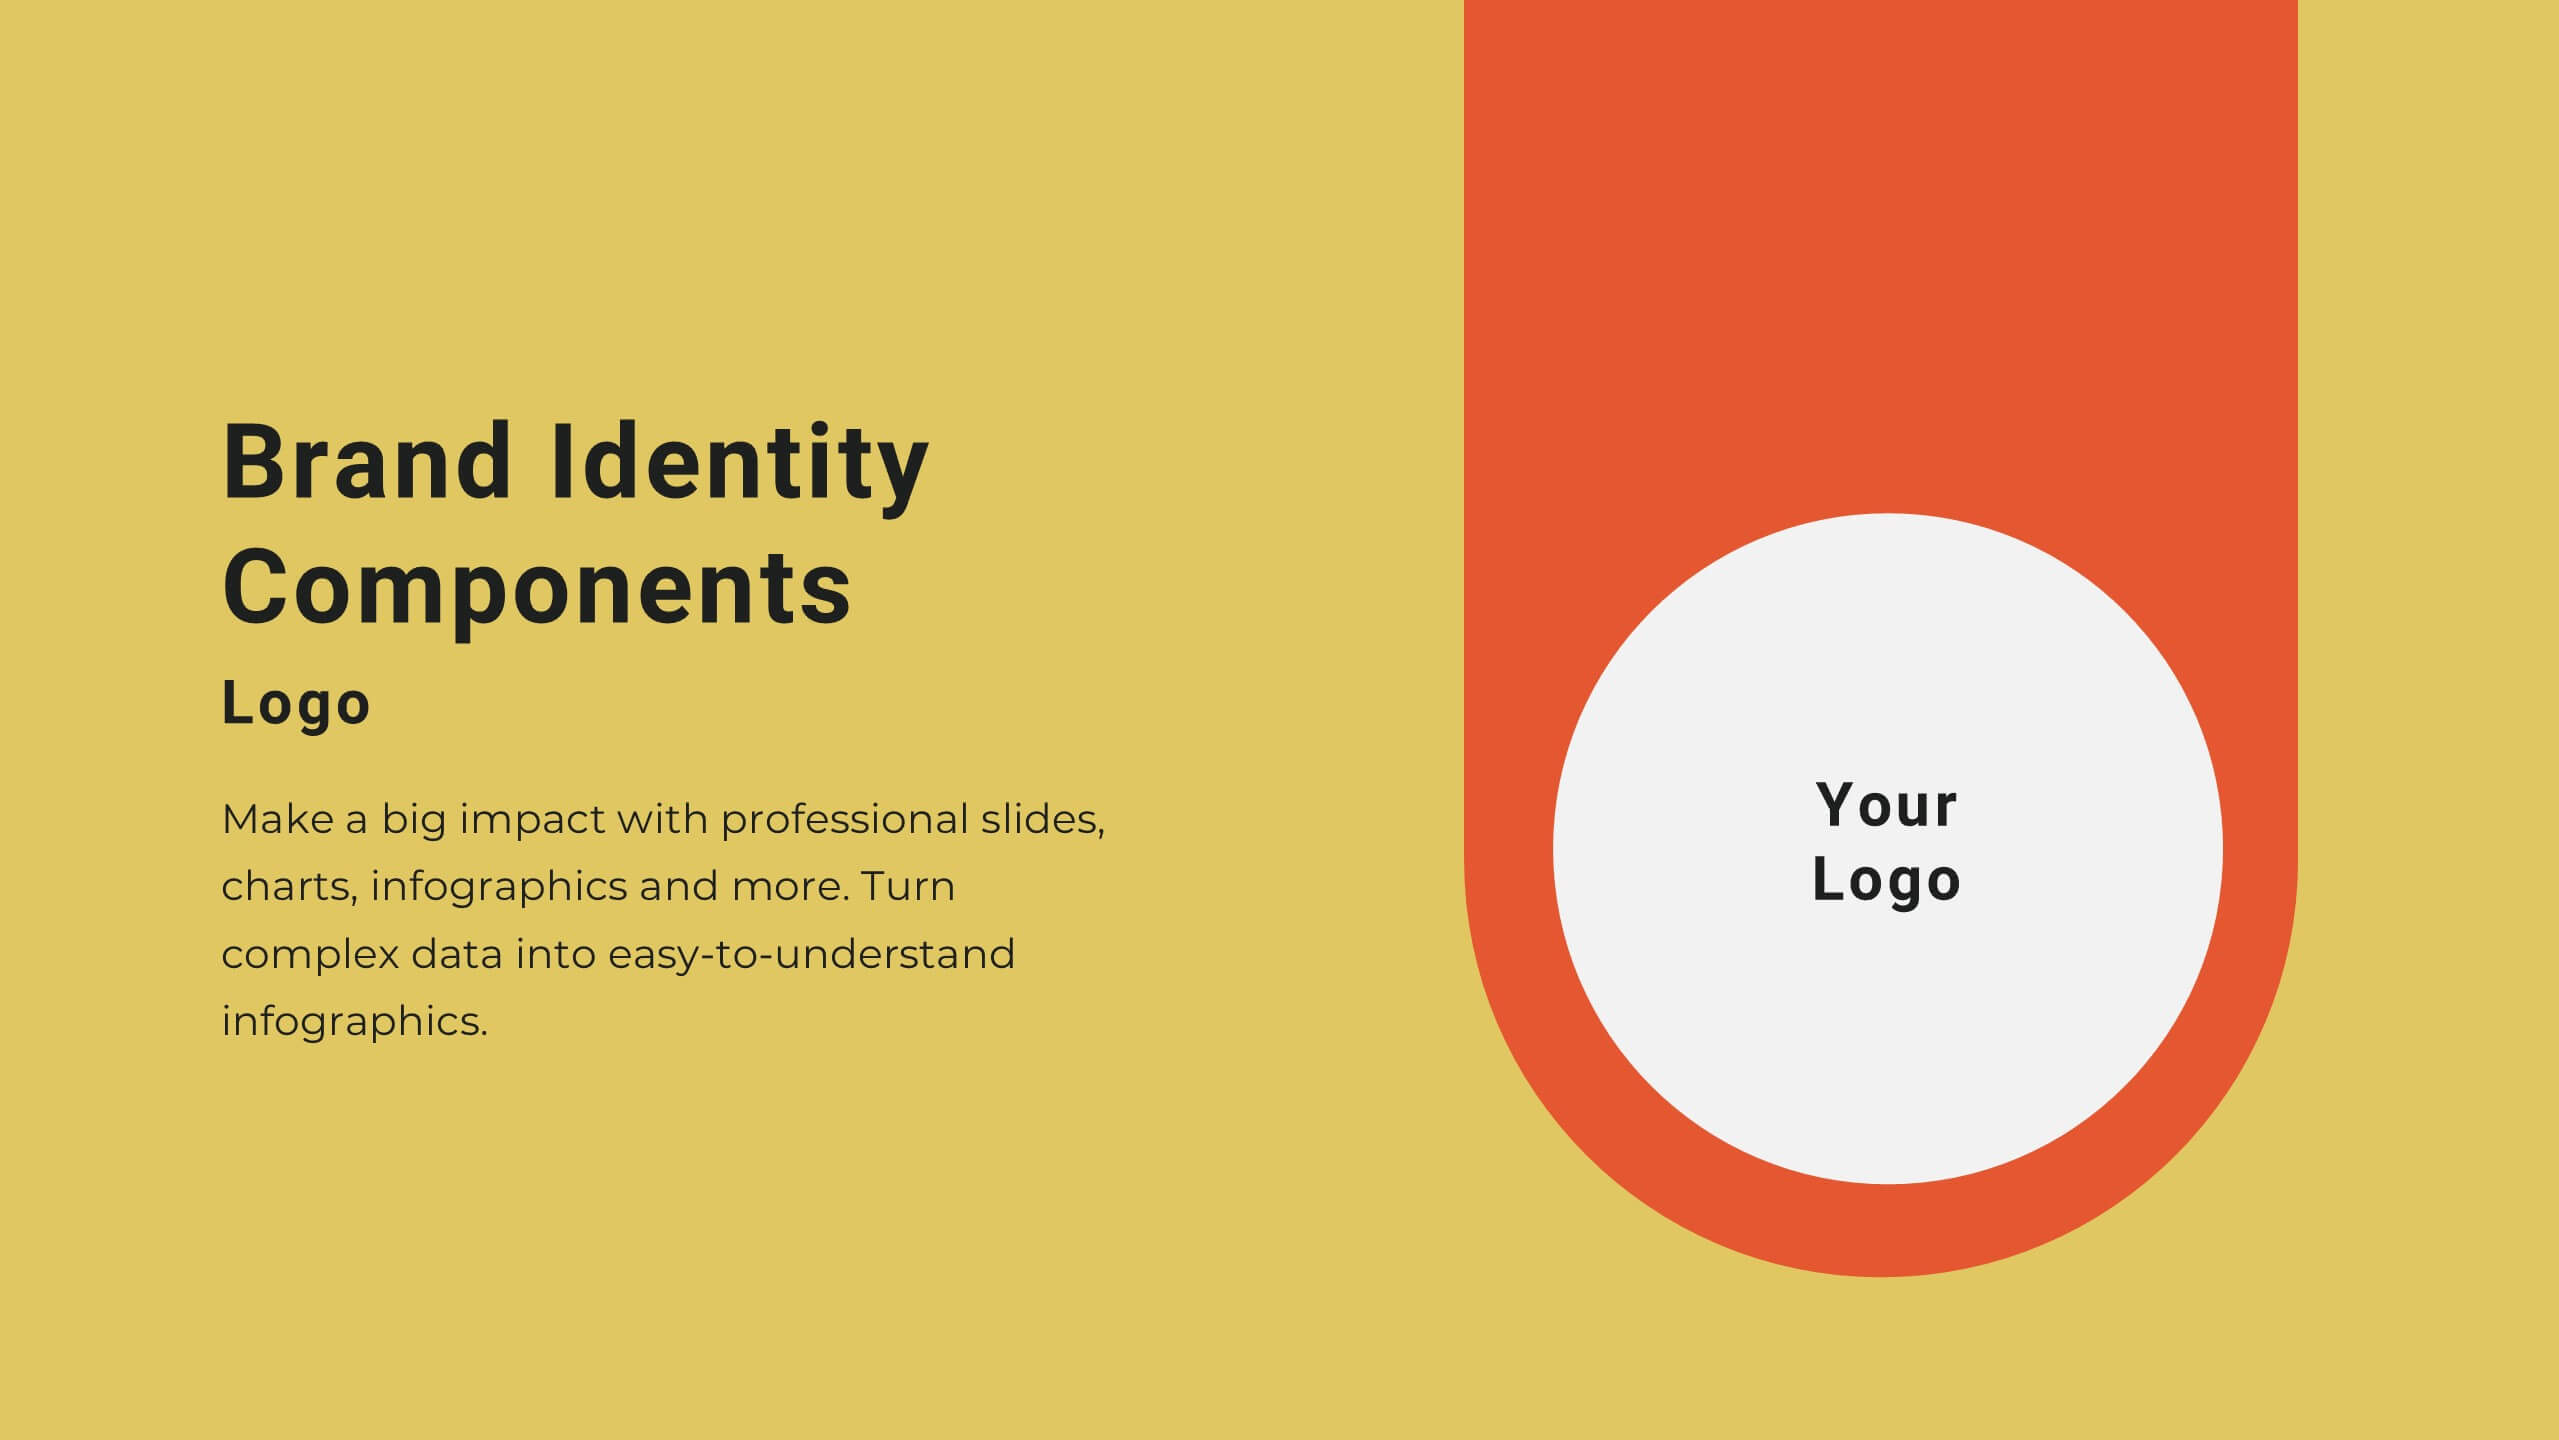
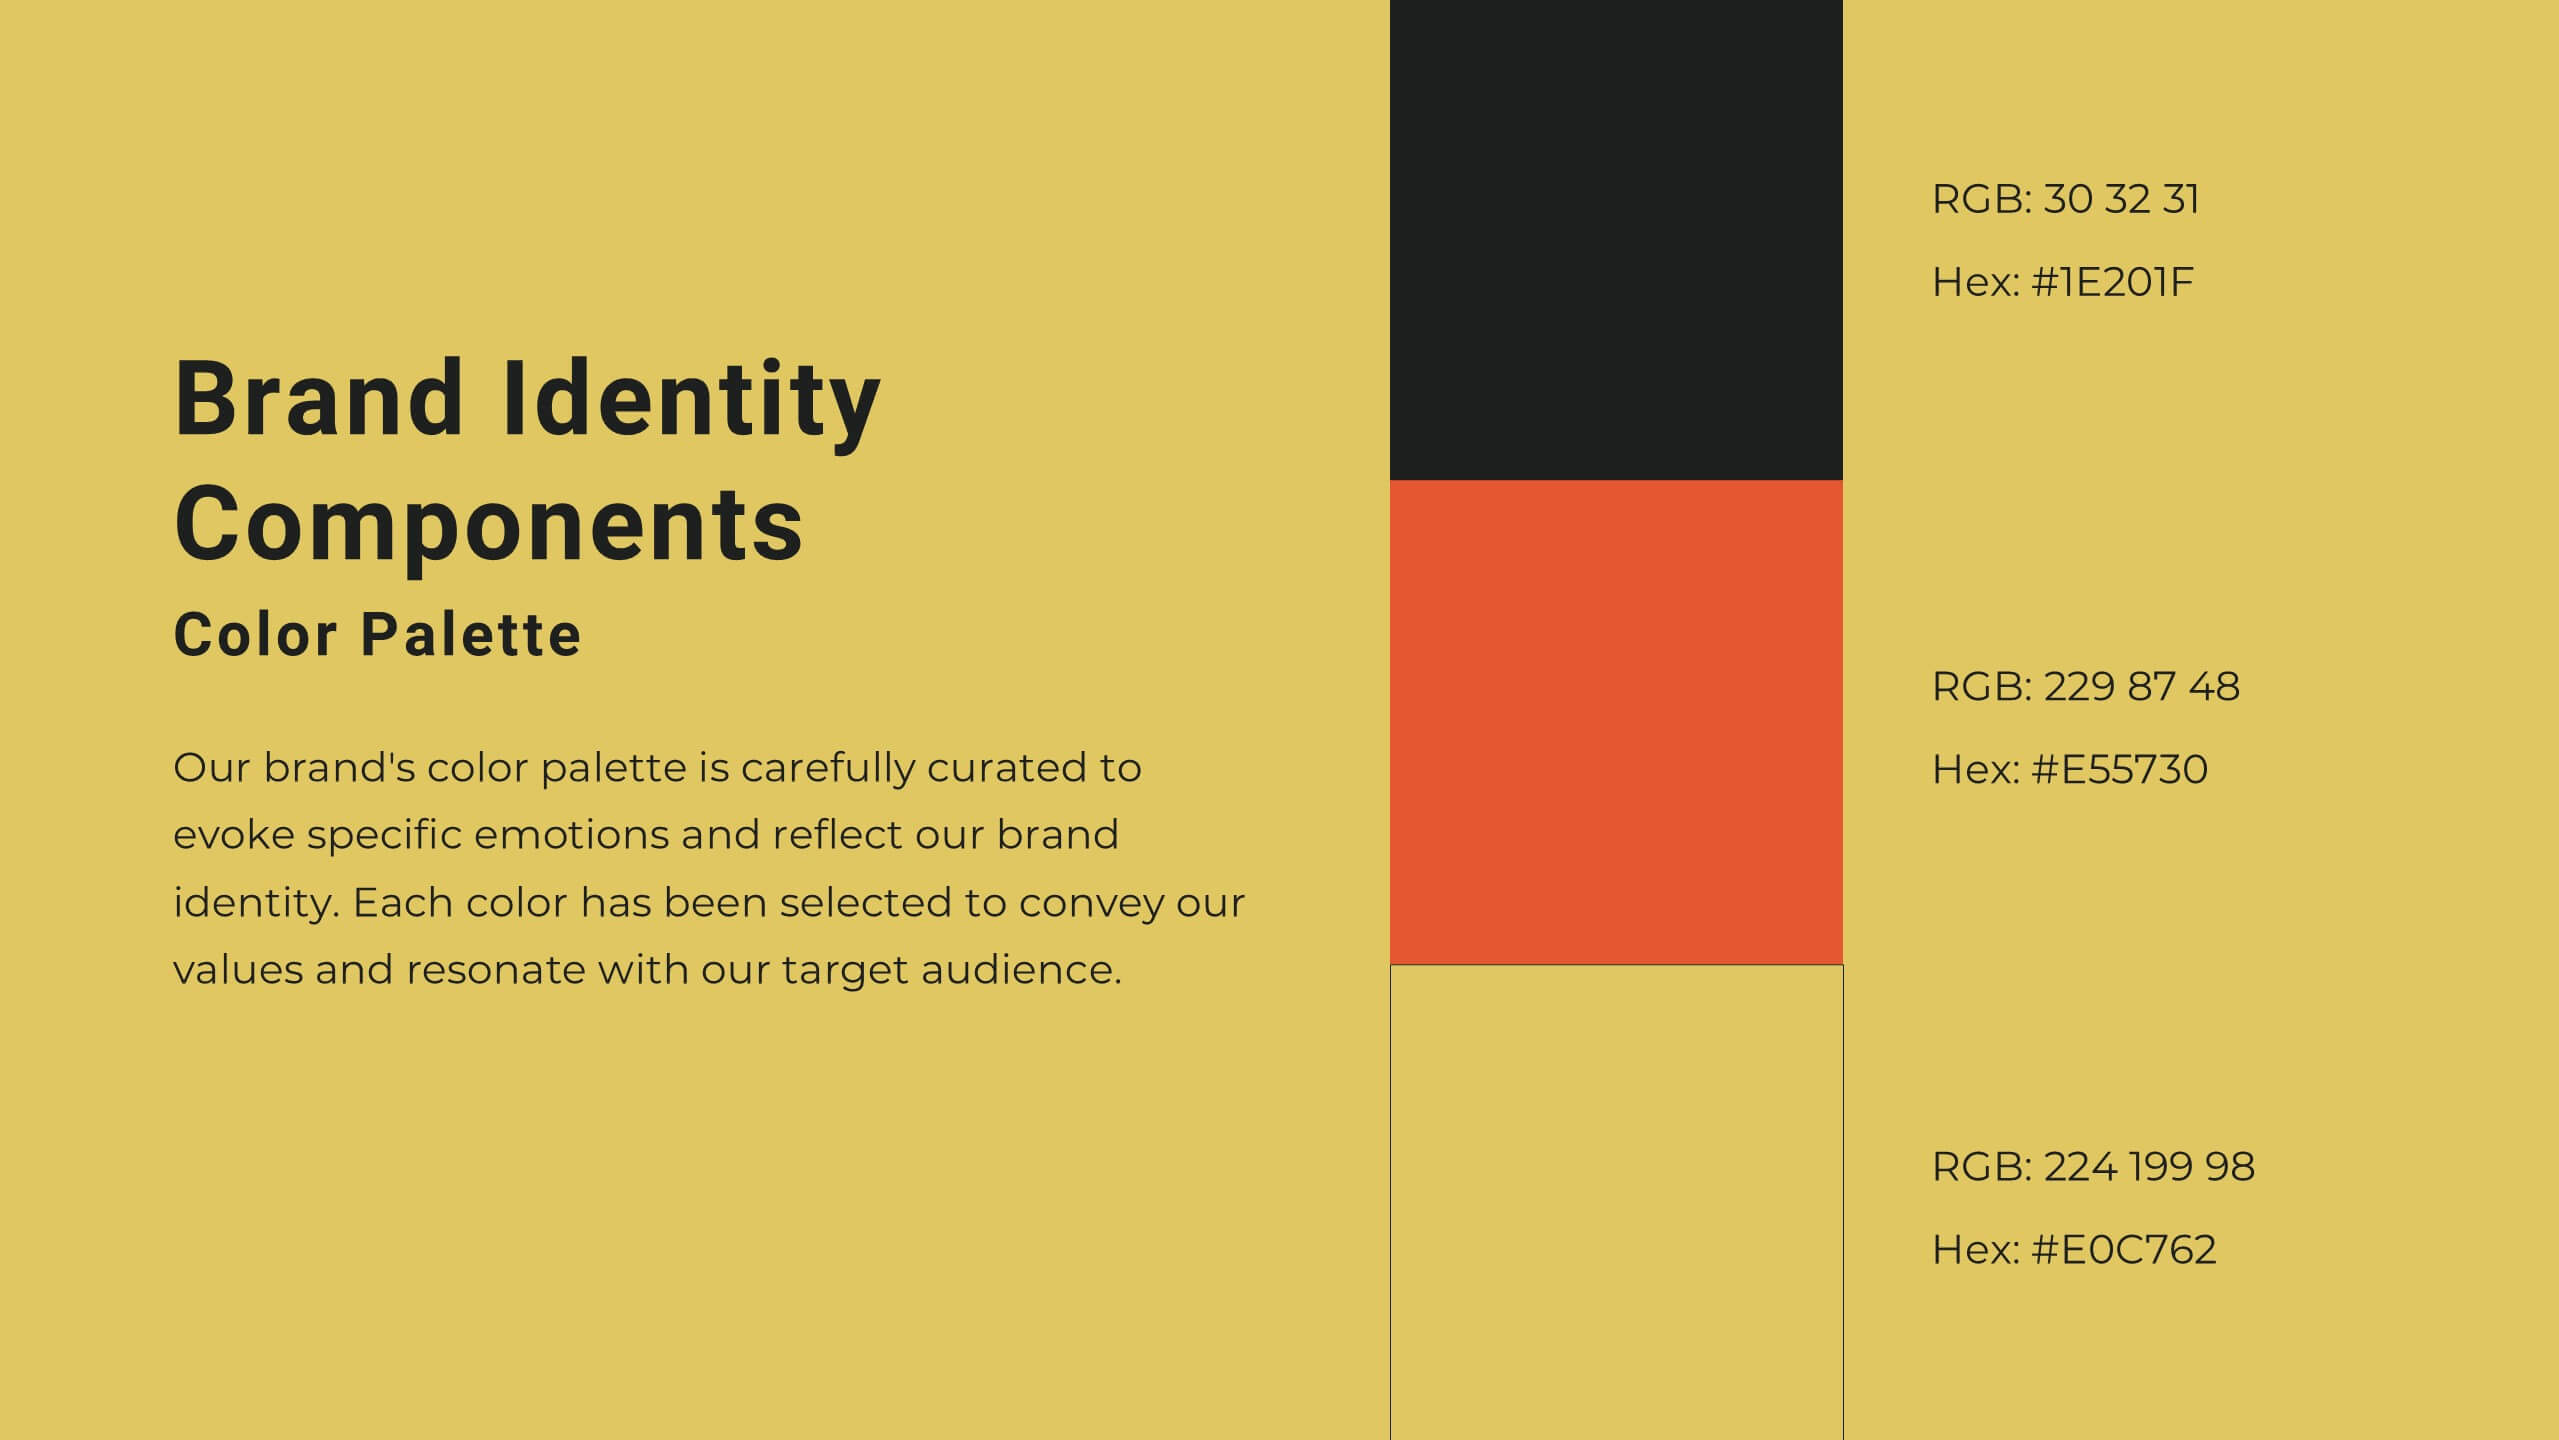
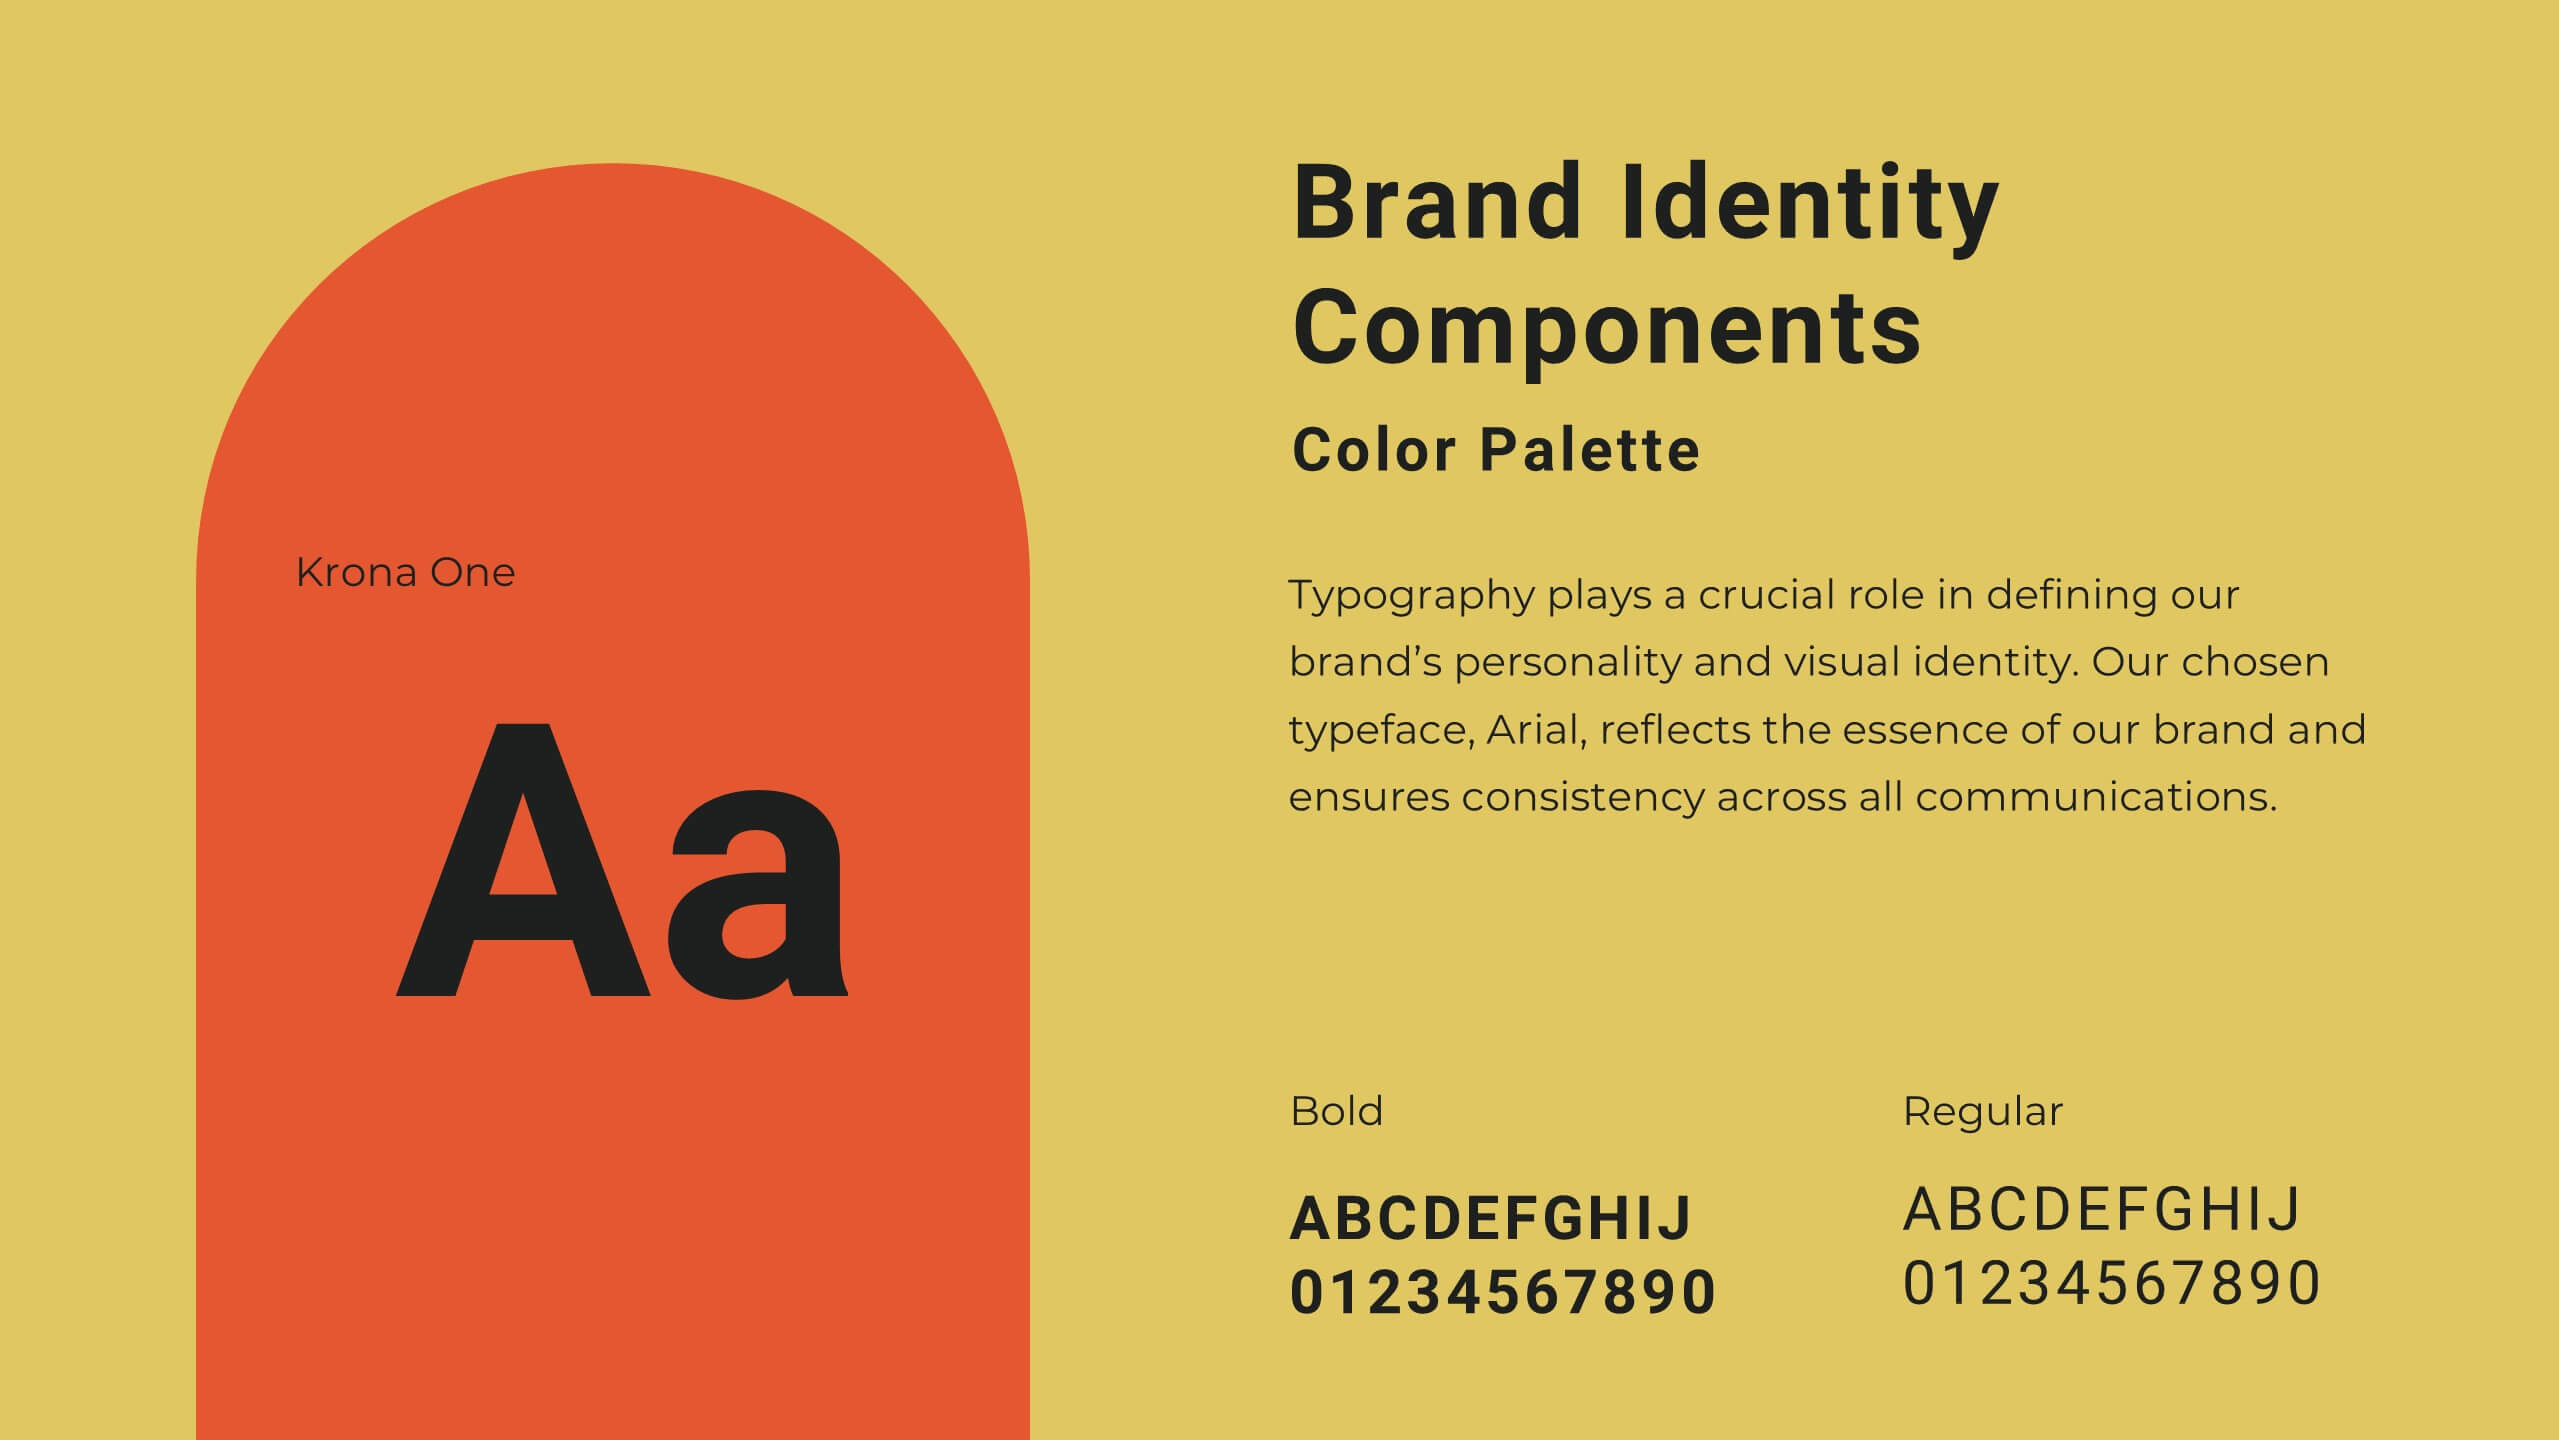
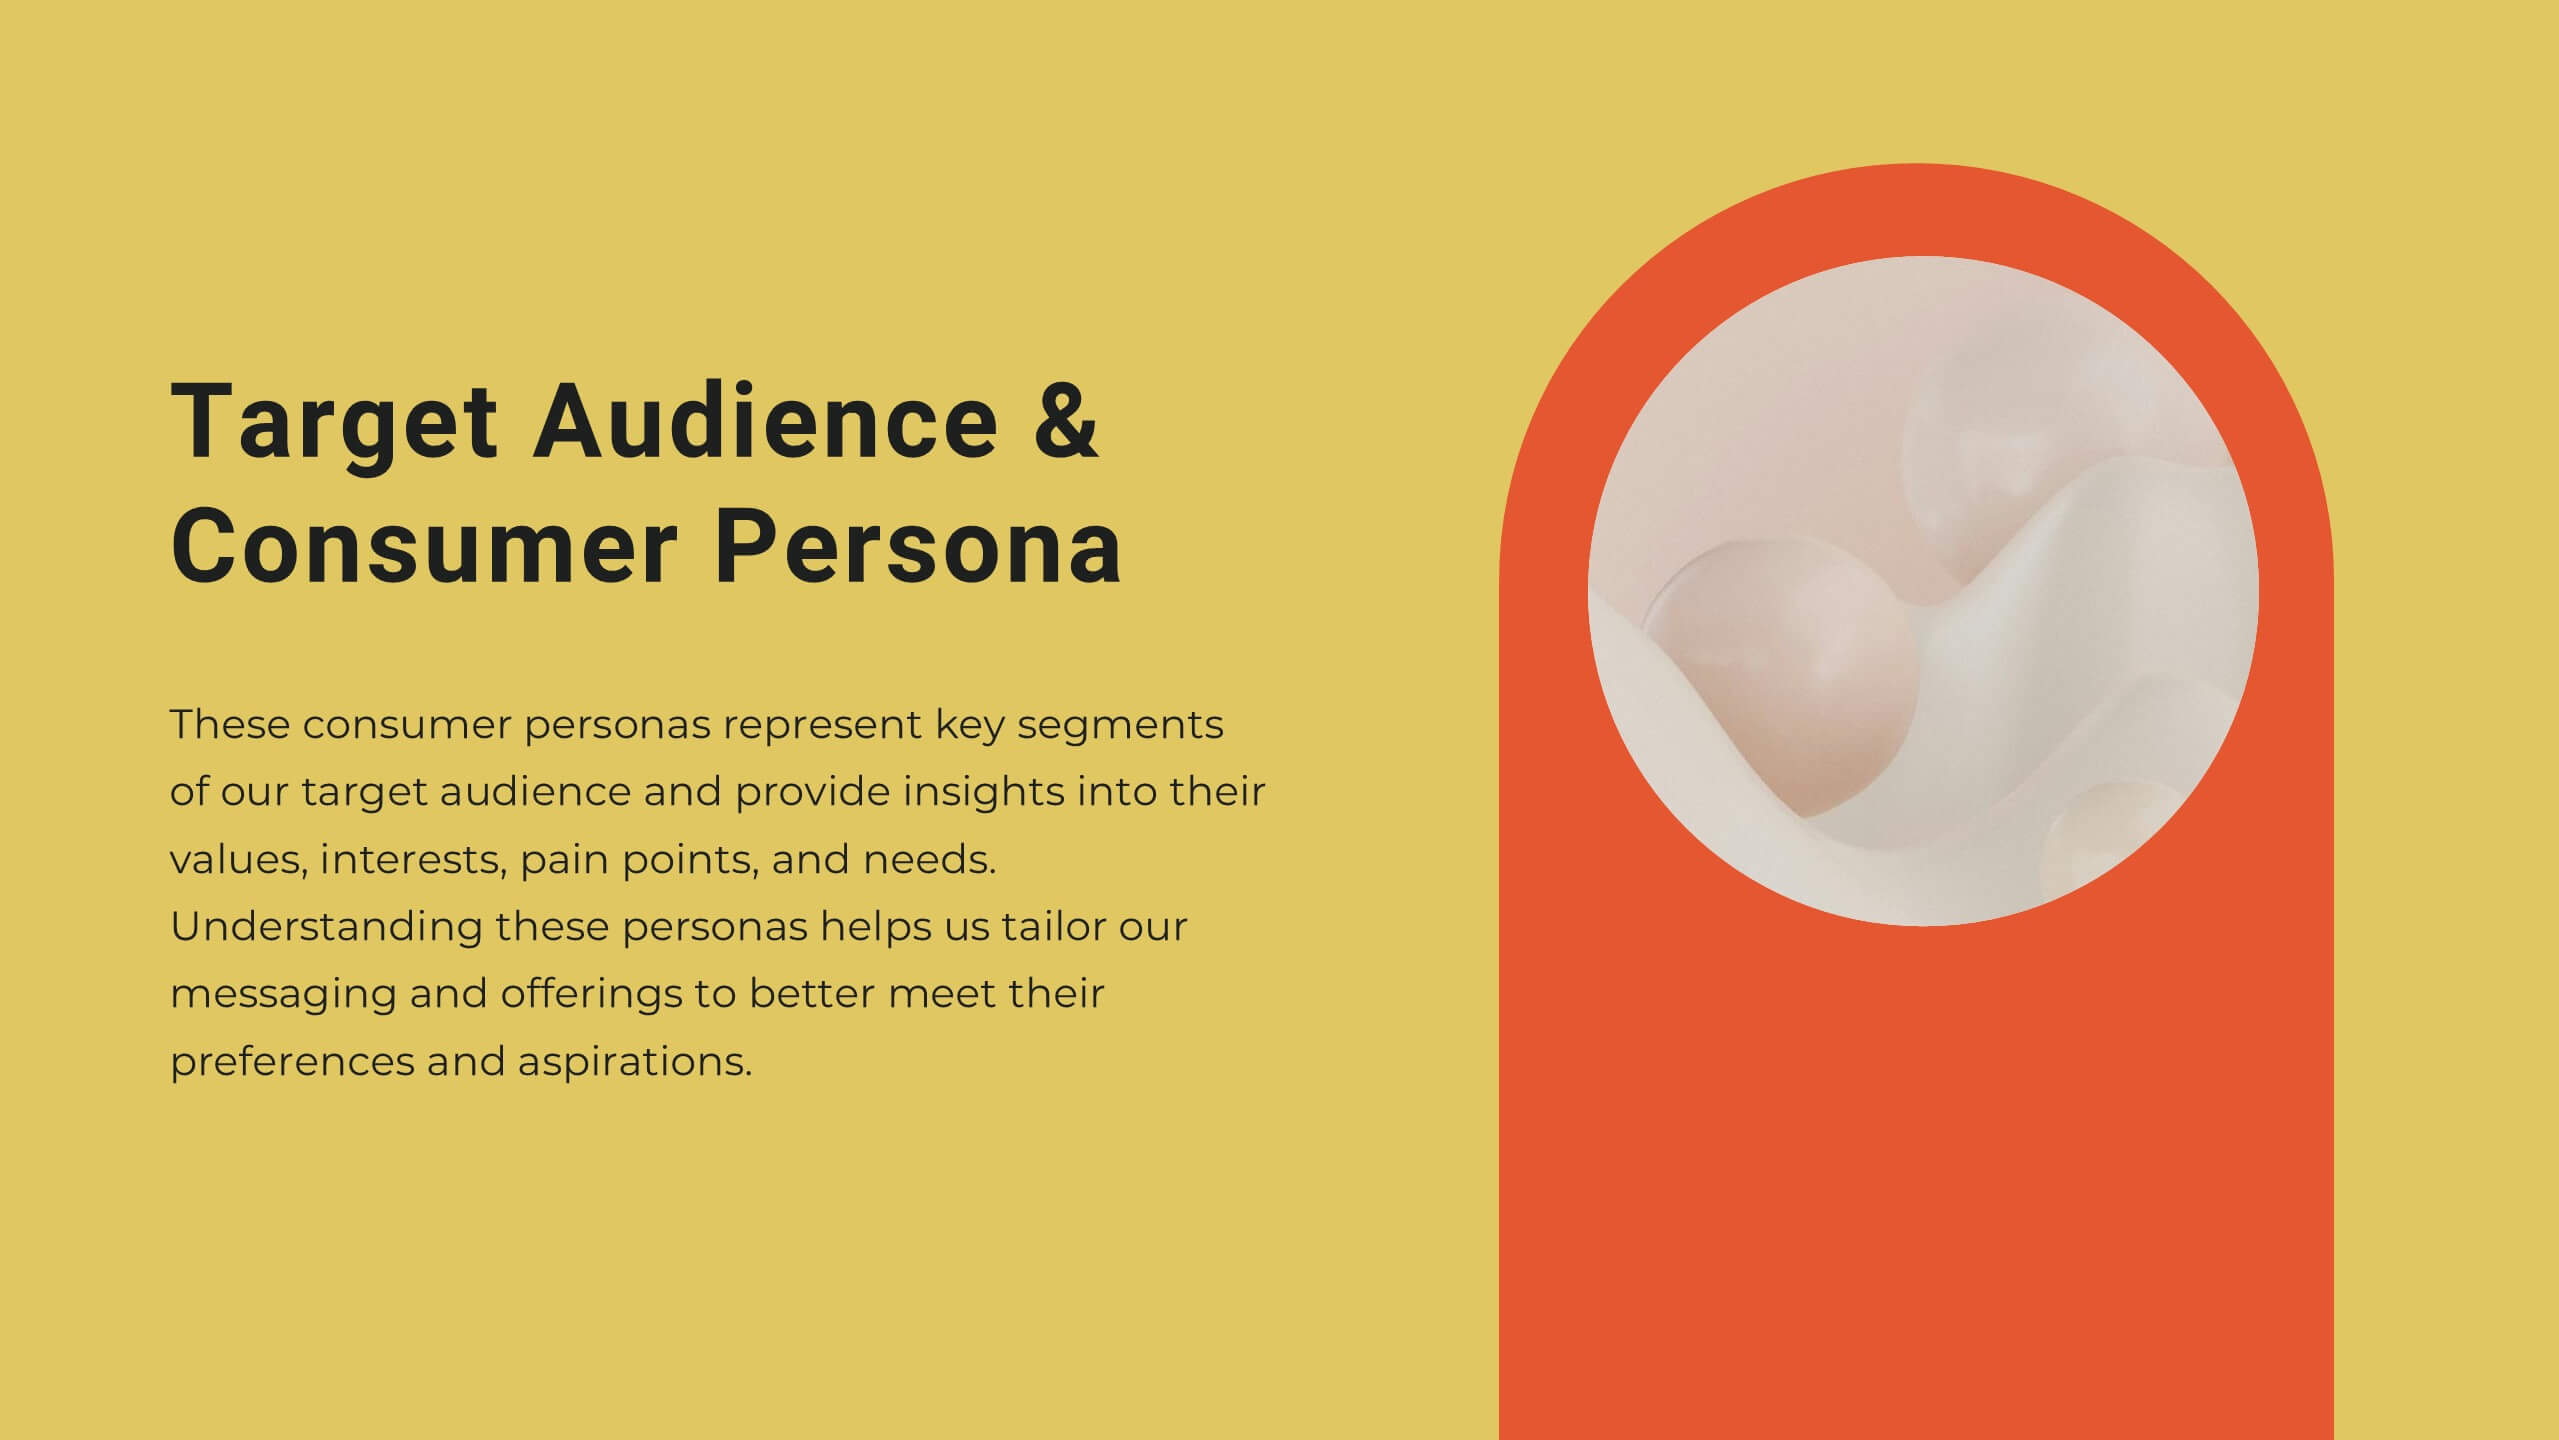
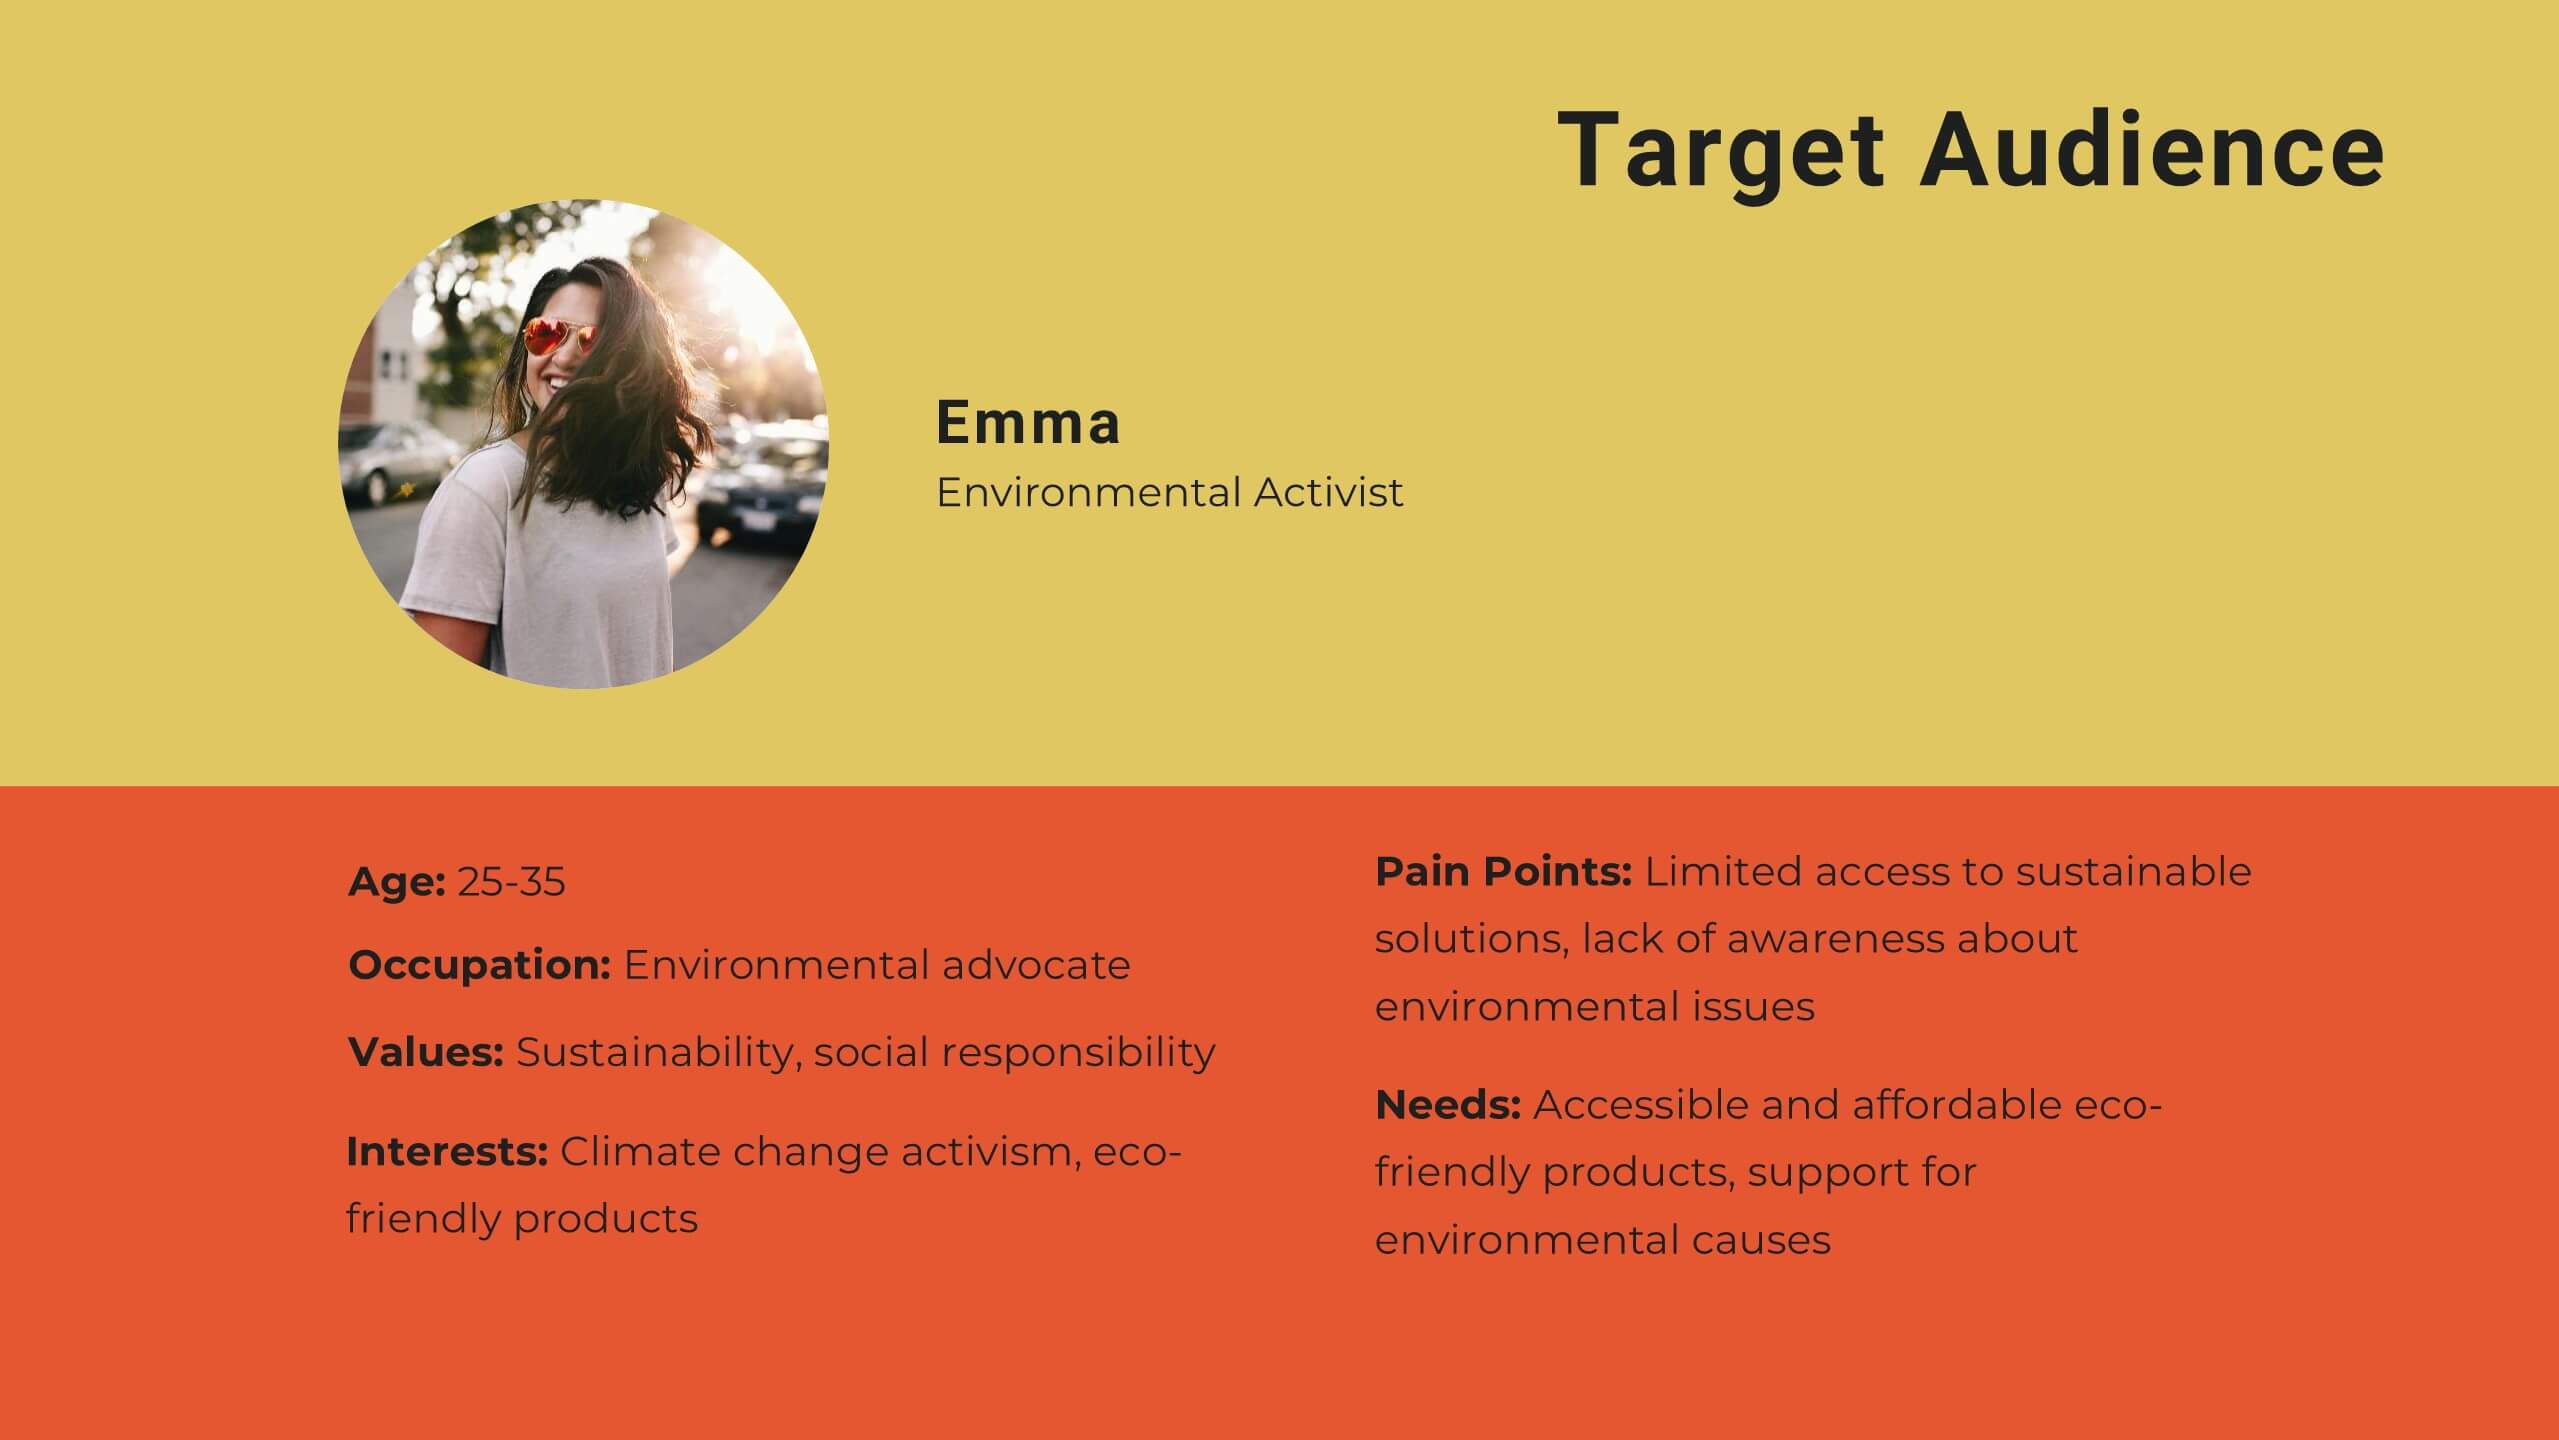
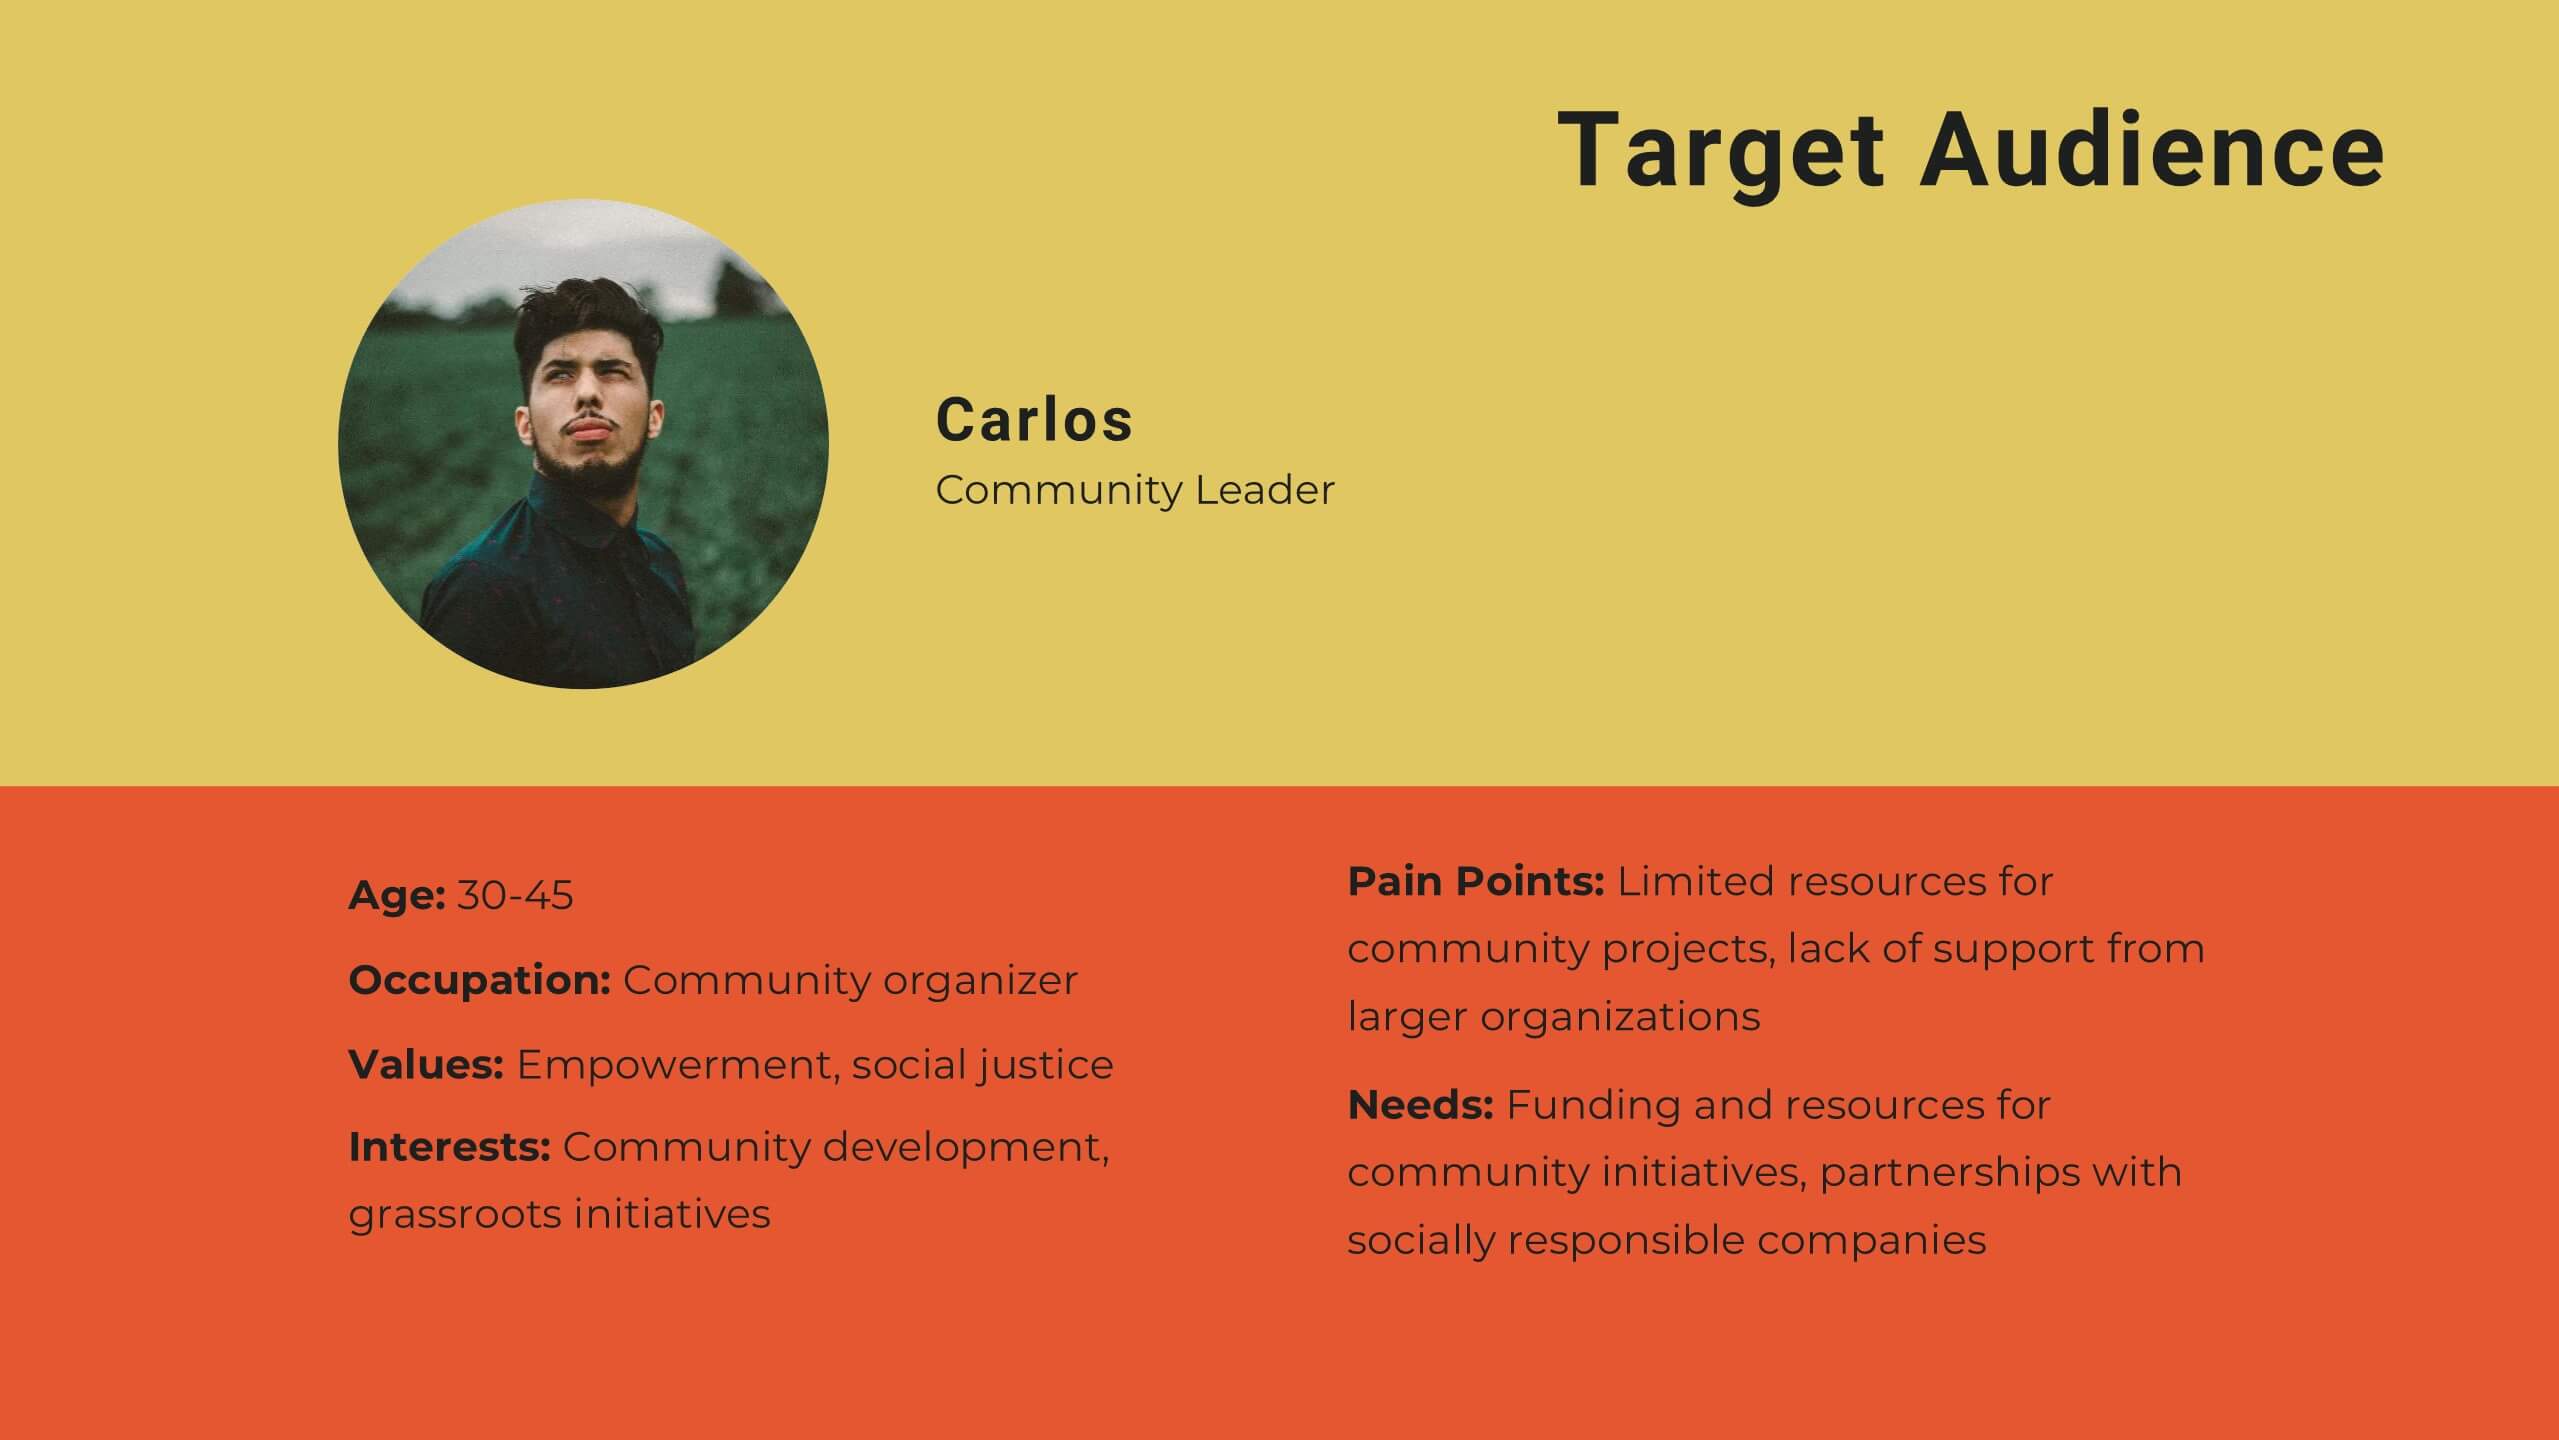
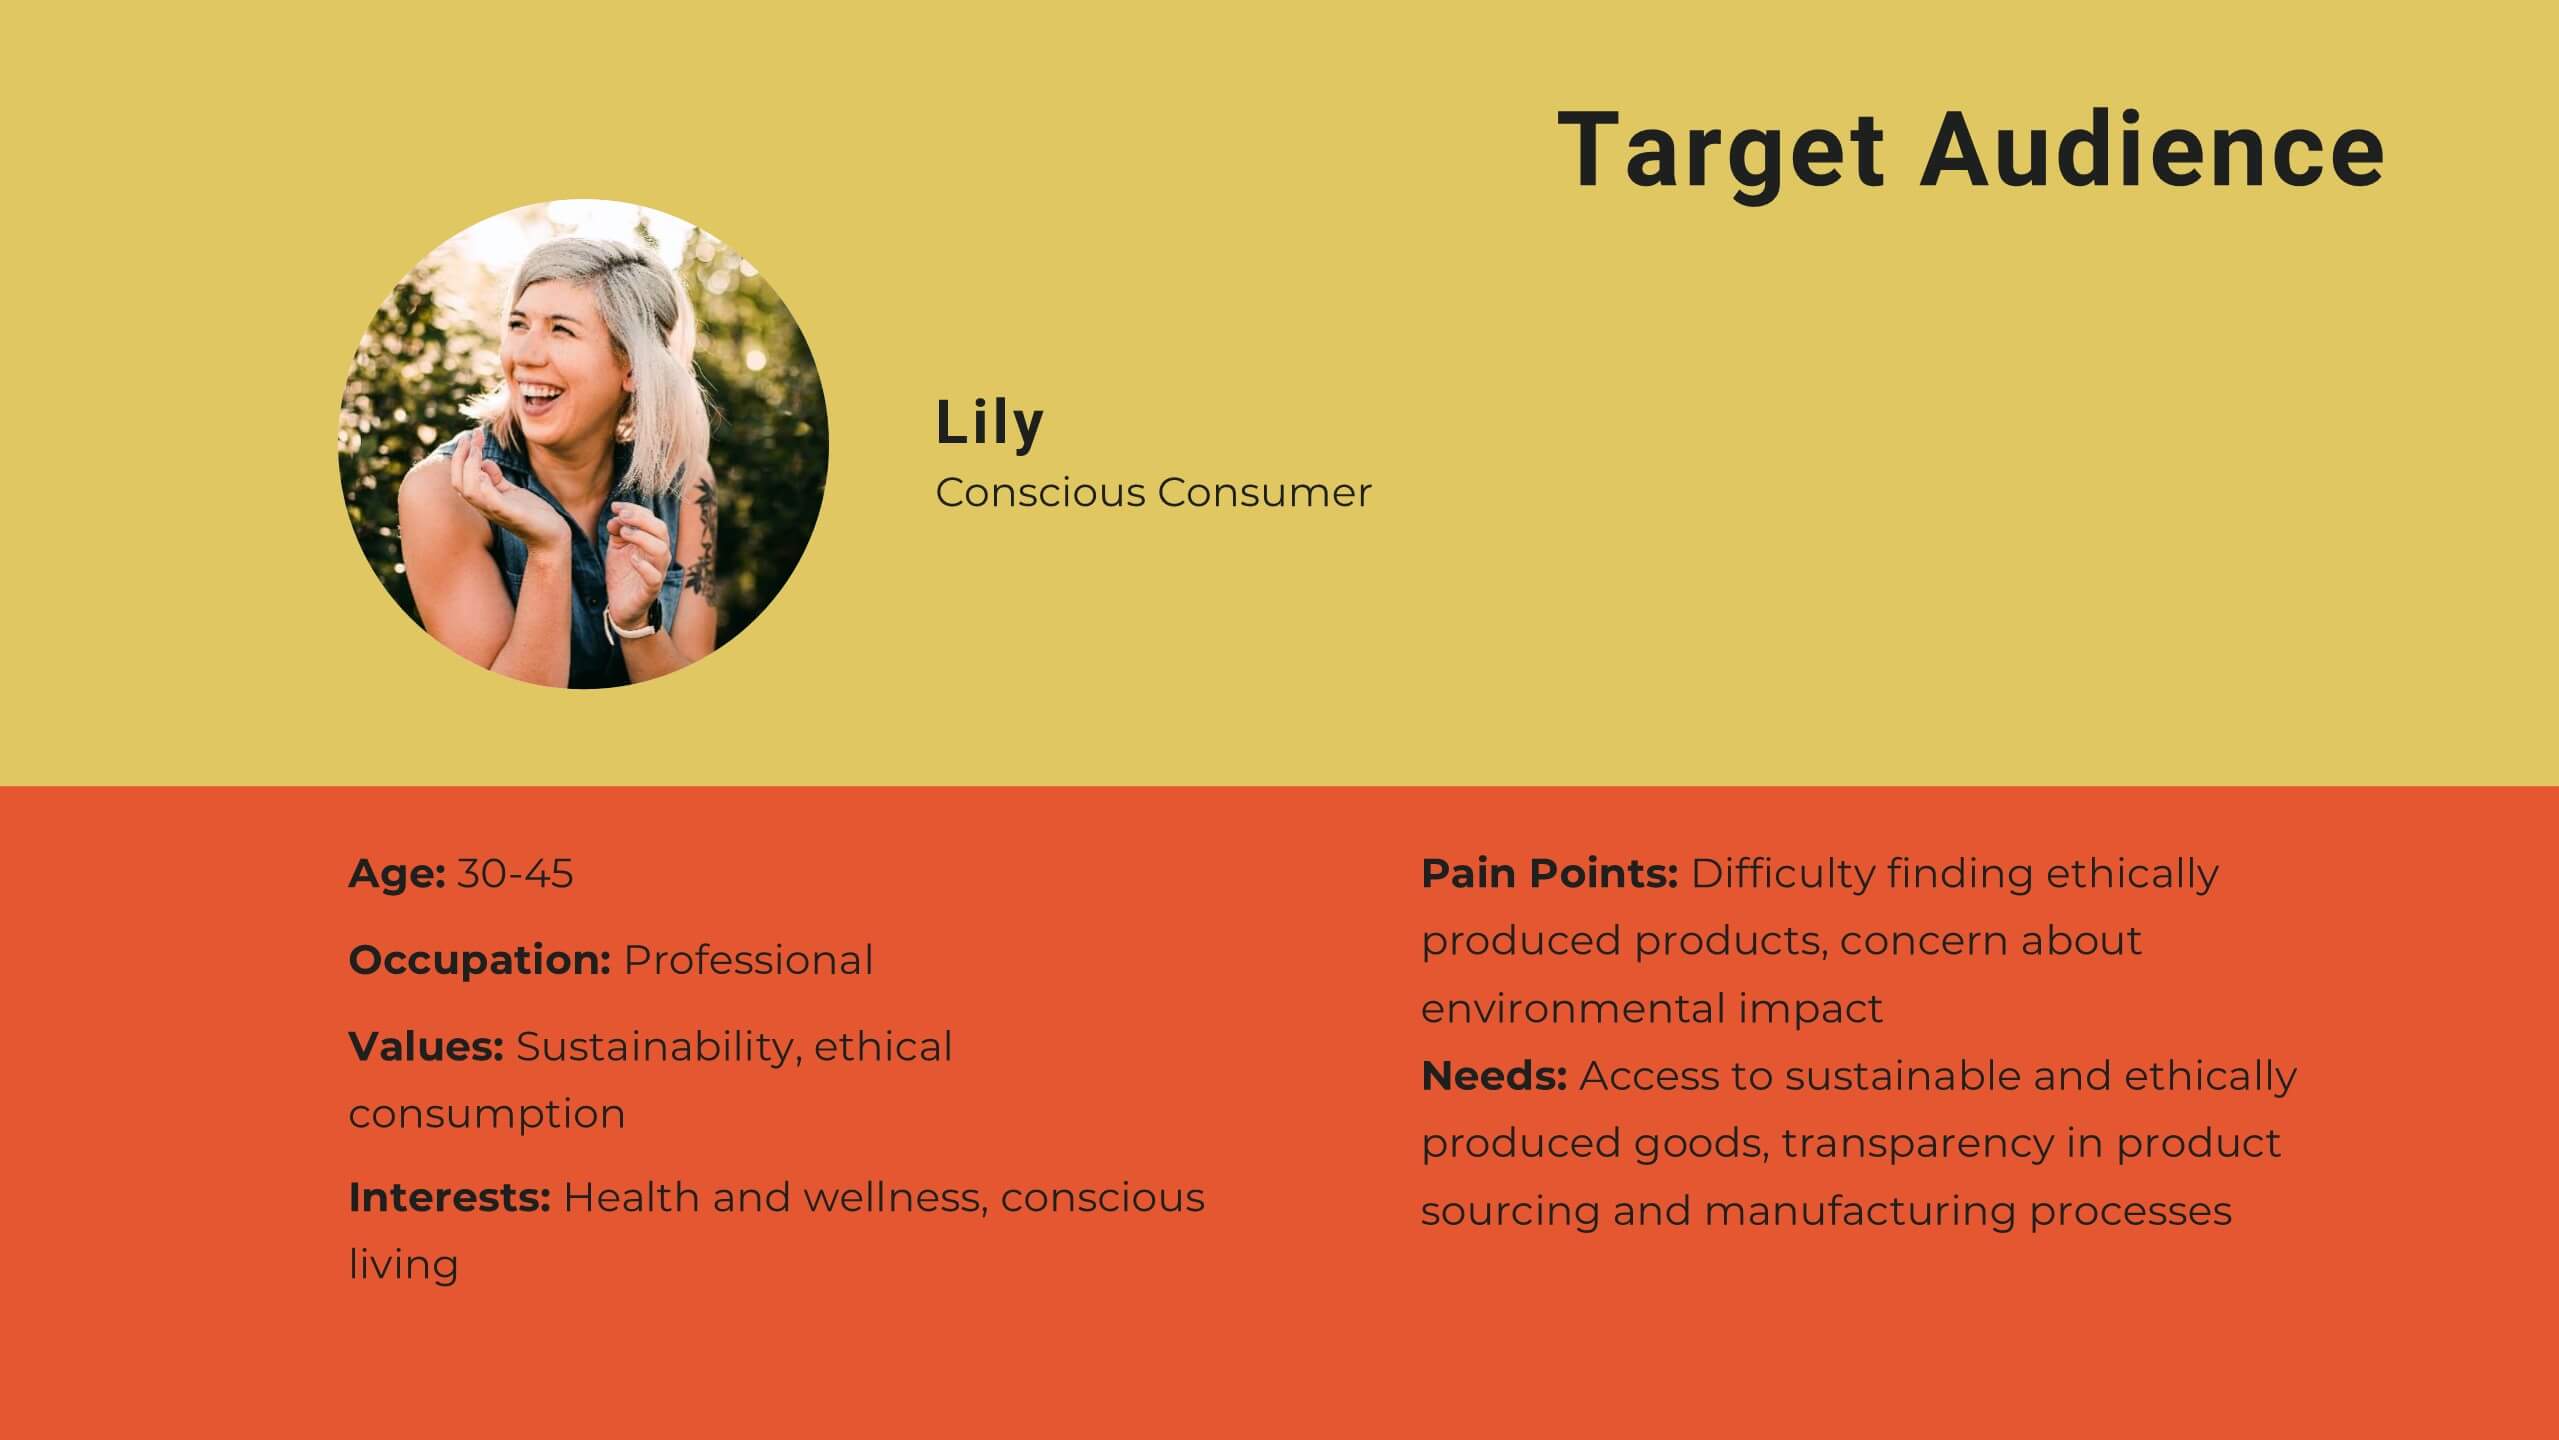
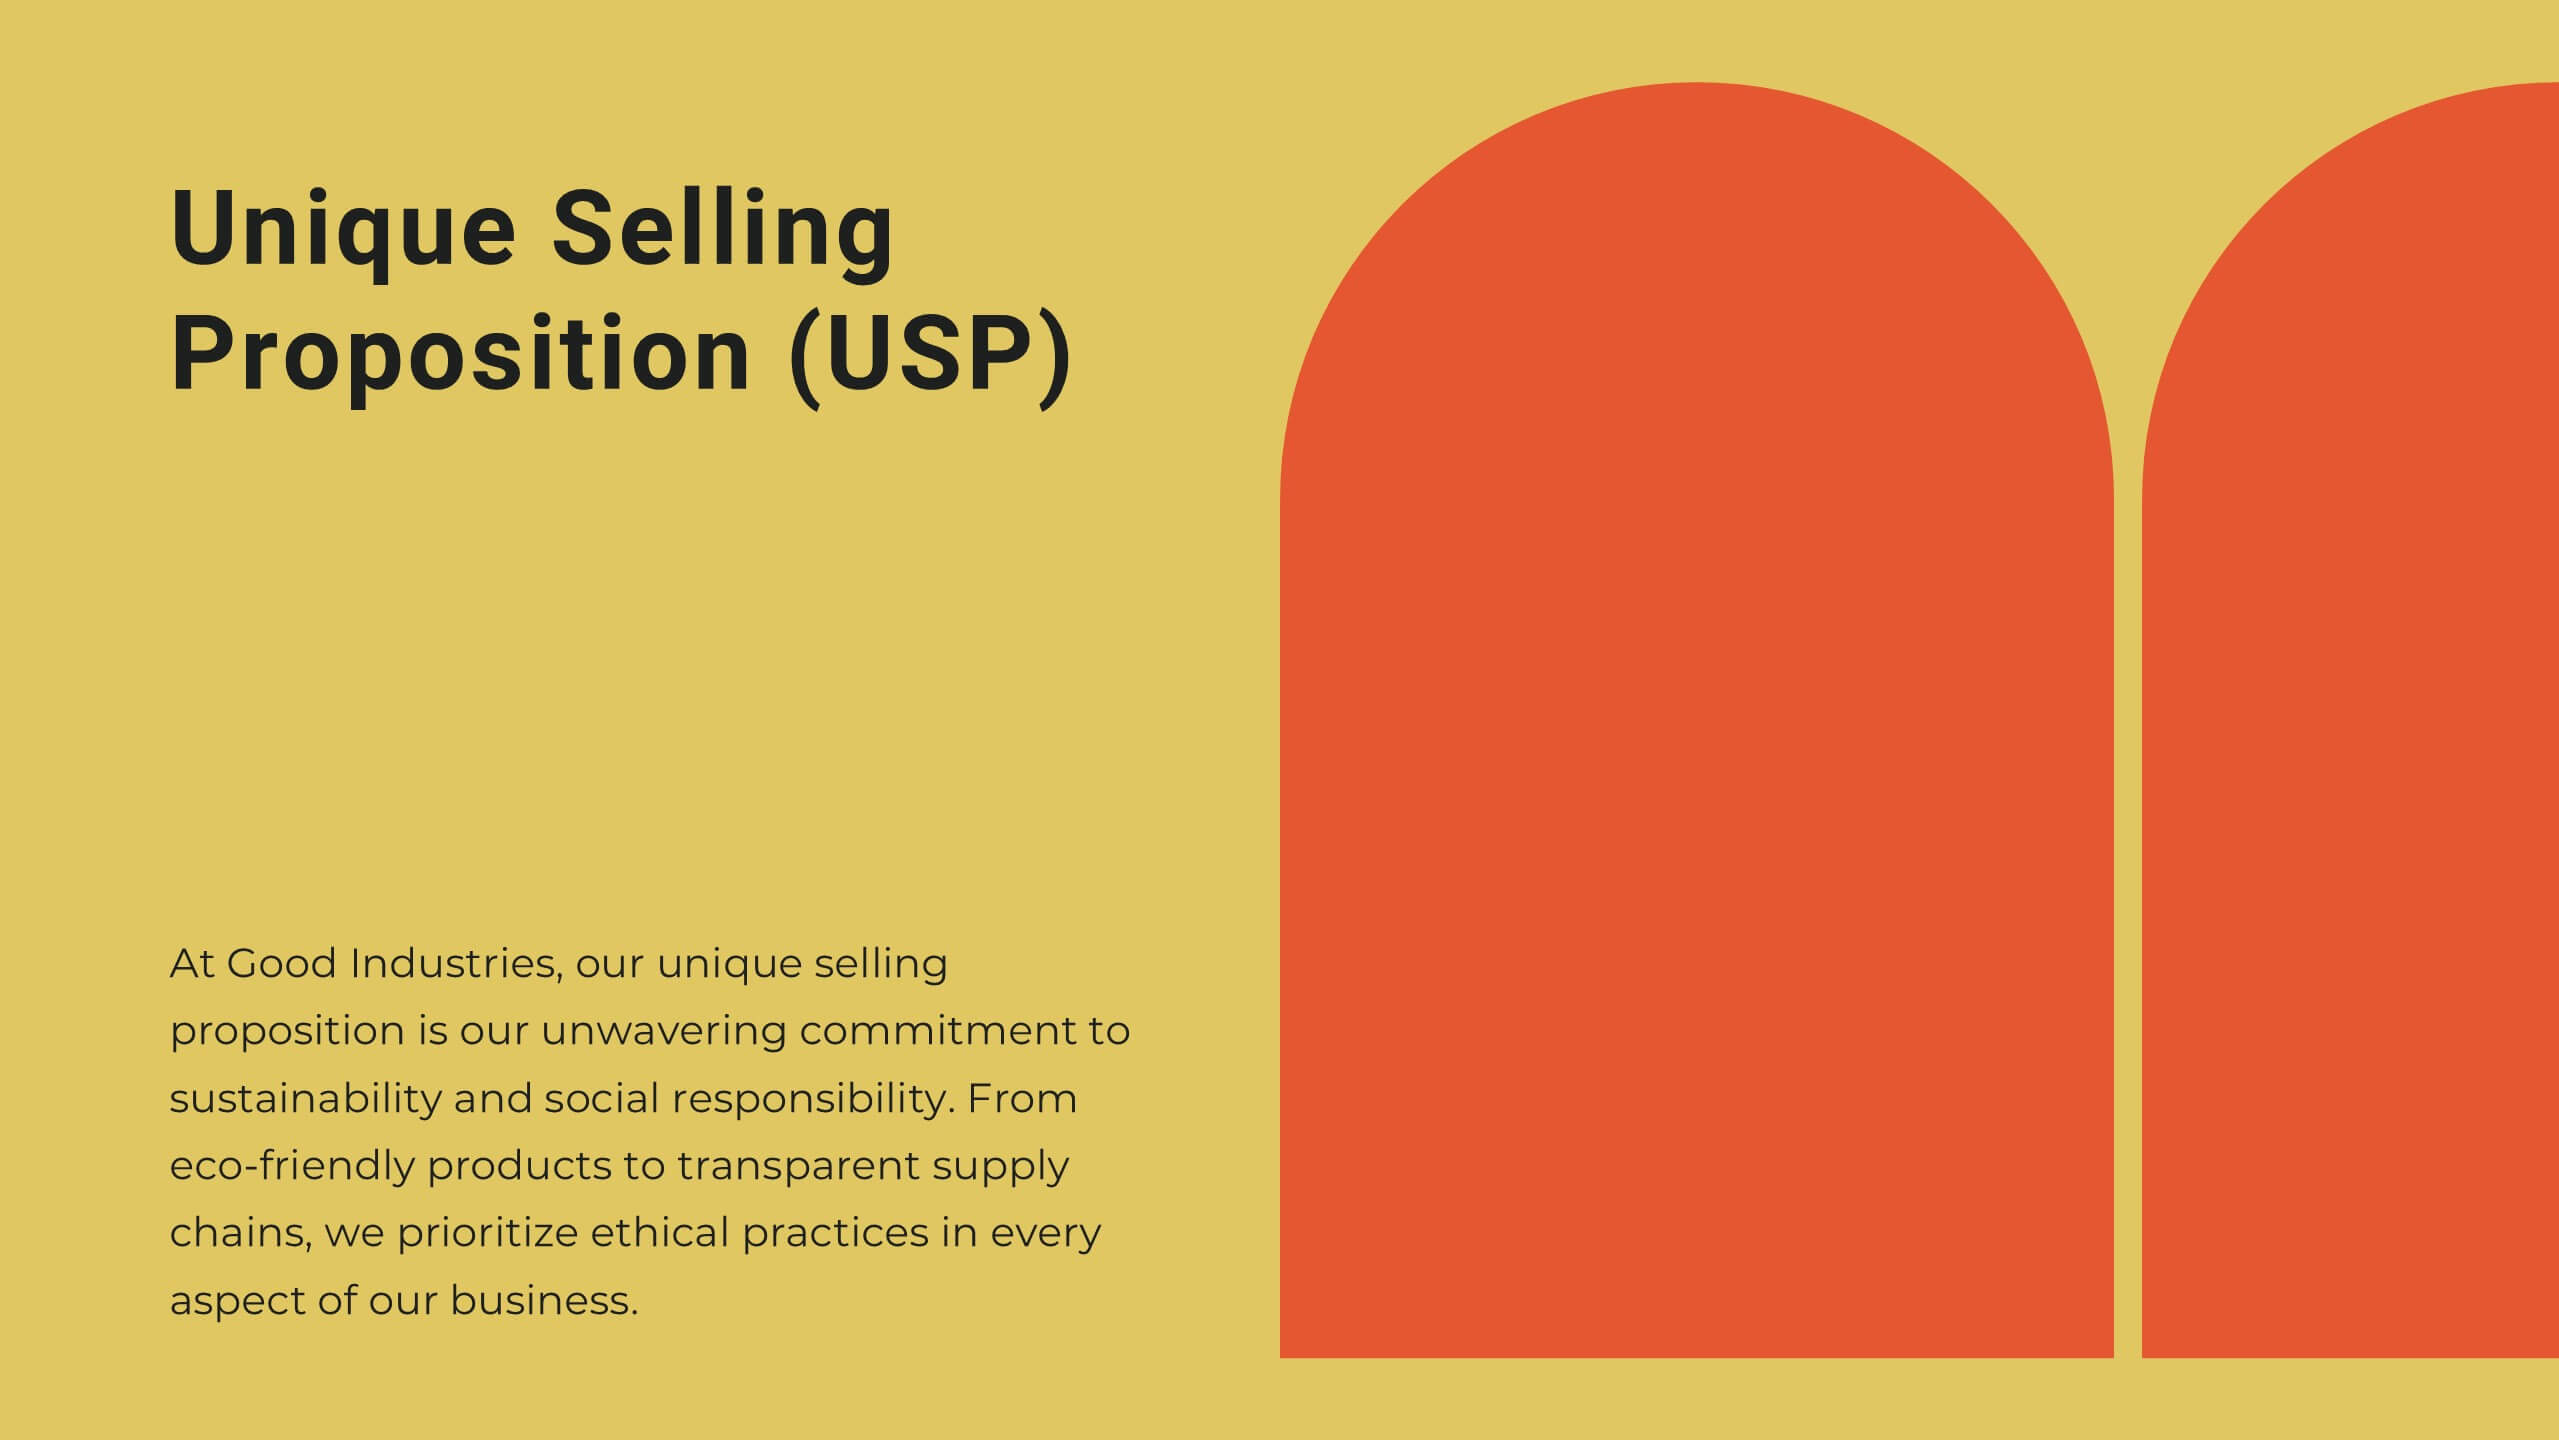
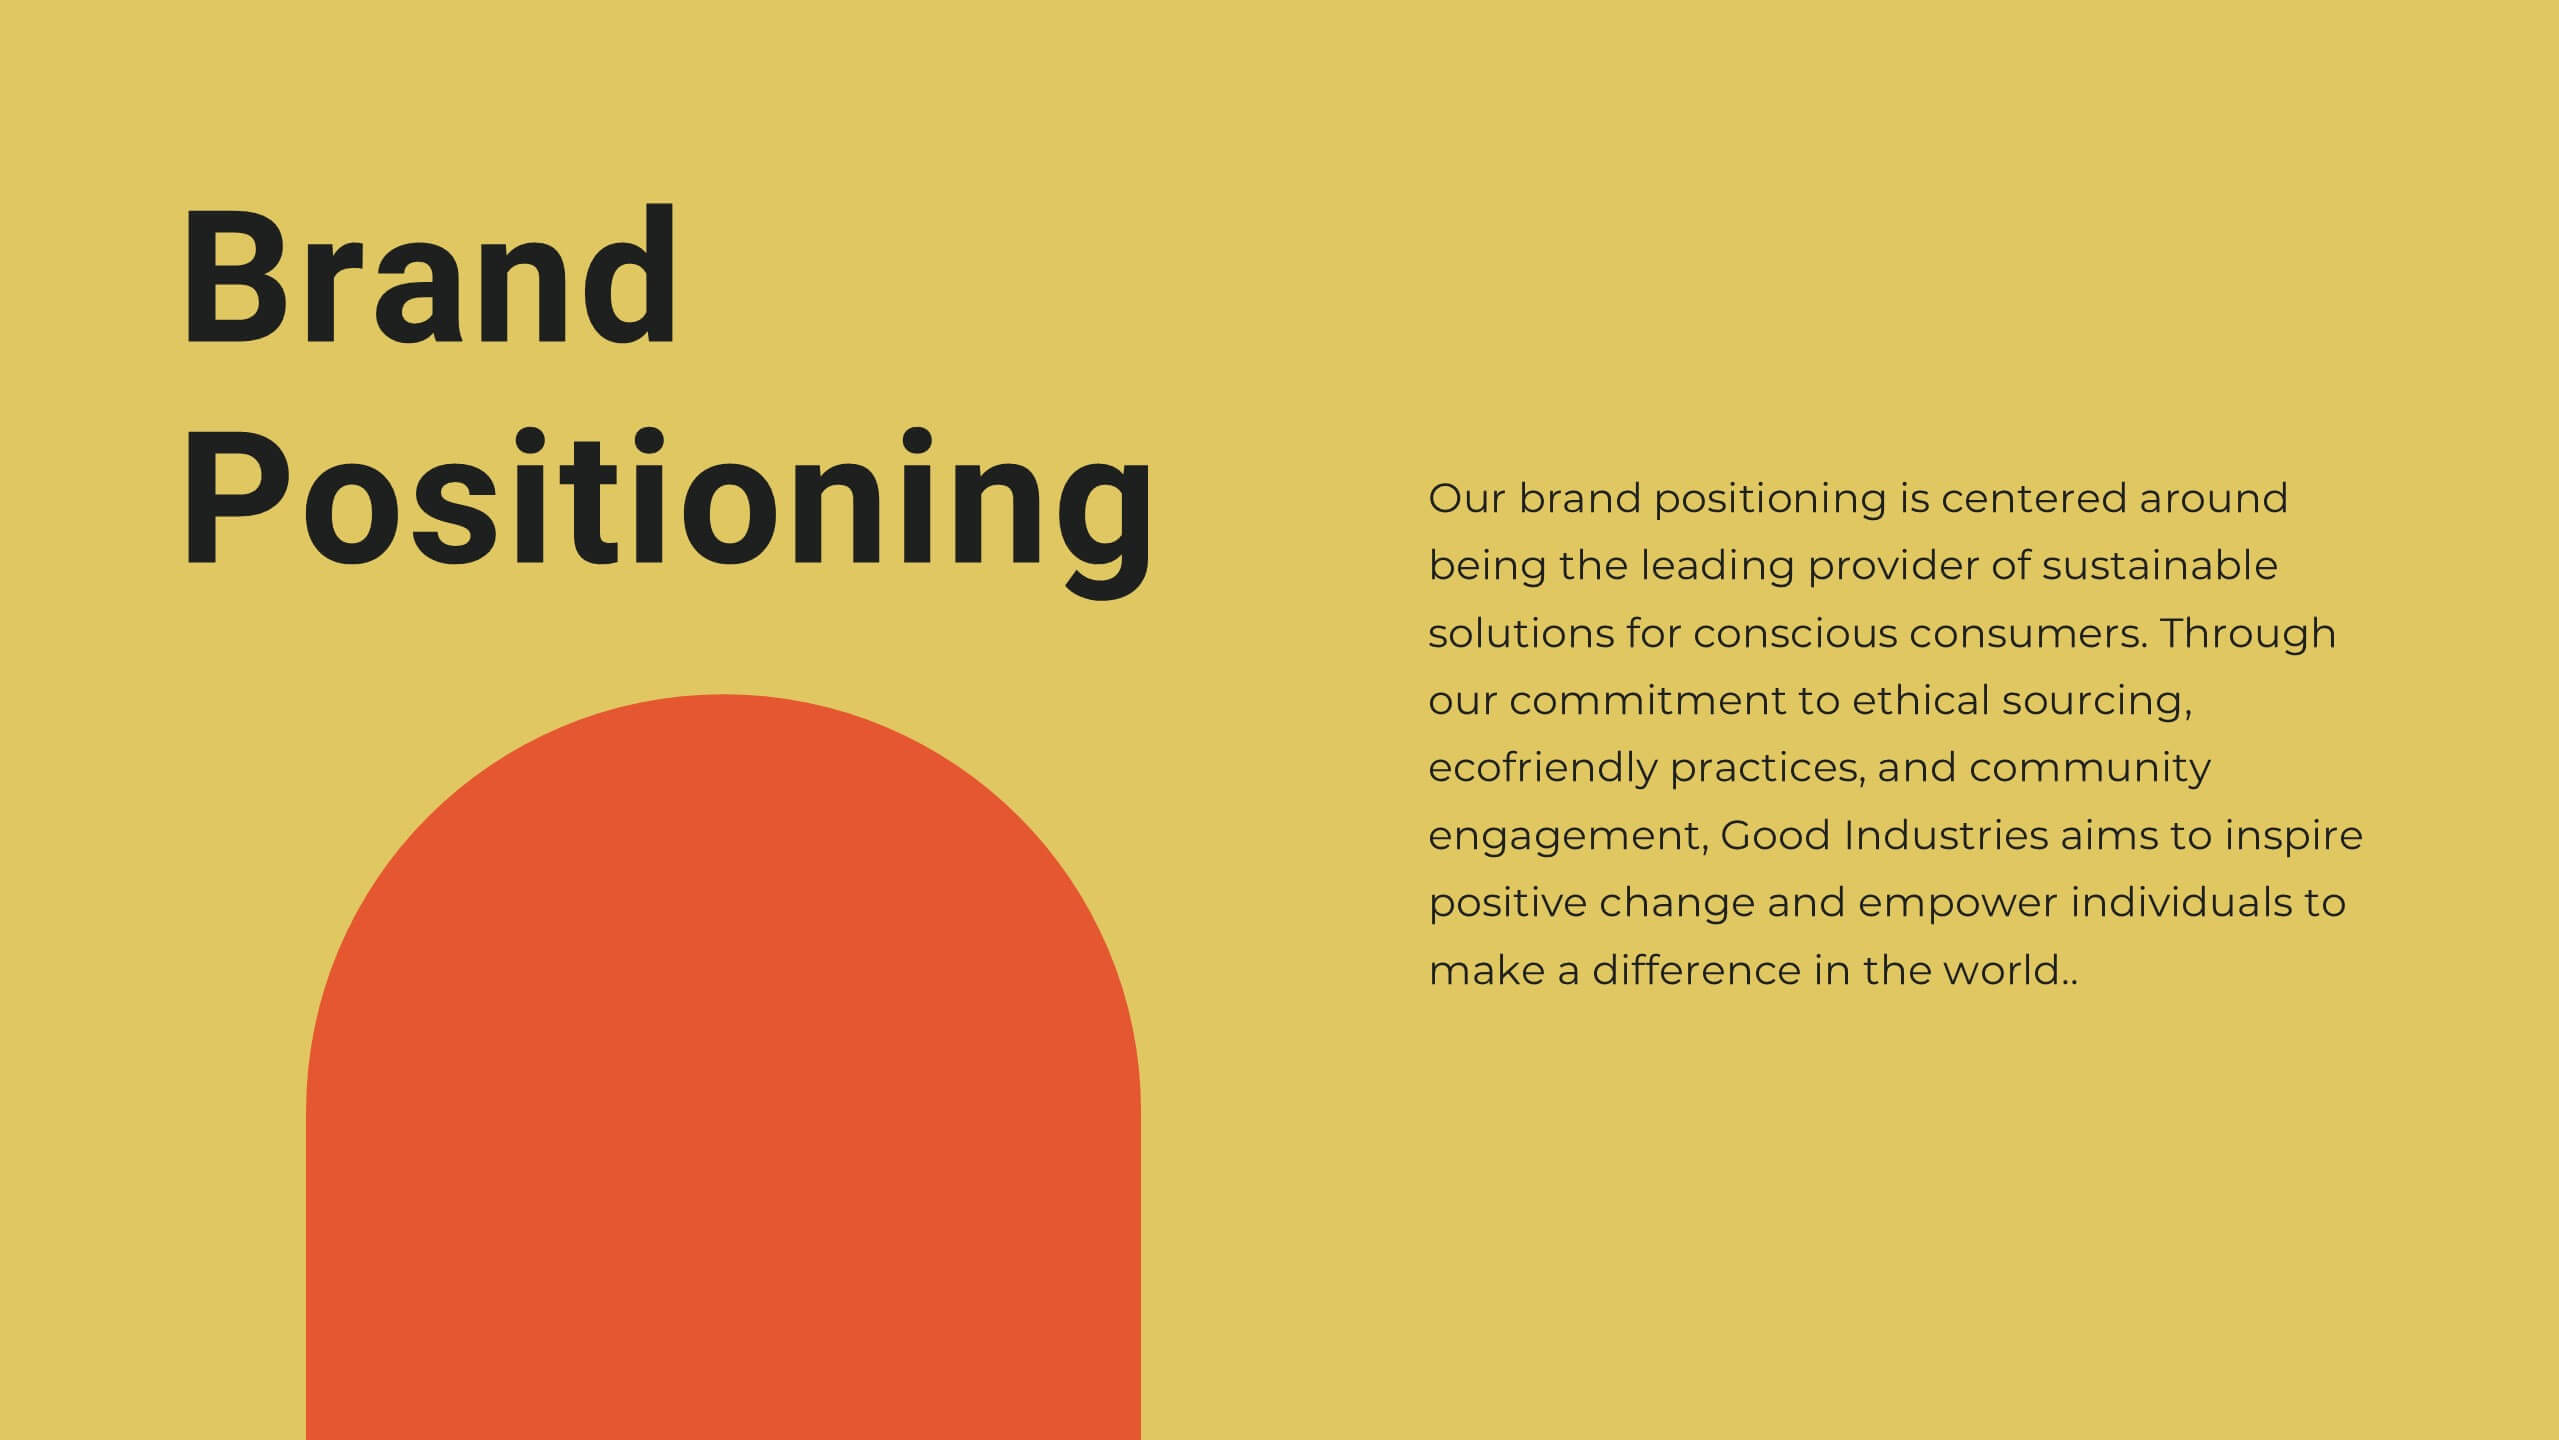
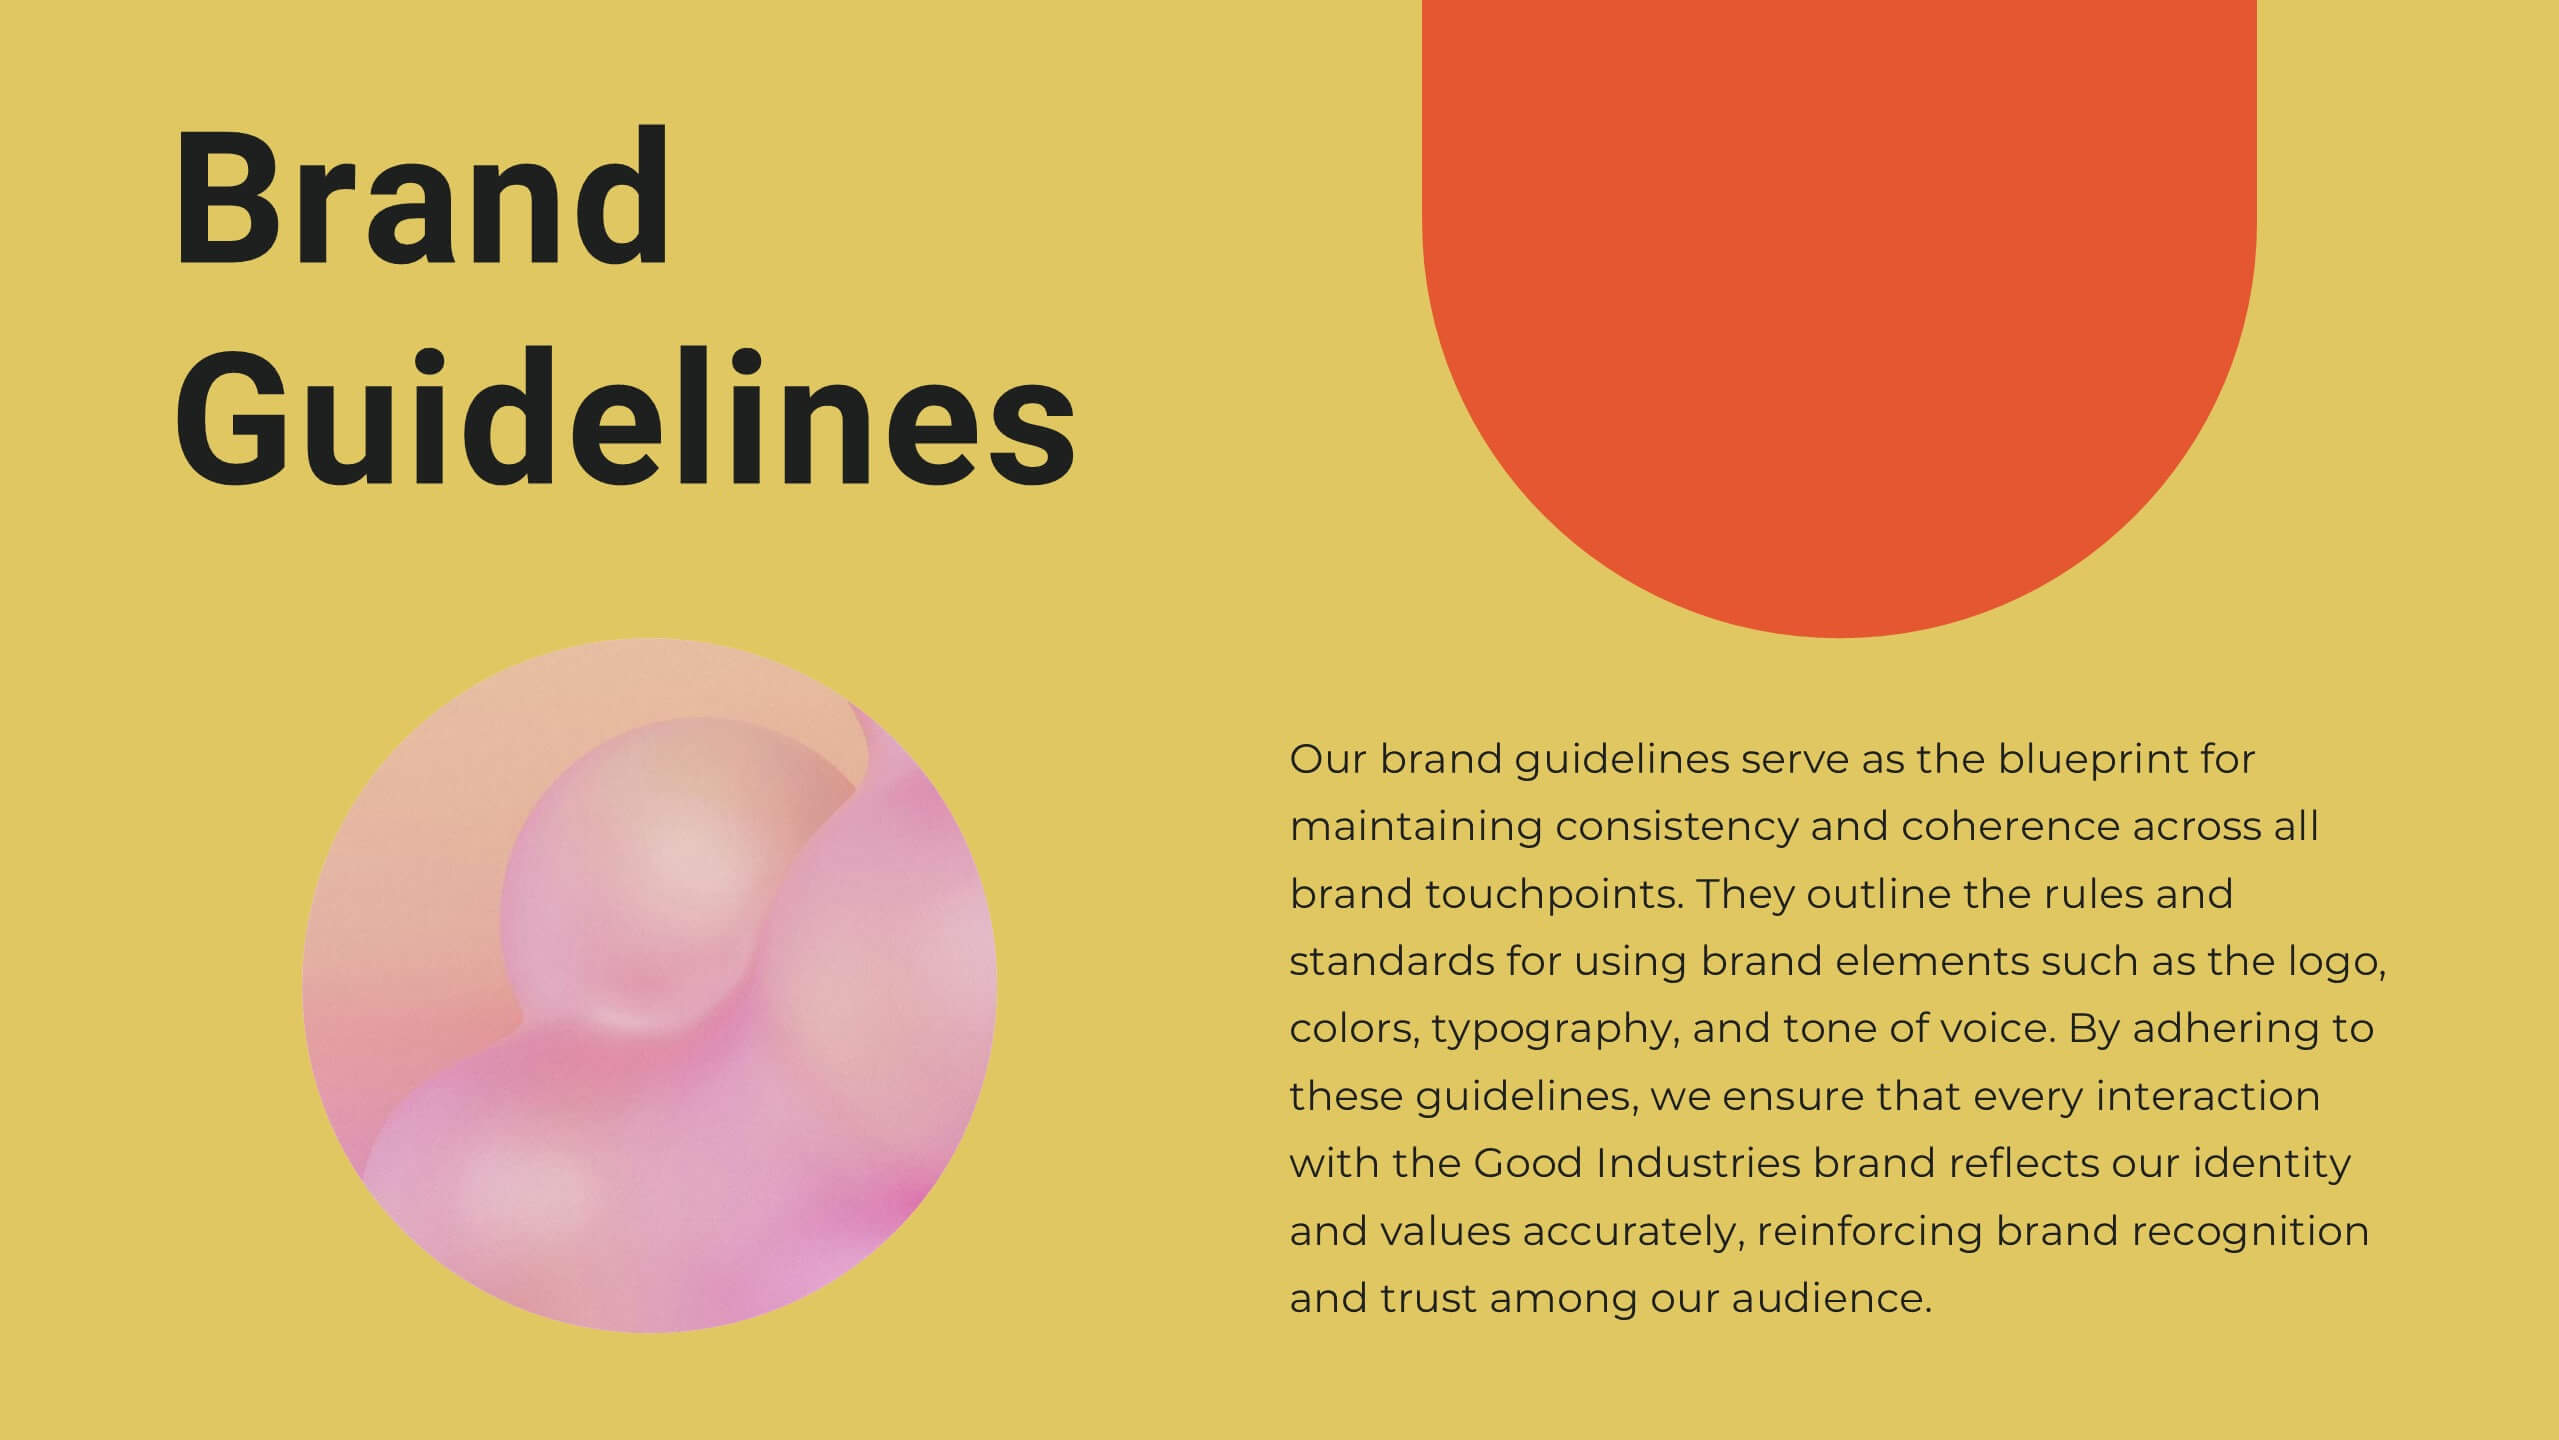
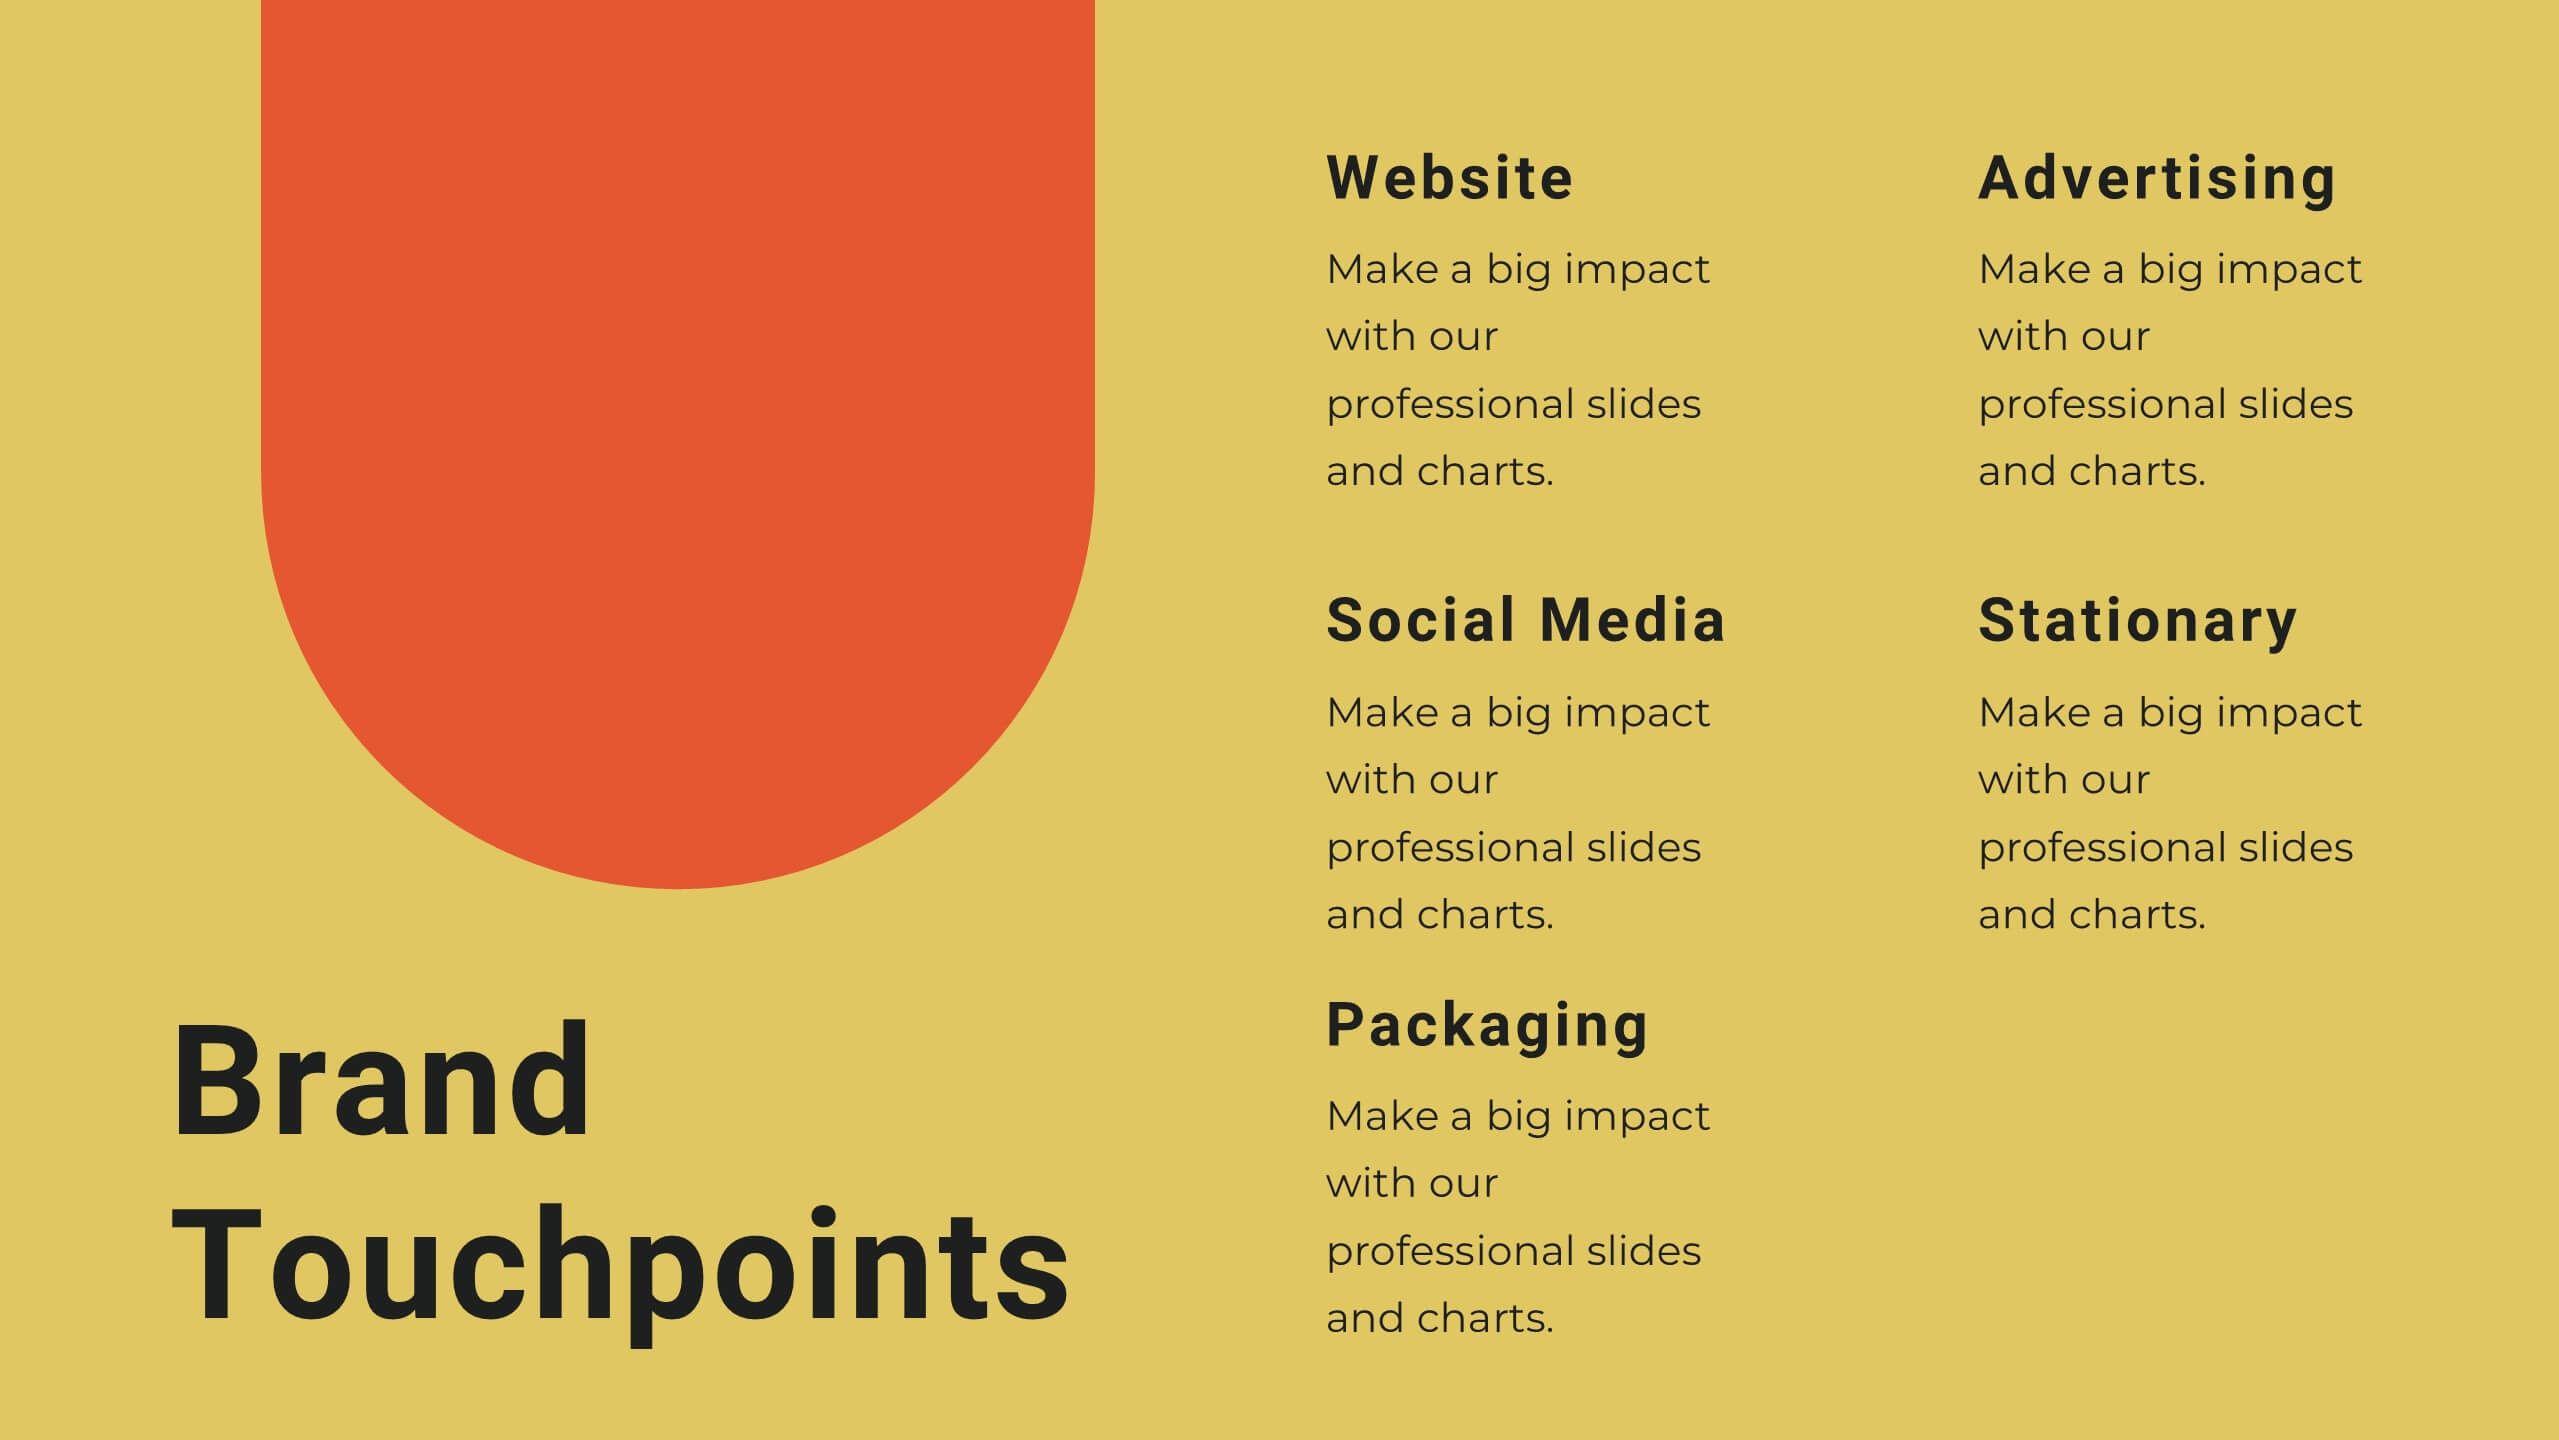
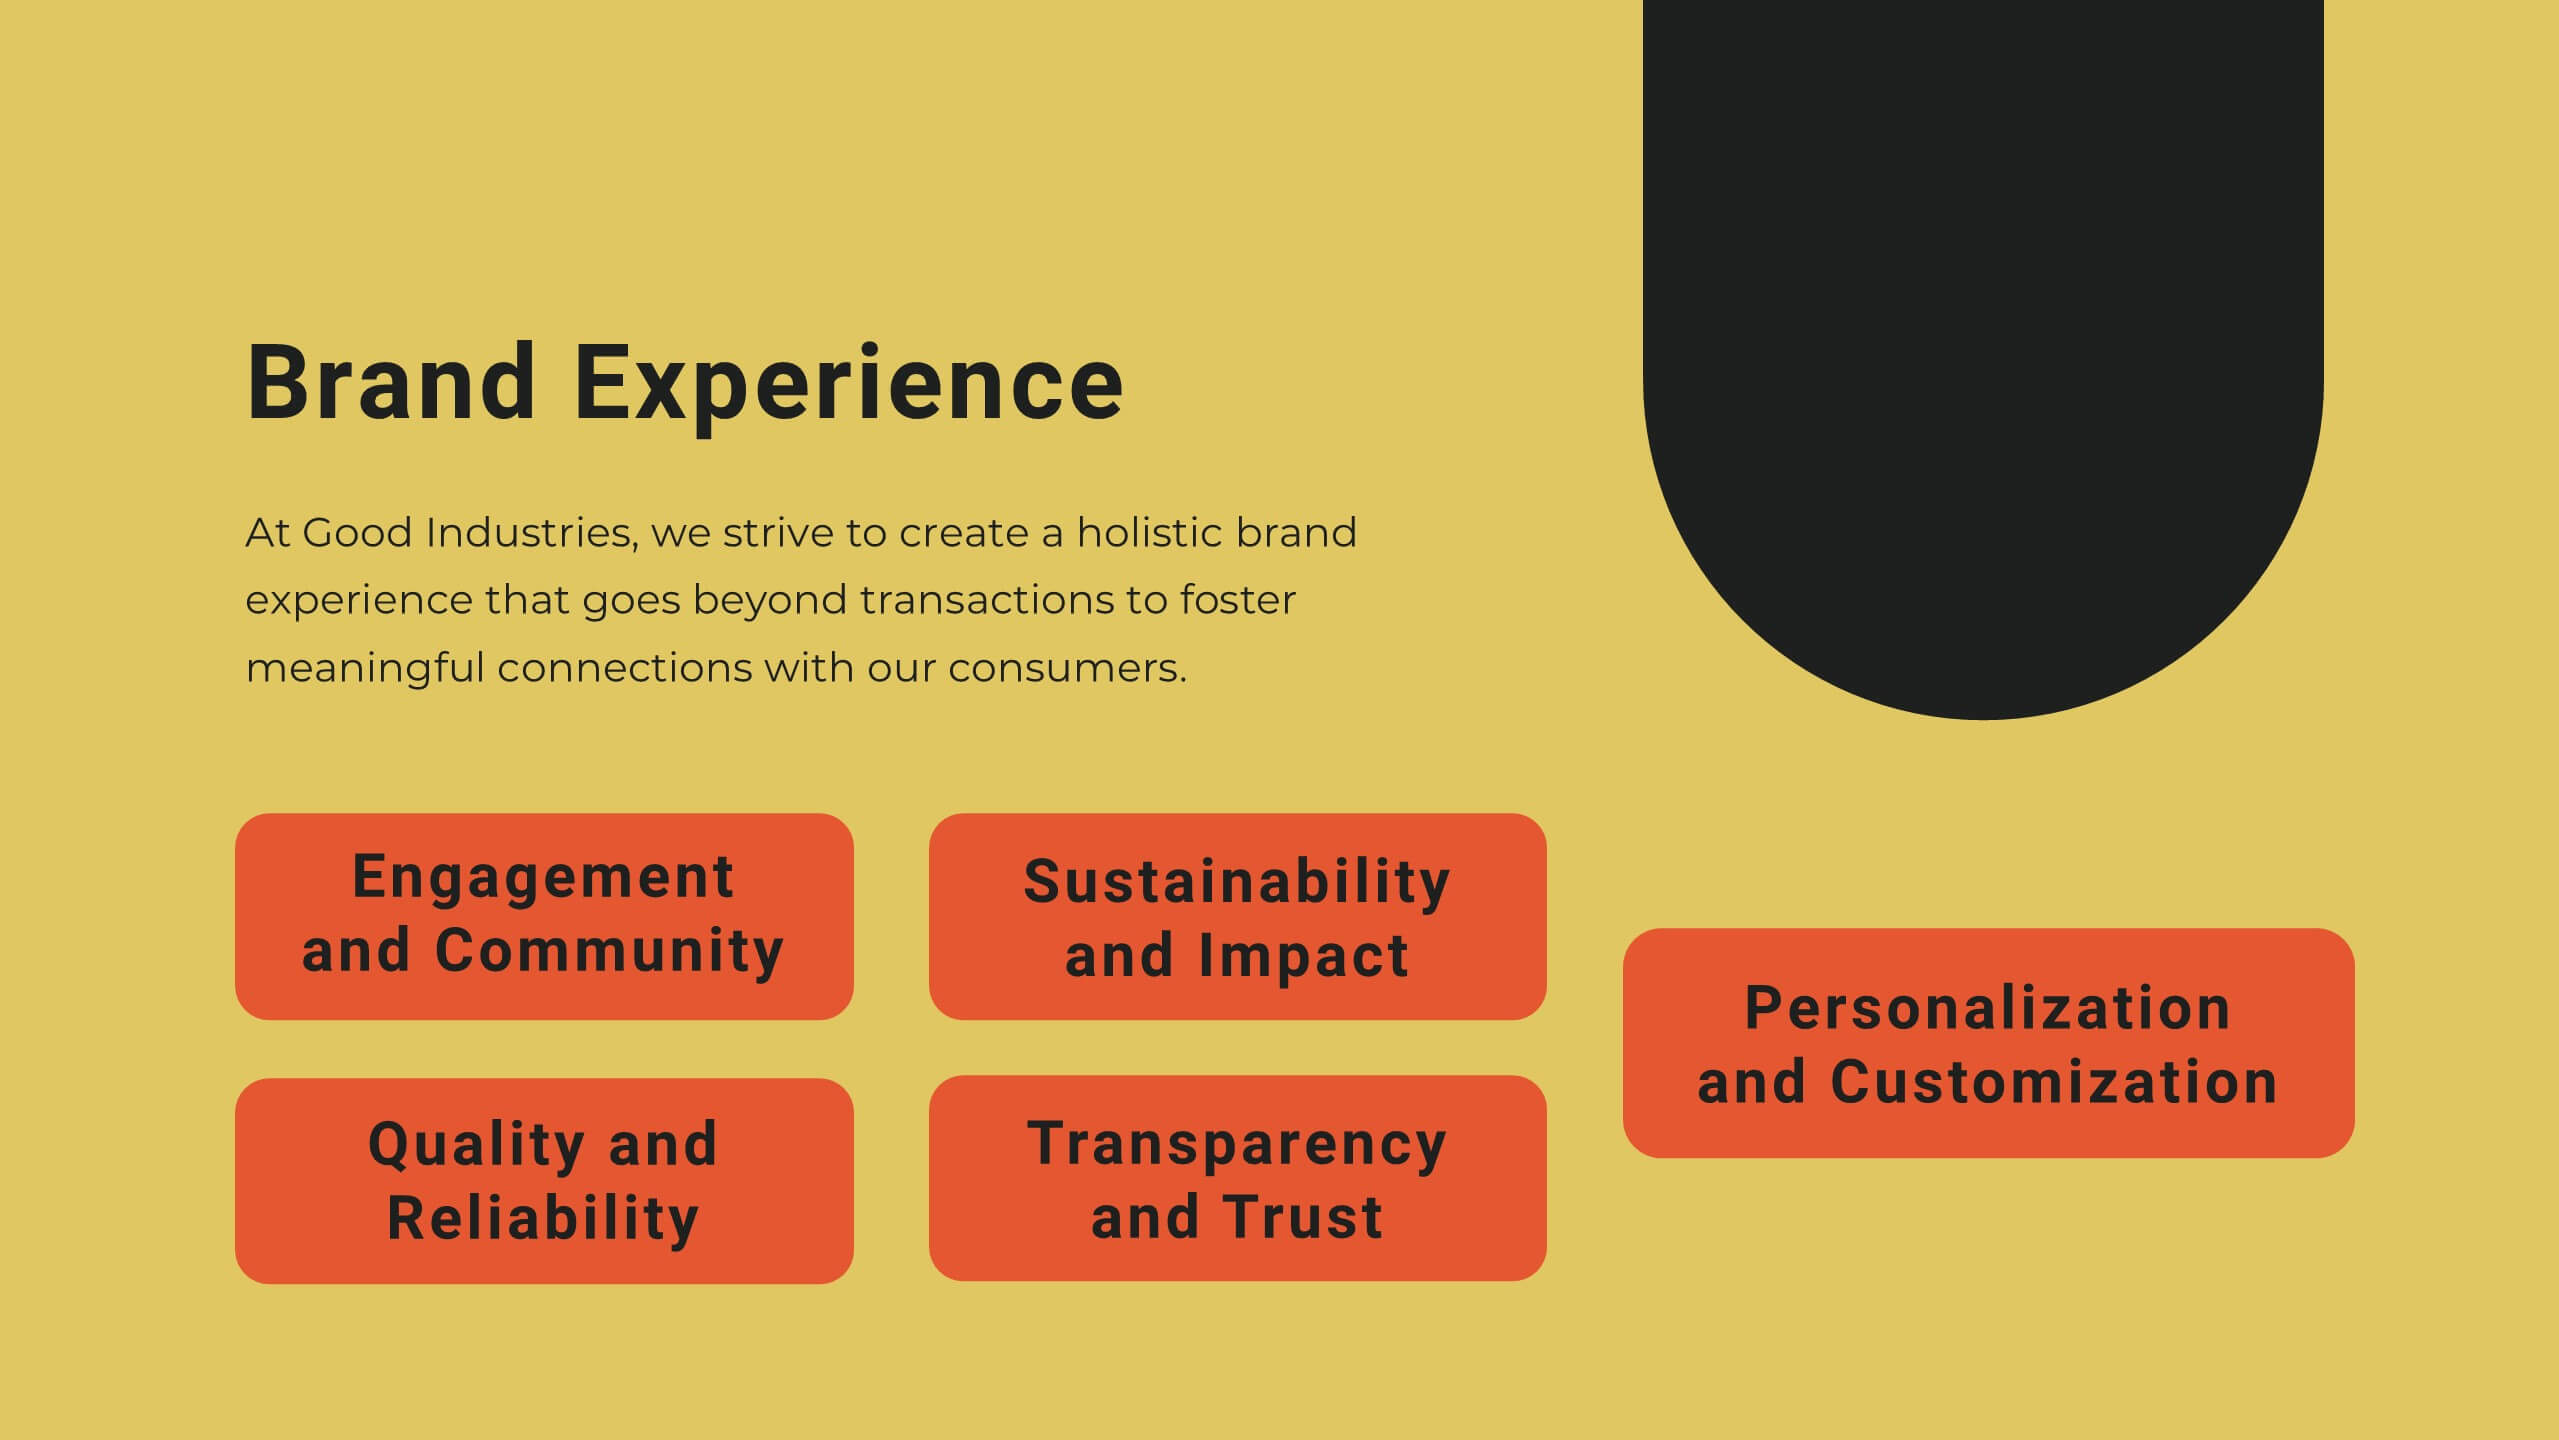
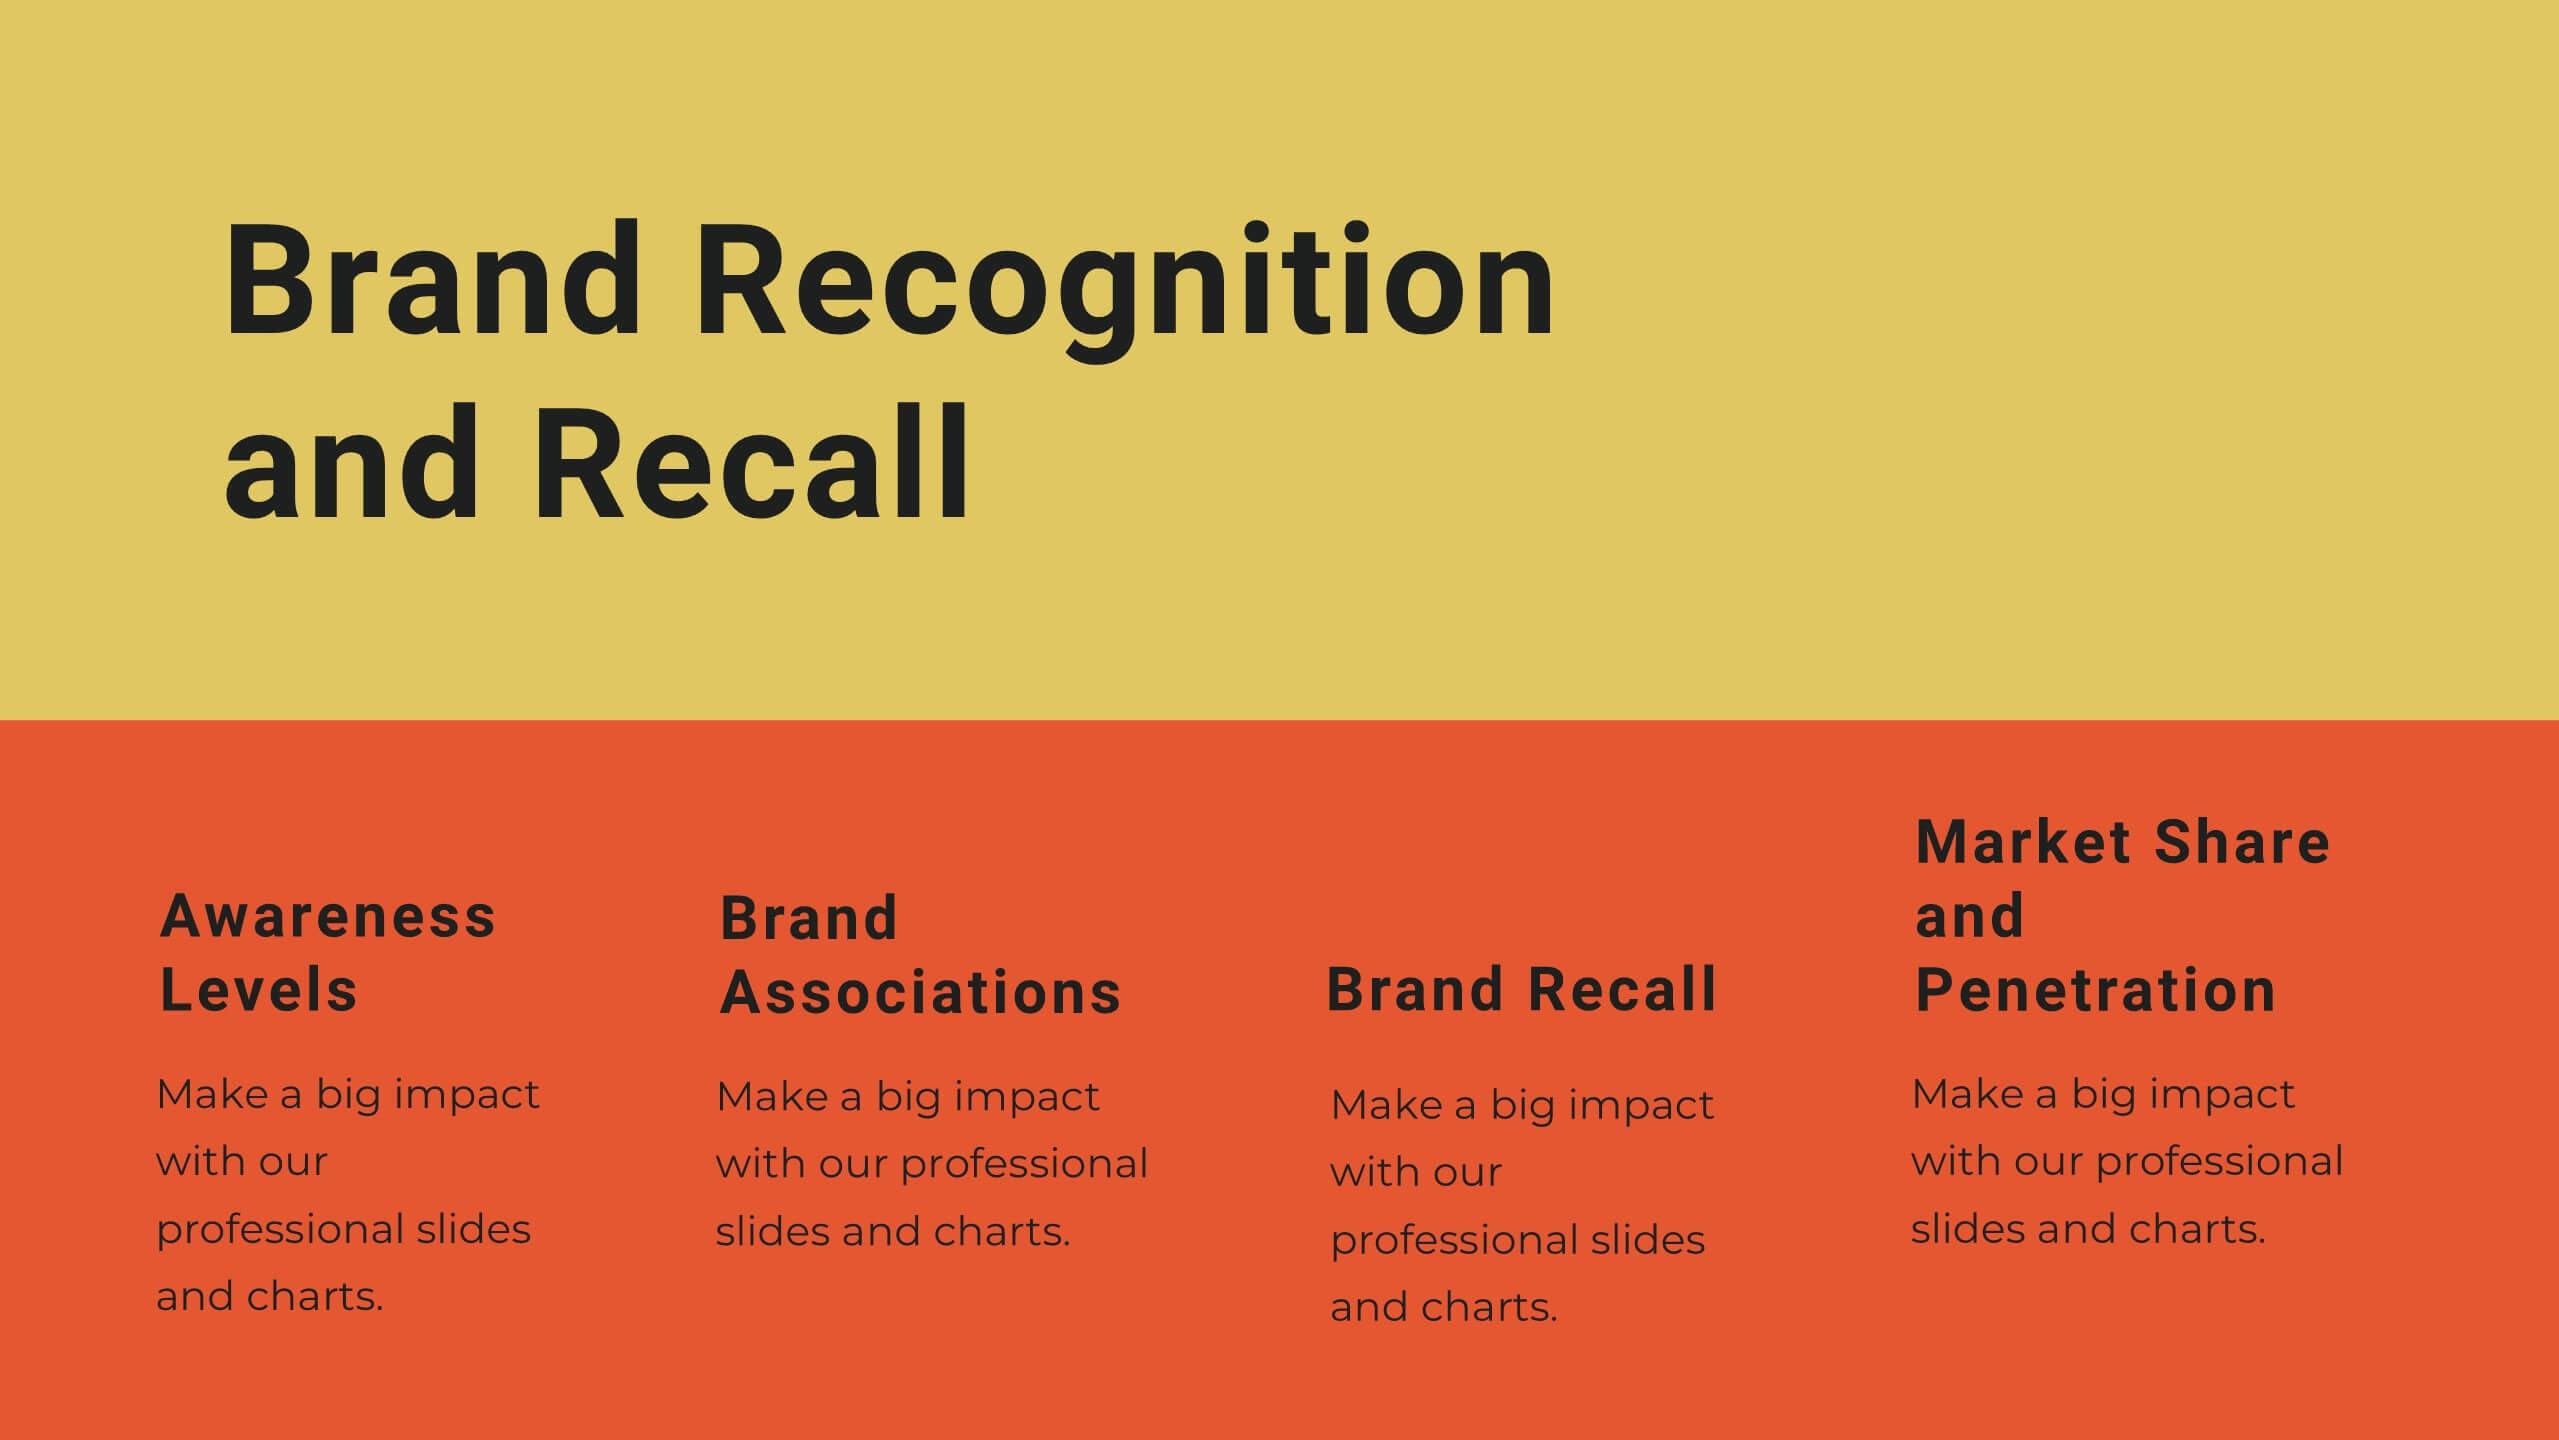
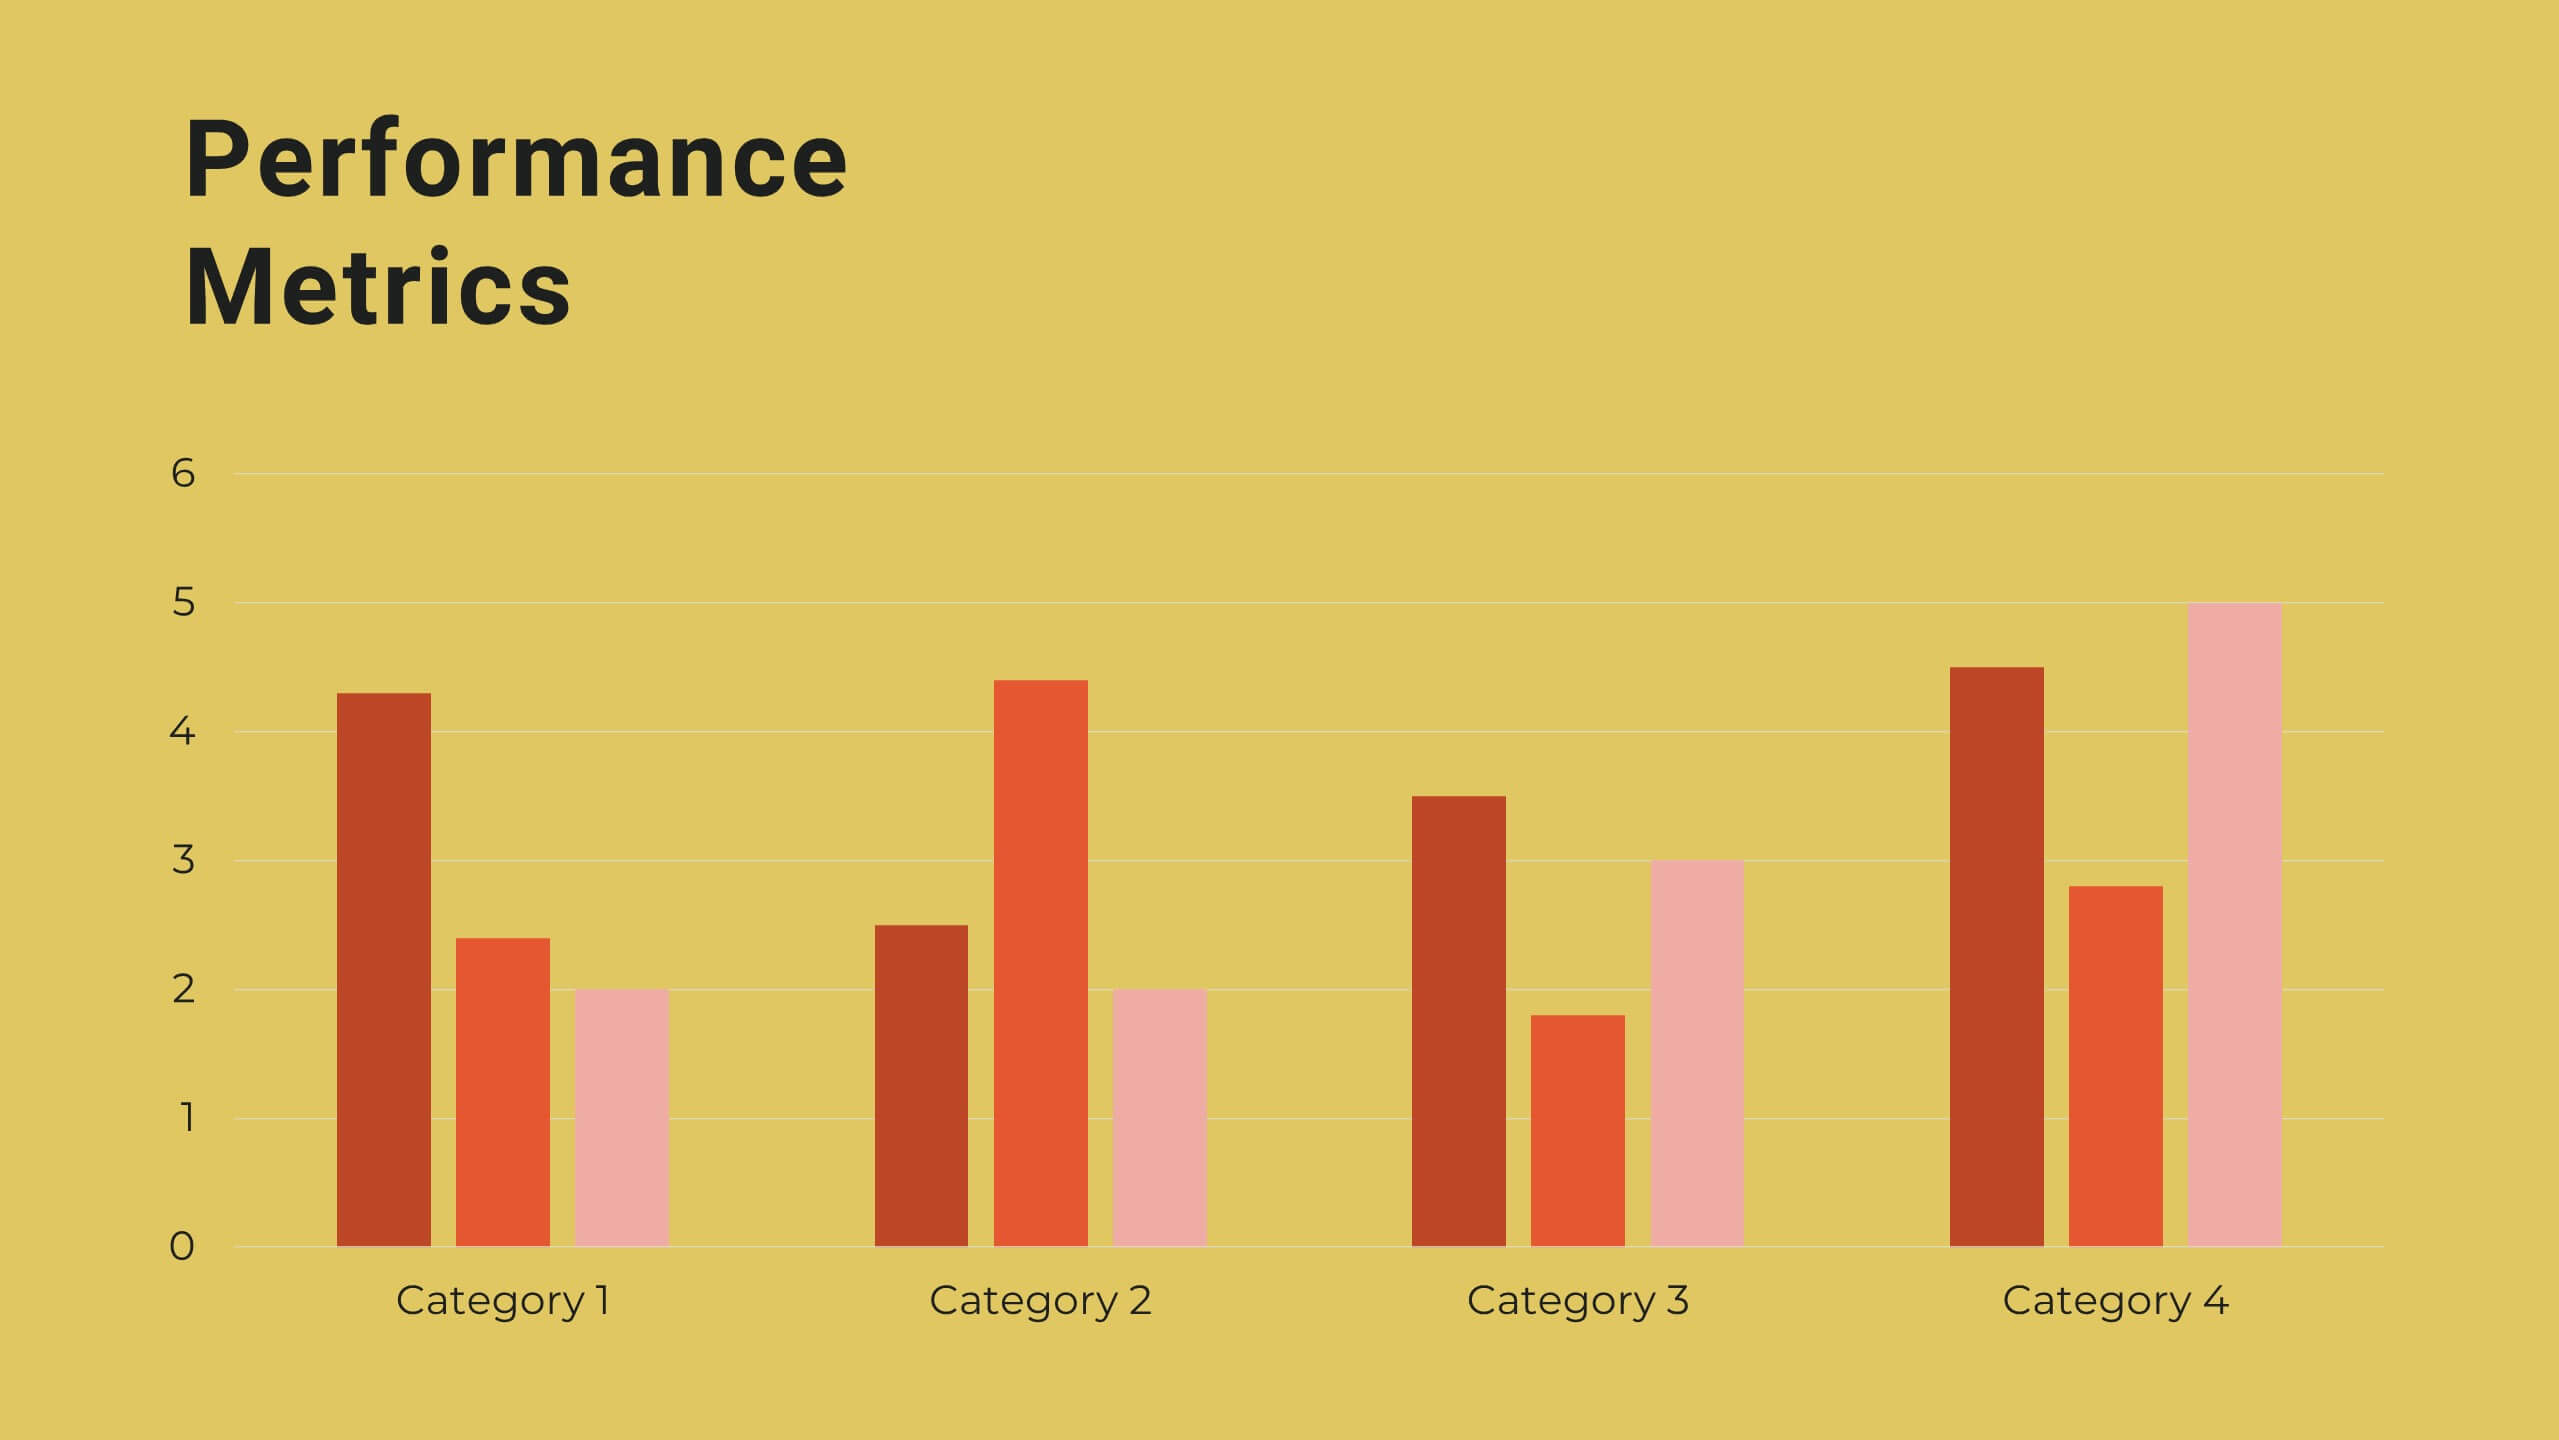
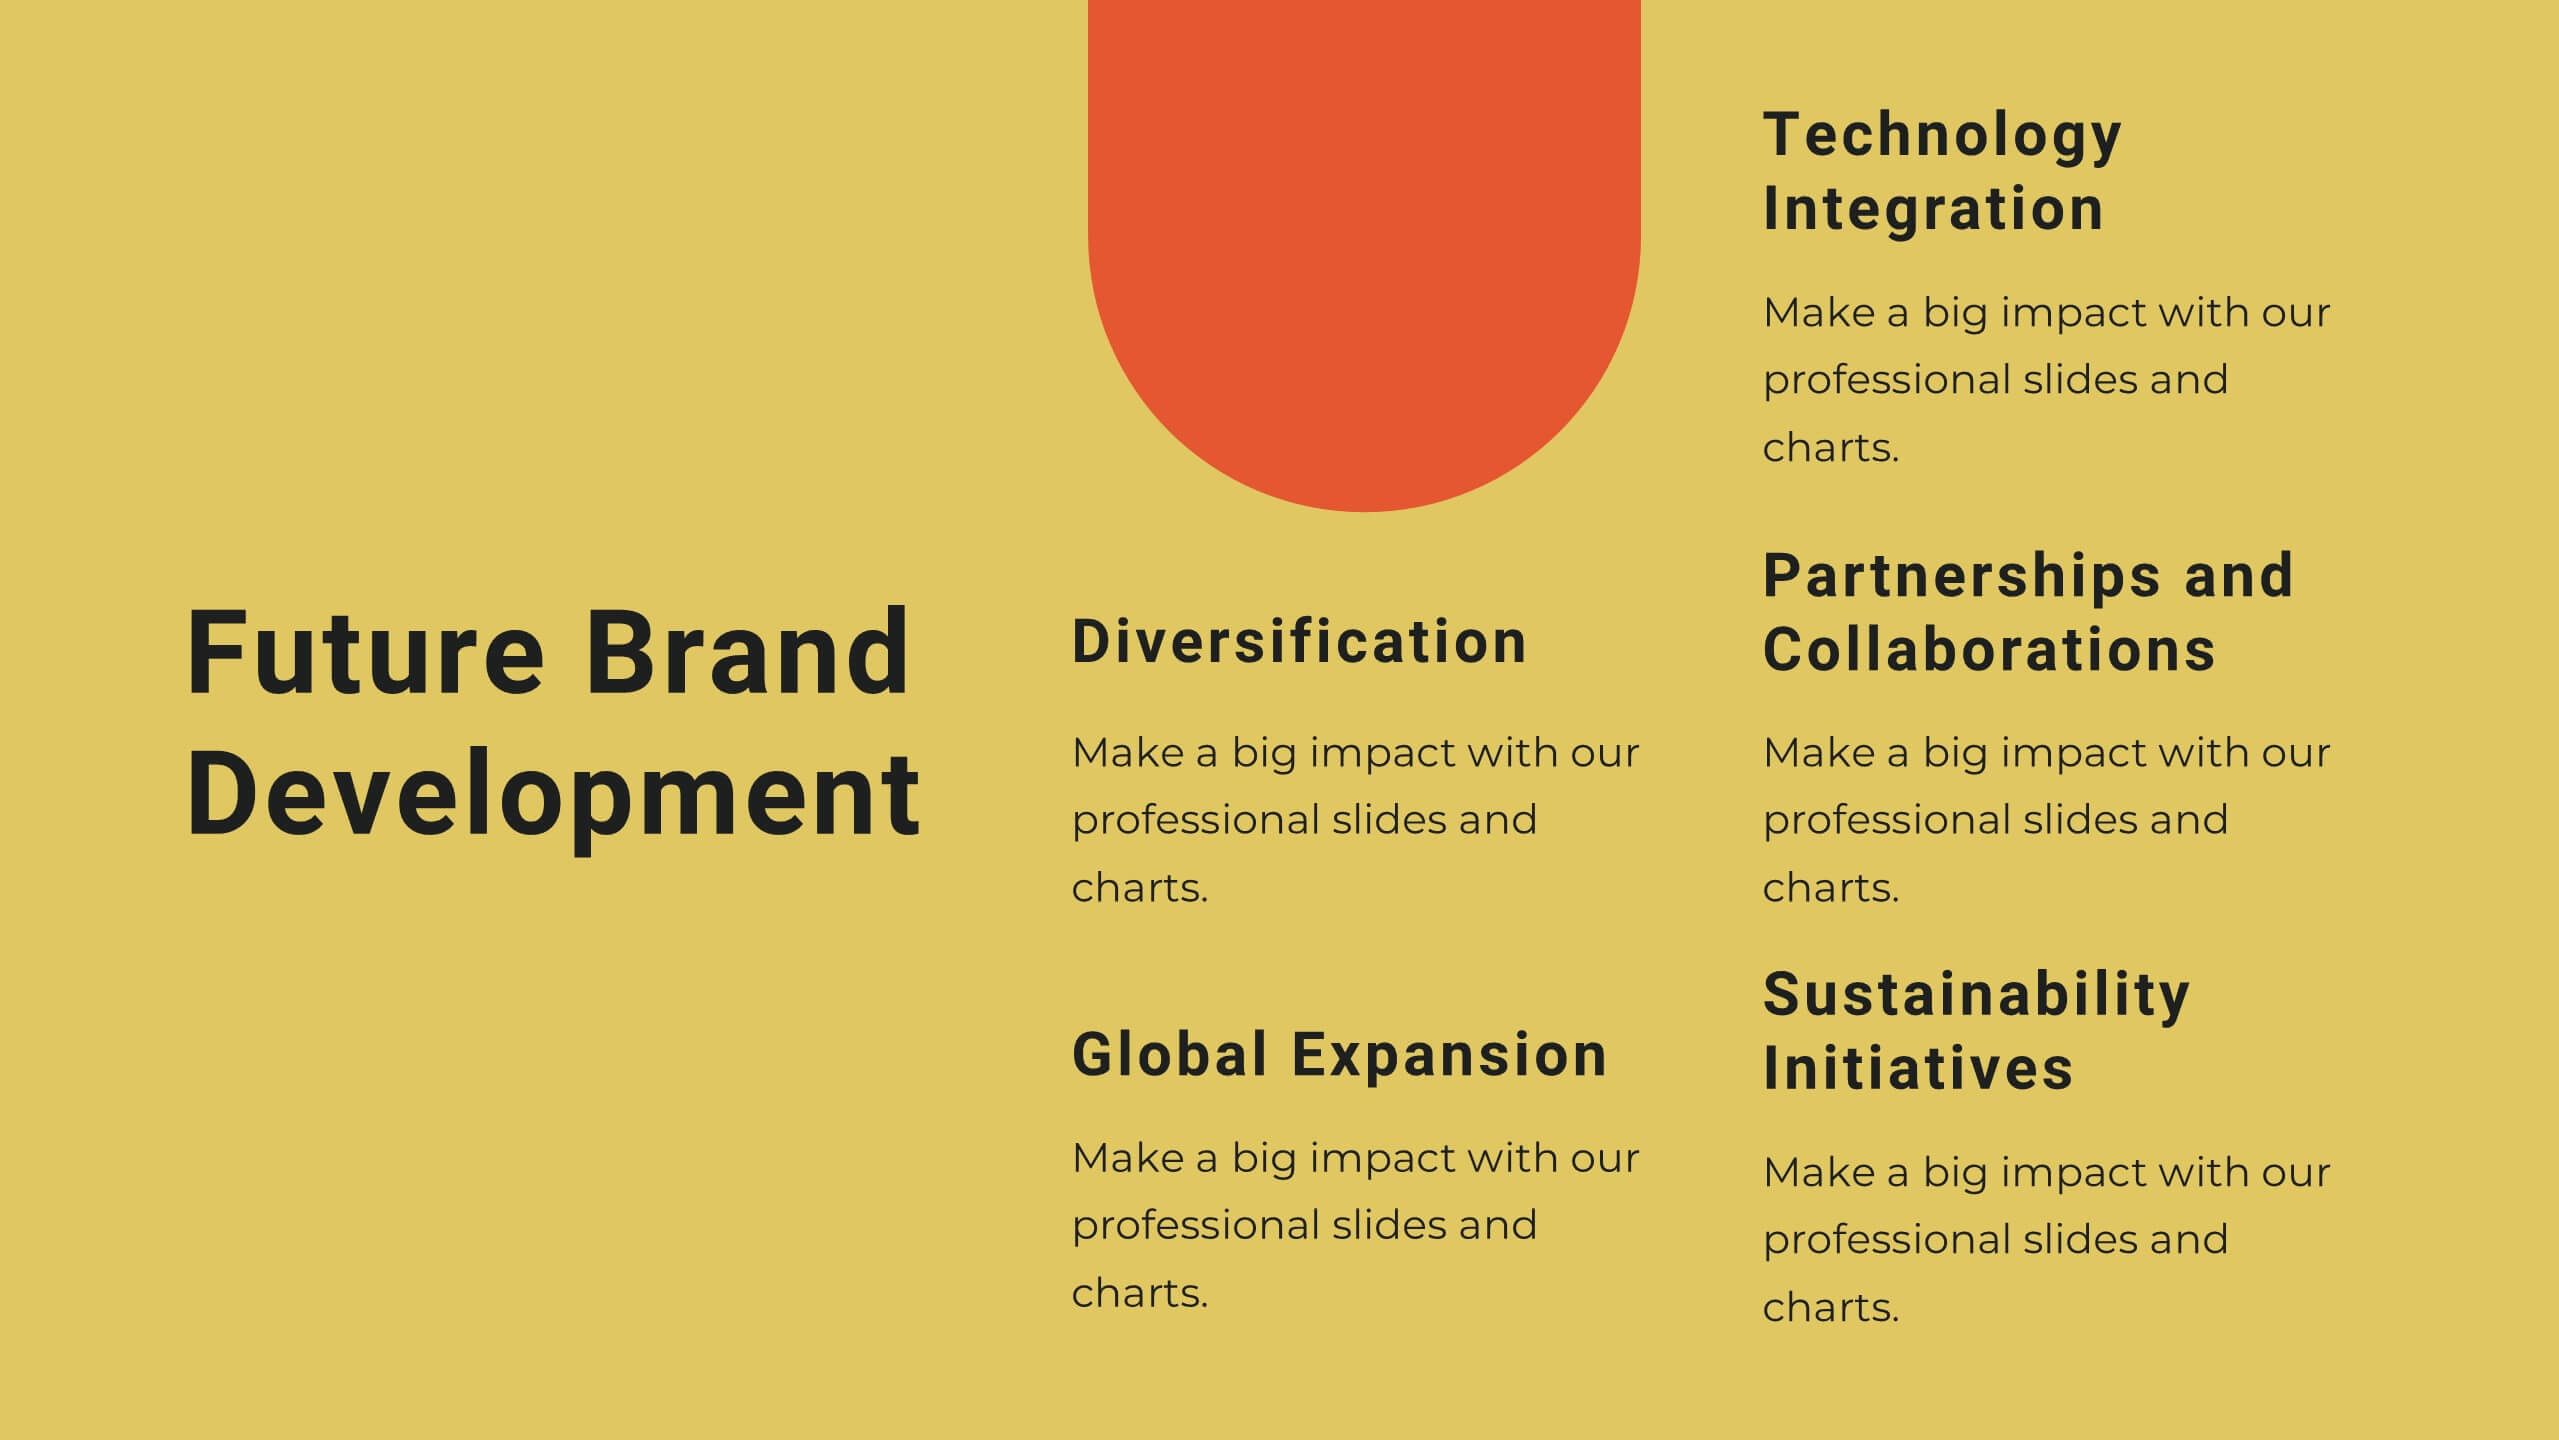
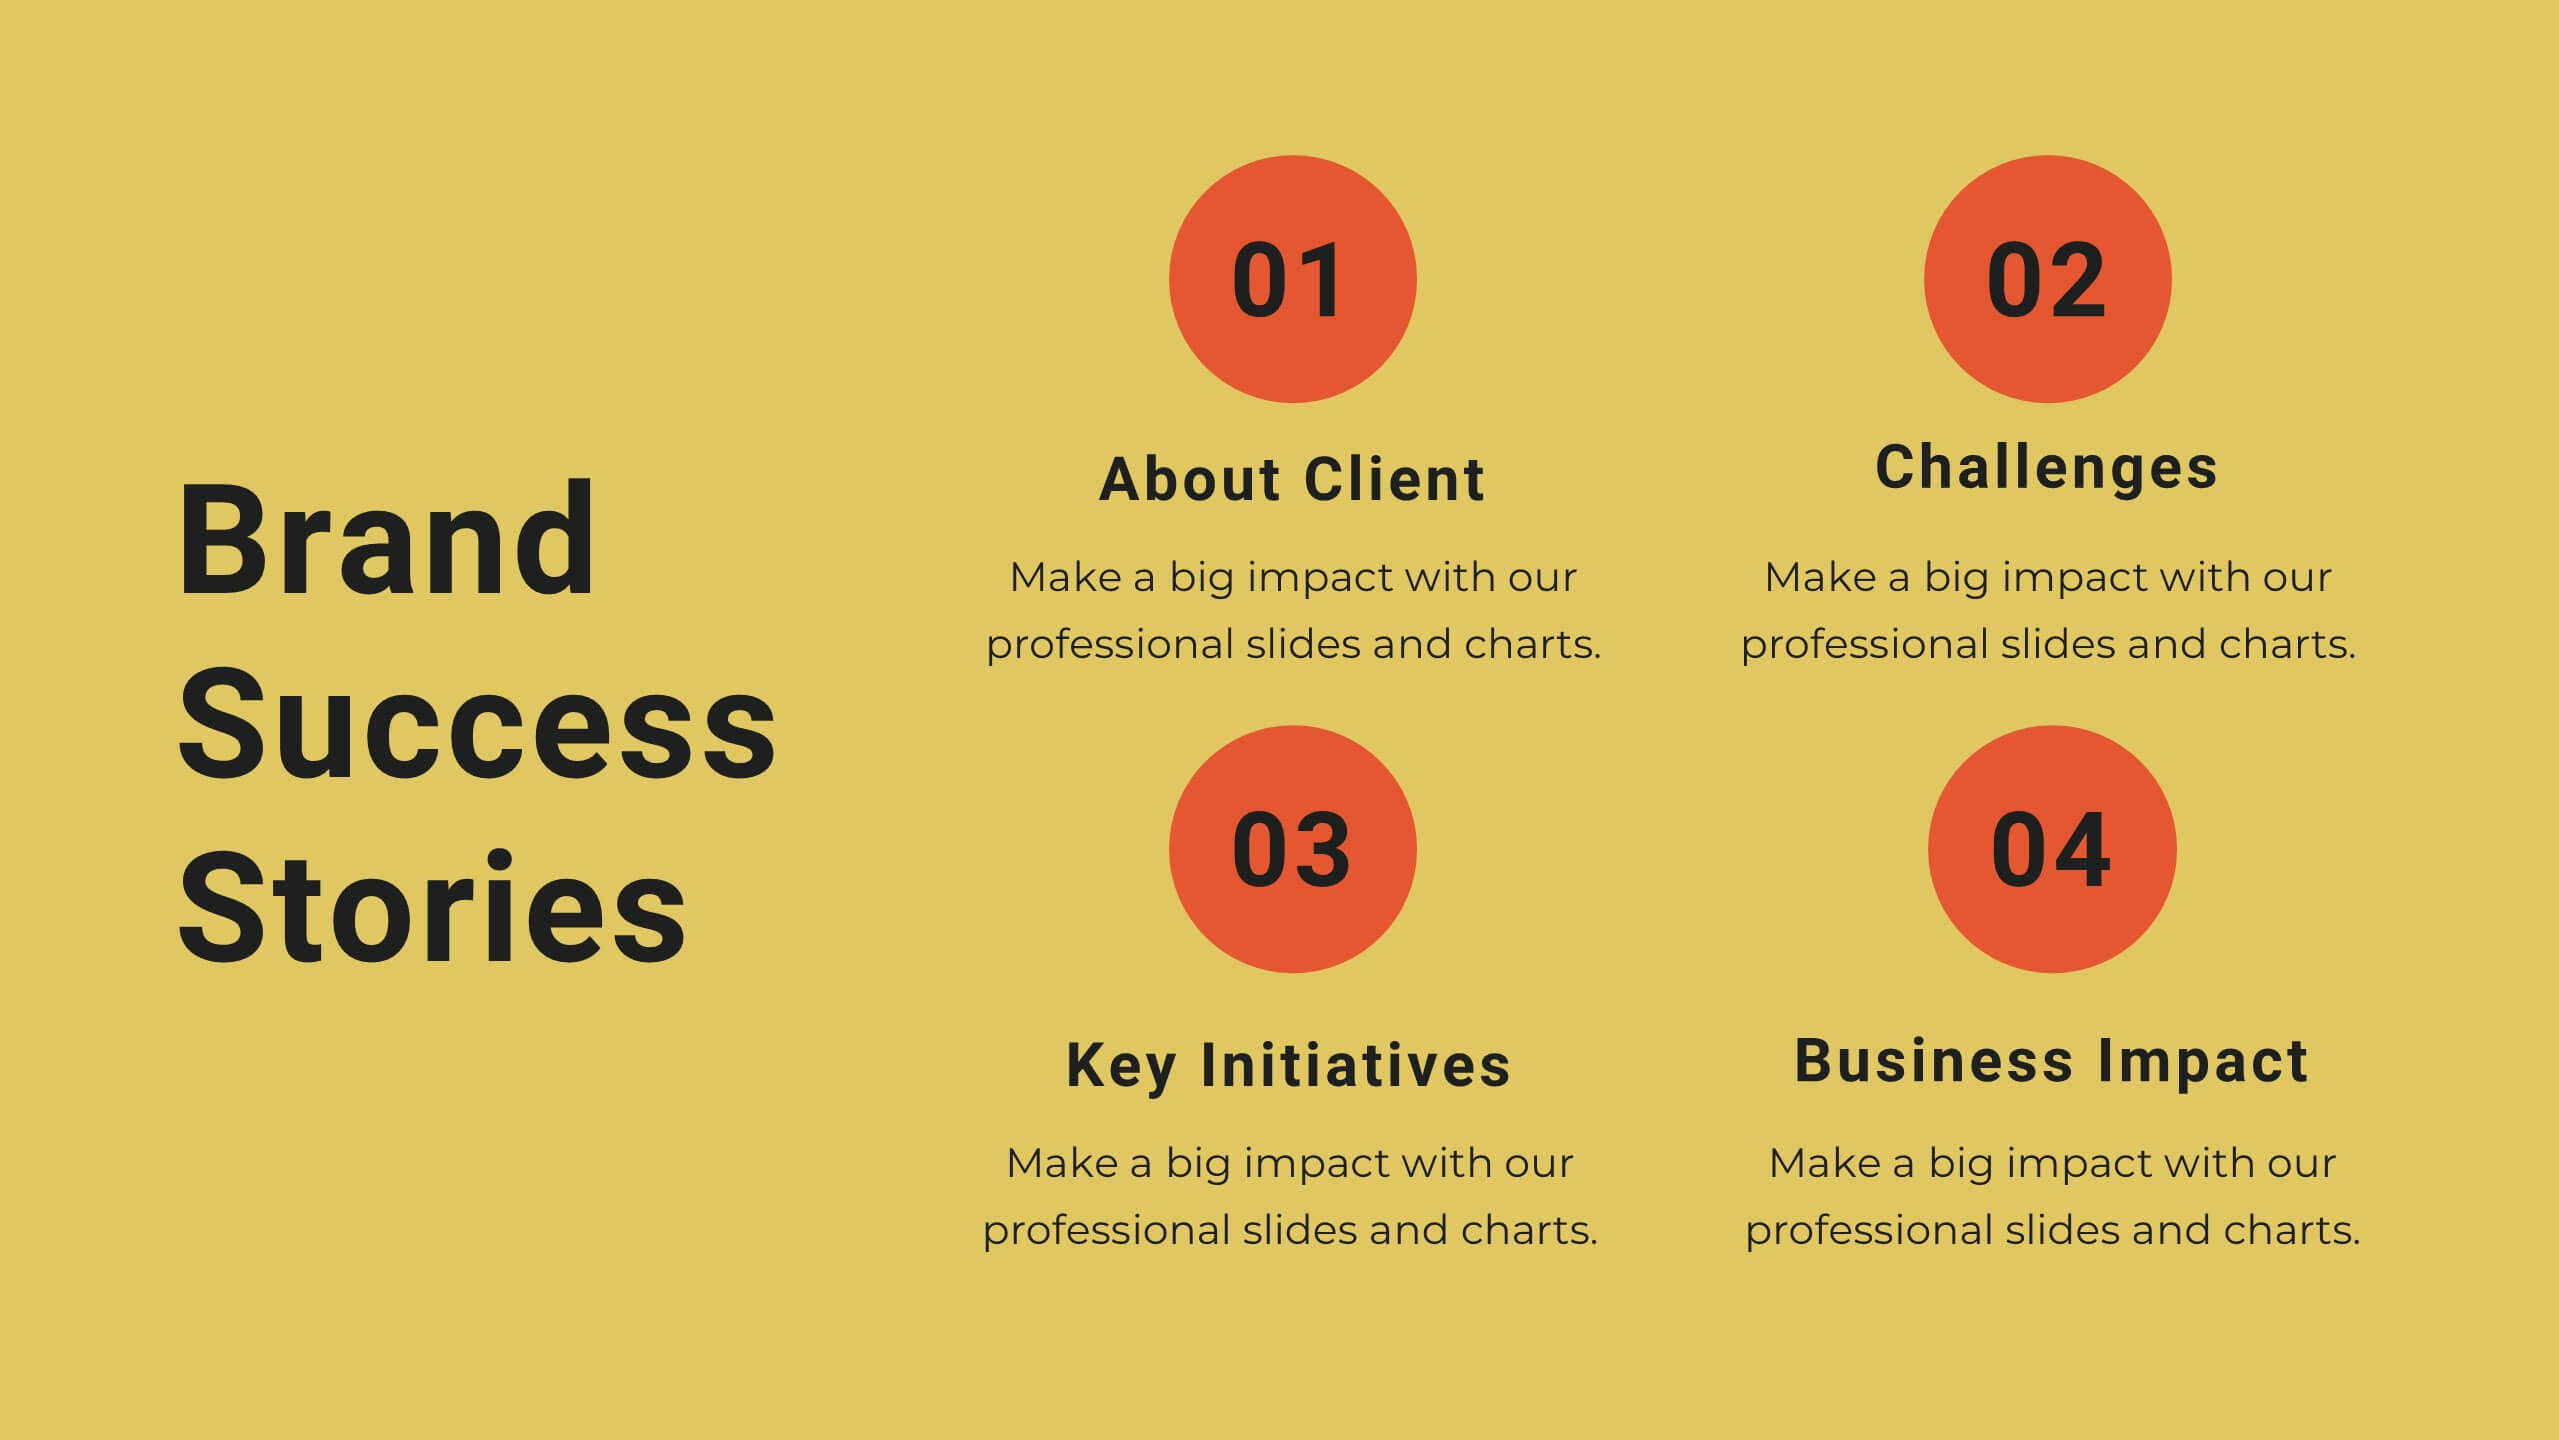
Yttrium Brand Strategy Report Presentation
Present your brand strategy with confidence using this vibrant, structured template! Covering brand identity, values, audience personas, and positioning, this template is perfect for crafting a compelling brand narrative. Fully customizable, it’s designed for seamless use in PowerPoint, Keynote, and Google Slides, making it an ideal tool for branding presentations.