


Características


¿Tienes alguna pregunta?
Recomendar


5 diapositivas
Public Health Data Presentation
Bright visuals and clean data blocks make this slide an energizing way to present key insights, instantly pulling viewers into the story behind your metrics. It helps simplify complex information while keeping everything clear, structured, and easy to follow. Fully compatible with PowerPoint, Keynote, and Google Slides.


5 diapositivas
5 Types of Credit Cards Explained Presentation
Unlock the world of smarter spending with this clear, engaging layout designed to break down different credit card types in a simple, visual way. It helps you present features, benefits, and key distinctions with ease, making financial concepts easy to understand. Fully editable and compatible with PowerPoint, Keynote, and Google Slides.


21 diapositivas
Chimerae Design Portfolio Presentation
Elevate your design portfolio with this modern and visually dynamic template, crafted to showcase your creative process and expertise. This layout includes slides for introduction, concept development, and design elements, allowing you to present your unique approach and attention to detail. Highlight your design process, including research insights, prototypes, and final designs, to demonstrate your workflow and results. Showcase your brand identity with dedicated slides for typography, color palettes, and textures, ensuring a cohesive and professional presentation. This fully customizable template is compatible with PowerPoint, Google Slides, and Keynote, offering versatility for designers, freelancers, and agencies aiming to leave a lasting impression. Tailor the design to match your brand and confidently present your portfolio in style.


7 diapositivas
Organizational Change with 7S Framework Presentation
Visualize organizational transformation with the Organizational Change with 7S Framework Presentation. This slide highlights each element of the McKinsey 7S model—Structure, Strategy, Systems, Shared Values, Skills, Style, and Staff—along an S-shaped flow. Ideal for consulting, internal alignment, and strategic planning discussions. Fully editable in Canva, PowerPoint, Keynote, and Google Slides.


4 diapositivas
3-Tier Hierarchical Pyramid Breakdown
Simplify your strategy presentation with the 3-Tier Hierarchical Pyramid Breakdown Presentation. This clear and modern slide features a three-level pyramid with horizontal progress bars and percentage indicators—perfect for visualizing goals, KPIs, or organizational layers. Each tier includes editable text boxes for quick customization. Works seamlessly in PowerPoint, Keynote, and Google Slides.


26 diapositivas
Emery Presentation Template
Ready to make an impression? Style and professionalism are all wrapped up in Emery. New businesses and startups will find it useful - from real estate to travel agencies and everything in-between. Emery is a bold, colorful minimalistic aesthetic template. It's easy to customize, clean and bold template for you to use for your company website. It's flexible and makes an easy quick start. Fill in your details with our easy to edit text, pictures, timelines, charts and we'll set you up for success. Use this fantastic template to promote your business or project and create the perfect document.


22 diapositivas
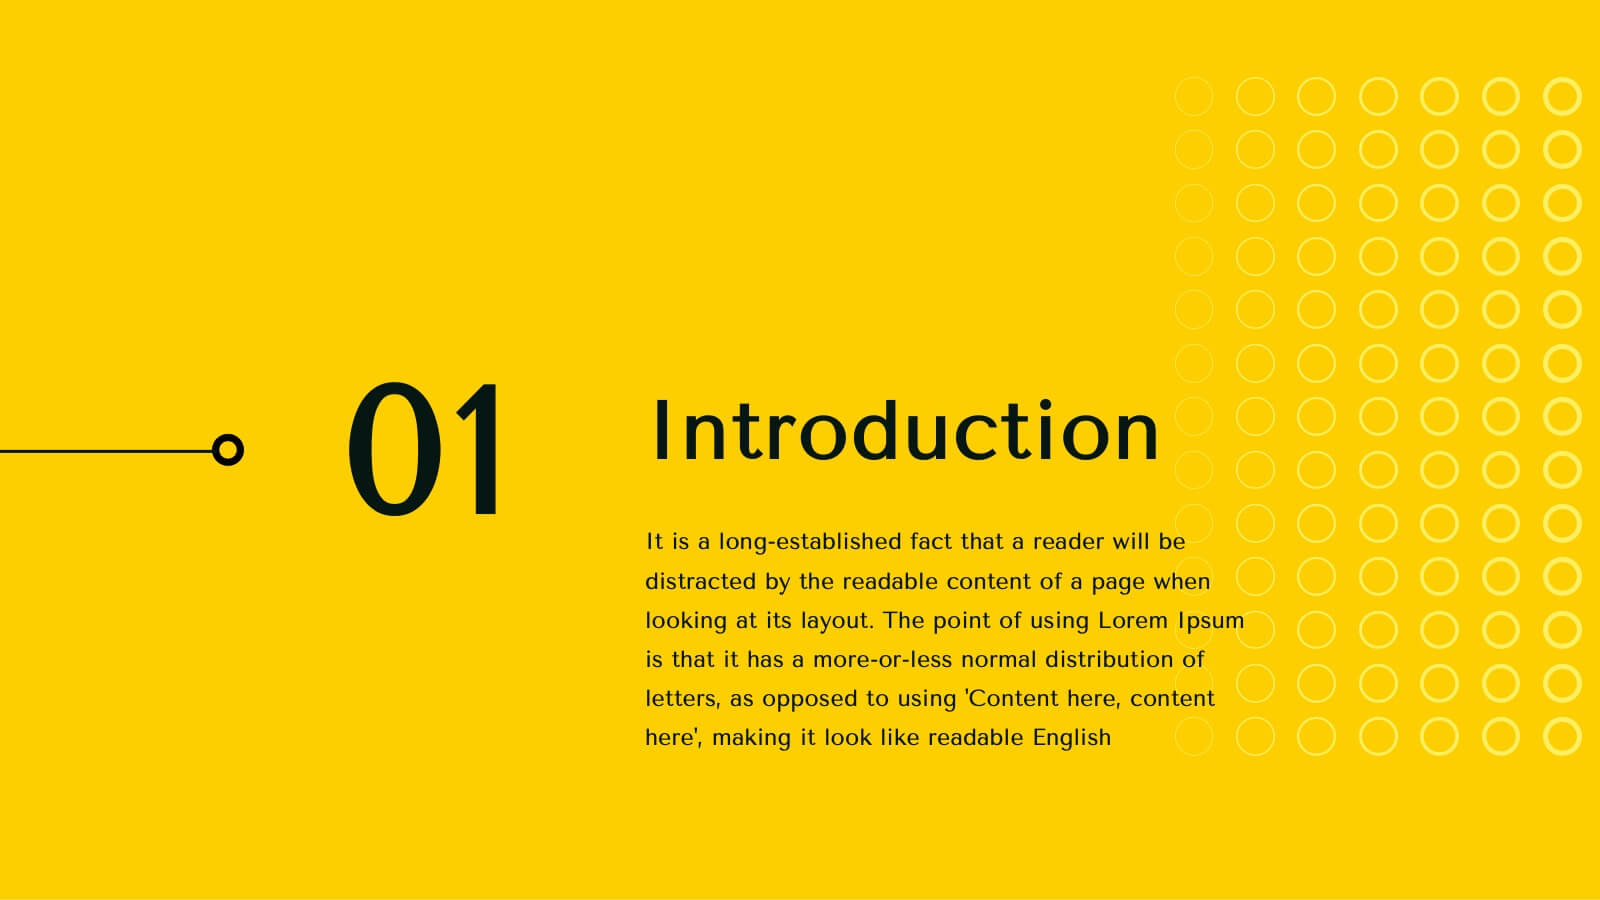
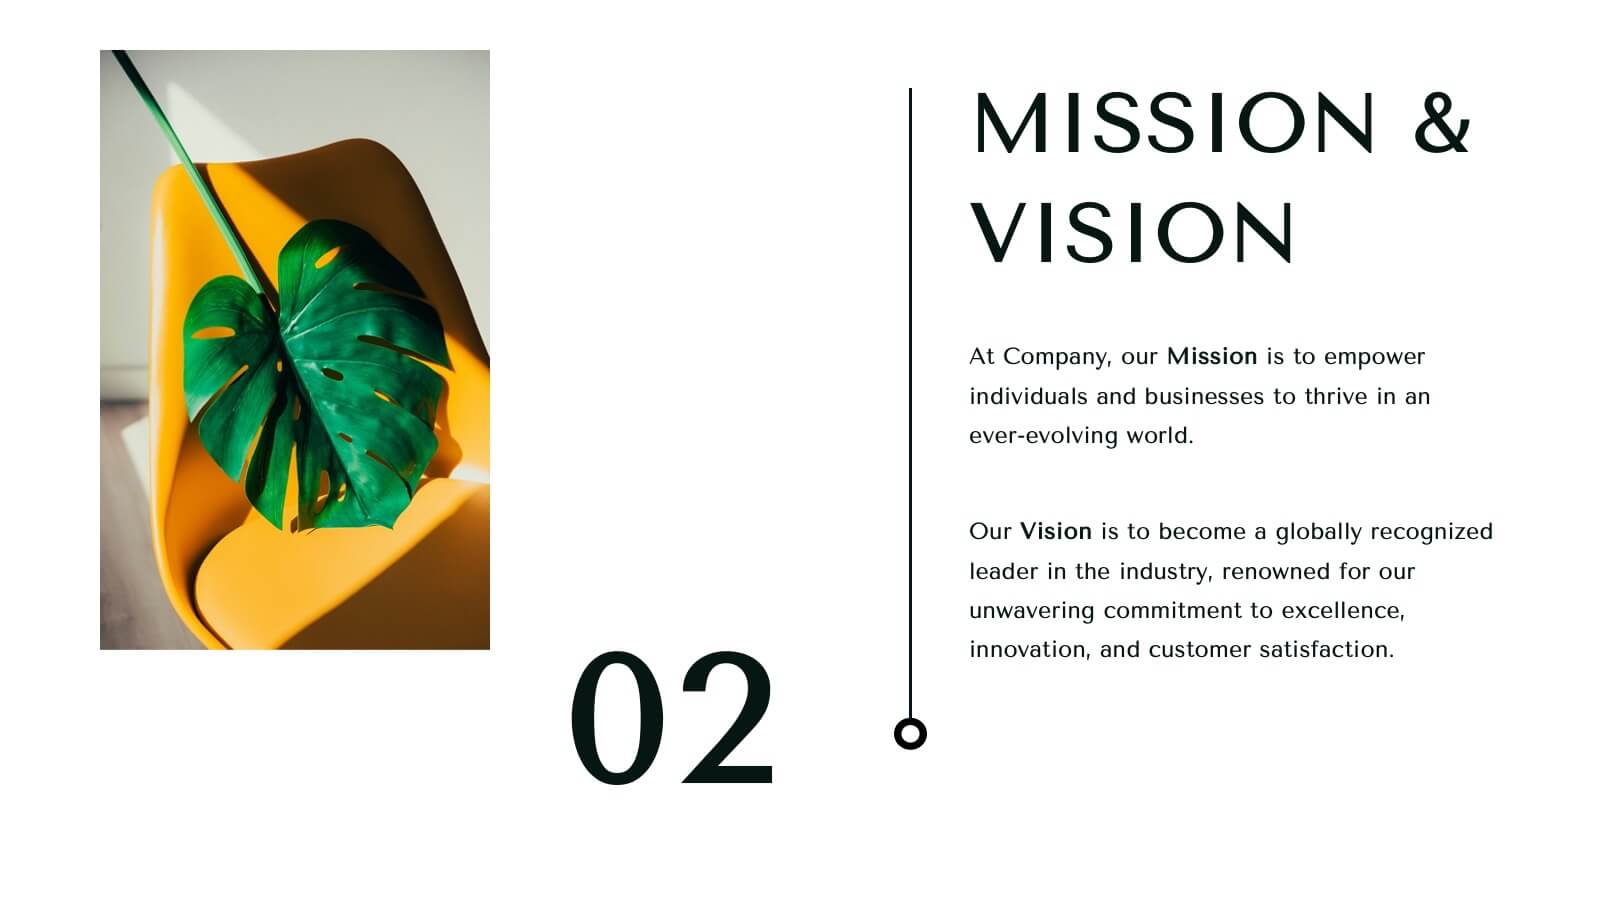
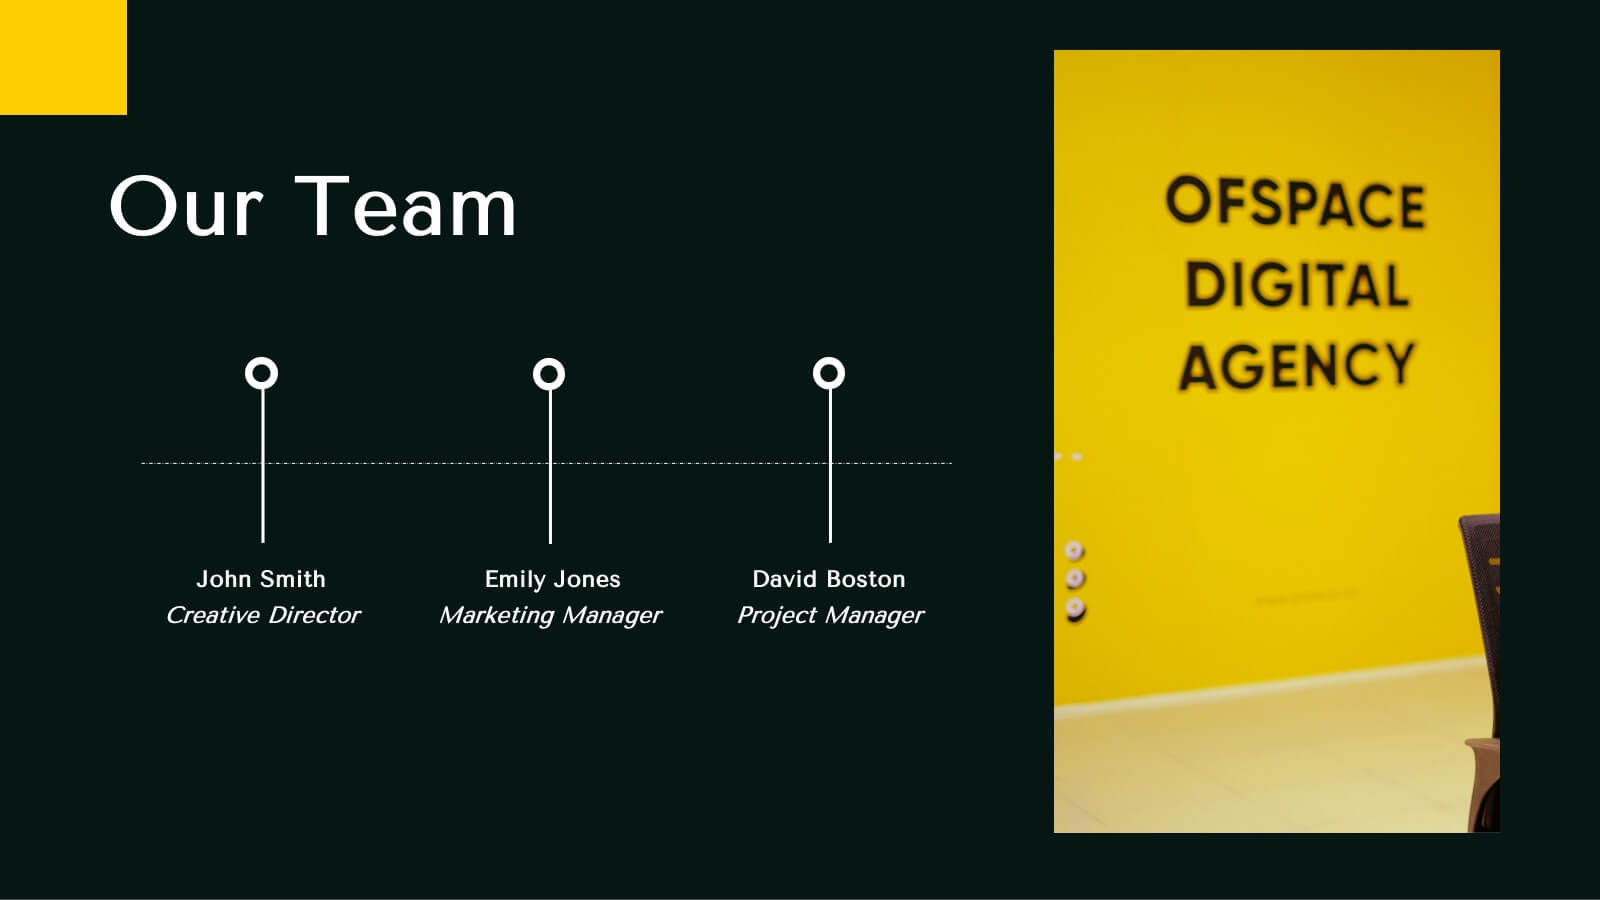
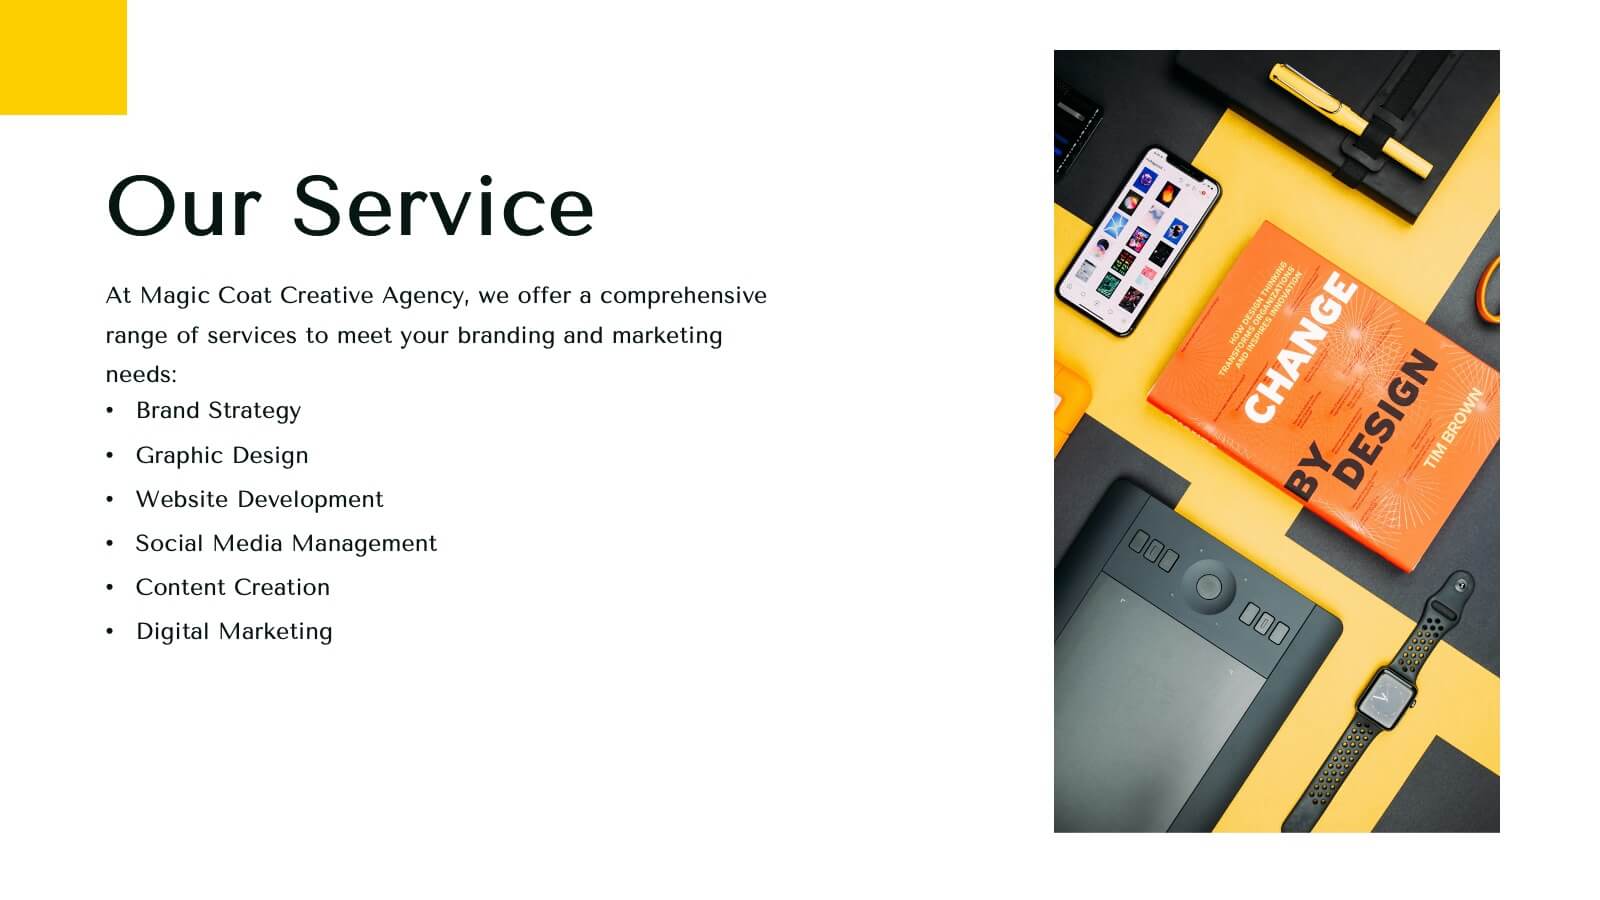
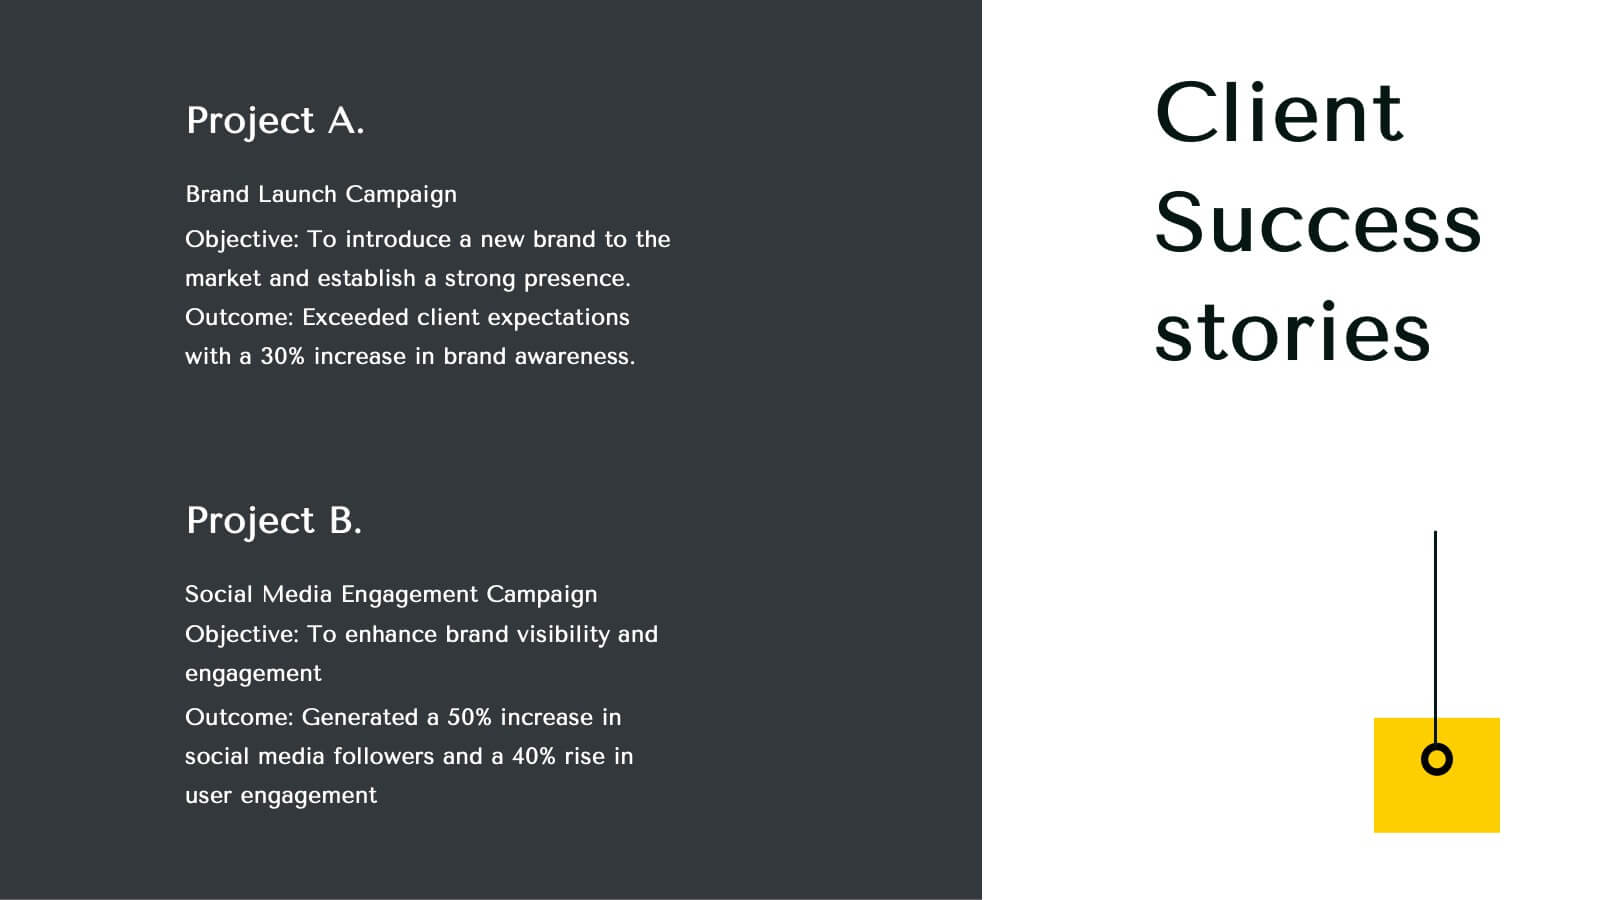
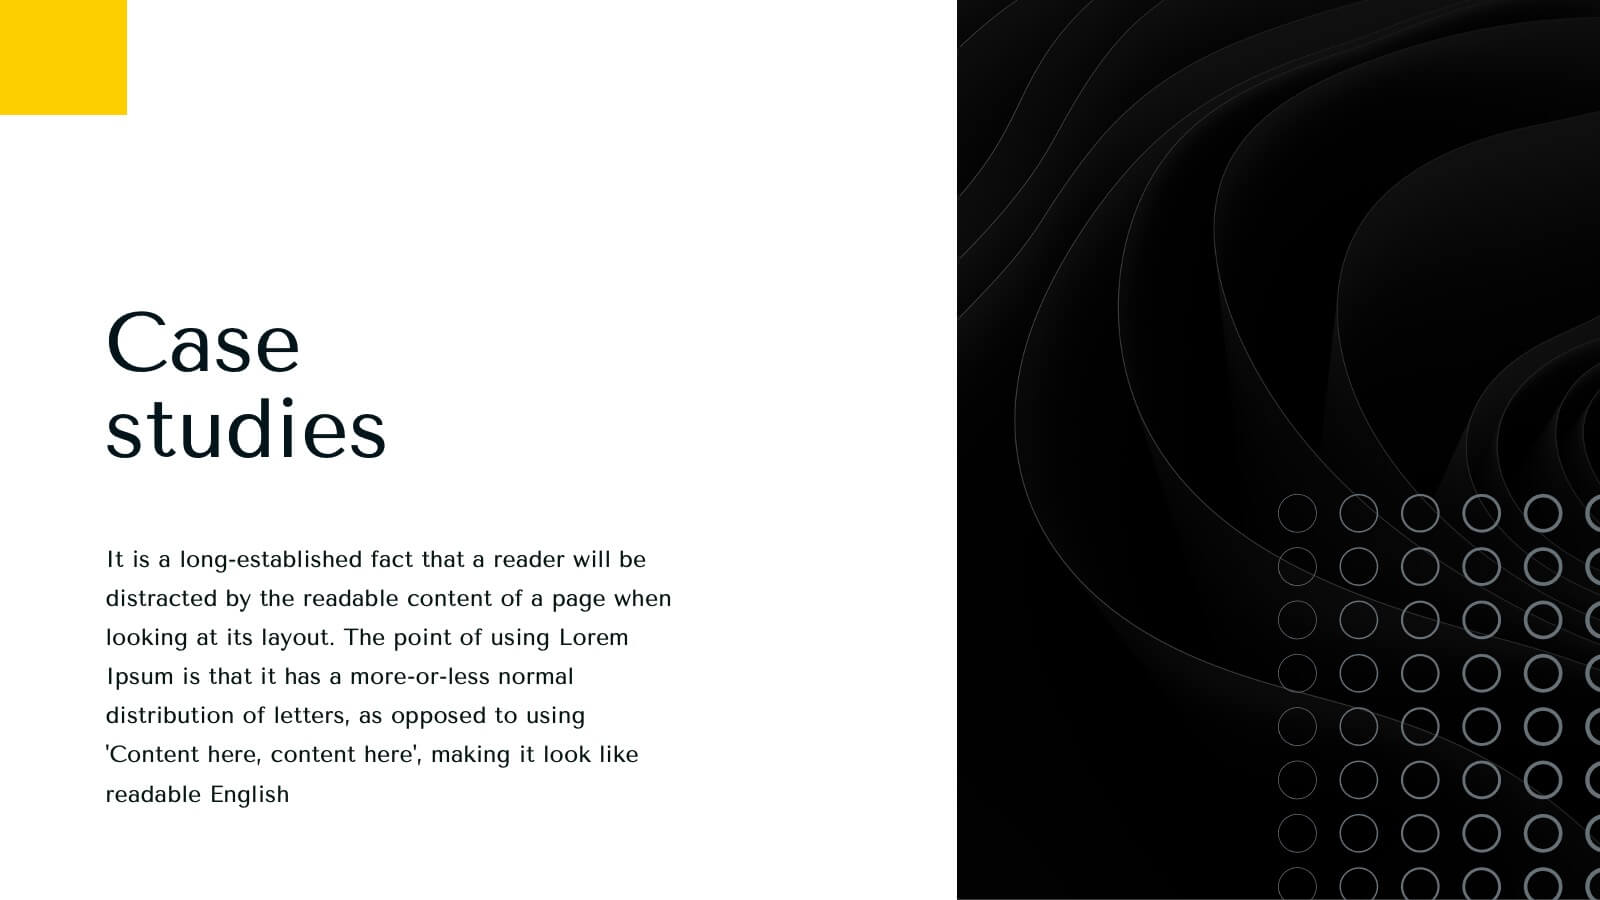
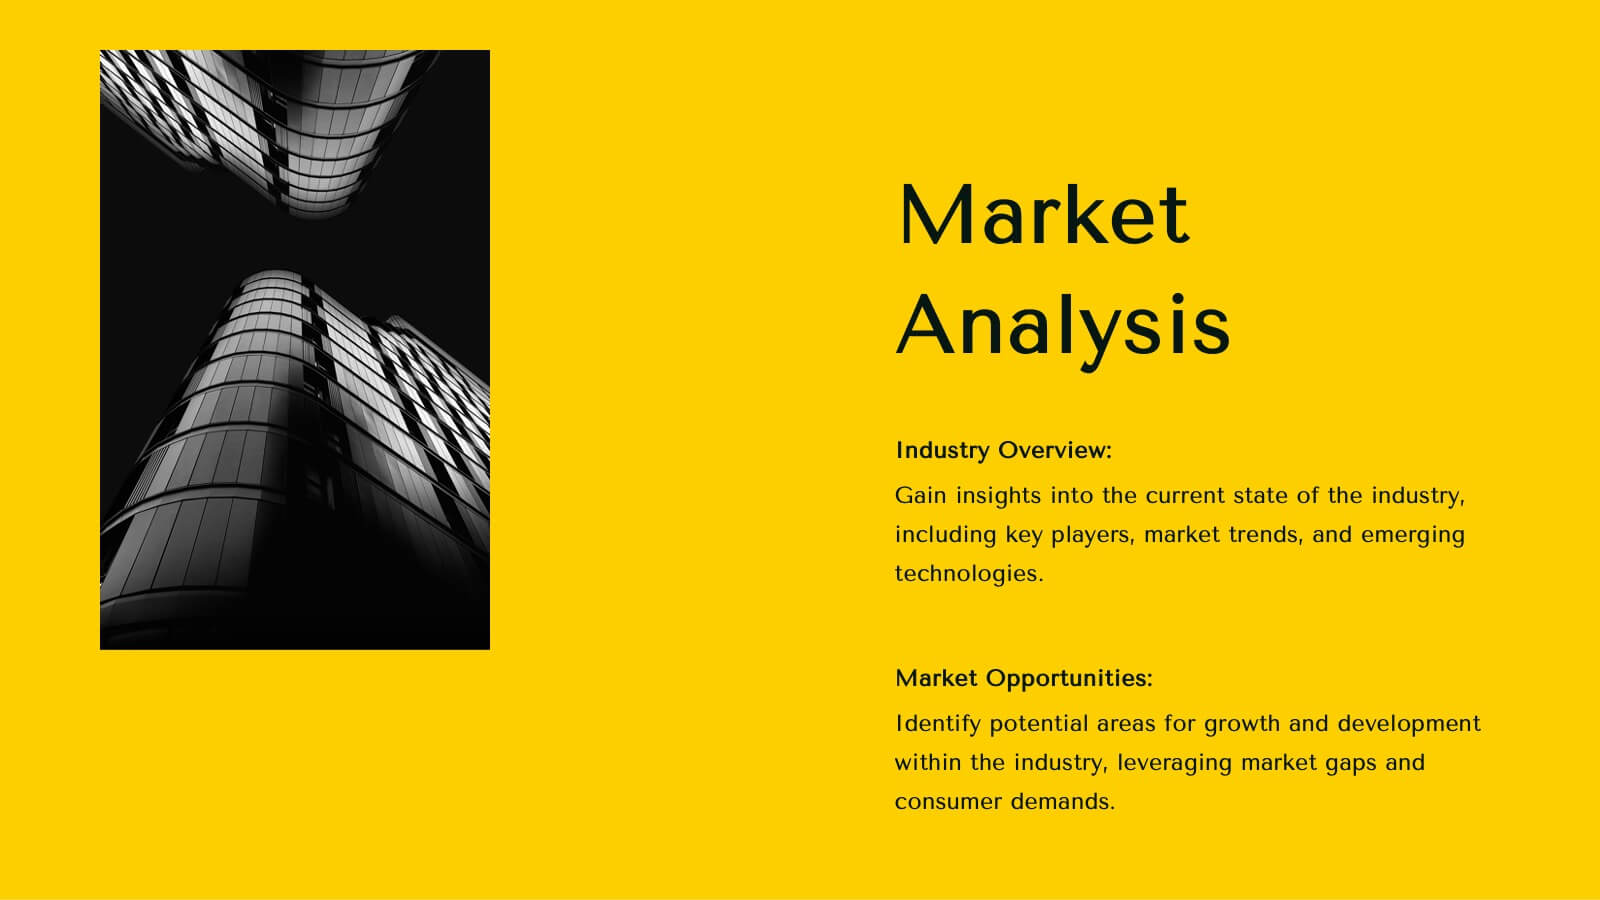
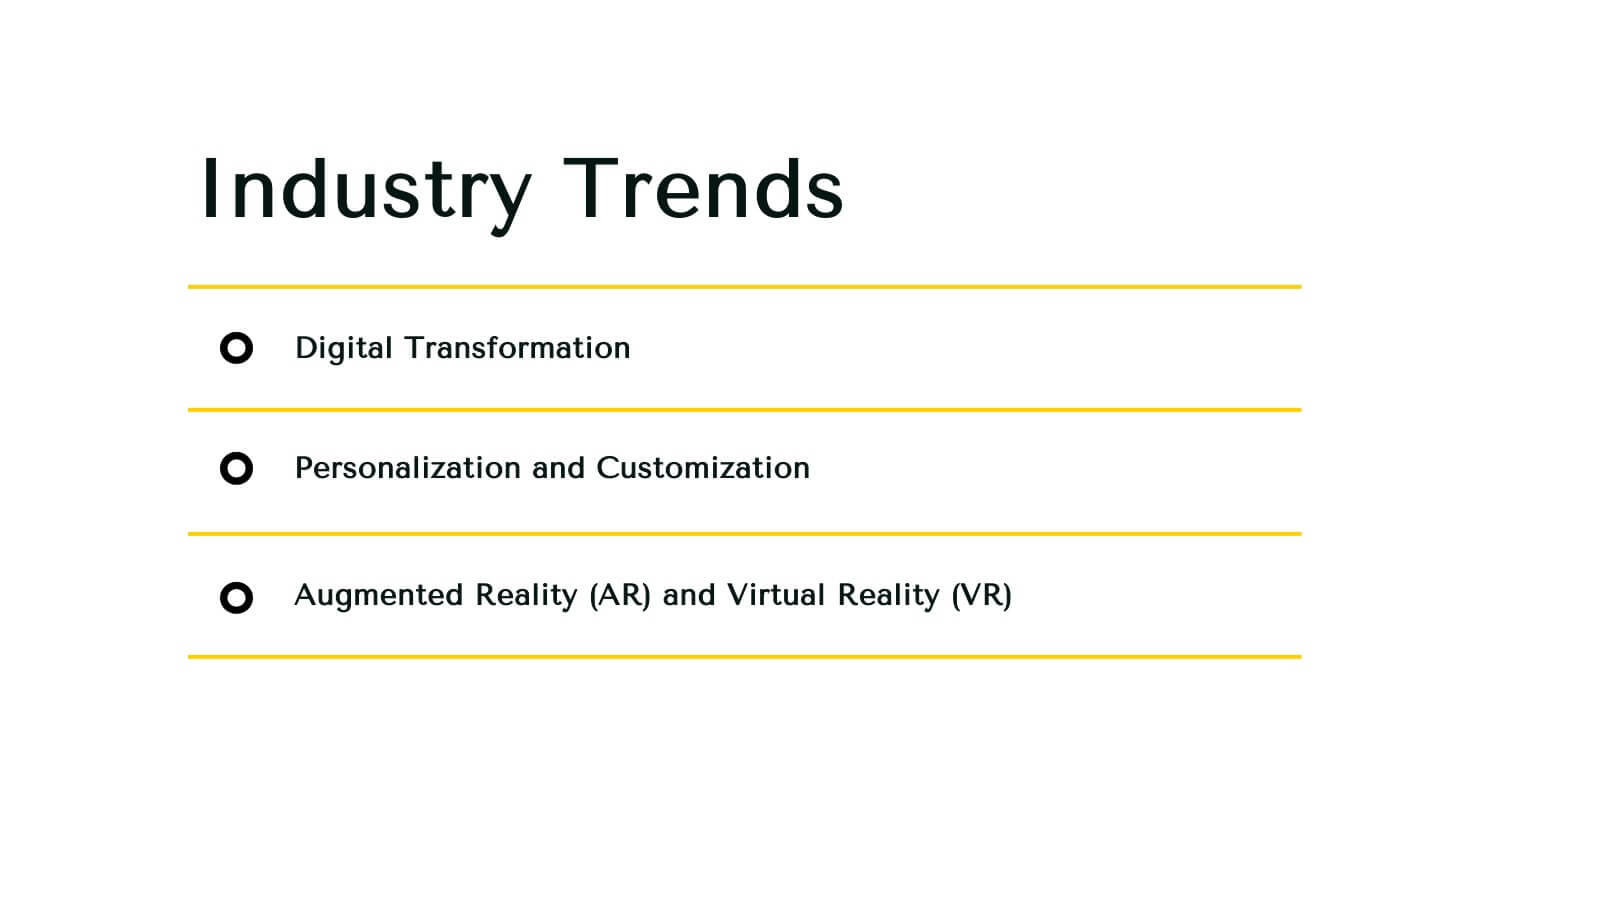
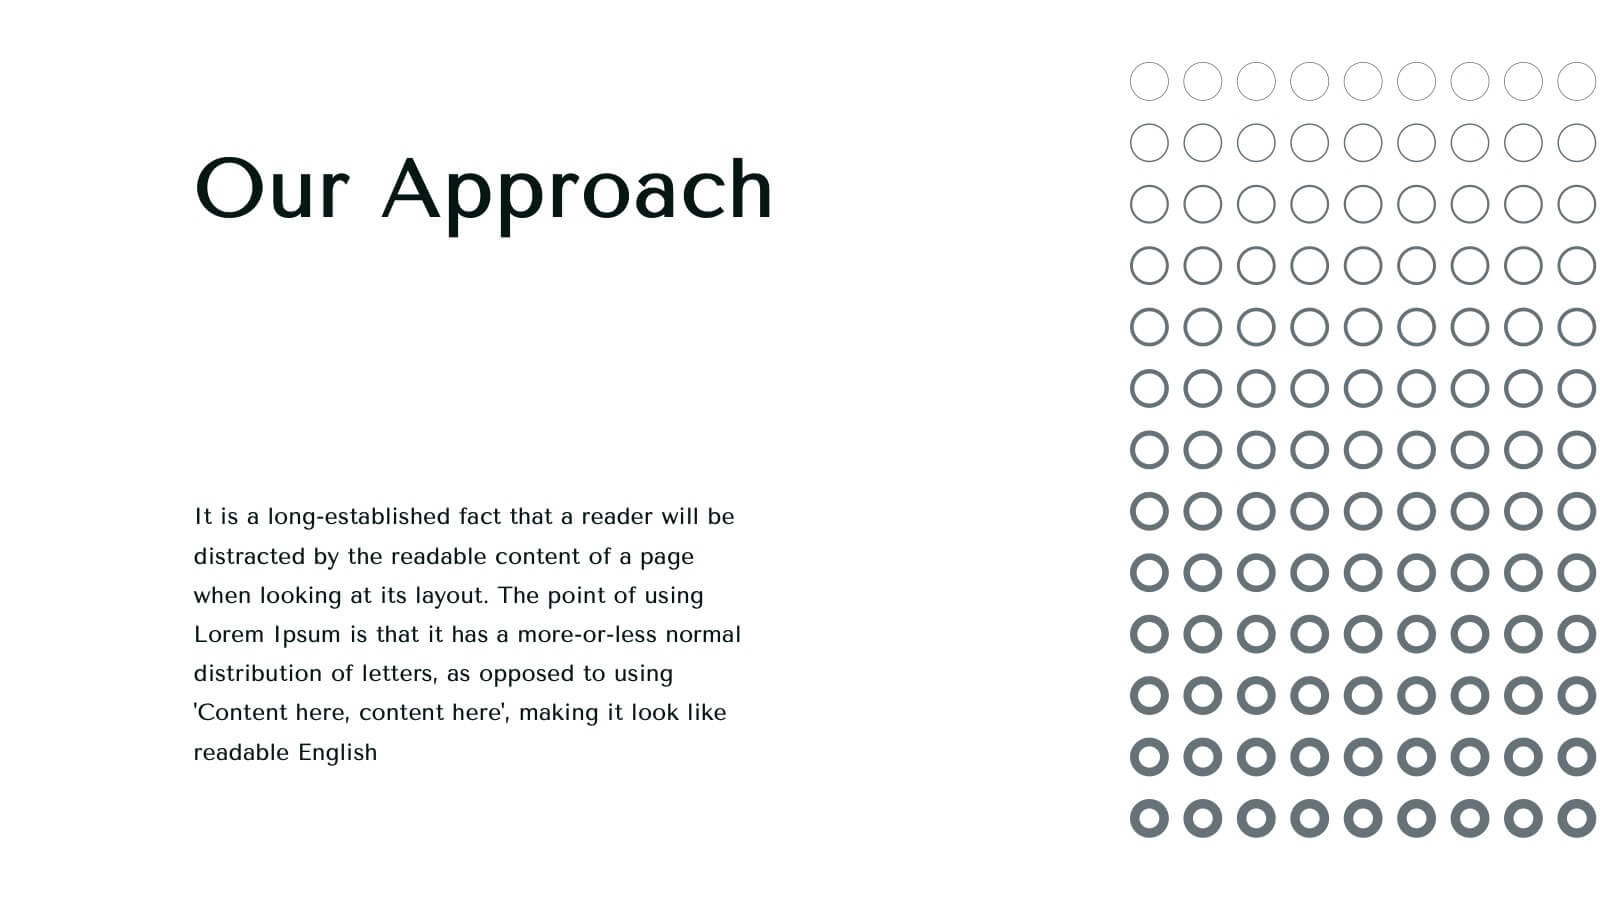
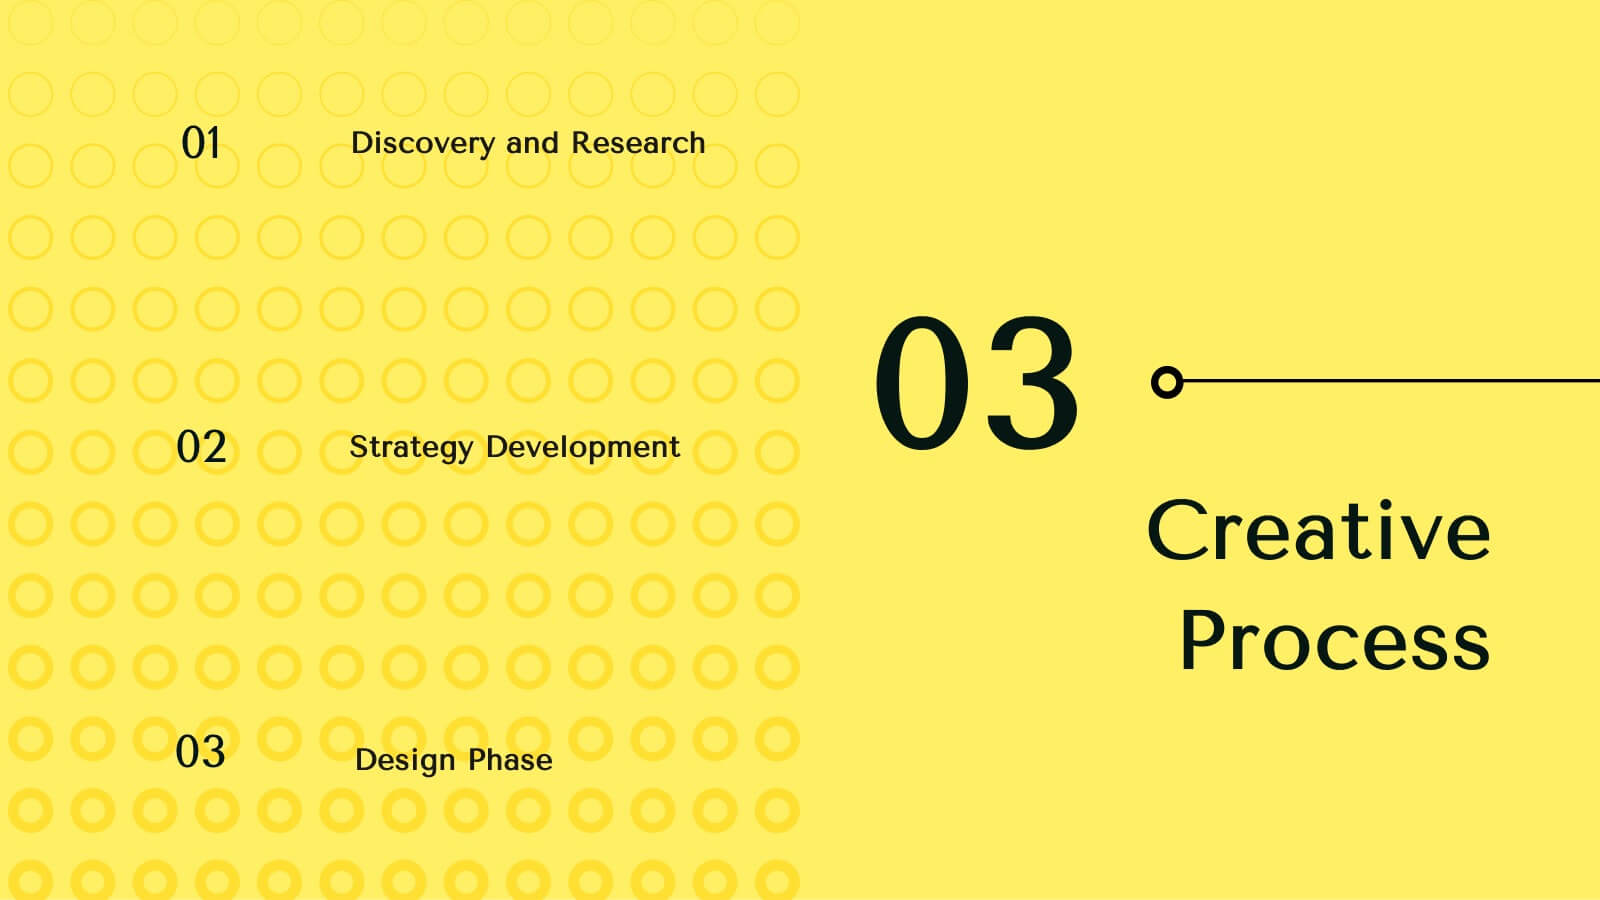
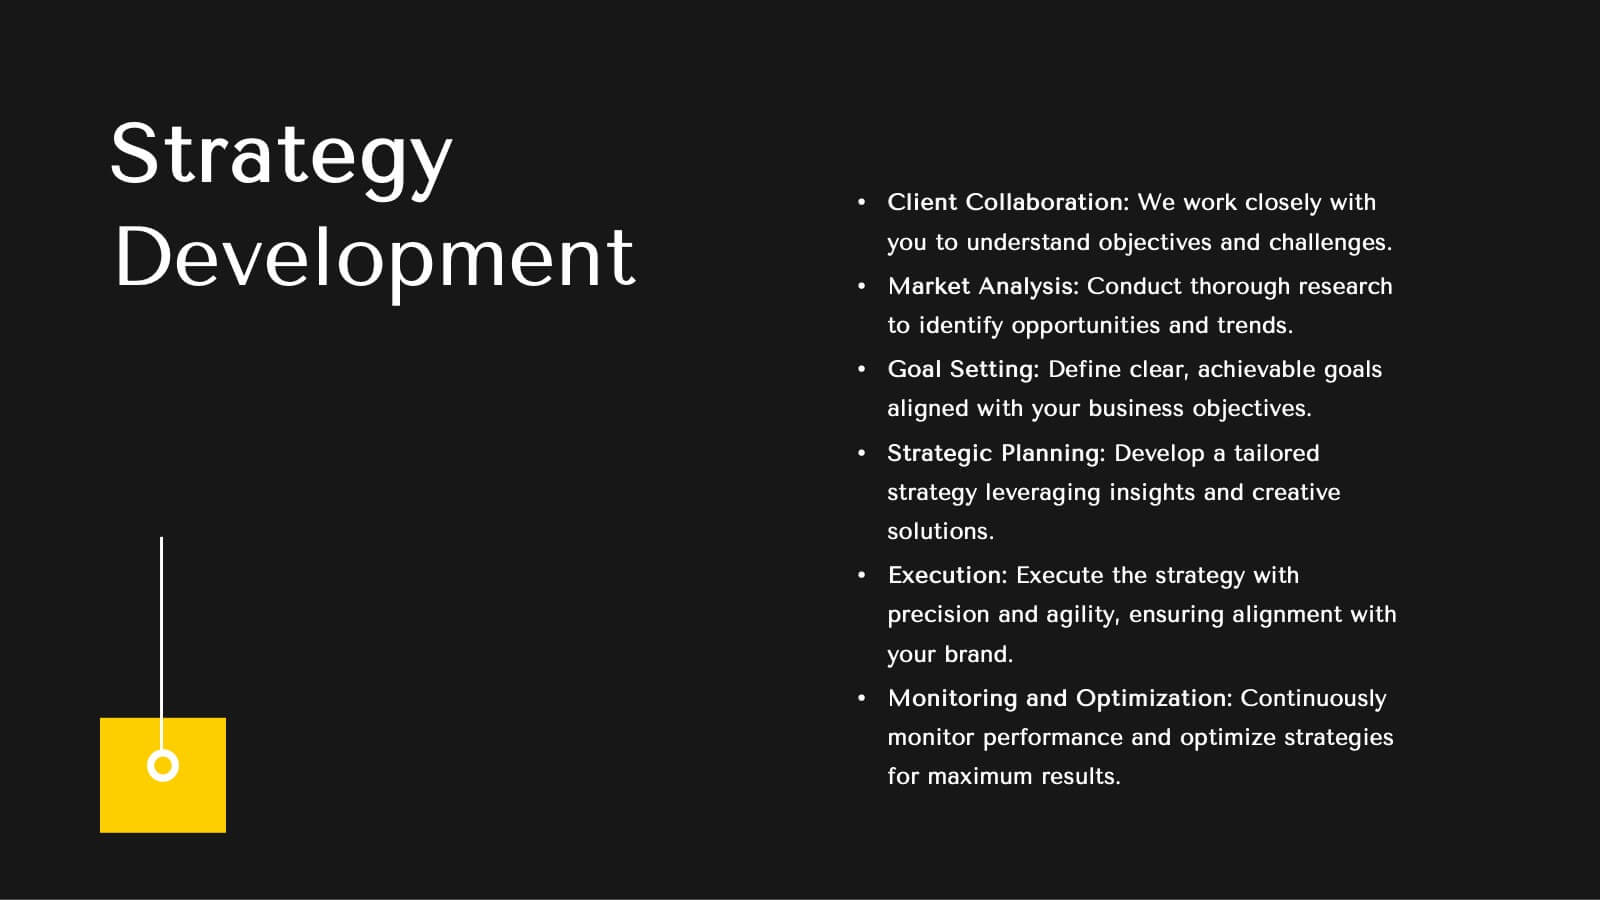
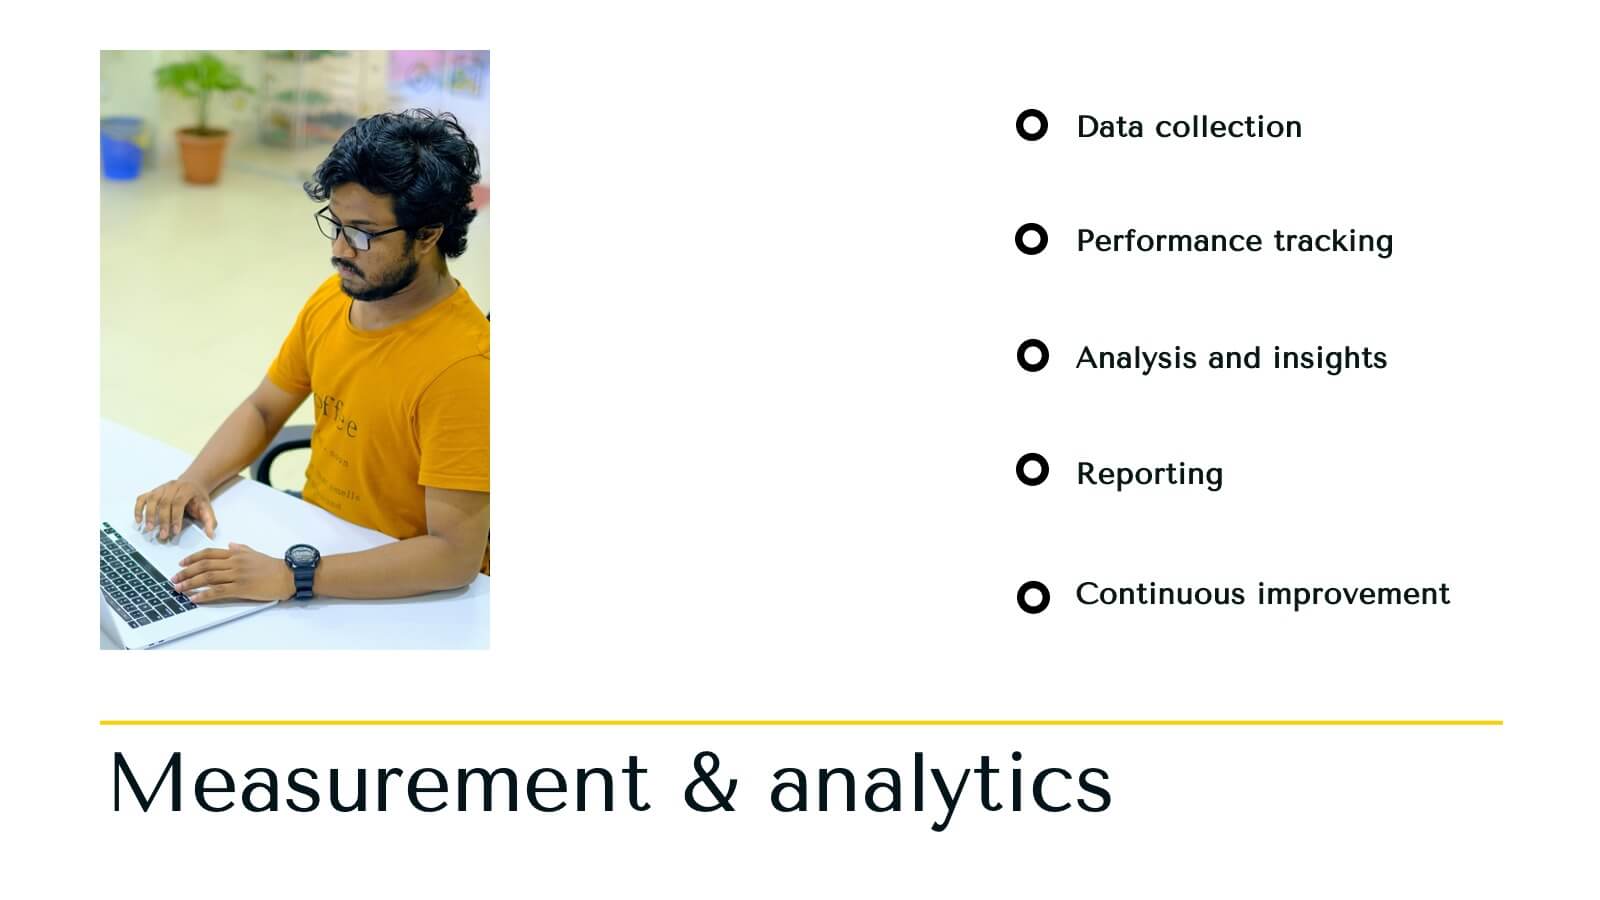
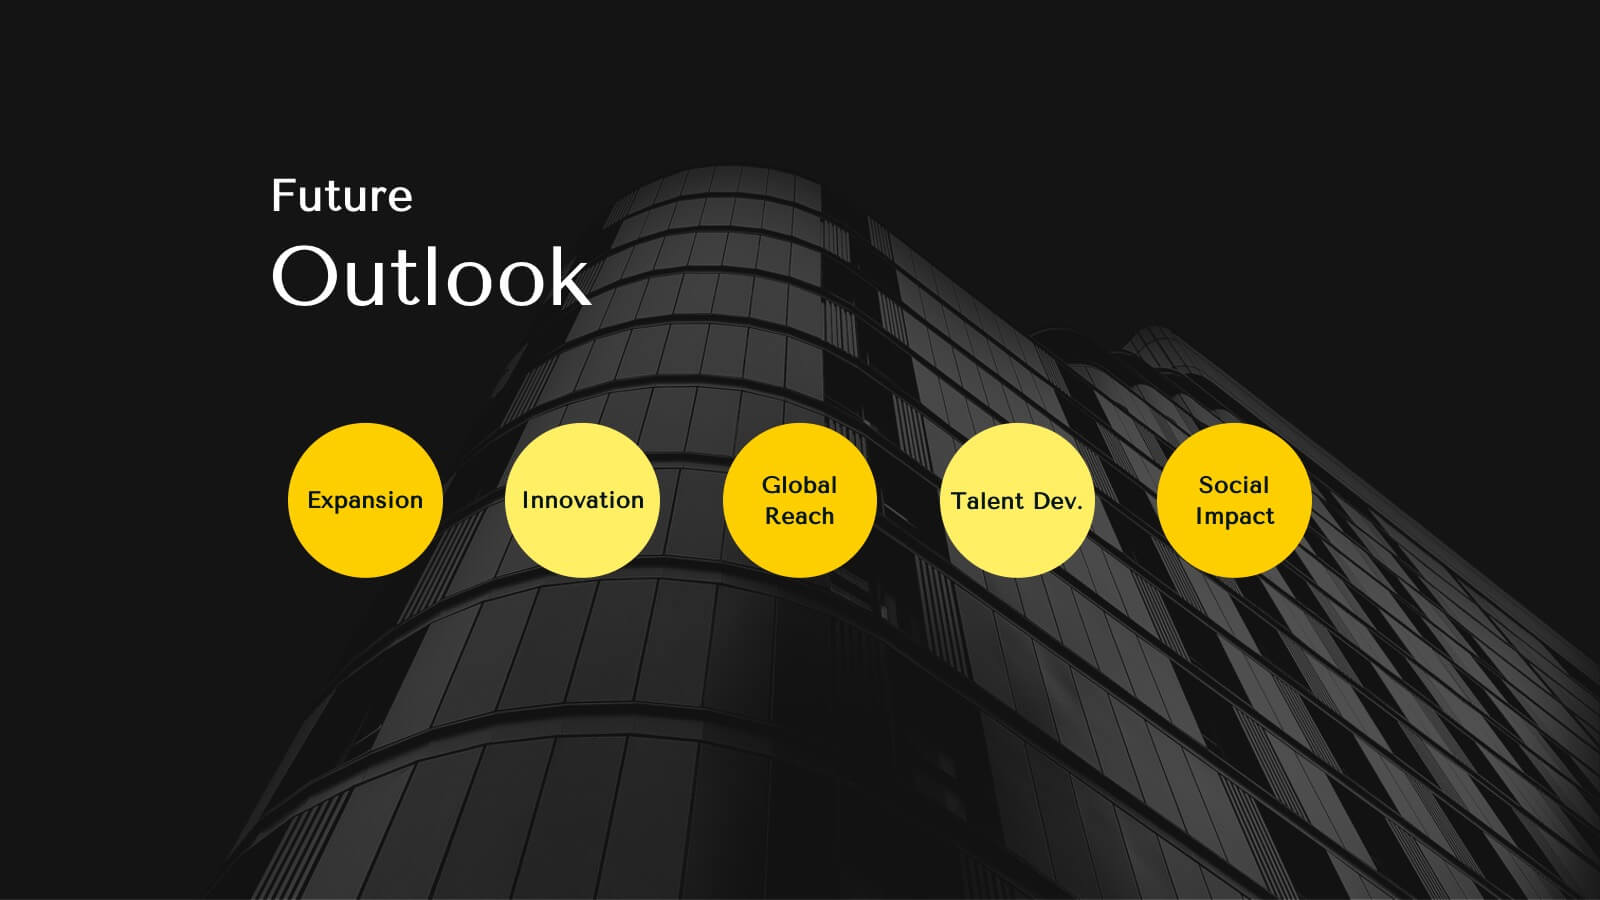
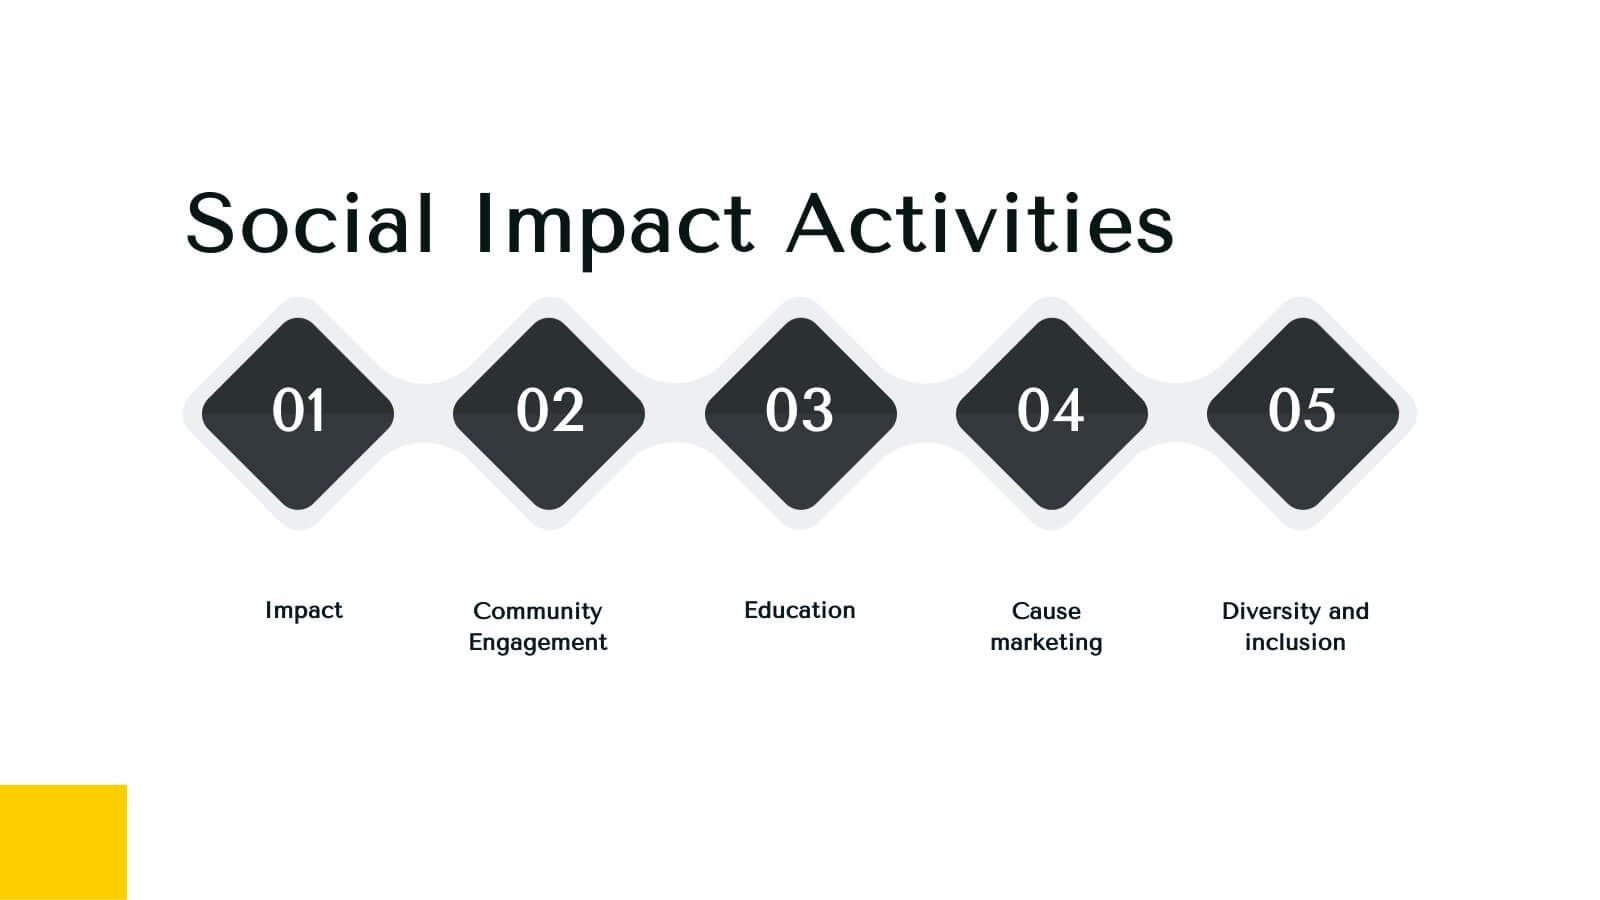
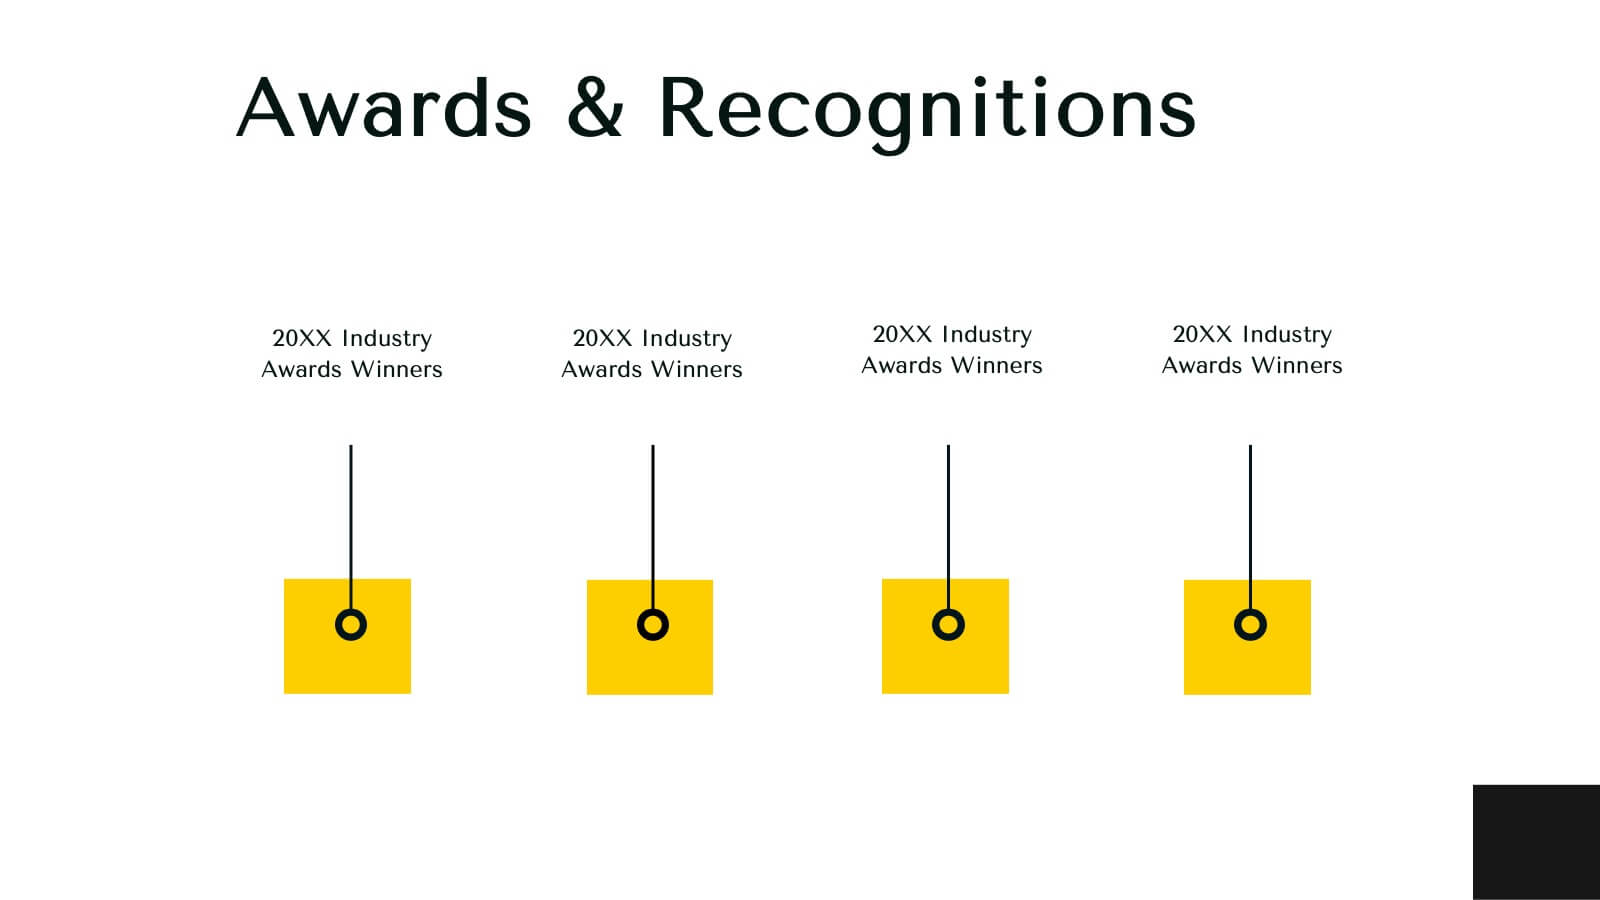
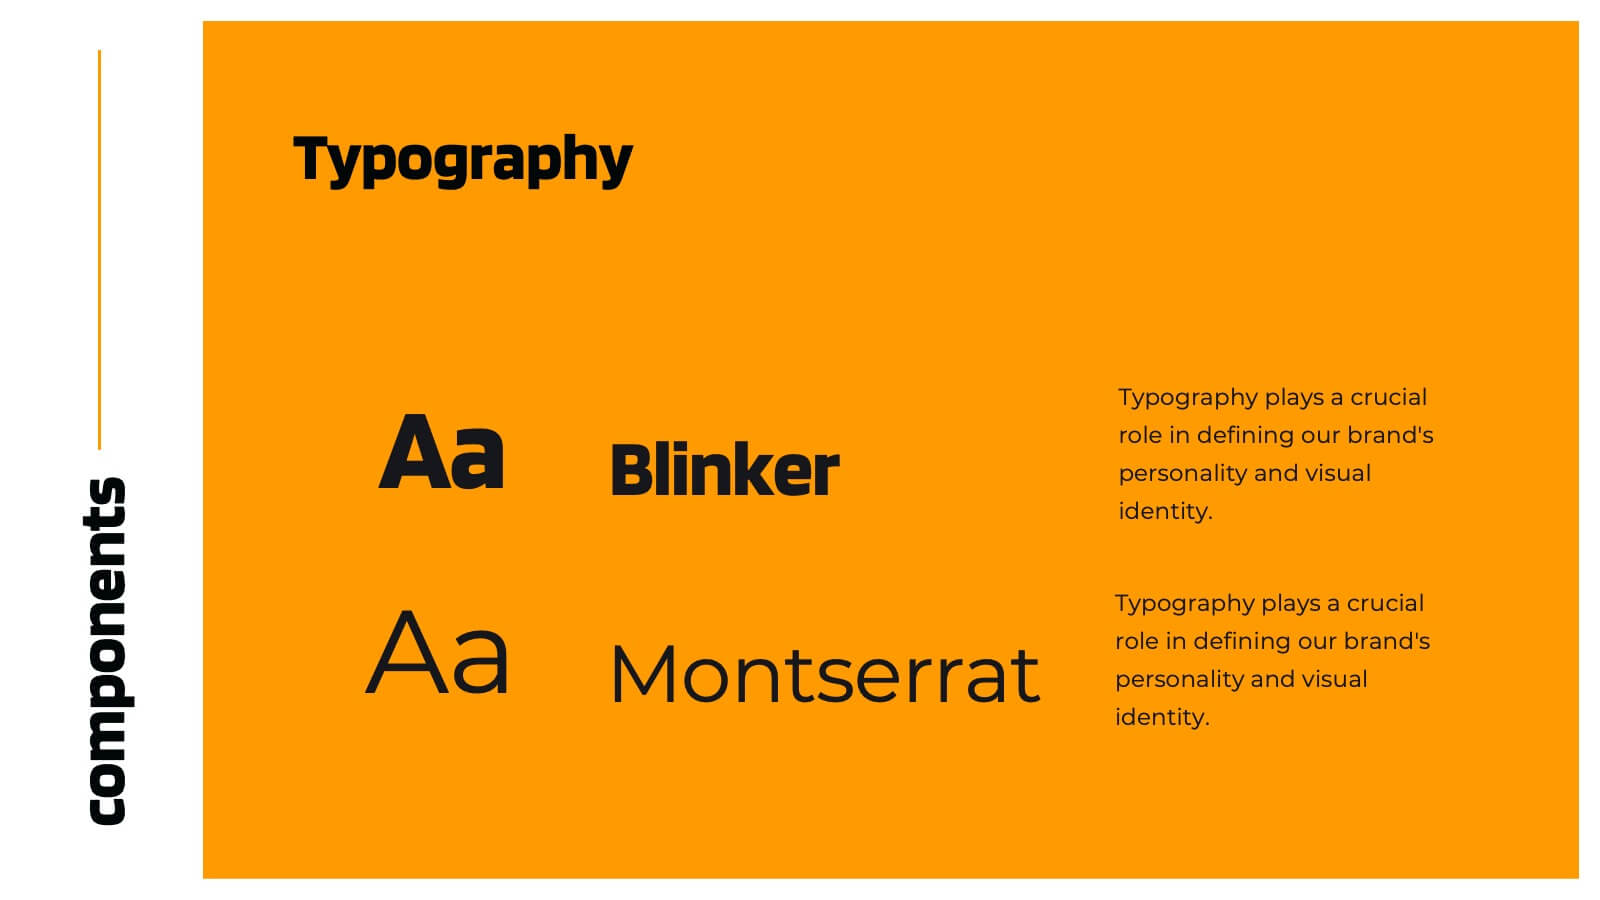
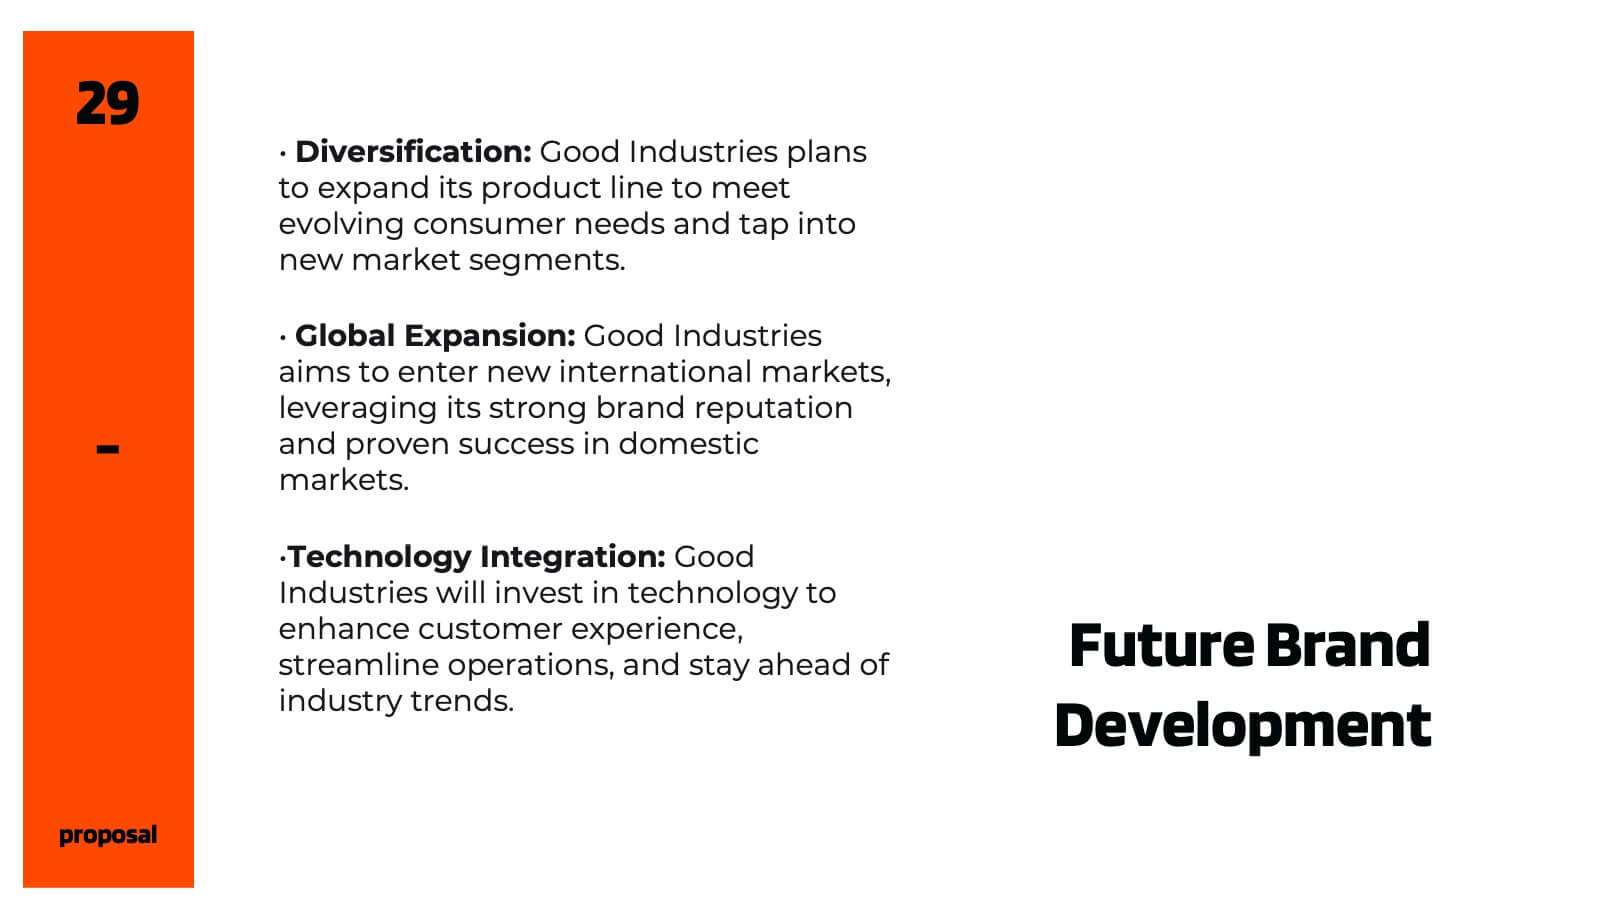
Infinity Agency Portfolio Presentation
Showcase your agency's excellence with this dynamic and modern presentation template. Ideal for presenting market analysis, client success stories, and strategic development plans, it features a bold design with a vibrant yellow and black theme. Highlight your unique approach and creative process to captivate your audience. Compatible with PowerPoint, Keynote, and Google Slides, it's perfect for any platform.


6 diapositivas
Professional Company Portfolio Presentation
Showcase Your Business Success with a Sleek Portfolio! The Professional Company Portfolio template is designed to highlight key achievements, performance metrics, and strategic insights with a modern, image-driven layout. Featuring three visually appealing sections, this template allows you to present KPIs, revenue growth, and business milestones in a compelling and structured way. Fully customizable in PowerPoint, Keynote, and Google Slides, this portfolio template is perfect for presentations, investor updates, and corporate showcases.


26 diapositivas
Financial Planning Essentials Presentation
Take control of your financial destiny with our Financial Planning Essentials presentation template, suitable for PowerPoint, Keynote, and Google Slides. This template is meticulously designed for financial advisors, planners, and anyone seeking to educate on the principles of sound financial management. Our Financial Planning Essentials template is a rich resource that provides an extensive range of slides to explain the basics of financial planning, investment strategies, and wealth management. It allows you to break down financial concepts into easy-to-understand elements, making it perfect for client presentations, financial workshops, and educational seminars. Featuring customizable diagrams, charts, and financial models, the template enables a personalized approach to presenting financial data and strategies. Whether you're outlining budgeting techniques, investment plans, or retirement strategies, this template helps you communicate complex information in a clear and professional manner. Optimize your financial planning presentations with our SEO-friendly template to become a trusted resource in financial education and planning. Lead your audience toward financial freedom with a comprehensive and engaging presentation that simplifies the path to financial success.


30 diapositivas
Chromalight Brand Guidelines Proposal Presentation
Elevate your brand's story with this visually engaging presentation template that embodies modern, professional aesthetics. From mission and vision statements to brand identity and market positioning, each slide is crafted to showcase your brand's core essence. Ideal for brand strategists and marketers, this template is compatible with PowerPoint, Keynote, and Google Slides.


6 diapositivas
Business Process Flowchart Presentation
Streamline your workflow with the Business Process Flowchart presentation. This structured and visually engaging template helps you map out processes, optimize efficiency, and improve communication within your team. Designed for business analysts, managers, and strategists, this fully editable slide ensures clarity in decision-making and operations. Compatible with PowerPoint, Keynote, and Google Slides.


6 diapositivas
Growth Chart Infographic
A growth chart is a visual representation that shows the progress of an individual's growth over time. This infographic template is a visual representation that illustrates the growth and progress of various elements over time. These infographic charts are important tools to monitor growth patterns and help detect any potential issues. This growth chart infographic helps convey trends and insights in a clear and engaging manner. This template is compatible with Powerpoint, Keynote, and Google Slides. Allowing you to keep the design clean, easy to understand, and aligned with the message you want to convey.


4 diapositivas
Modern 3D Business Diagram
Bring a fresh, dimensional twist to your business strategy with this modern 3D layout. Featuring interlocking puzzle elements on a tilted grid, this slide is perfect for showcasing interrelated departments, processes, or multi-stage plans. Compatible with PowerPoint, Keynote, and Google Slides.


6 diapositivas
Technology Stack and Platform Design
Visualize your full tech ecosystem with the Technology Stack and Platform Design Presentation. This layered pyramid layout helps you break down five key platform levels, from cloud services to core infrastructure. Clean, professional, and fully editable in PowerPoint, Keynote, and Google Slides for seamless customization. Ideal for developers and IT teams.


20 diapositivas
Whisper Creative Portfolio Presentation
The Creative Portfolio Presentation Template is a visually striking 20-slide design, ideal for showcasing your professional work or services. It features slides for introductions, about us, portfolio overviews, and individual project highlights. Key sections include philosophy, style, creative process, client testimonials, awards, and pricing structures. The vibrant yellow and pink gradient elements provide a modern, creative flair that grabs attention. Fully customizable and compatible with PowerPoint, Keynote, and Google Slides, this template is perfect for designers, agencies, and freelancers aiming to present their work professionally and uniquely.


5 diapositivas
Financial Growth and Spending Overview Presentation
Visualize financial progress with this clean, step-based diagram. Each stage highlights growth or spending insights using stacked icons and upward arrows for easy interpretation. Perfect for reports, planning, or forecasts. Fully editable in Canva, PowerPoint, and Google Slides, it brings structure and clarity to your financial storytelling.


6 diapositivas
Three-Part Comparative Venn Layout Presentation
Showcase relationships, overlaps, and distinctions across three core elements with this elegant petal-style Venn layout. Perfect for comparing strategies, audiences, or product features. Each section includes customizable labels and icons. Fully editable in PowerPoint, Keynote, and Google Slides—ideal for business analysis, educational presentations, and marketing plans.