


Características


¿Tienes alguna pregunta?
Recomendar


7 diapositivas
Hierarchy Needs Infographic
The Hierarchy of Needs, is a framework that categorizes human needs into five levels, often depicted as a pyramid. This visually engaging infographic template lays out the psychological journey each individual undertakes, climbing the pyramid of needs towards a successful life. Compatible with Powerpoint, Keynote, and Google Slides. Utilize visual elements to guide your audience in understanding their unique journey through the hierarchy, highlighting the importance of each stage. This template will guide you through the layers of hierarchy within organizations, providing an understanding of leadership and organizational structure.


5 diapositivas
Performance Scaling Overview Presentation
Illustrate performance development with this sleek layered pyramid chart. Designed to visualize growth stages, team levels, or scaling strategies, each tier includes editable text and icons for clarity. Ideal for business reviews, capability mapping, or operational planning. Fully customizable in PowerPoint, Keynote, and Google Slides for effortless updates.


10 diapositivas
Agile Scrum Framework Presentations
Kickstart your workflow with a clear, energetic layout designed to simplify complex processes and highlight each stage of your agile cycle. This presentation explains how iterative teamwork, transparency, and fast delivery shape efficient project management. Clean visuals guide viewers through structured steps. Compatible with PowerPoint, Keynote, and Google Slides.


6 diapositivas
Restaurant Menu and Culinary Brand Presentation
Present your culinary identity with the Restaurant Menu and Culinary Brand Presentation. This template offers a clean layout with five customizable icons and text areas—ideal for showcasing your menu highlights, brand values, or dining experience. Perfect for chefs, restaurants, or food entrepreneurs. Fully editable in PowerPoint, Canva, and Google Slides.


5 diapositivas
Bar, Line, and Pie Chart Combo Layout Presentation
Present multiple data points in one sleek slide with the Bar, Line, and Pie Chart Combo Layout Presentation. This template merges three essential chart types—bar, line, and pie—into a cohesive, easy-to-read format, ideal for reports, comparisons, or trends. Fully editable in PowerPoint, Keynote, Canva, or Google Slides.


5 diapositivas
Company Hierarchical Structure Presentation
Effectively illustrate your company's hierarchy with this Company Hierarchical Structure infographic template. Designed to clarify leadership and team roles, this slide is ideal for corporate presentations, HR onboarding, and management reports. Fully customizable in PowerPoint, Keynote, and Google Slides, ensuring seamless integration with your branding and content needs.


5 diapositivas
Office Collaboration Illustration Pack Presentation
Visualize modern teamwork with this sleek office collaboration layout. Ideal for showcasing brainstorming sessions, decision-making flows, or team communication, this illustration-driven template is perfect for business updates, internal strategy briefs, or workflow discussions. Fully editable and compatible with PowerPoint, Keynote, and Google Slides.


26 diapositivas
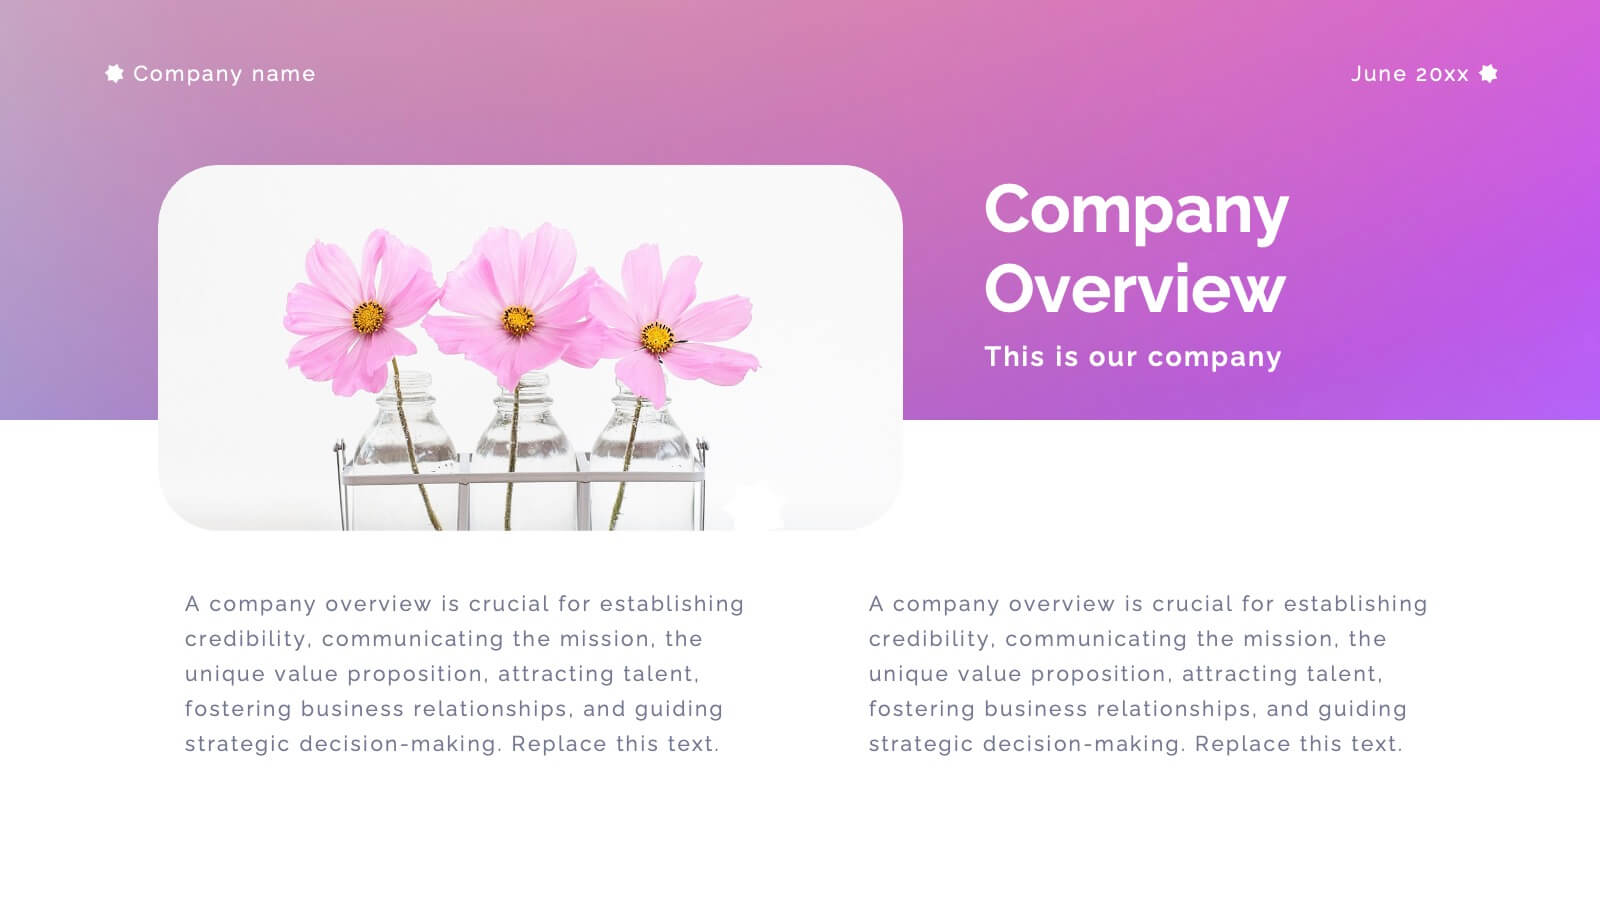
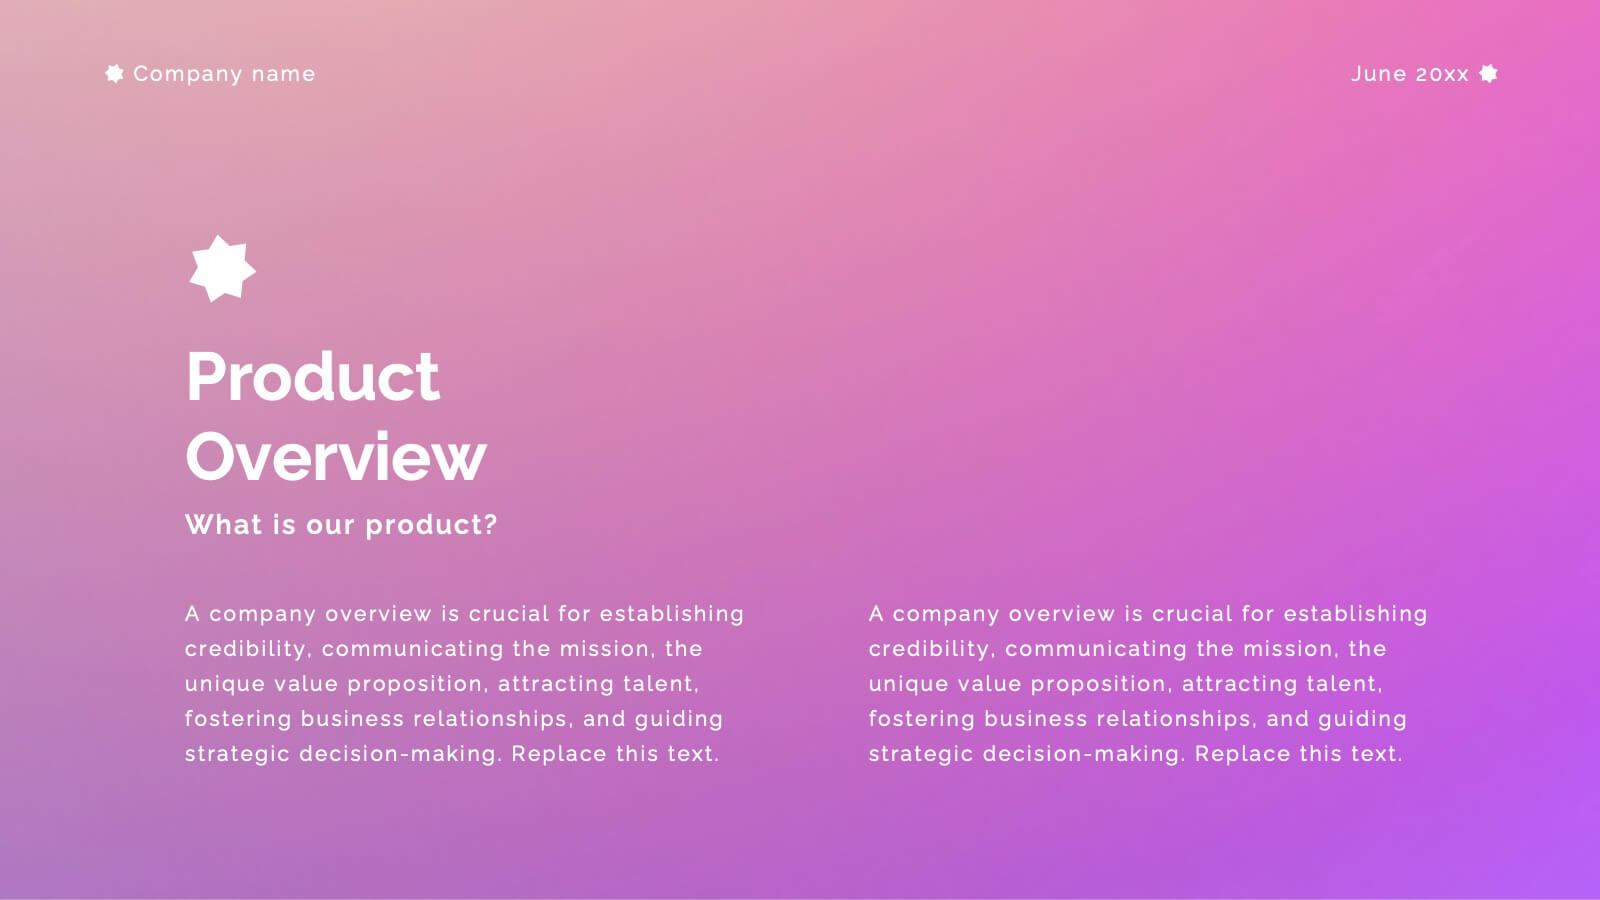
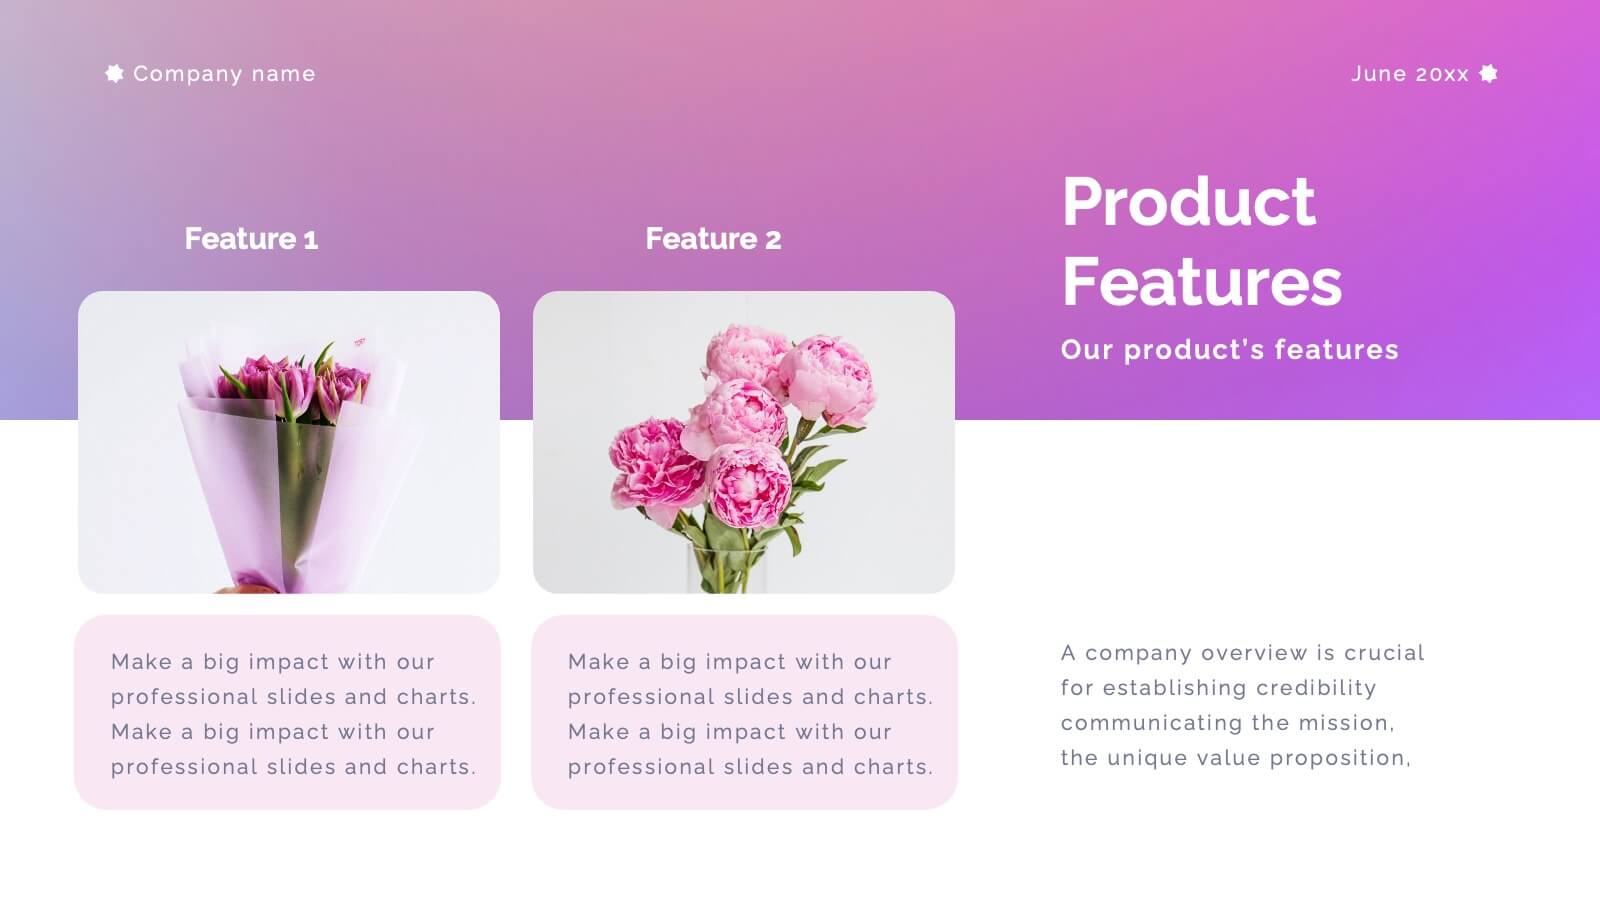
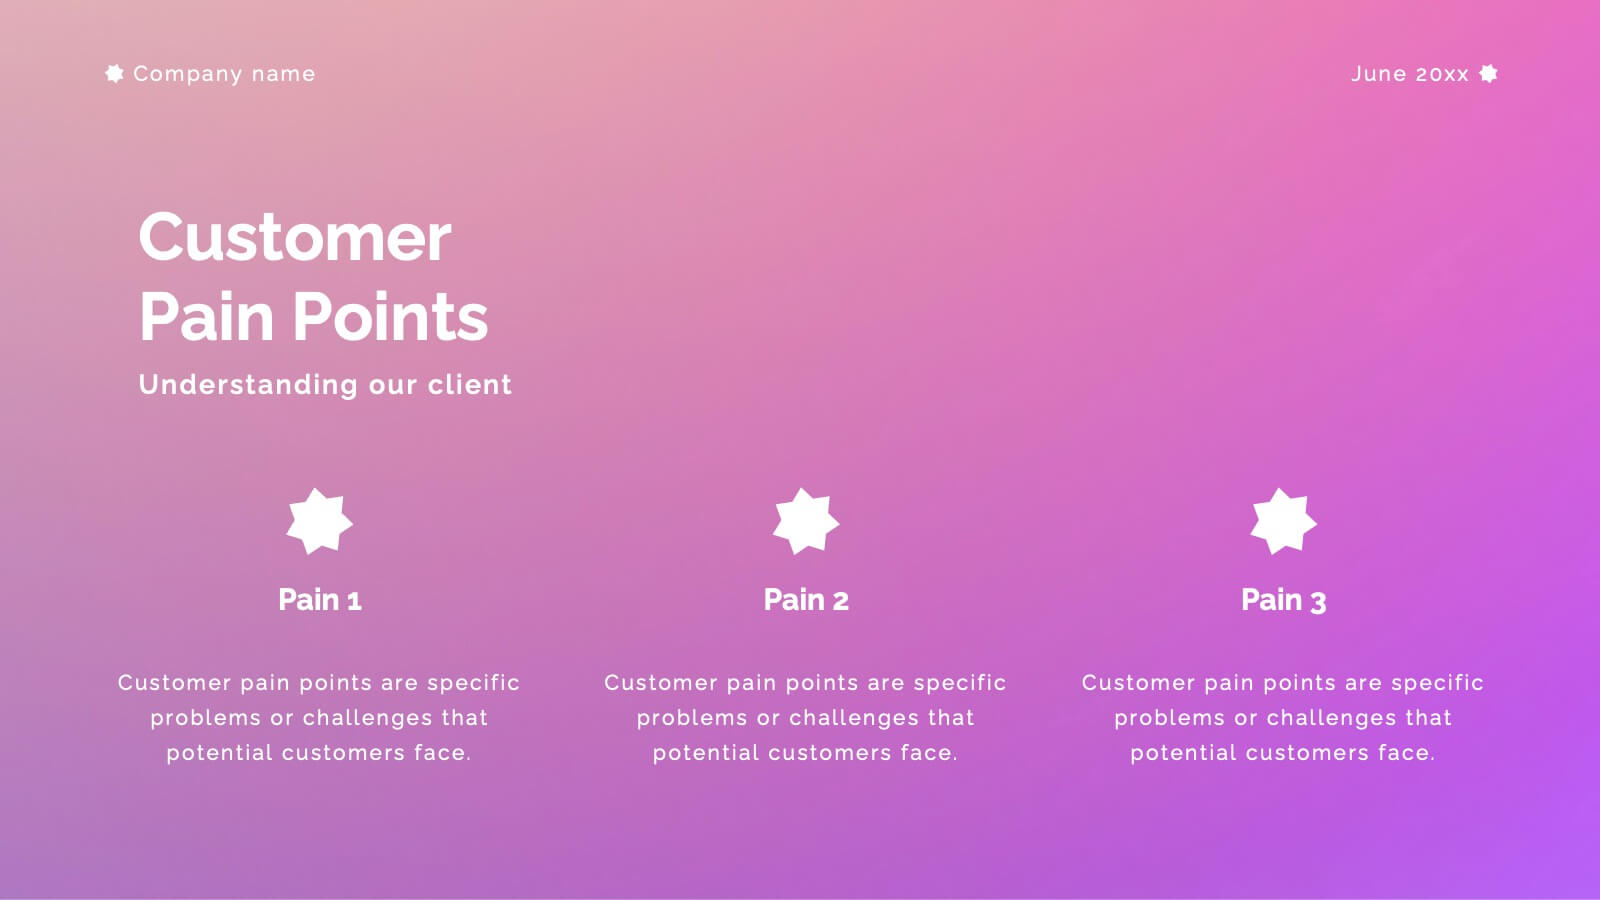
Melo Presentation Template
Are you looking for a presentation to make your product stand out? Melo is a beautifully elegant presentation with modern elements and light neutral color palette. Perfect for furniture brands, or any one looking for a modern presentation. These slides include world maps, company slides, mockups and charts perfect for businesses, this template has everything you'll need. It's simple yet chic design makes it stand out and at the same time keep your audience engaged. This is the perfect choice for businesses, brands or anyone who needs to make a great looking template on their next presentation


5 diapositivas
Data Breach Infographics
A data breach refers to an incident where unauthorized individuals gain access to sensitive, confidential, or protected information. This infographic is designed to educate and raise awareness about data breaches, their causes, impacts, and preventive measures. It presents complex information in an understandable way, making it accessible to a wide range of audiences. The template incorporates relevant statistics and data to provide a comprehensive understanding of the prevalence and scale of data breaches. It includes graphs, charts, and infographics to visualize the frequency, magnitude, and industries most affected by data breaches.


6 diapositivas
Product Mockup Infographic
Showcase your products with unparalleled clarity using this collection of product mockup templates. Designed for versatility and impact, each template provides a vivid representation of your products on various digital devices, emphasizing detail and design with a polished, professional finish. These mockups are ideal for demonstrating the user interface and user experience aspects of digital products like apps, websites, and software. The templates feature intuitive layouts and a harmonious blend of colors that enhance the visual appeal while keeping the focus on your product's features. Customize each mockup with your own screenshots and descriptions to create a compelling presentation that speaks directly to your audience's needs. Ideal for tech startups, software developers, and digital marketers, this collection helps you communicate the value of your products in a straightforward yet captivating manner, whether for client presentations, marketing materials, or investor pitches.


5 diapositivas
Data Distribution with Pie Chart Visuals Presentation
Visualize complex metrics with ease using the Data Distribution with Pie Chart Visuals Presentation. This slide design integrates a clean side-by-side layout of a colorful pie chart and a five-point legend, making it ideal for showcasing proportions, segments, or performance breakdowns. Each item features an icon and customizable text to clearly label your data points. Perfect for business analysts, marketers, and financial teams, the slide is editable in PowerPoint, Keynote, and Google Slides. It’s a great choice for delivering data-driven insights in a simple, visual format.


20 diapositivas
Aurorium Sales Proposal Presentation
Win over clients with confidence using this sleek and modern sales proposal presentation. Designed to highlight key business strategies, pricing plans, competitive analysis, and future opportunities, this template helps you communicate your value with clarity and impact. Fully customizable and compatible with PowerPoint, Keynote, and Google Slides for seamless presentations.


5 diapositivas
Strategic Planning Model Presentation
Align your vision with action using the Strategic Planning Model Presentation. This pyramid-based slide design is ideal for breaking down your long-term strategy into four structured, actionable layers. From foundational ideas to top-level goals, each tier includes space for clear, concise business insights. Fully customizable and compatible with PowerPoint, Keynote, and Google Slides for seamless editing.


5 diapositivas
SMART Objective Planning for Success Presentation
Turn your goal-setting process into a clear, actionable strategy with this SMART Objective Planning slide. Designed around the SMART framework—Specific, Measurable, Achievable, Relevant, Time-bound—this layout helps you articulate objectives with clarity and focus. Each segment features a bold letter with icons and editable descriptions beneath. Ideal for planning sessions, strategic reviews, and team alignment meetings. Compatible with PowerPoint, Keynote, and Google Slides.


26 diapositivas
Tempo Brand Identity Presentation
Introduce and elevate your brand with this versatile presentation template designed to reflect your company's vision and values. Perfect for businesses looking to showcase their brand strategy, components, and touchpoints with clarity and professionalism. This presentation features thoughtfully designed slides covering brand identity components, visual guidelines, target audience insights, and future development plans. Use dedicated sections to outline your unique selling proposition, positioning, and strategy. With its clean layout and attention to detail, it's ideal for presenting a cohesive and impactful brand narrative. Compatible with PowerPoint, Google Slides, and Keynote, this template is fully customizable. Edit colors, text, and images to align with your brand aesthetics and messaging. Deliver your presentation with confidence, ensuring your audience is inspired by a polished and professional brand identity.


21 diapositivas
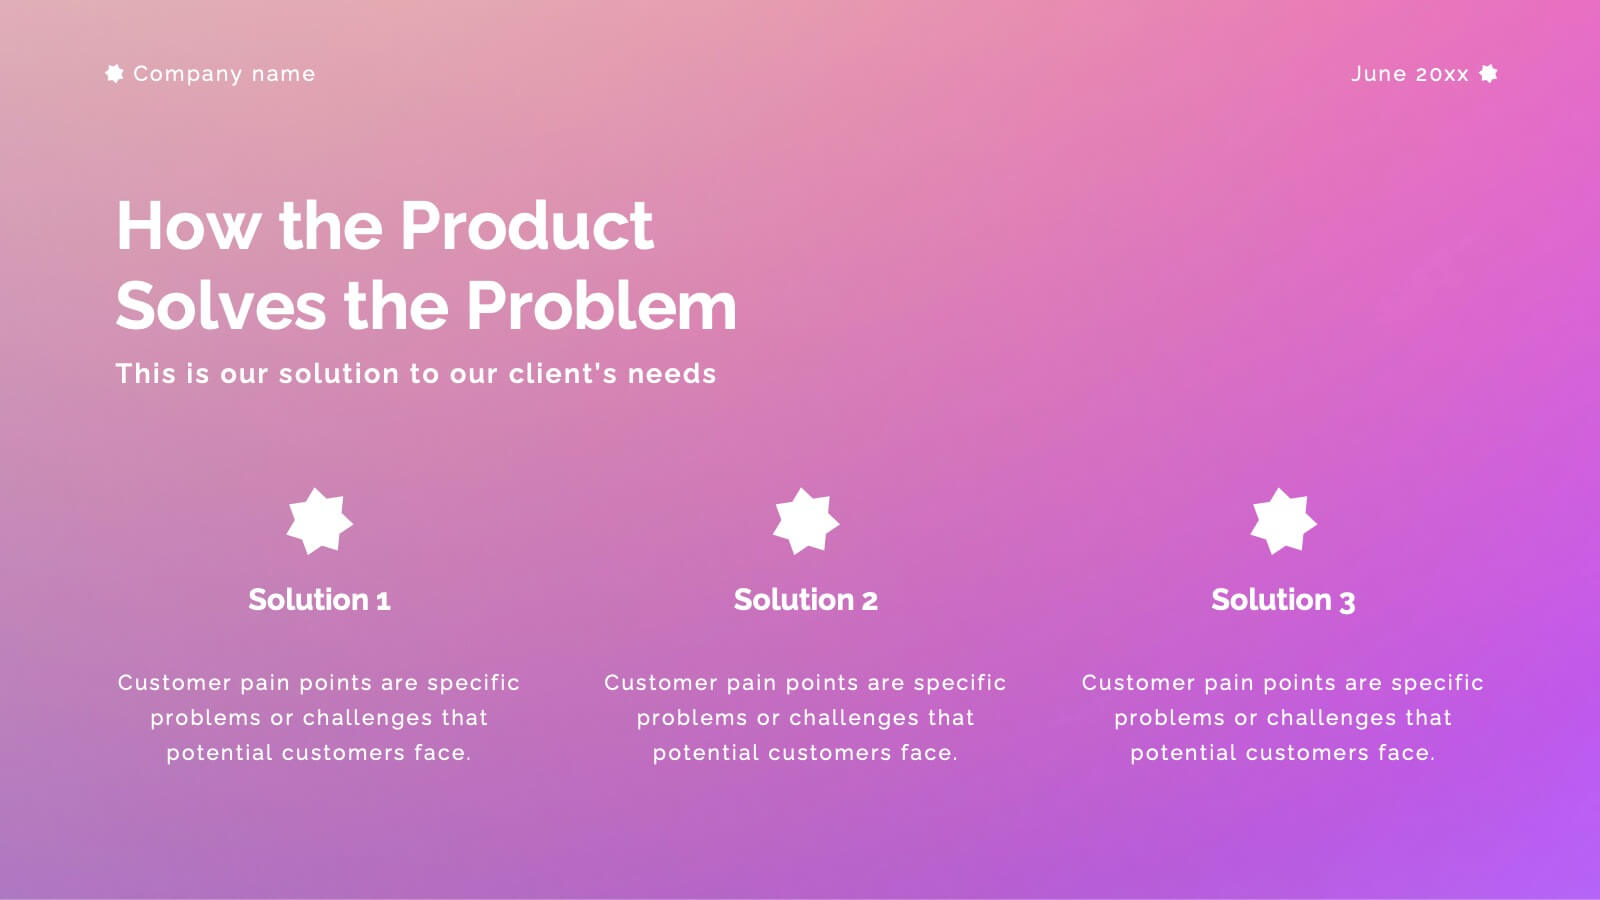
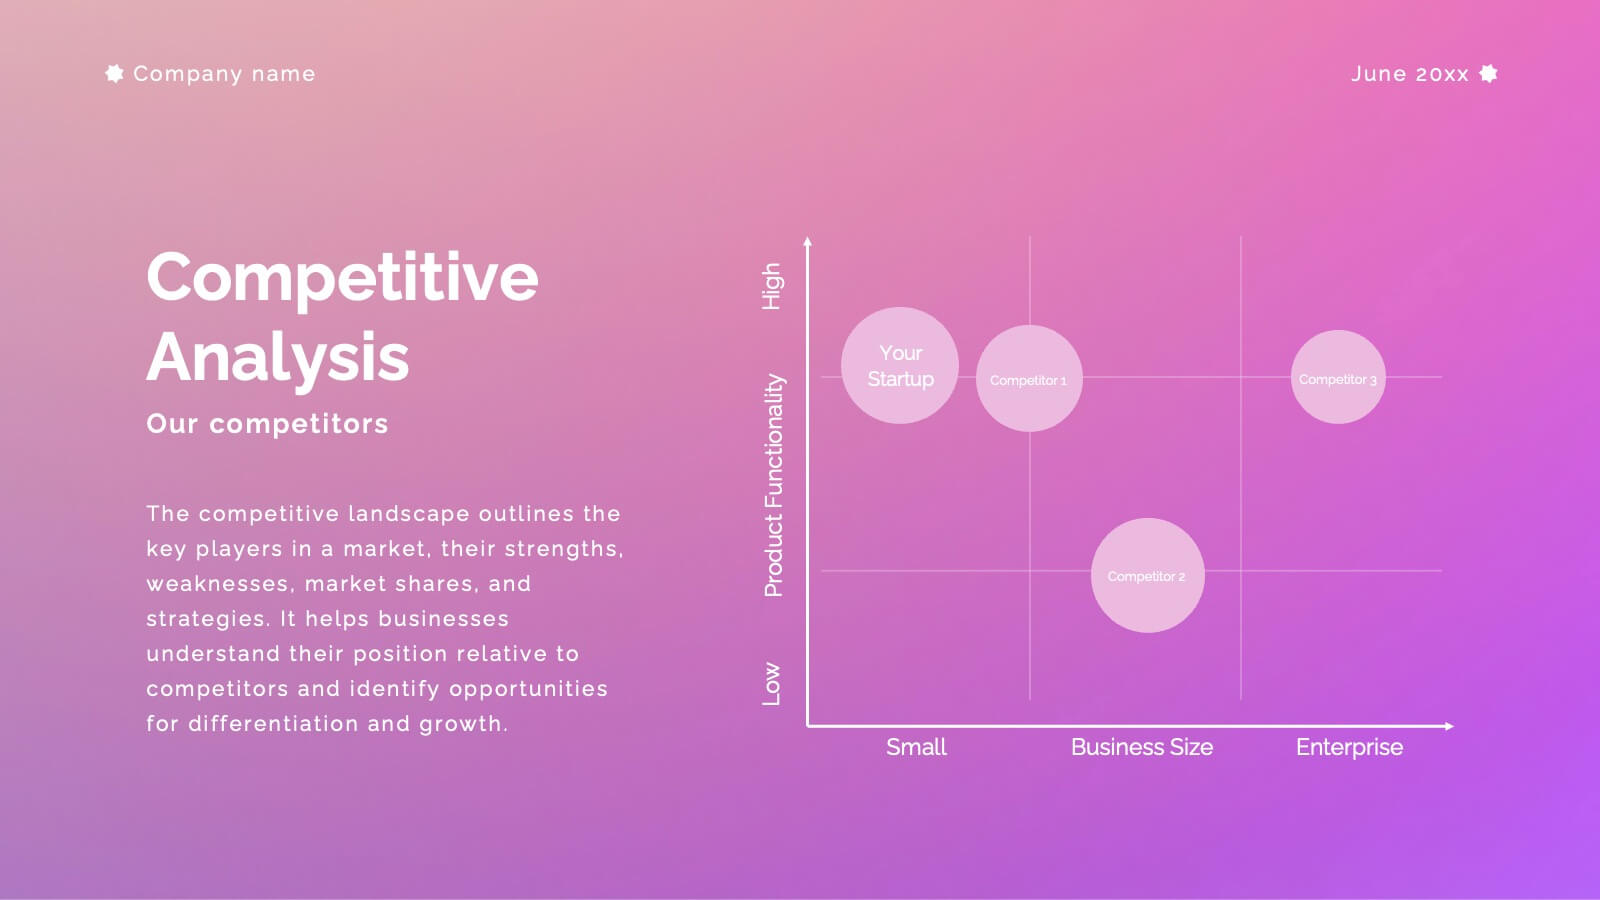
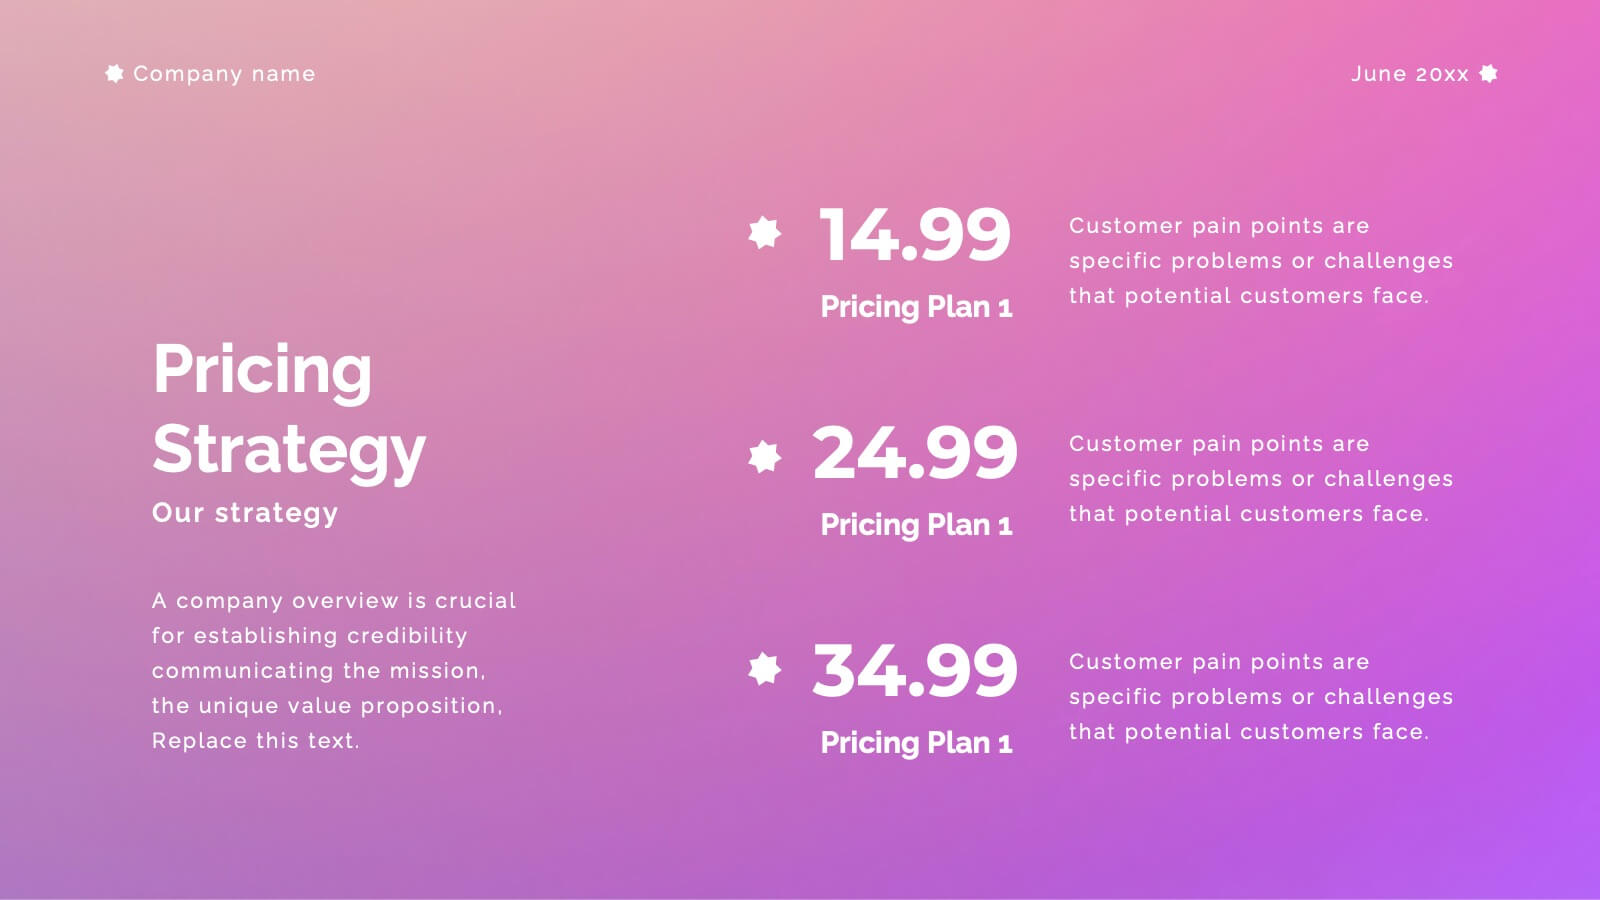
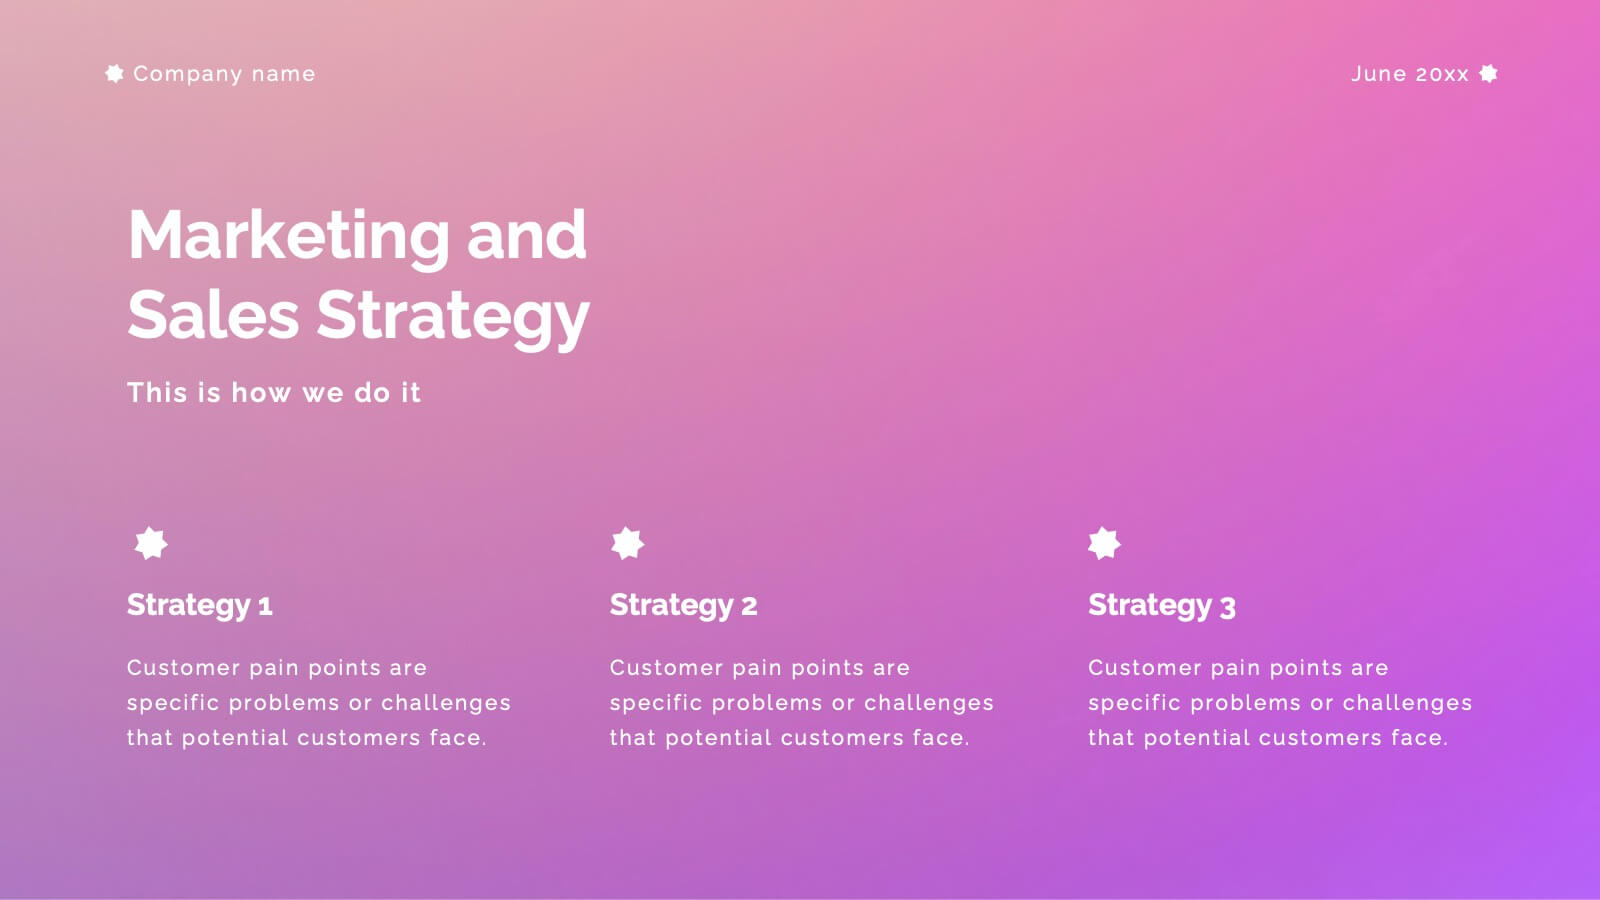
Aventurine New Product Proposal Presentation
Showcase your product in style with this vibrant and modern product proposal template! It covers everything from product features to target market, pricing strategy, and marketing plans. Designed for clarity and impact, it's perfect for pitching your product. Fully customizable, and compatible with PowerPoint, Keynote, and Google Slides for seamless presentations.


7 diapositivas
Value Chain Activity Infographic Presentation
A Value Chain Infographic is a visual representation of the various activities and processes that a company uses to create and deliver a product or service to its customers. This template is a perfect way to analyze a company's competitive advantage by breaking down its activities into primary and support activities. This template includes a series of connected components, each representing a activity or process in the value chain. This infographic includes diagrams, charts, and other visual elements to help explain the flow of goods and services through the various stages of the value chain.