


Características


¿Tienes alguna pregunta?
Recomendar


3 diapositivas
Project Completion Checklist Presentation
Keep projects on track with the Project Completion Checklist template. This structured layout helps you monitor tasks, update statuses, and document progress seamlessly. Featuring status indicators, date tracking, and notes sections, this template enhances productivity and organization. Fully customizable and compatible with PowerPoint, Keynote, and Google Slides for effortless use.


4 diapositivas
Market Expansion Planning with Blue Ocean Presentation
Visualize your growth journey with this two-step strategic layout. Ideal for presenting current positioning and future market opportunities using Blue Ocean thinking. Each step is illustrated with bold icons and color-coded nodes. Fully editable in PowerPoint, Keynote, and Google Slides—perfect for business development, strategy sessions, and executive presentations.


6 diapositivas
Body Anatomy Infographic
Anatomy refers to the biological structures and systems that make up the body reproductive and organs, as well as other physiological unique features. This infographic template is a visual representation that provides information about the various structures and systems within the anatomy. This can be a valuable educational tool for understanding the anatomy and functions of reproductive and other related systems. This informative Anatomy Infographic can serve as a valuable resource for educational settings, healthcare professionals, and anyone interested in understanding the complexities of the body.


4 diapositivas
Business Decision-Making Framework Presentation
Visualize your path to smarter choices with this key-themed decision-making template. Ideal for strategy sessions, executive planning, or consulting presentations, it breaks down three core steps leading to actionable results. The layout emphasizes clarity and progression, with editable text zones and sleek icons. Works with PowerPoint, Keynote, and Google Slides.


8 diapositivas
Success Strategy Triangle Presentation
Craft a winning strategy with the Success Strategy Triangle template. This structured design helps visualize key business components in a step-by-step format, making it ideal for growth planning, decision-making, and performance analysis. Fully customizable and easy to use, it’s compatible with PowerPoint, Keynote, and Google Slides for seamless integration.


6 diapositivas
Six Sigma Certification Infographics
Explore the world of Six Sigma Certification with our customizable infographic template. This template is fully compatible with popular presentation software like PowerPoint, Keynote, and Google Slides, allowing you to easily customize it to illustrate and communicate various aspects of Six Sigma certification and its benefits. The Six Sigma Certification infographic template offers a visually engaging platform to outline the different levels of certification, the DMAIC methodology, and the impact of Six Sigma on quality improvement within organizations. Whether you're a quality professional, project manager, or someone looking to enhance your process improvement skills, this template provides a user-friendly canvas to create informative presentations and educational materials. Deepen your knowledge of Six Sigma Certification with this SEO-optimized infographic template, thoughtfully designed for clarity and ease of use. Customize it to showcase the certification requirements, training options, project success stories, and the potential for career advancement, ensuring that your audience gains valuable insights into the world of Six Sigma. Start crafting your personalized infographic today to explore the realm of Six Sigma Certification.


7 diapositivas
Decision Points Infographic
Decision points are specific moments or junctures within a process, project, or any situation where a decision needs to be made. This infographic template is designed to illuminate the path of choices, empowering you to make informed decisions and steer towards success. Compatible with Powerpoint, Keynote, and Google Slides. This infographic symbolizes the diverse options one encounters in their journey, and the importance of choosing wisely. The graphs and charts depicting the dilemmas encountered, emphasize the analytical process of weighing pros and cons to arrive at the best decision.


5 diapositivas
Business Statistics Infographic Report Presentation
Present data with clarity using the Business Statistics Infographic Report presentation. This layout combines clean bar graphs, donut charts, and legends to showcase KPIs, progress benchmarks, and segmented insights. Ideal for quarterly reviews, executive updates, or client reporting. Fully editable in PowerPoint, Keynote, or Google Slides.


4 diapositivas
Fishbone Diagram for Root Cause Analysis
Dive into the source of any problem—literally. This fishbone diagram template offers a smart and visual way to map out causes leading to a business issue, helping teams brainstorm solutions effectively. Ideal for workshops, meetings, and audits. Easily editable in PowerPoint, Keynote, and Google Slides.


5 diapositivas
Business Growth and Expansion
Visually communicate each stage of business development with this Business Growth and Expansion diagram. Featuring a dynamic circular flow, this editable slide is perfect for showcasing progress, scaling strategies, or roadmap milestones. Fully compatible with PowerPoint, Keynote, and Google Slides—ideal for business plans and strategic presentations.


6 diapositivas
Human Resources Project Infographics
This series of infographics from a Human Resources (HR) presentation provides a visual breakdown of key HR functions and strategies. The slides encompass various elements critical to effective HR management: Adoption & Integration: Showcases the initial stages of HR processes, including adoption rates and integration strategies for new systems or policies. Training & Development: Highlights the importance of ongoing employee development through training programs, critical for fostering employee skills and organizational growth. Retention & Maintenance: Focuses on strategies to retain talent within the organization, such as engagement initiatives and competitive compensation structures. Performance & Evaluation: Details the methods for assessing employee performance and the criteria used for evaluations, ensuring alignment with organizational goals. Recruitment to Retirement: Outlines the employee lifecycle from recruitment to retirement, showing the comprehensive approach of HR in managing employee journeys. Each slide utilizes charts, process diagrams, and bullet points to clearly communicate the steps and processes involved, making it easier for the audience to grasp complex HR activities. These visuals are crucial for HR professionals aiming to improve workplace efficiency and employee satisfaction.


20 diapositivas
Starbound Sales Proposal Presentation
Close deals with confidence using this polished and professional sales proposal presentation! It covers everything from target market analysis and pricing strategies to sales objectives, performance metrics, and future opportunities, ensuring a complete pitch. Perfect for client meetings and business proposals, this template works seamlessly with PowerPoint, Keynote, and Google Slides.


23 diapositivas
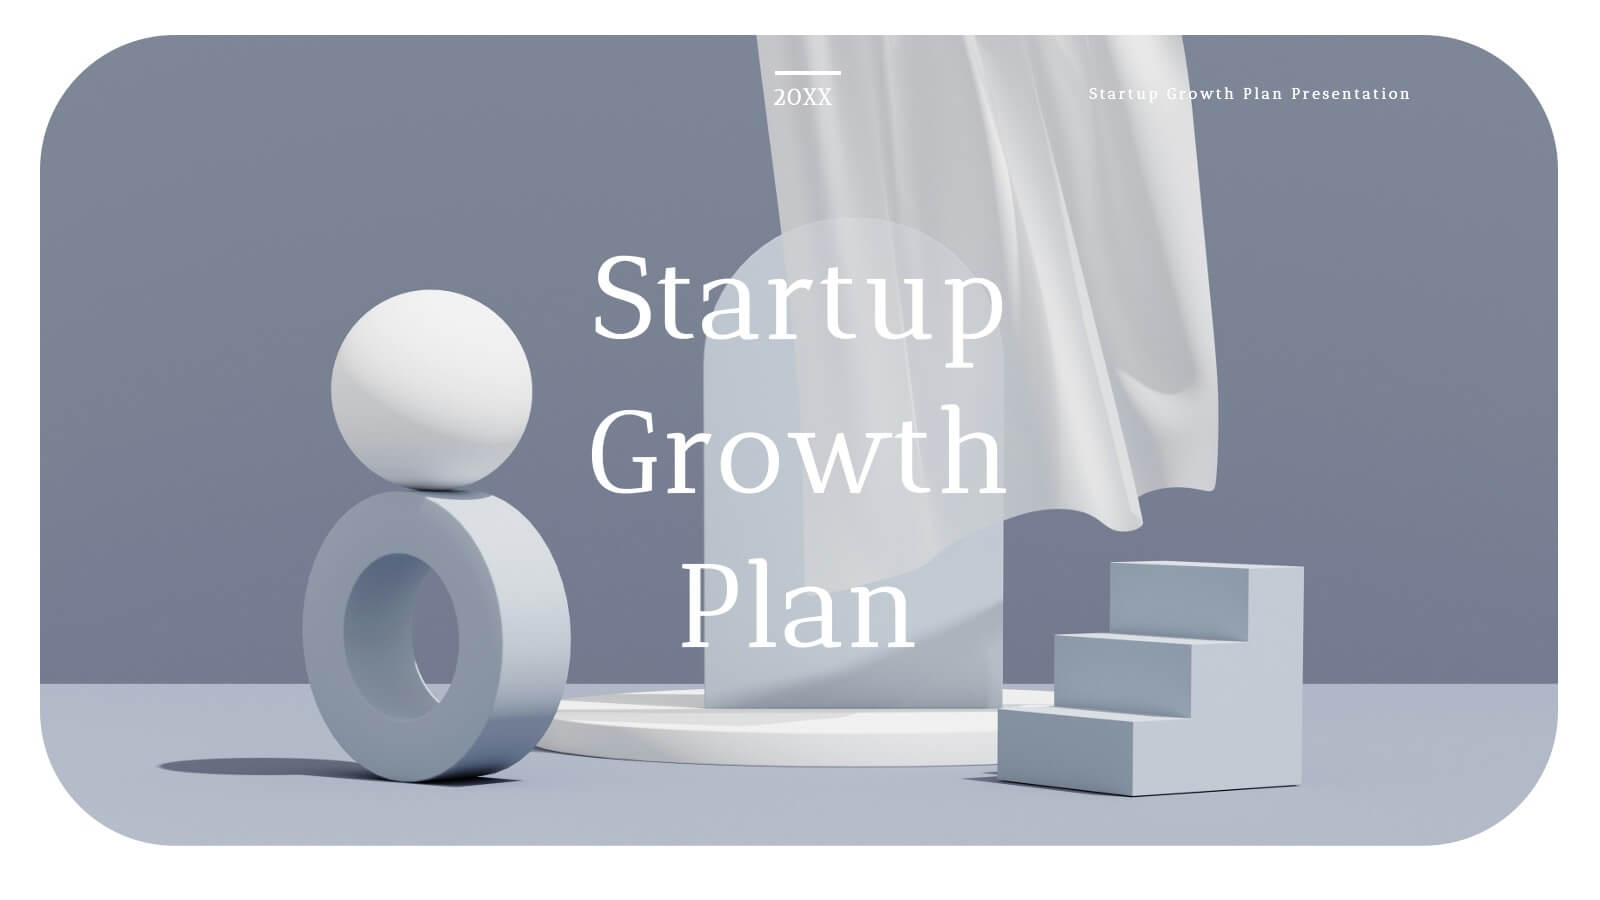
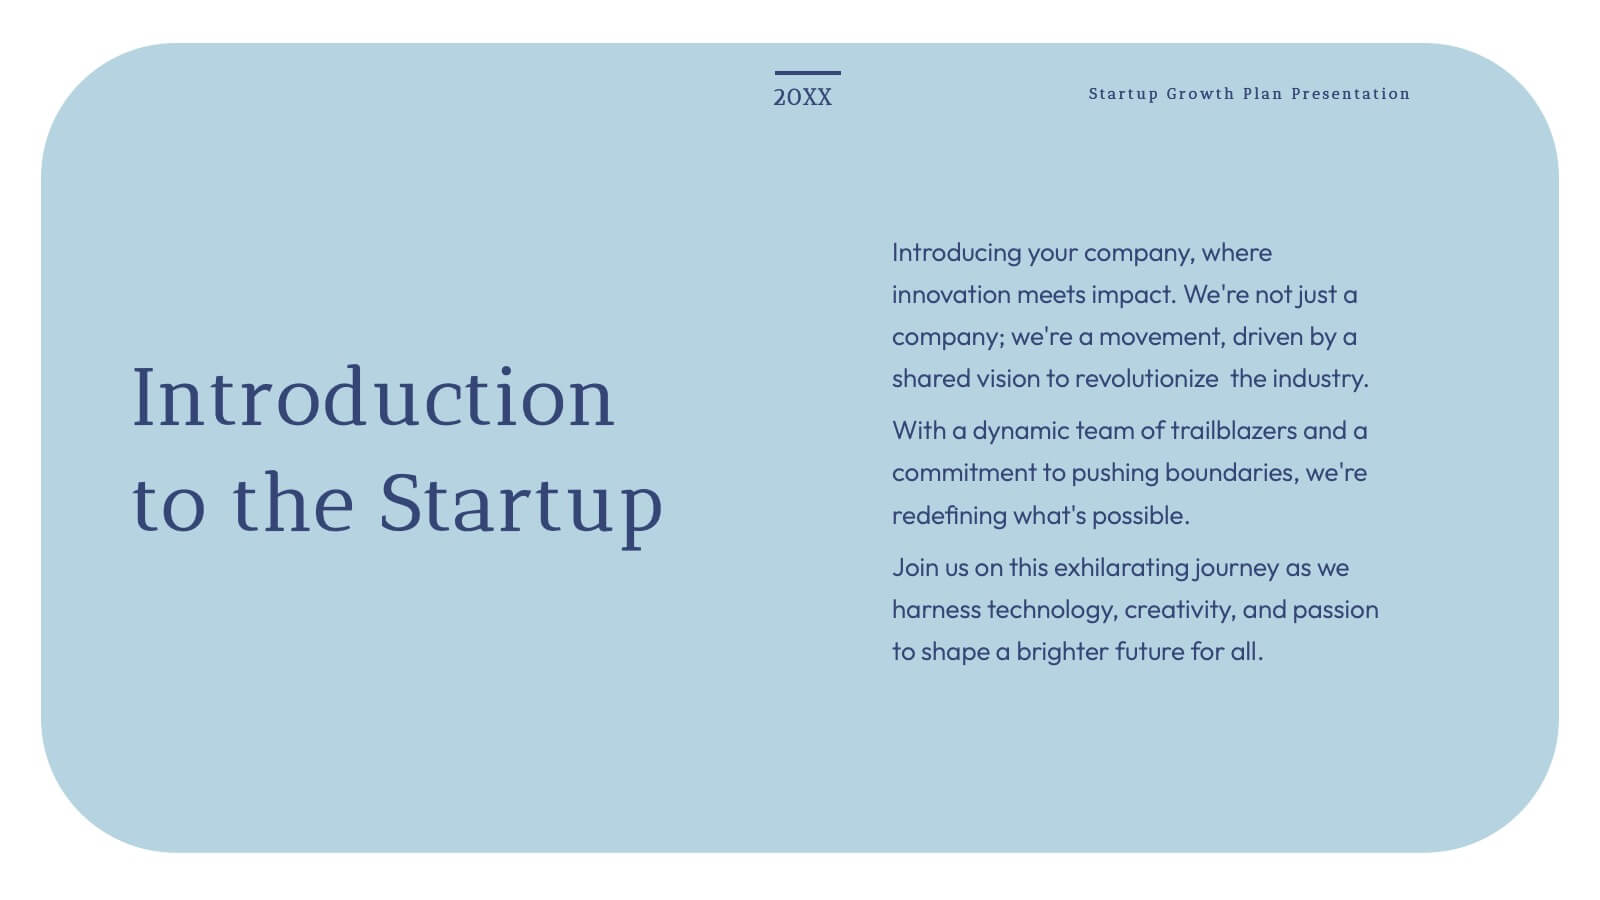
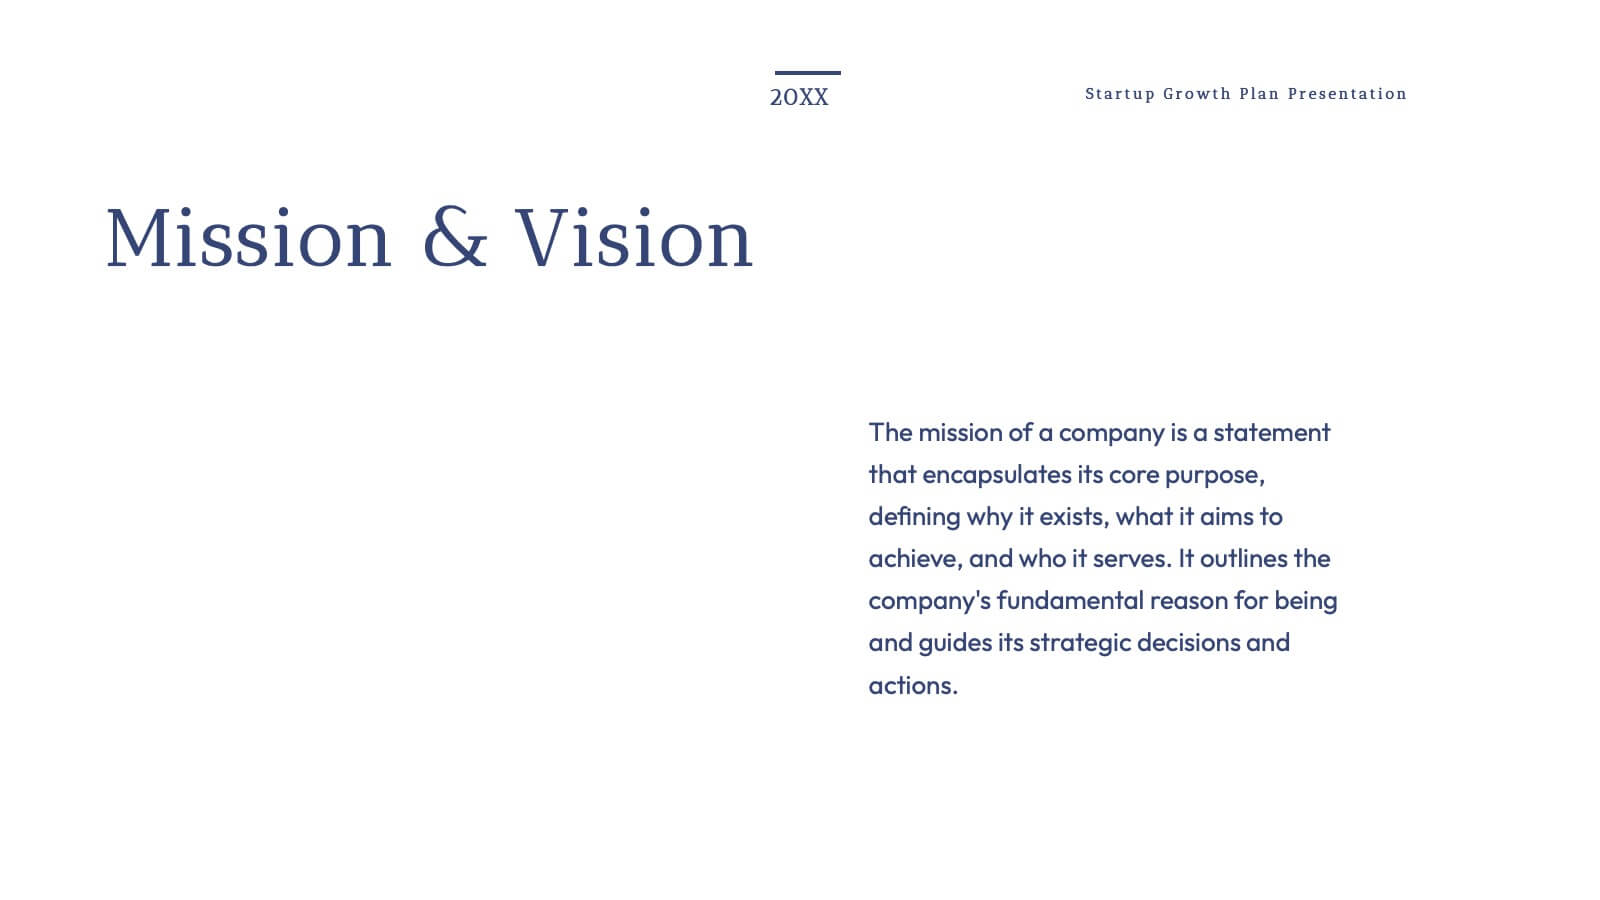
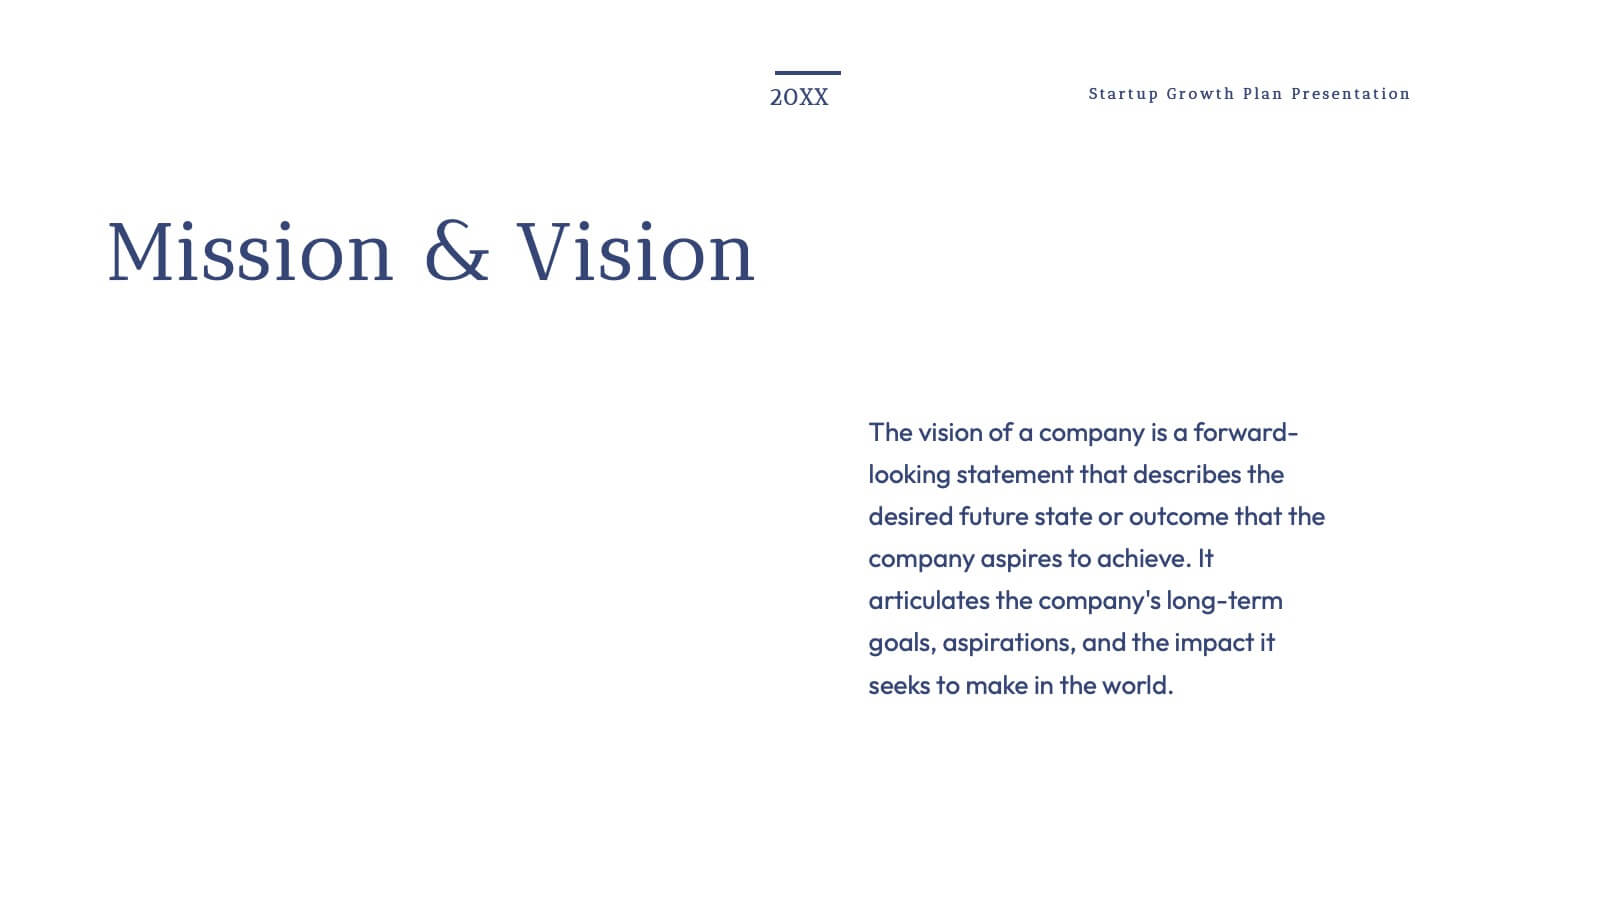
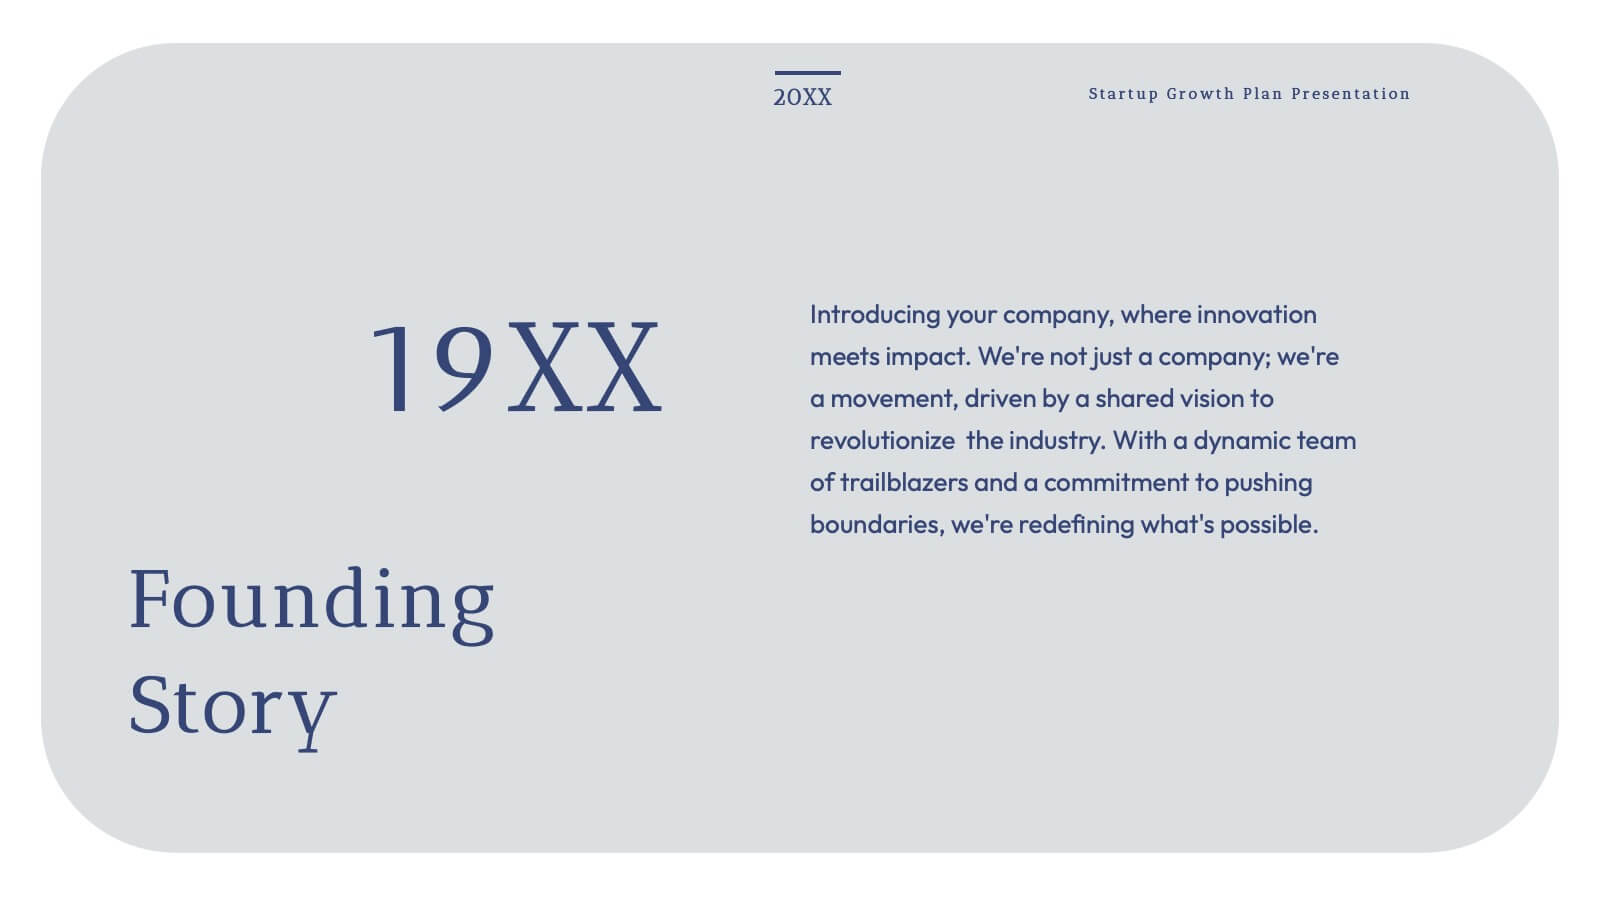
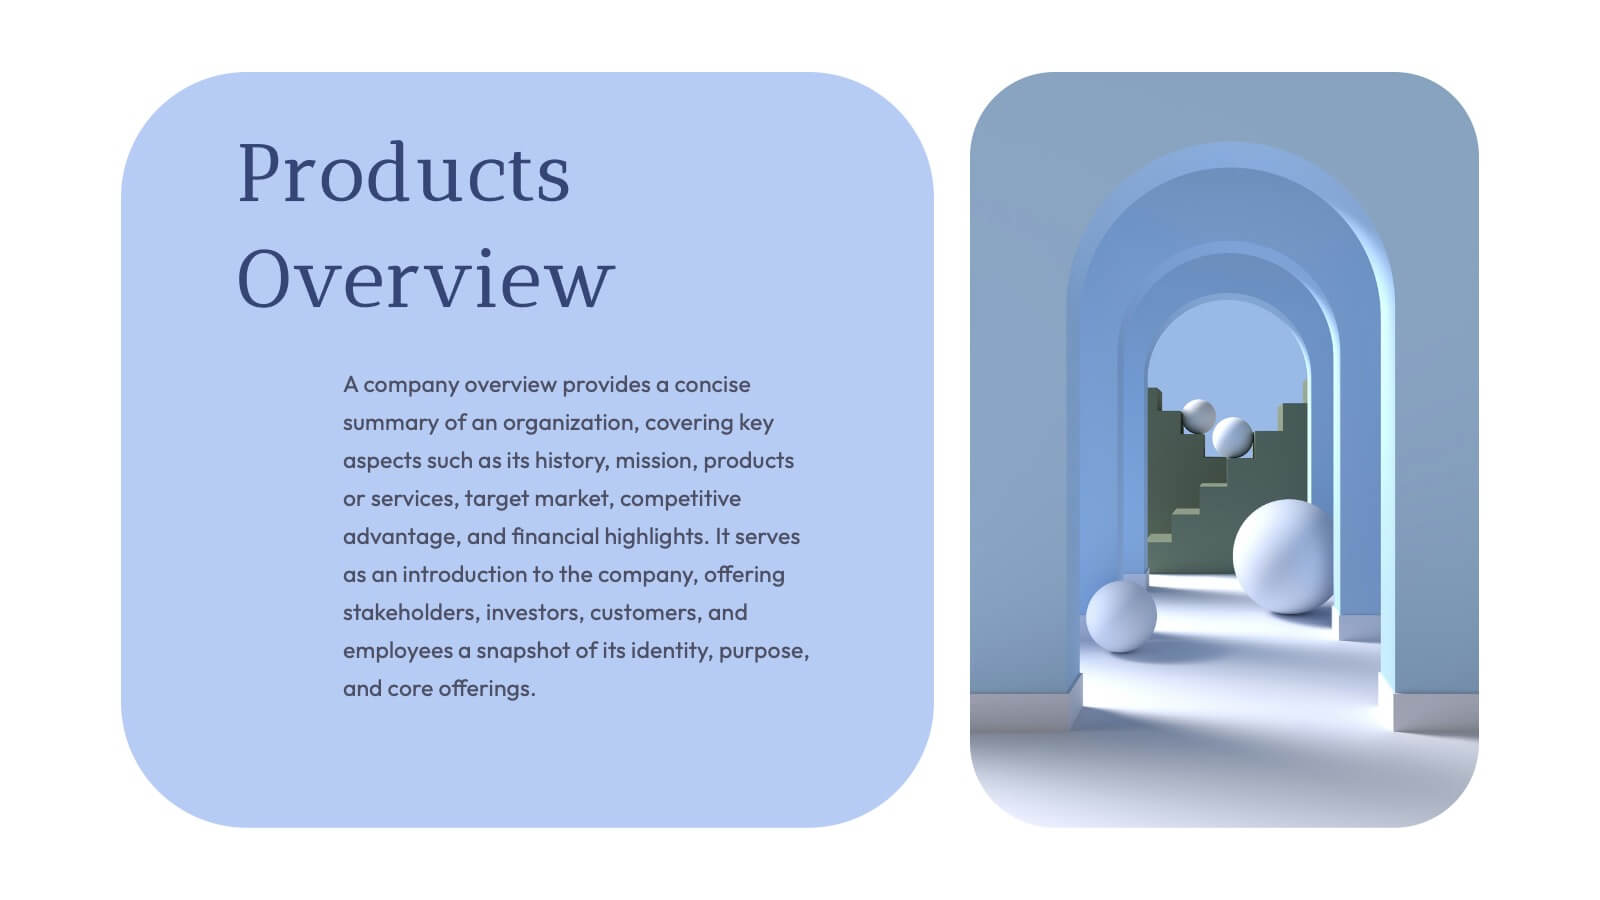
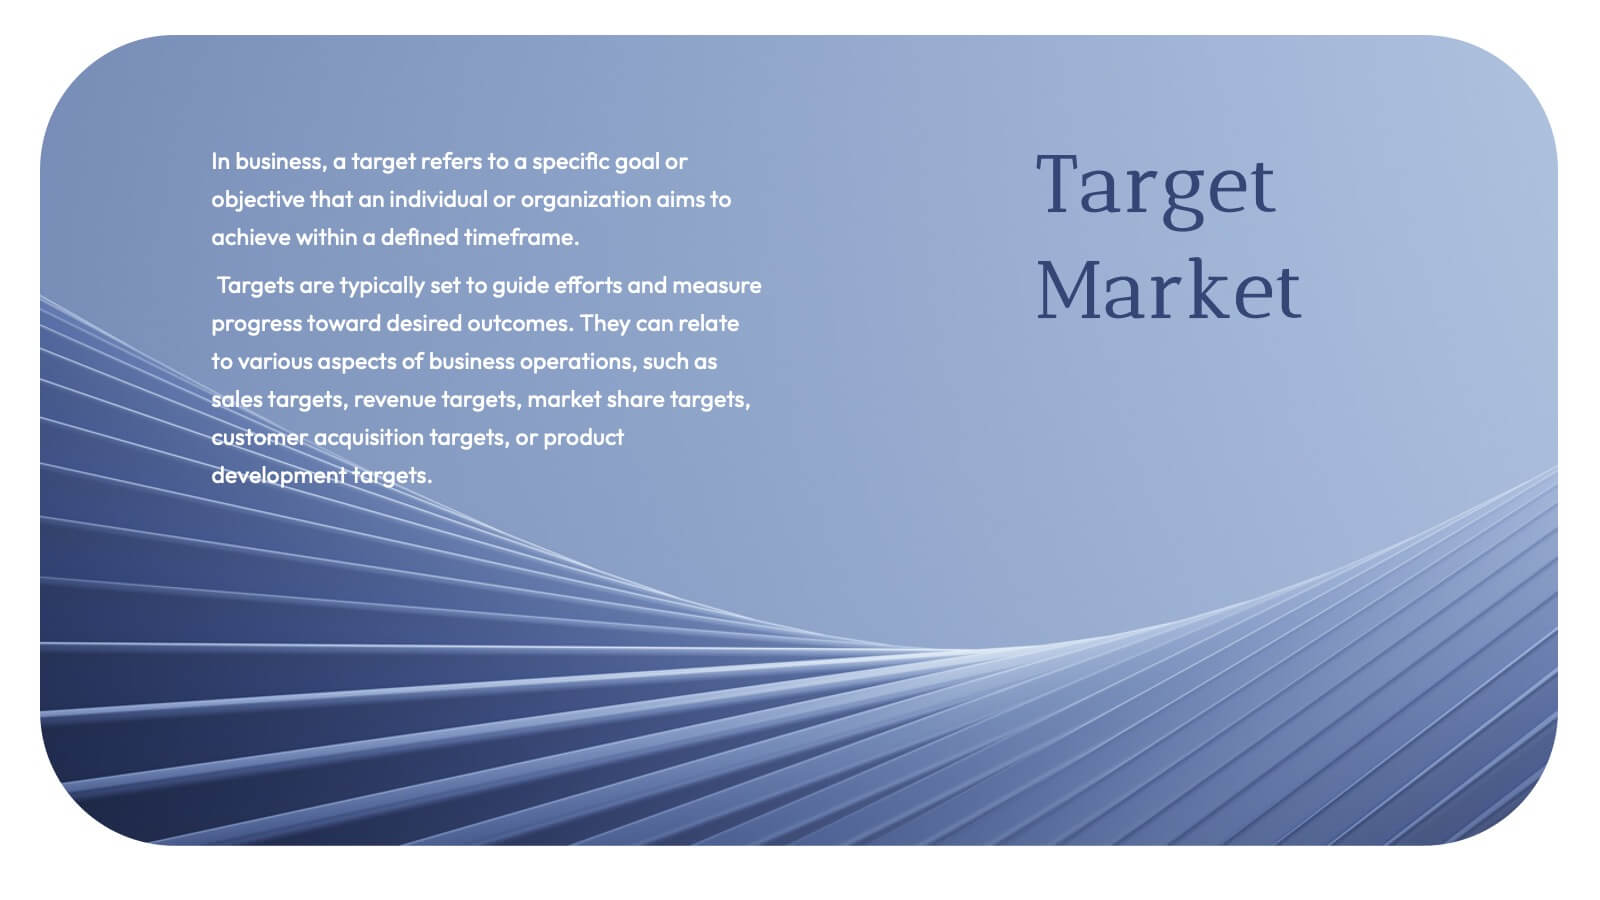
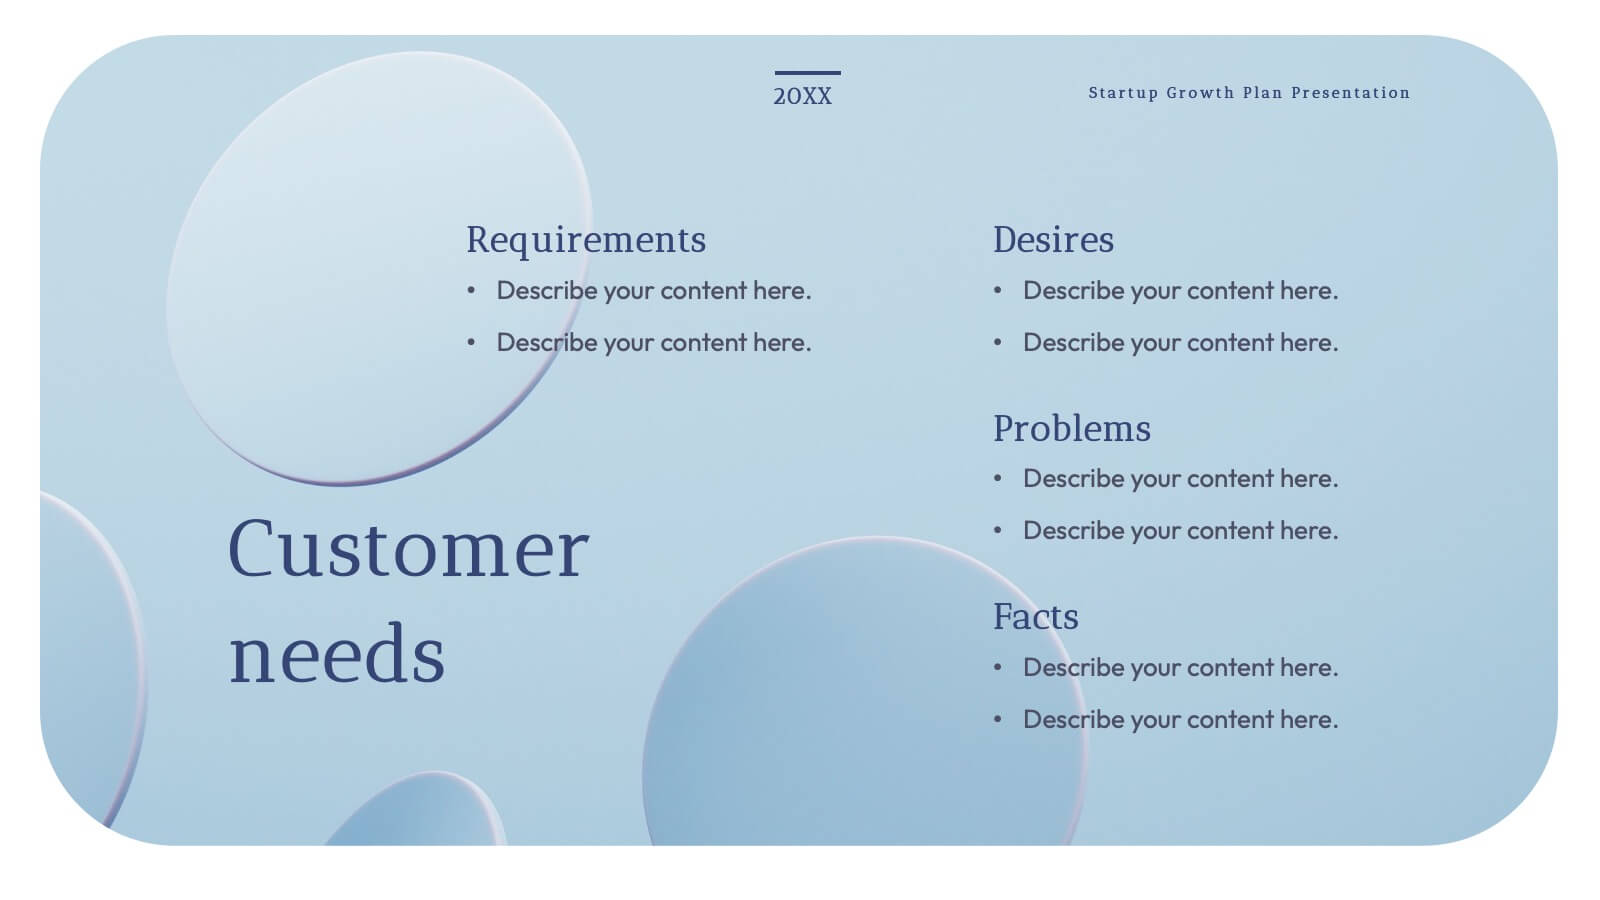
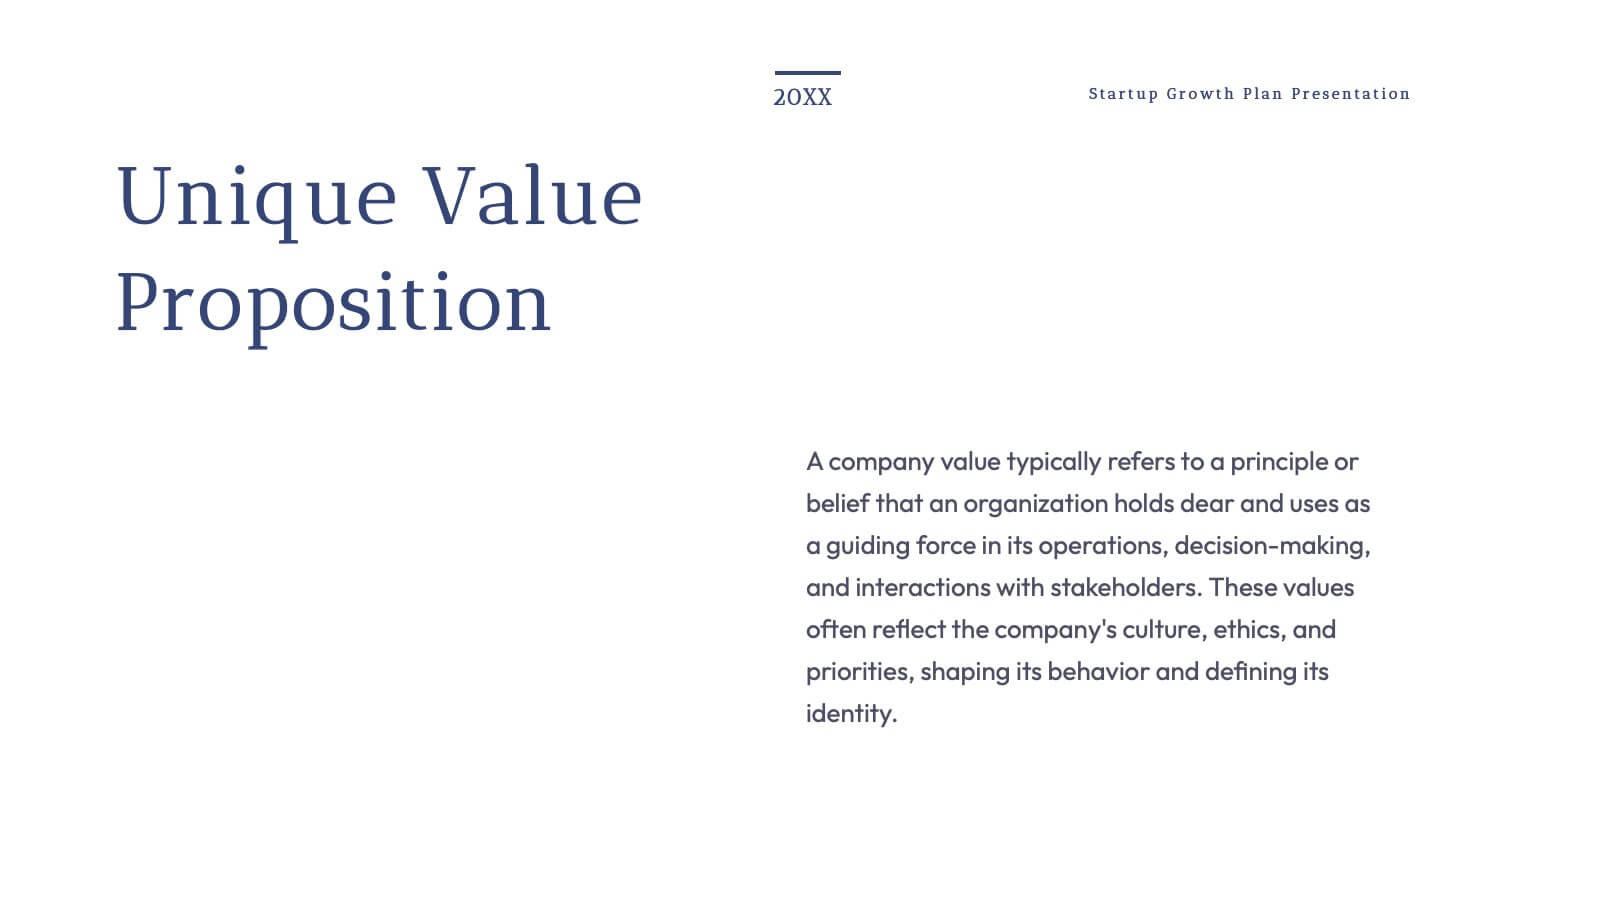
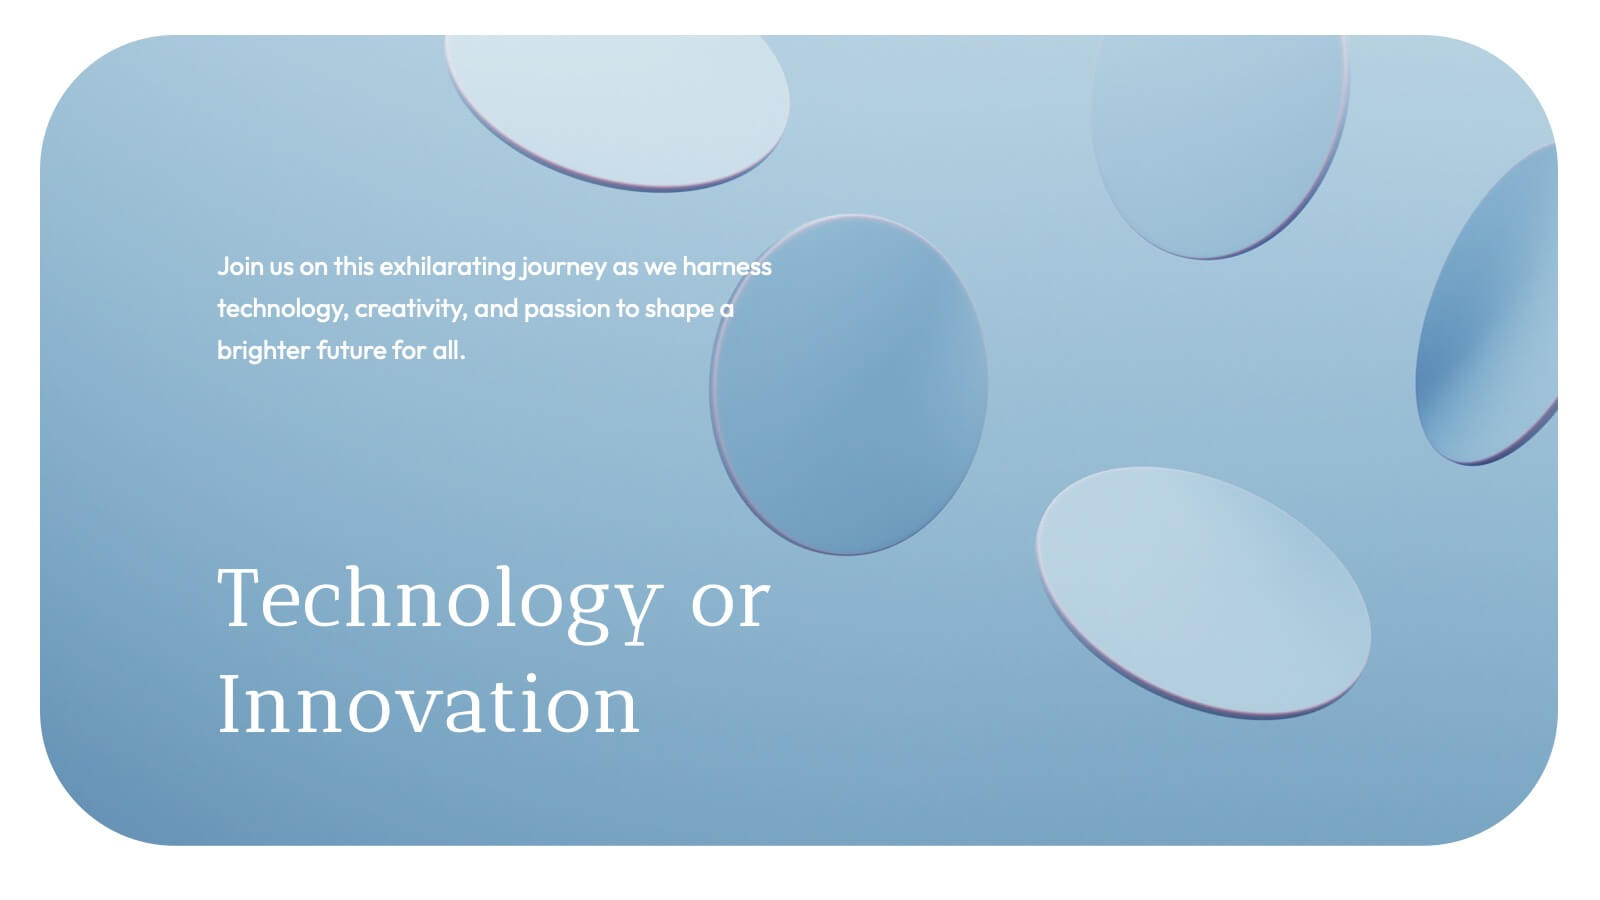
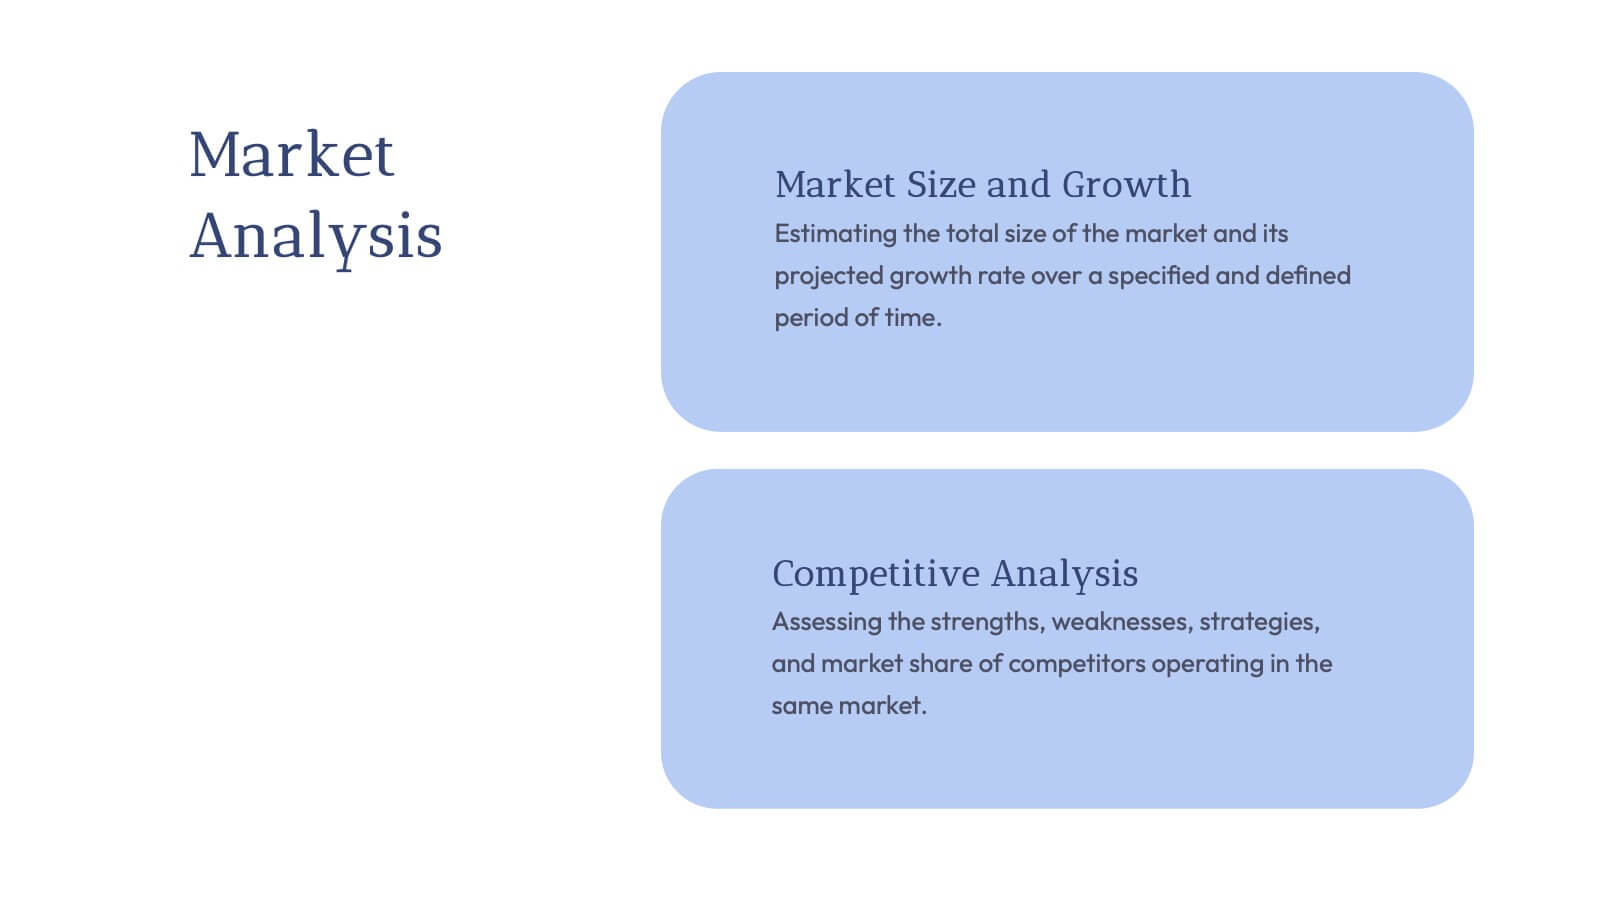
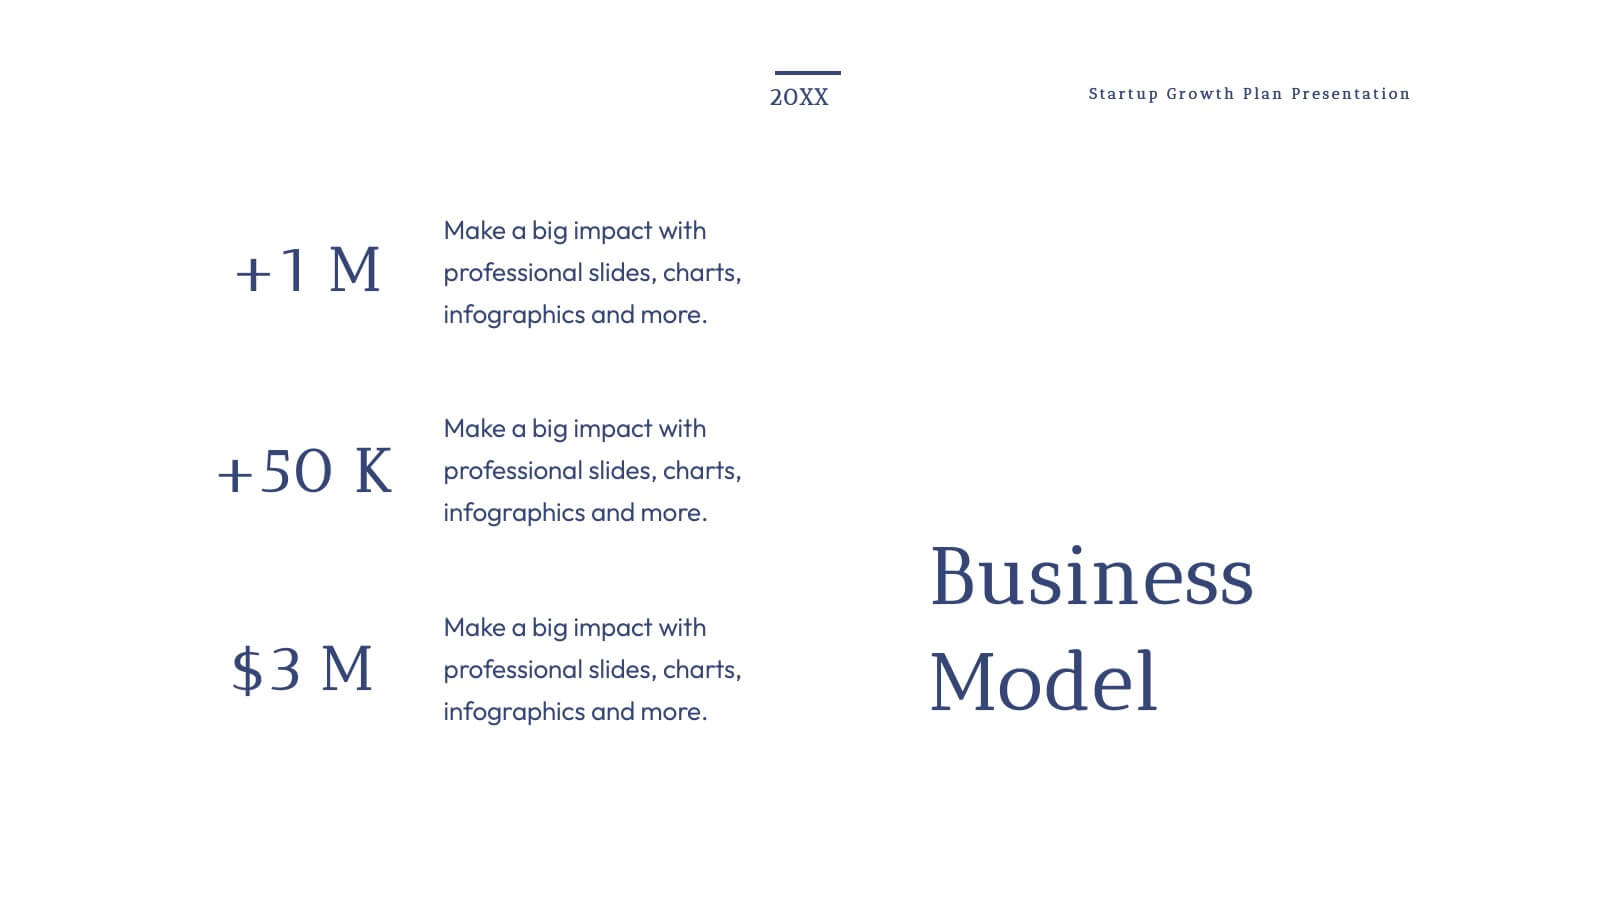
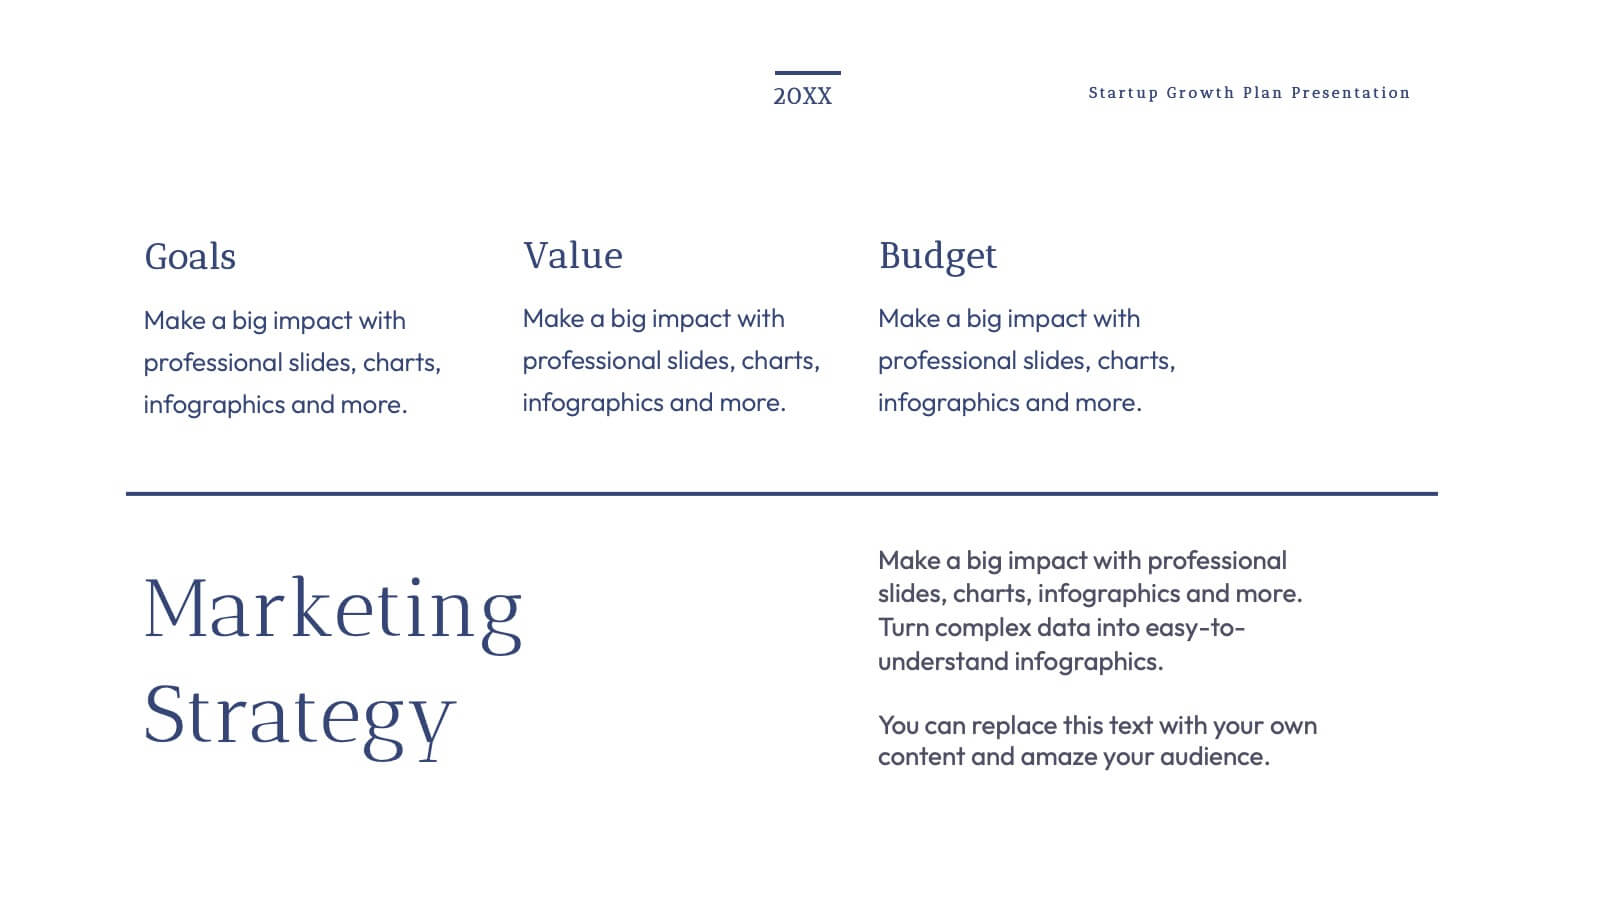
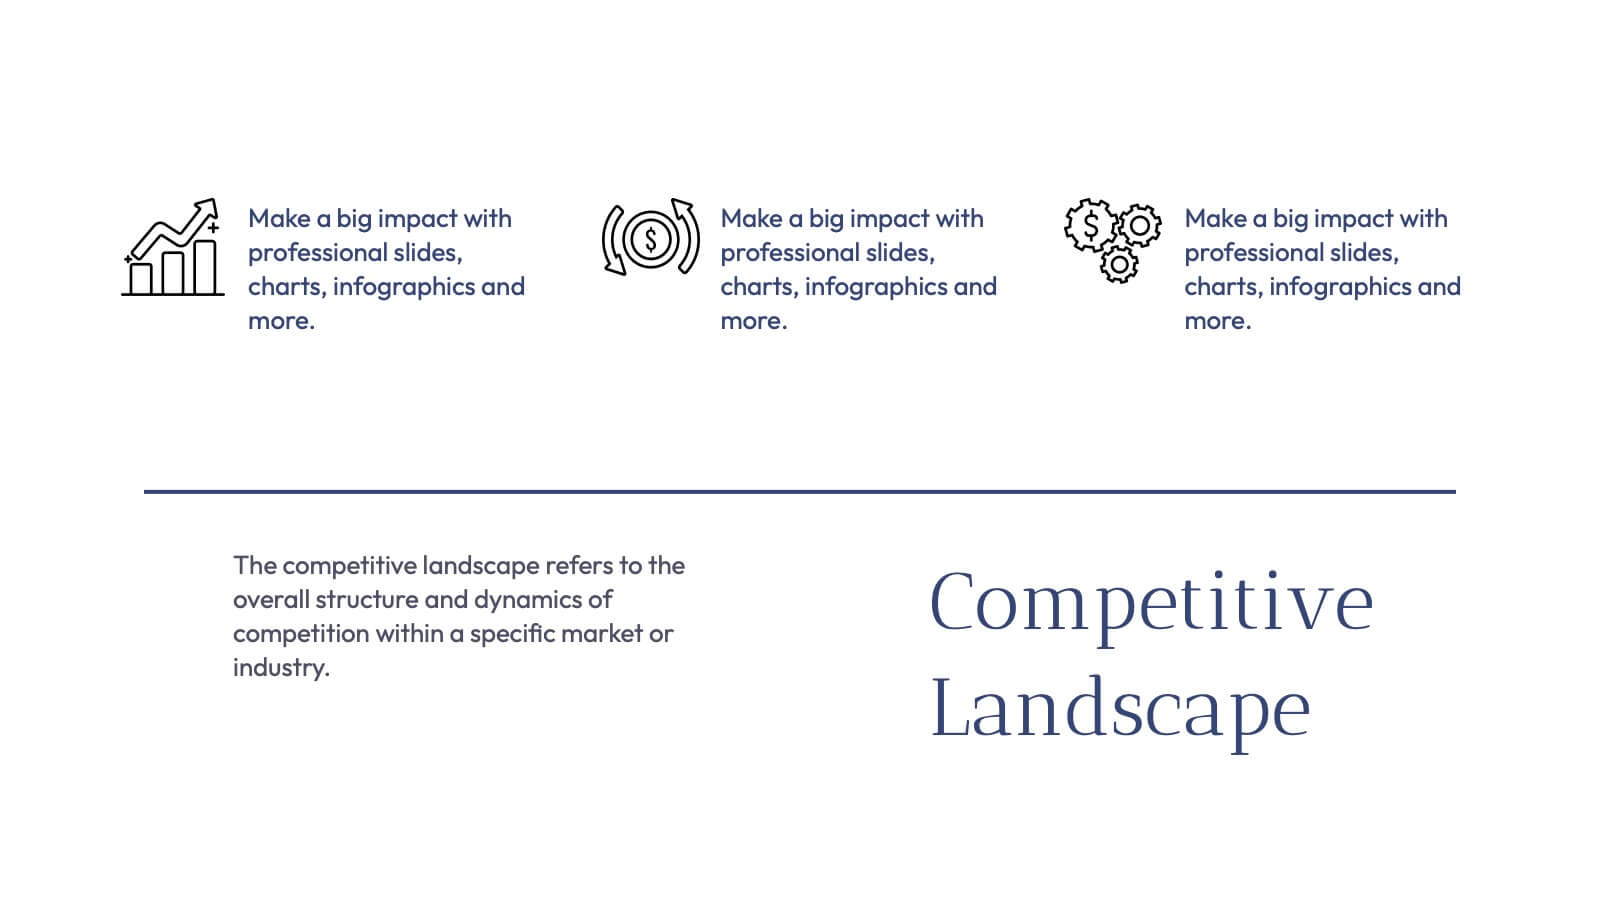
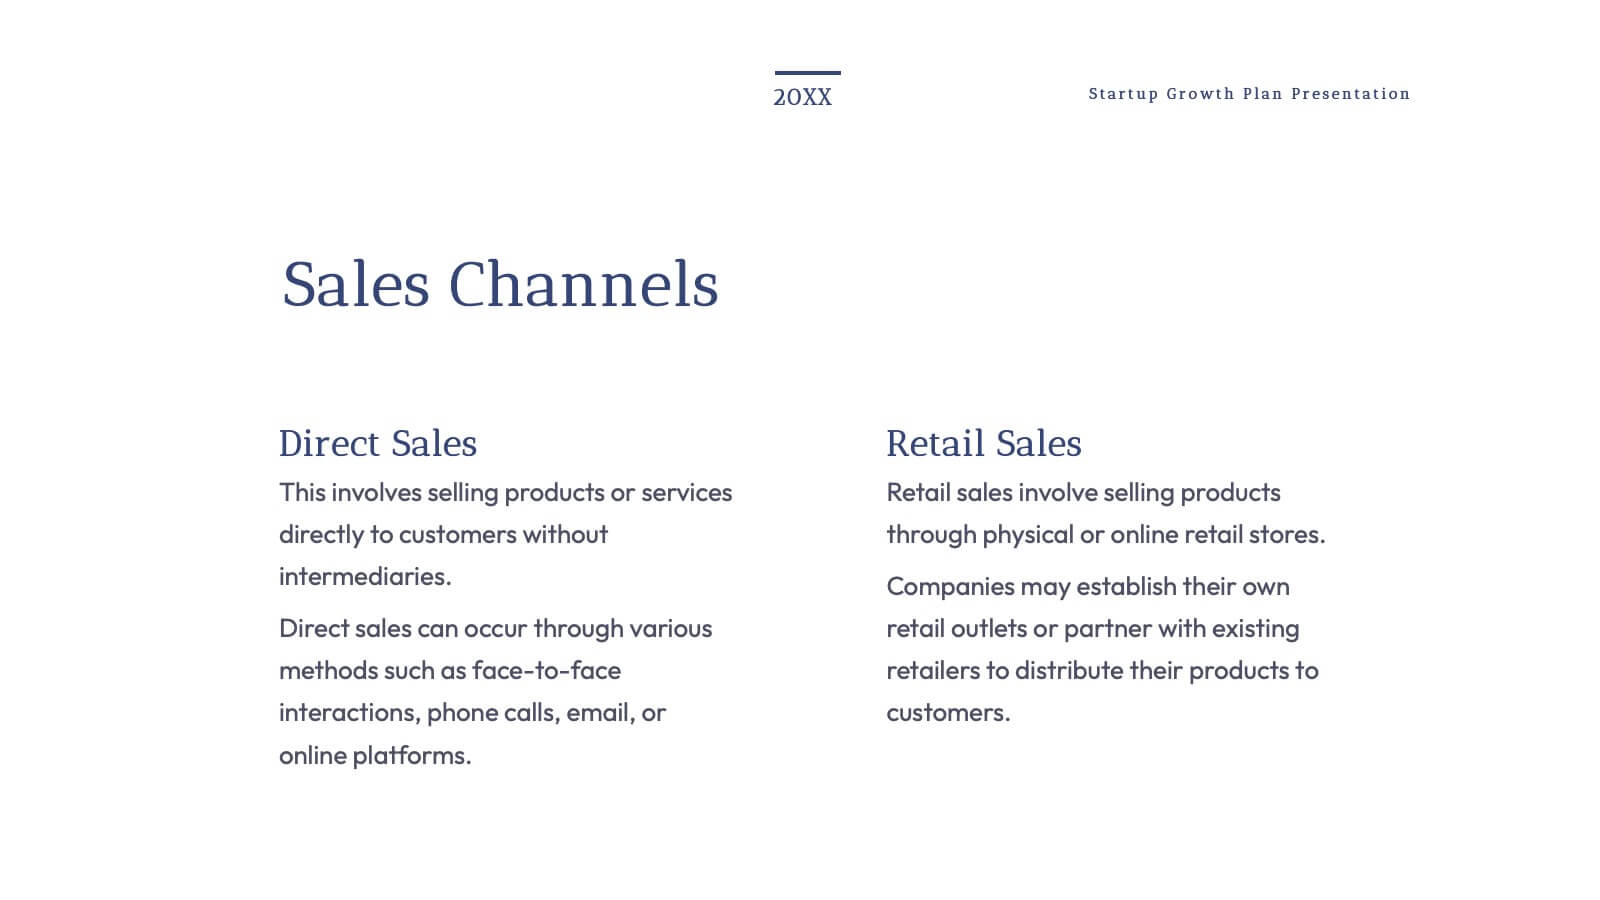
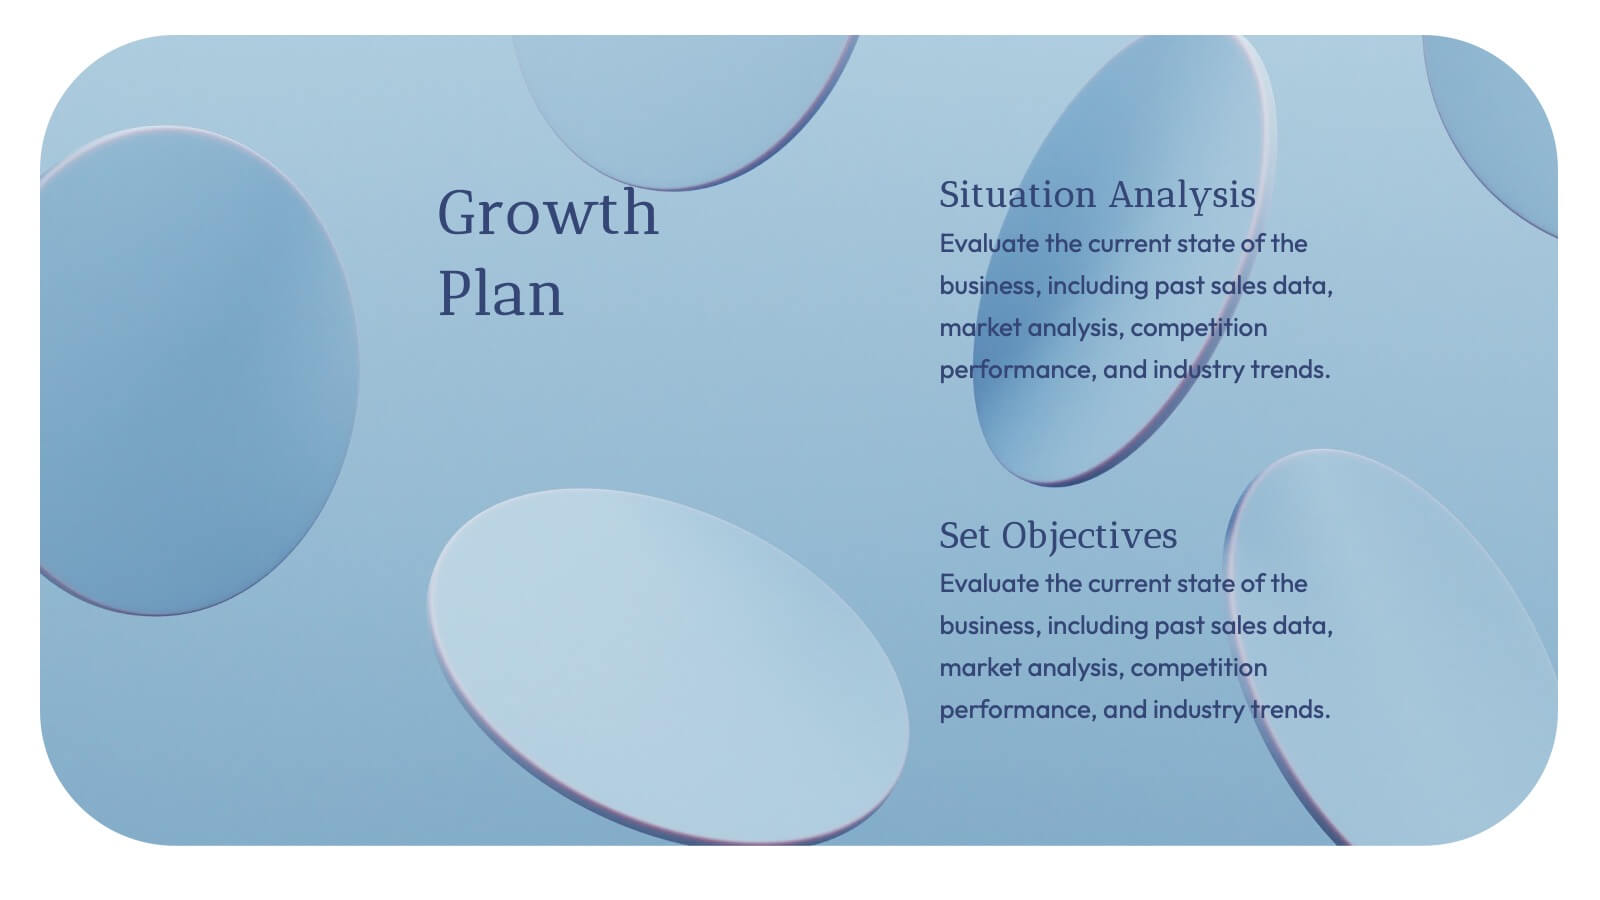
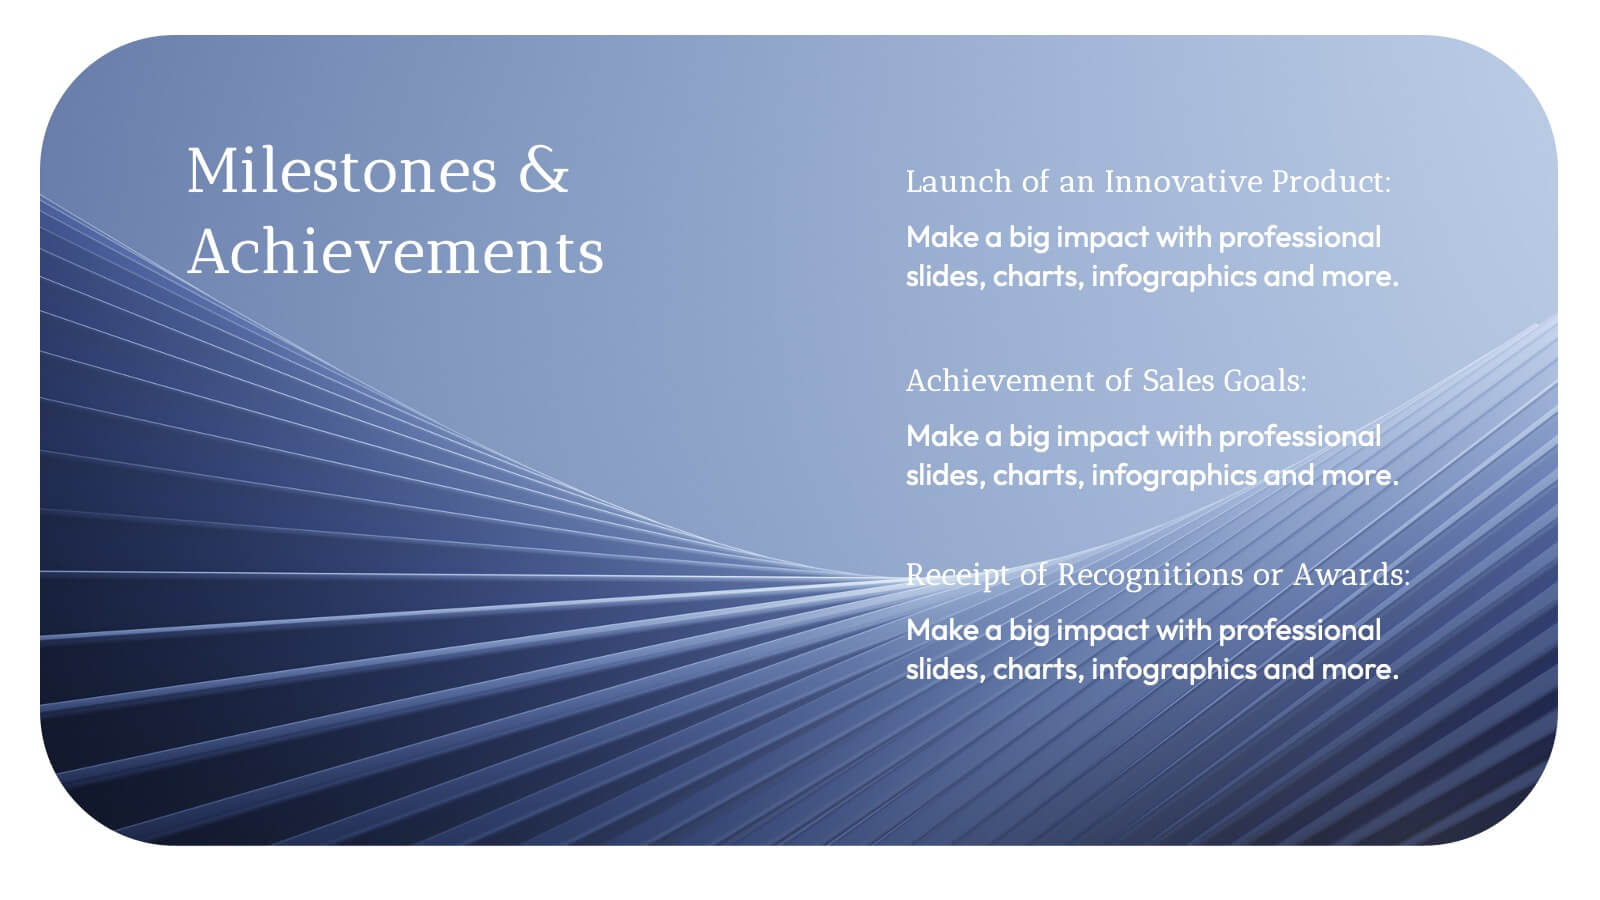
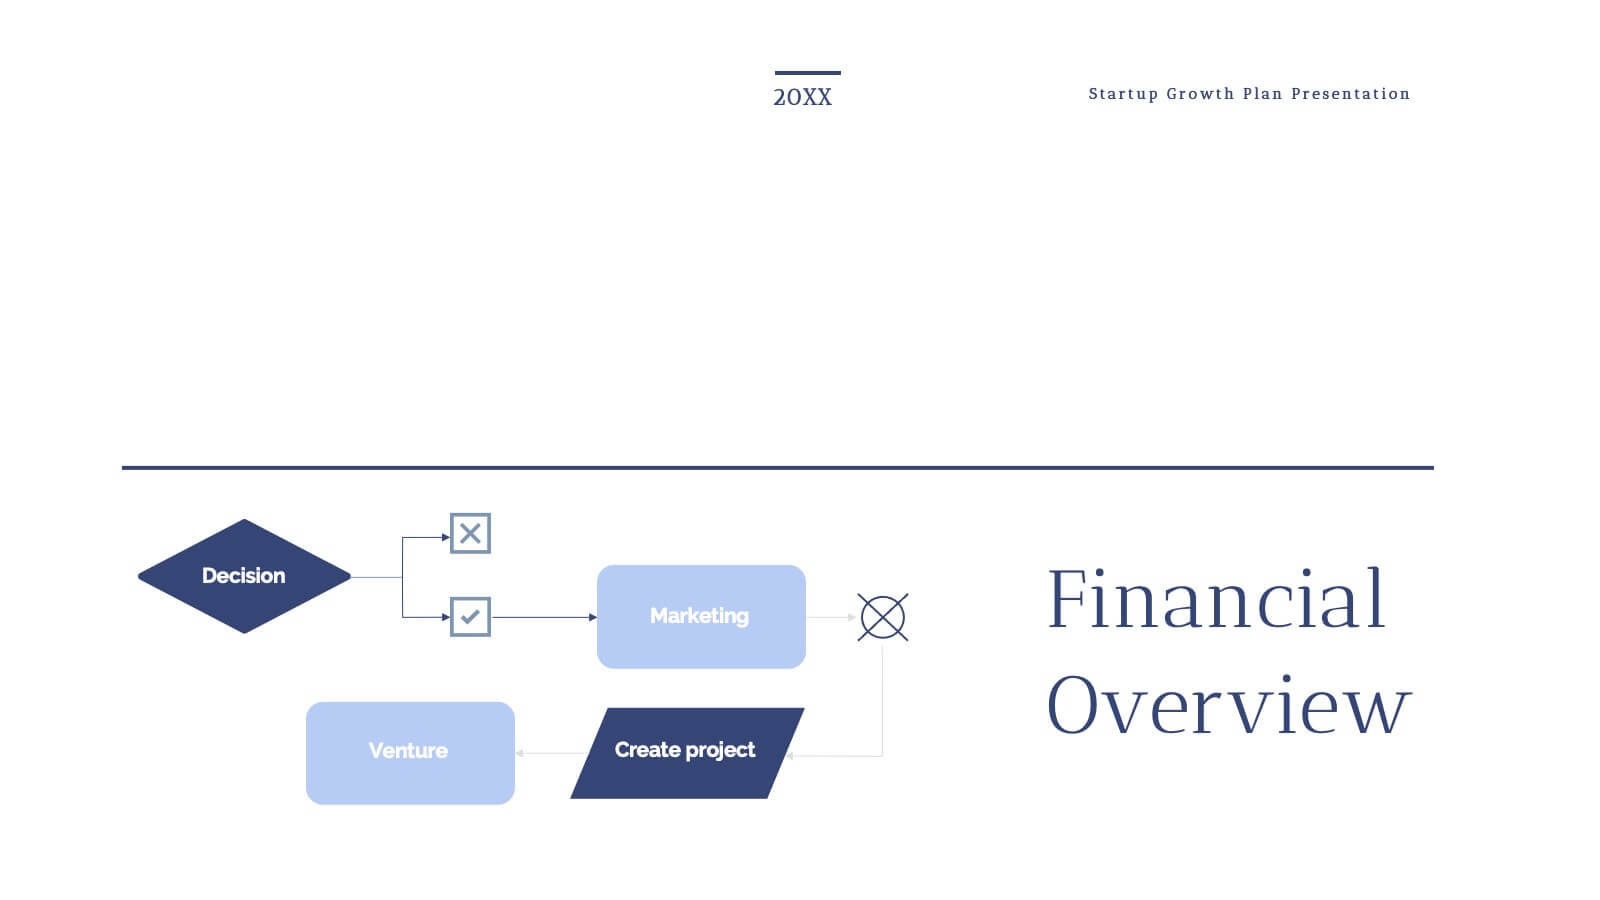
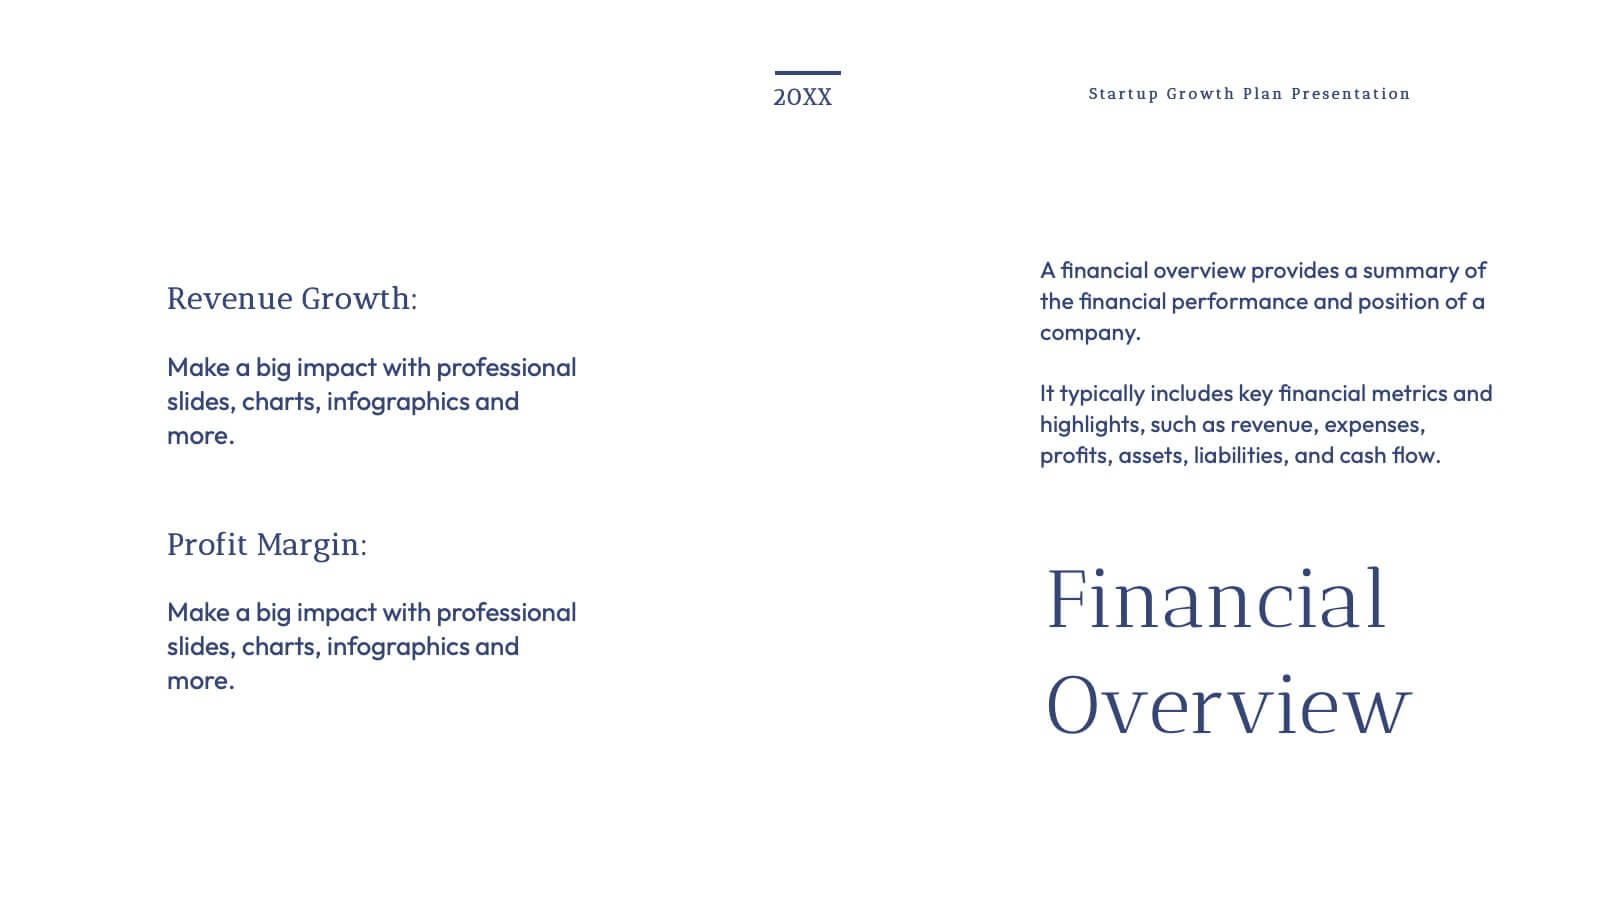
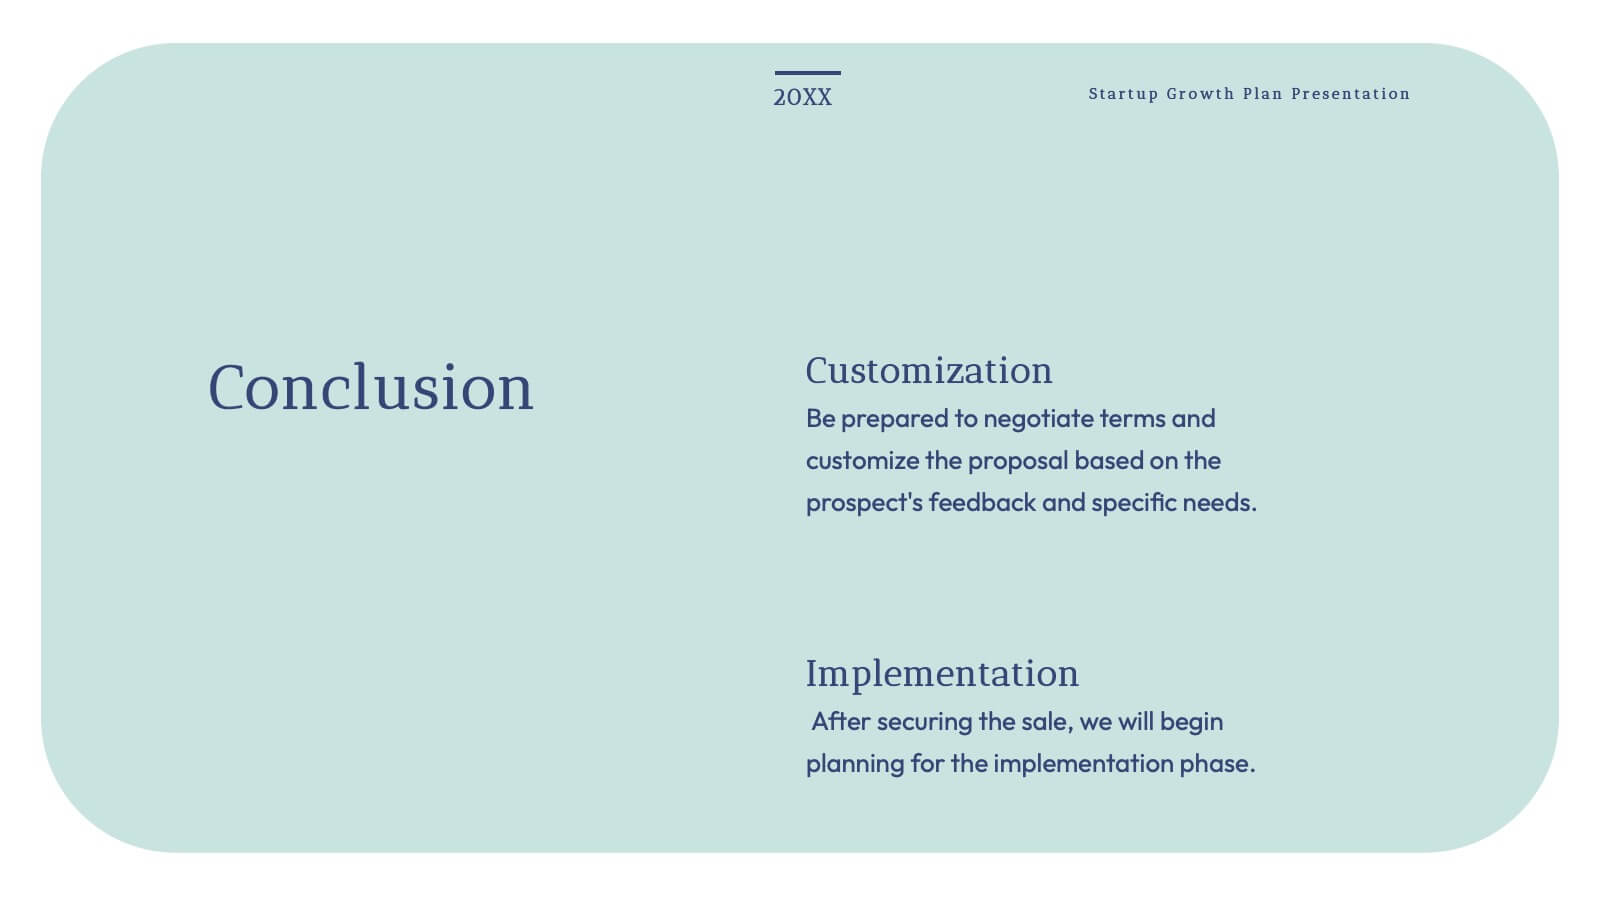
Grecian Startup Growth Plan Presentation
Elevate your pitch with this stunning Grecian-inspired presentation template, perfect for outlining your startup's growth plan! Showcase your business strategy, revenue projections, and scaling opportunities with a clean, elegant design that grabs attention. Impress investors and stakeholders with every slide. Compatible with PowerPoint, Keynote, and Google Slides for seamless customization.


5 diapositivas
Quarterly Action Planning Roadmap Presentation
Stay organized with the Quarterly Action Planning Roadmap Presentation. This clear, grid-based layout is perfect for mapping out priorities, goals, and deliverables across four quarters. Ideal for business planning, team tracking, and strategic reviews. Fully editable in PowerPoint, Keynote, Google Slides, and Canva for flexible customization.


21 diapositivas
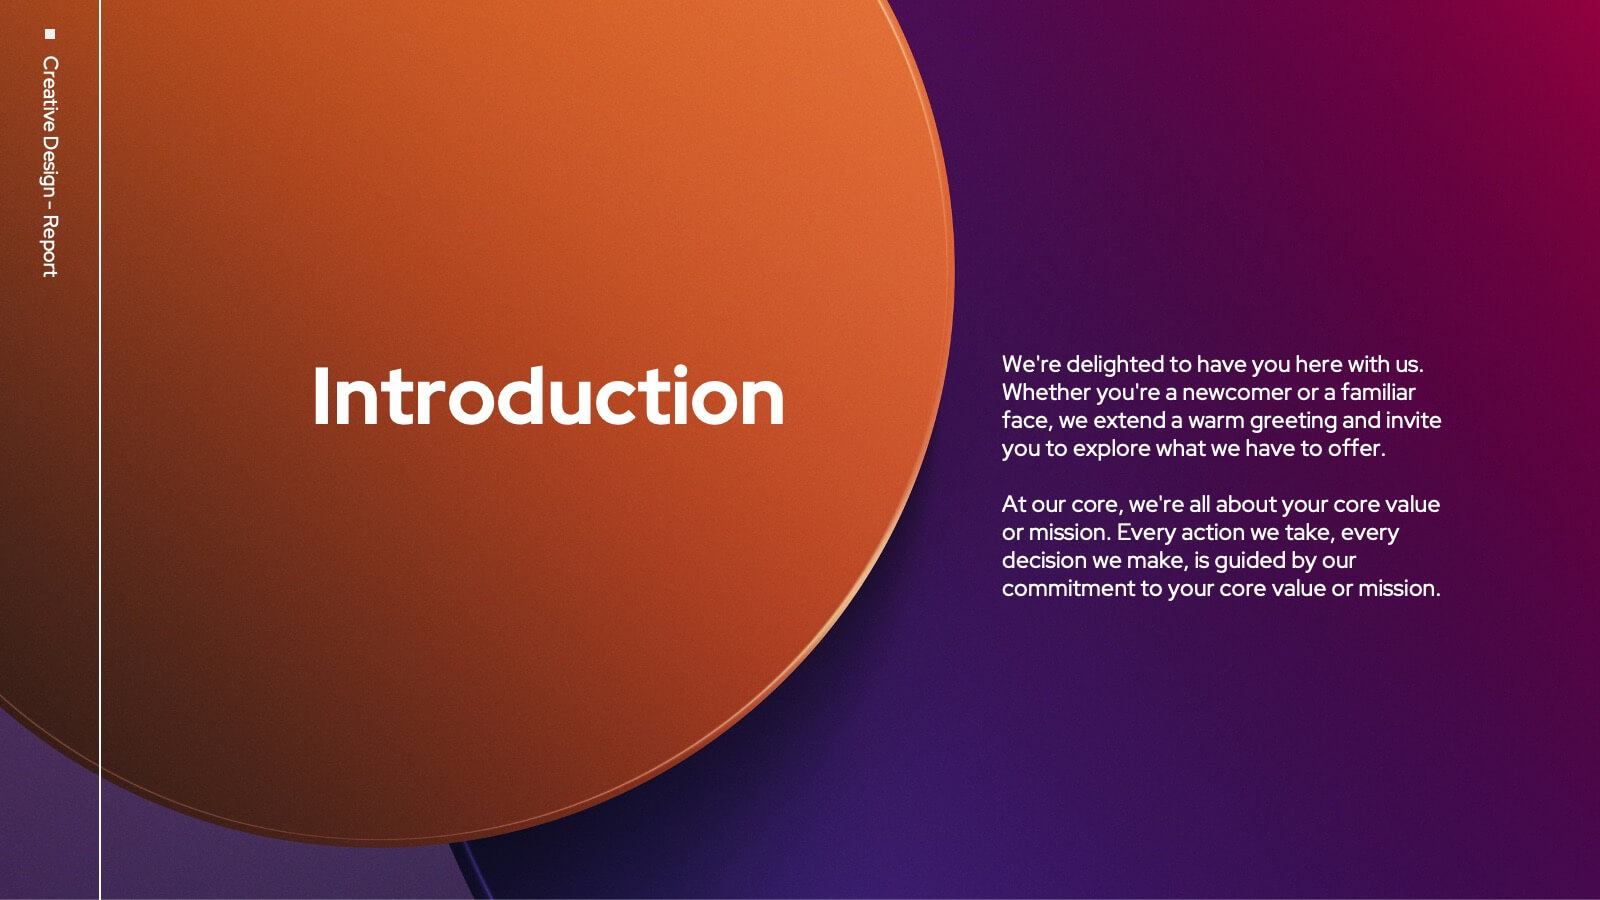
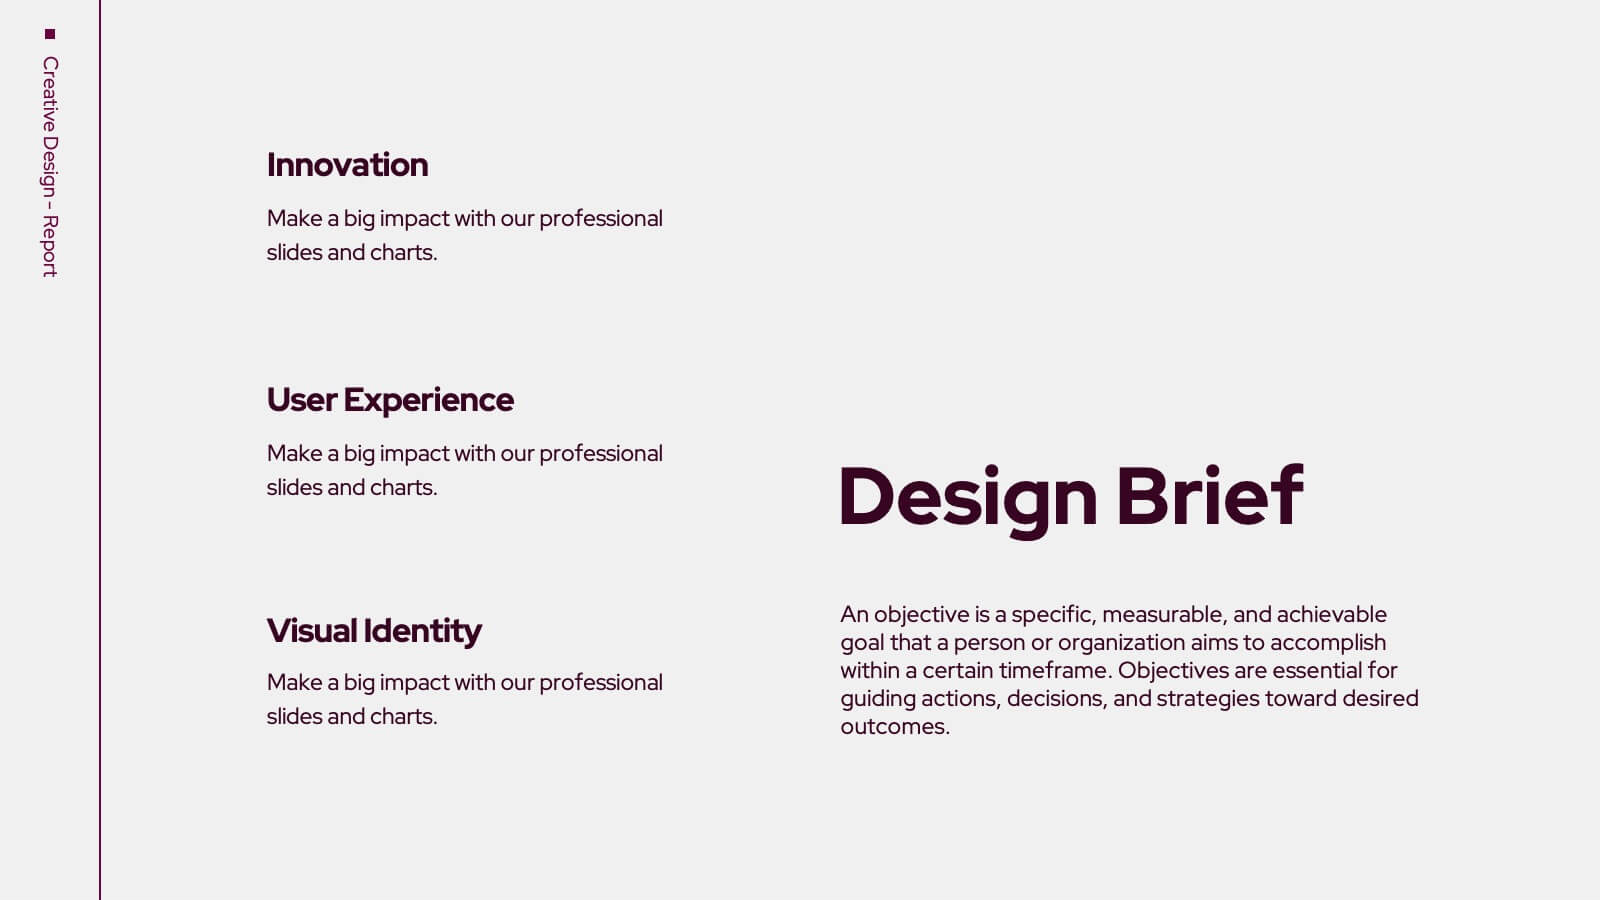
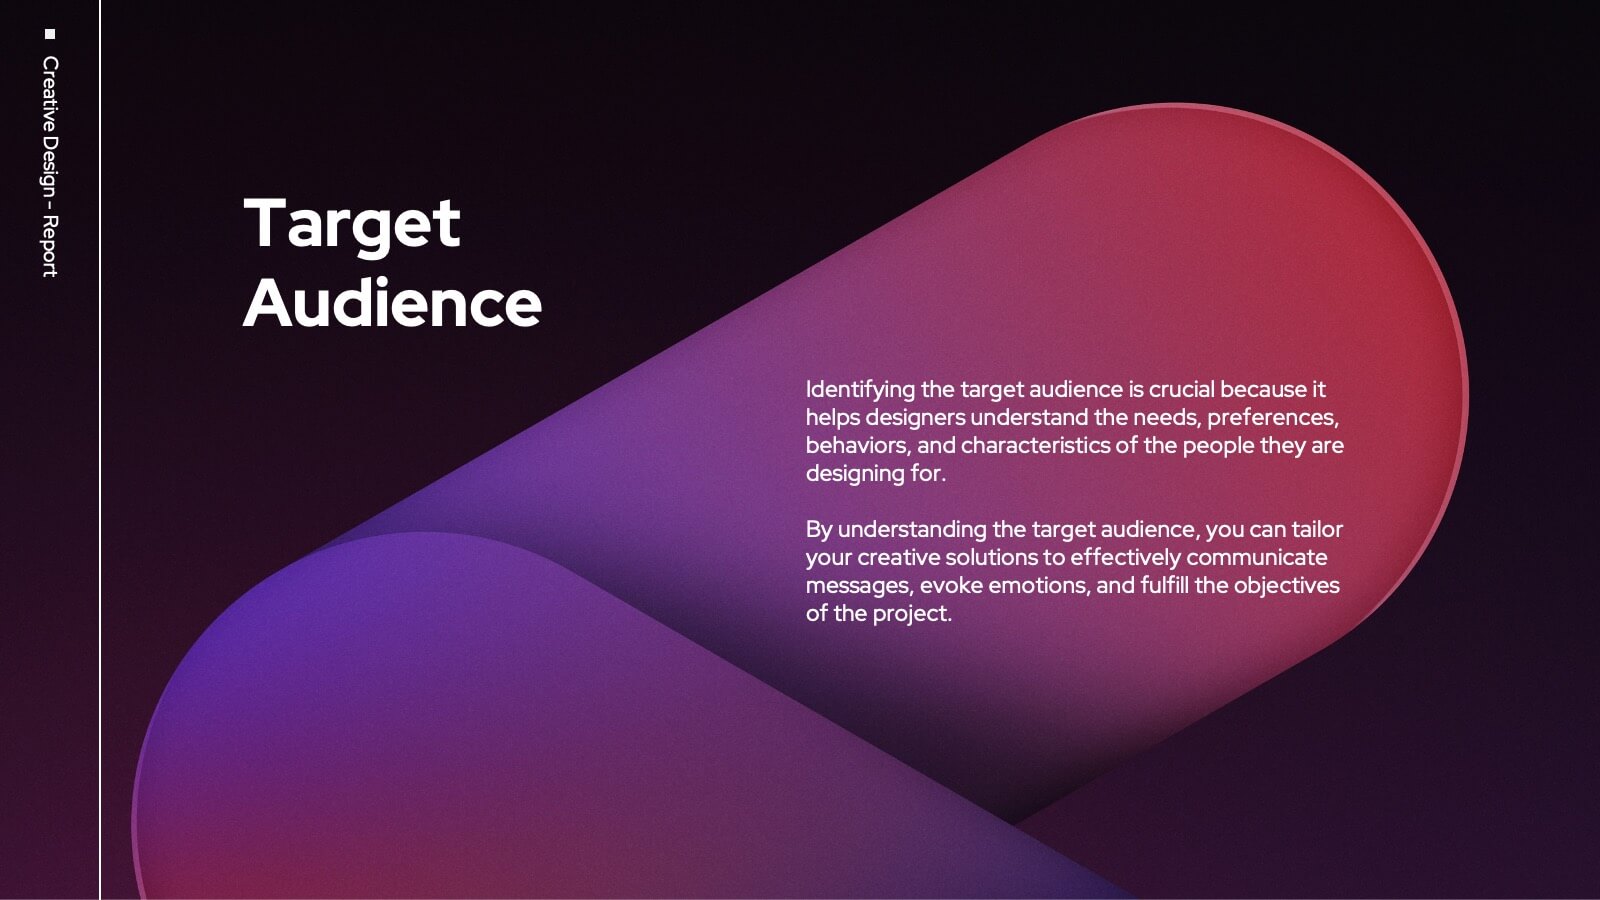
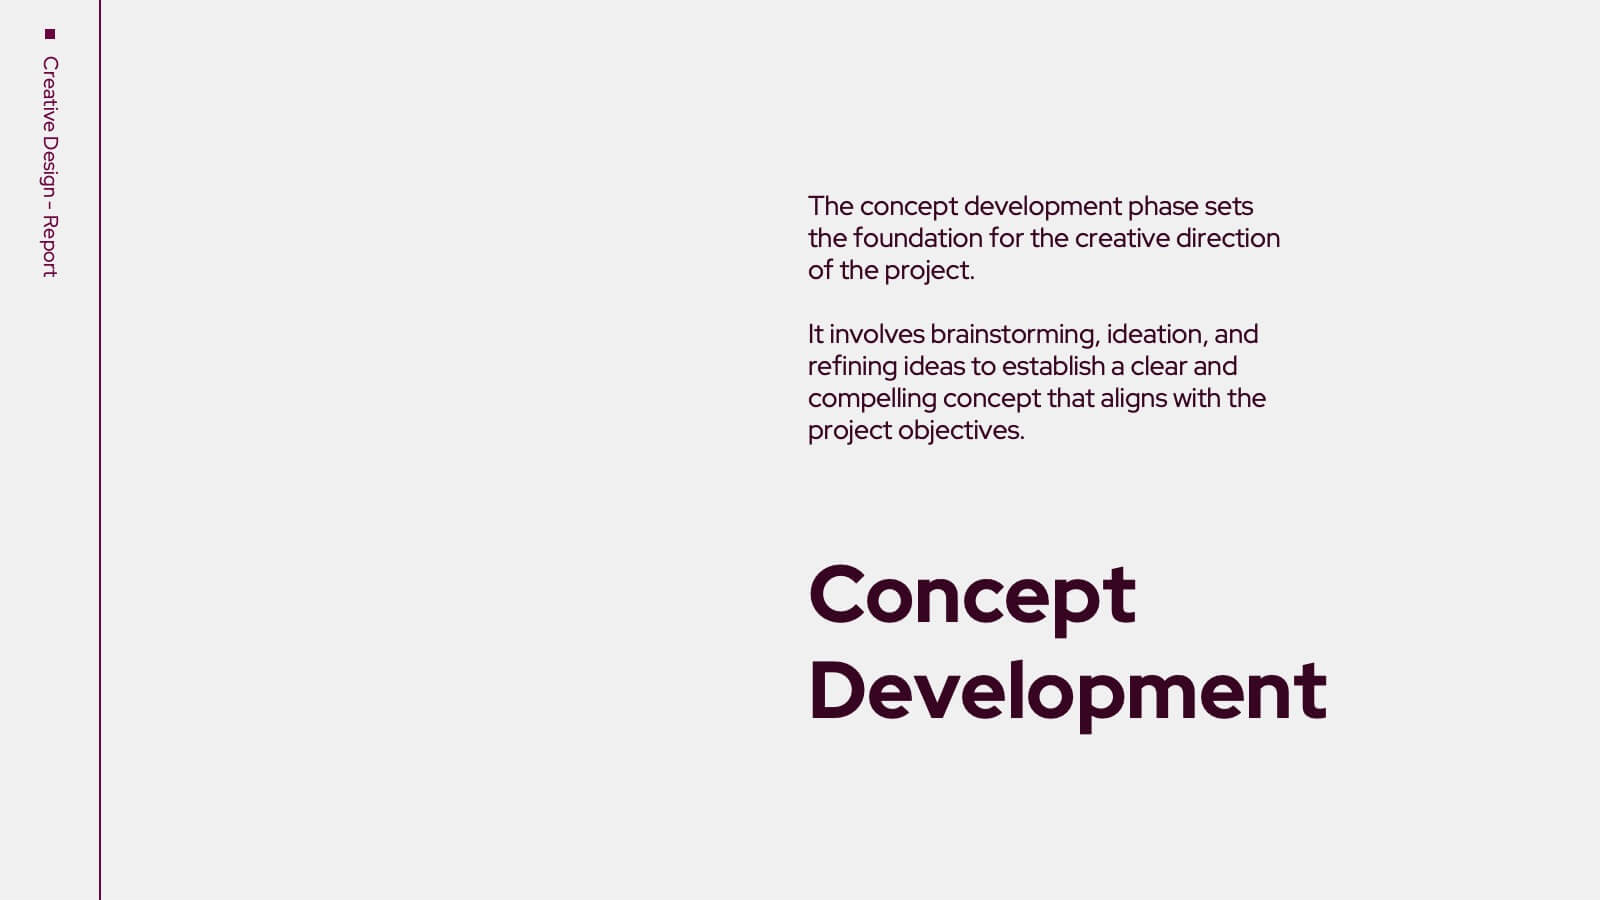
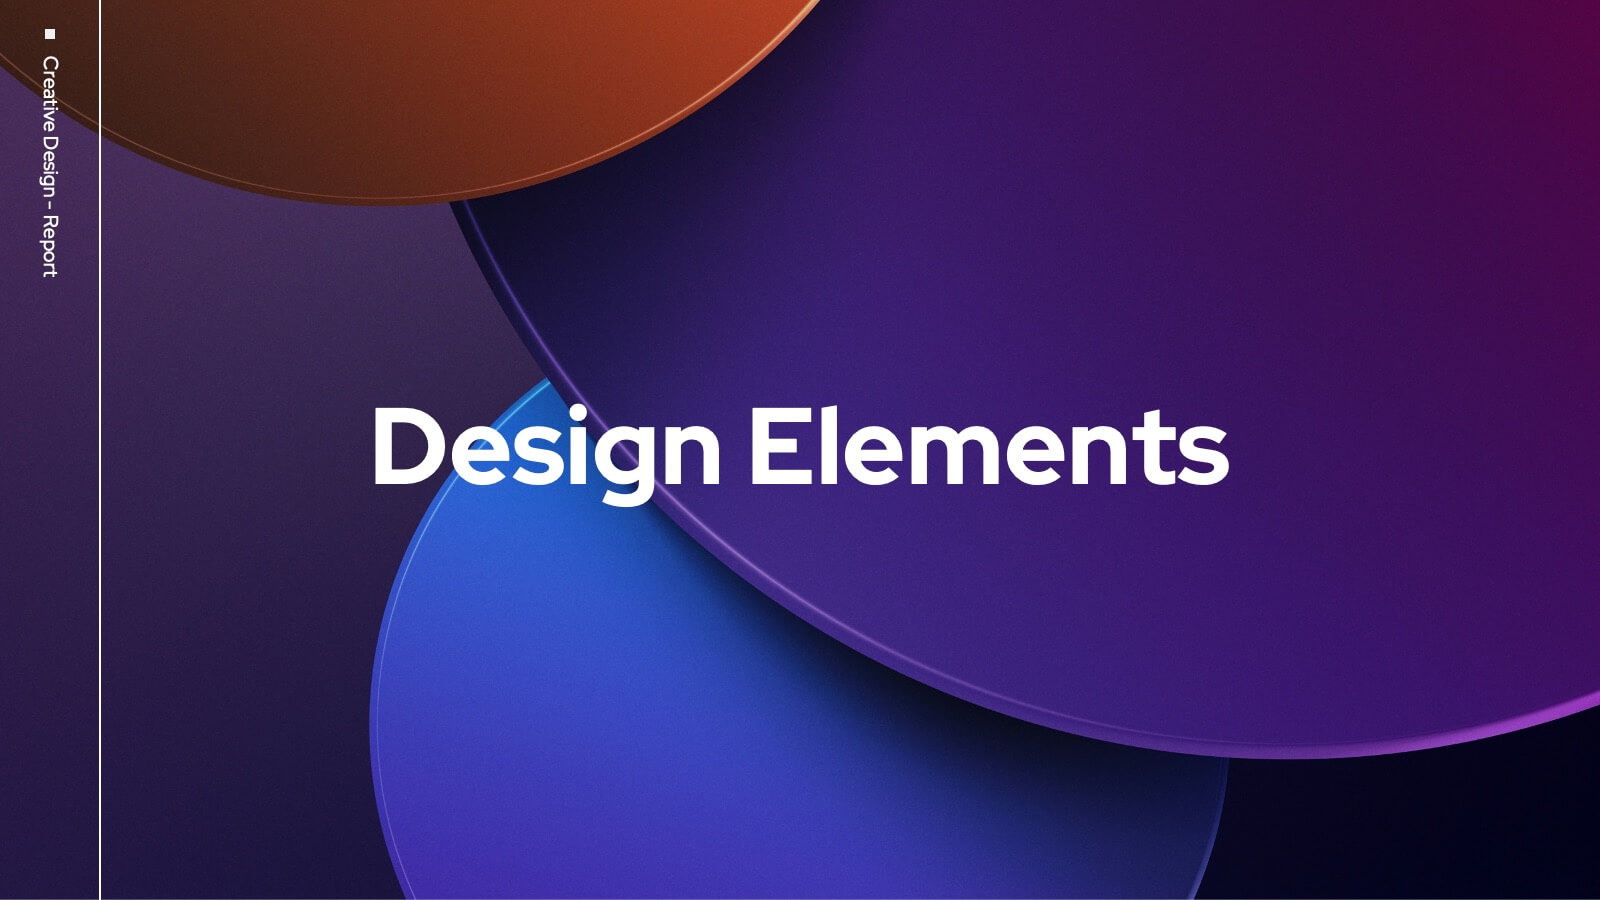
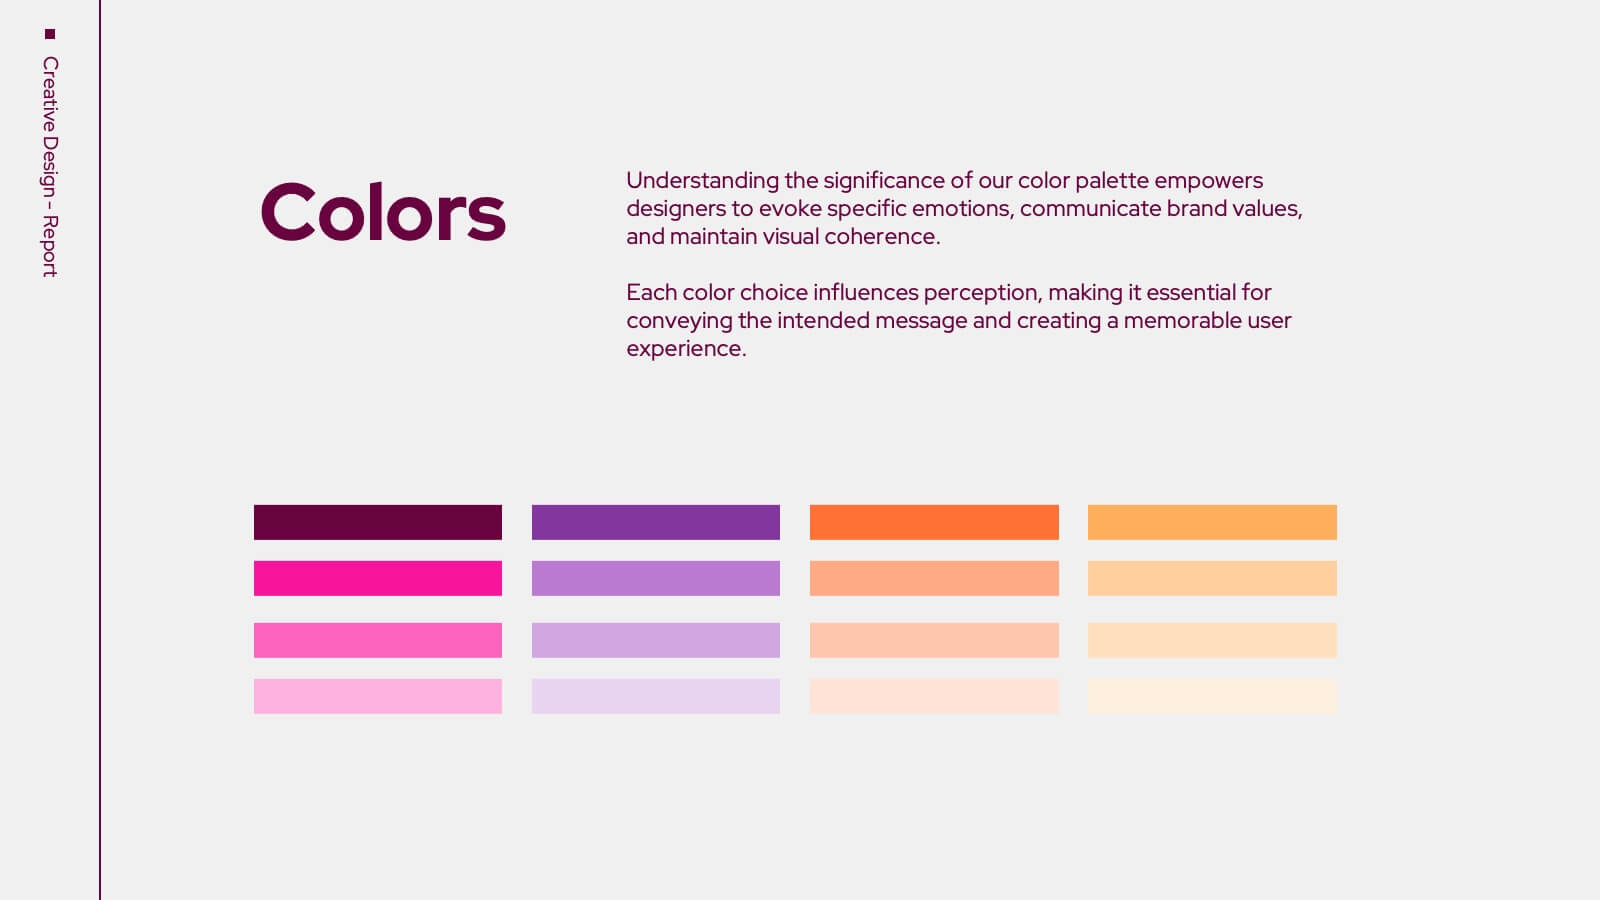
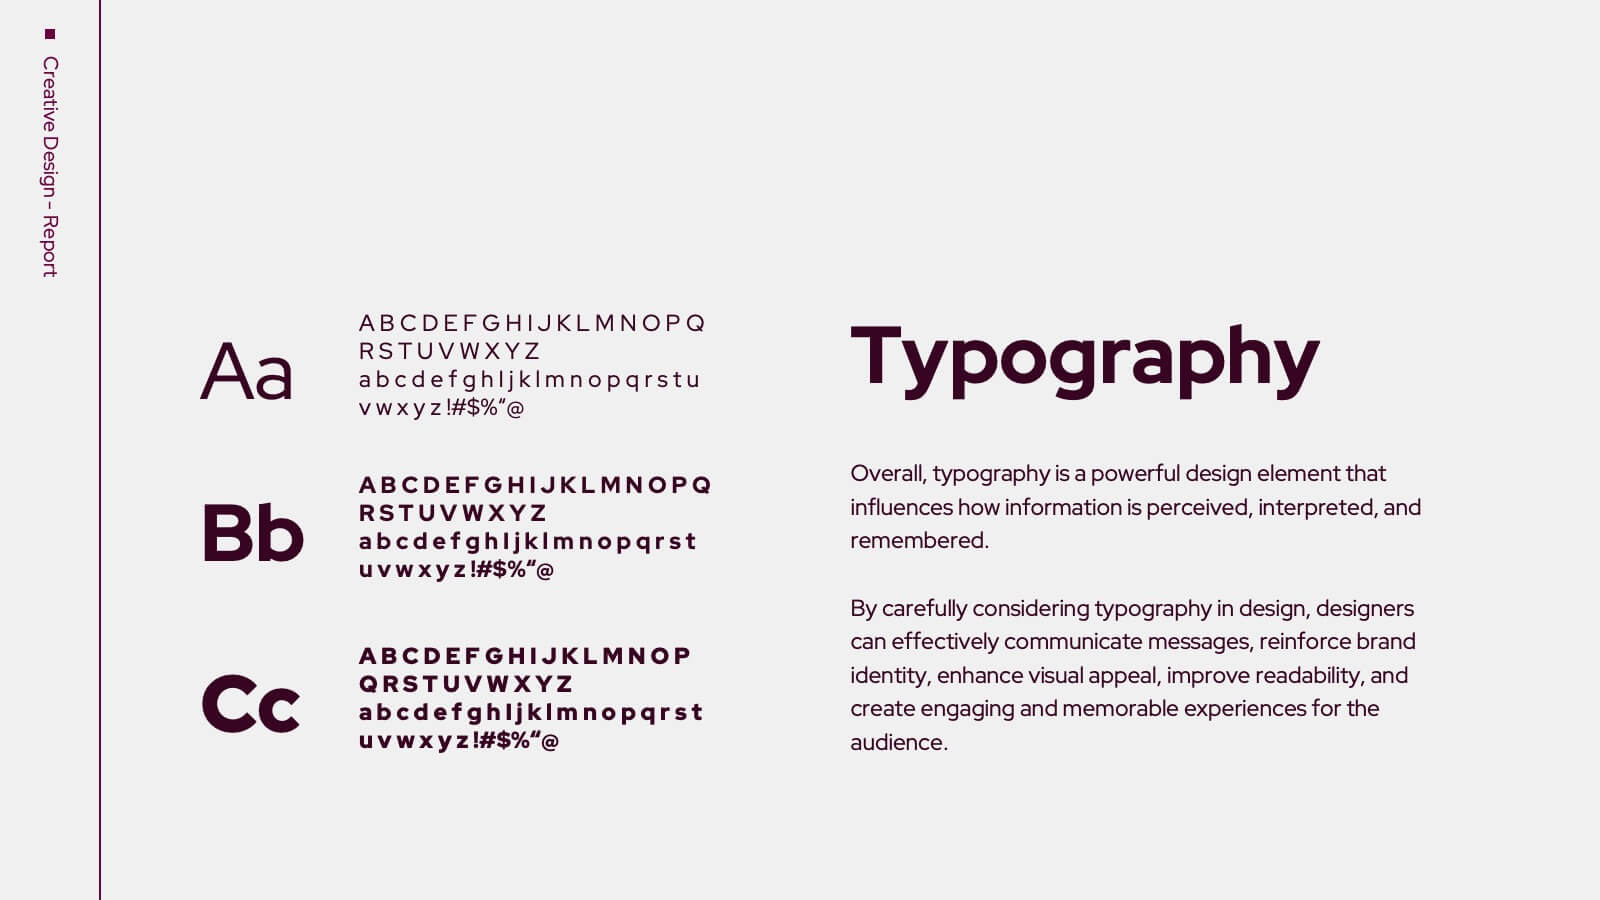
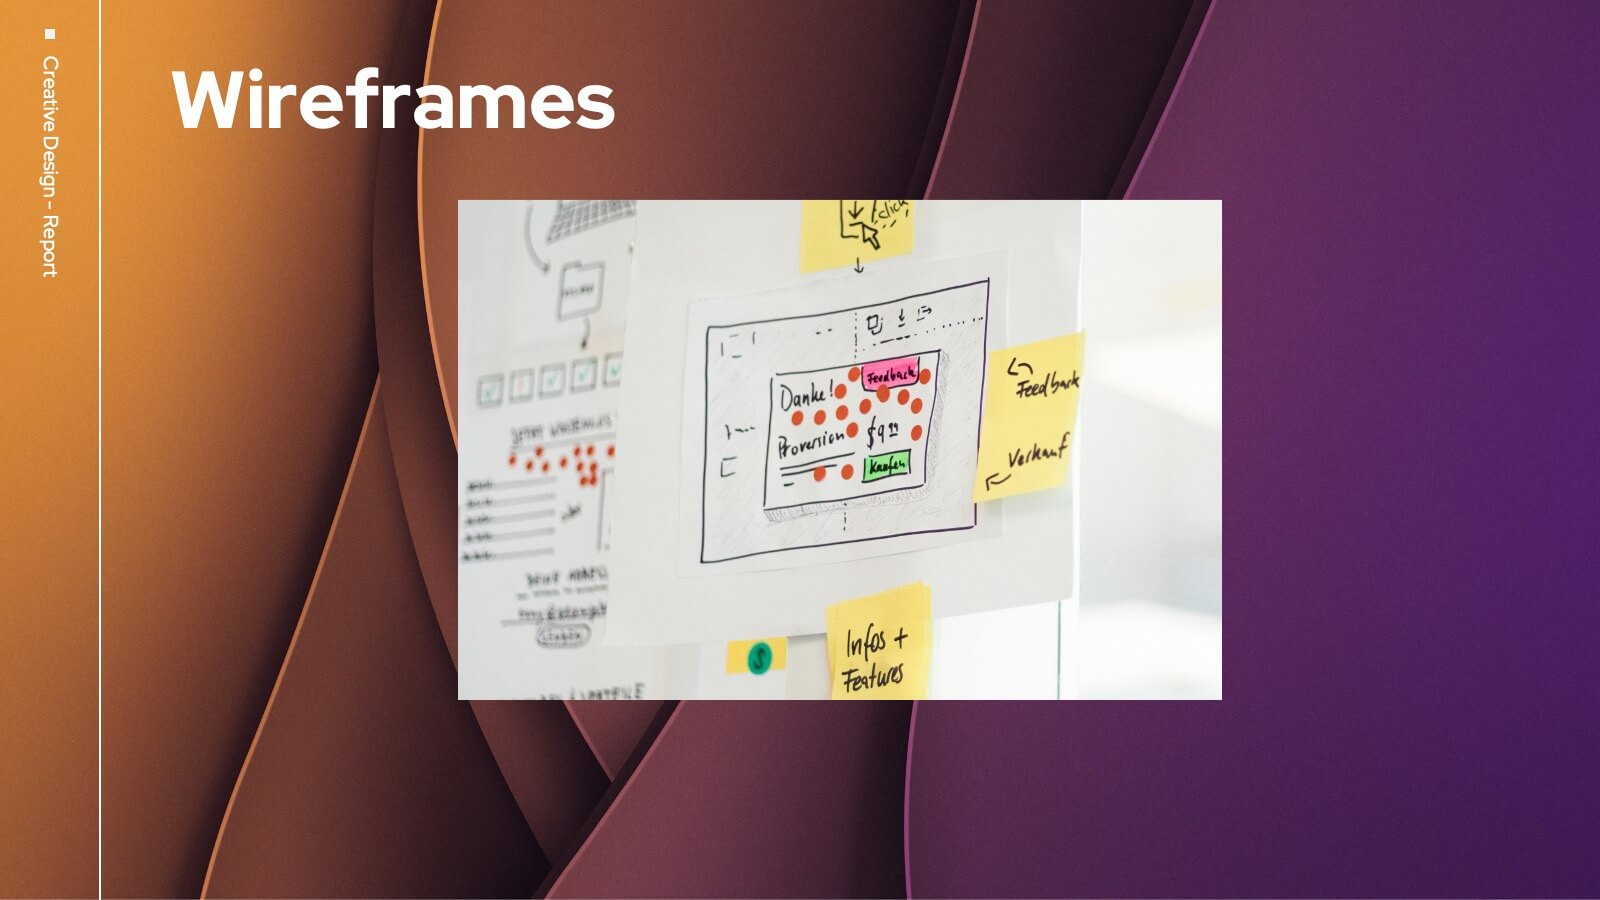
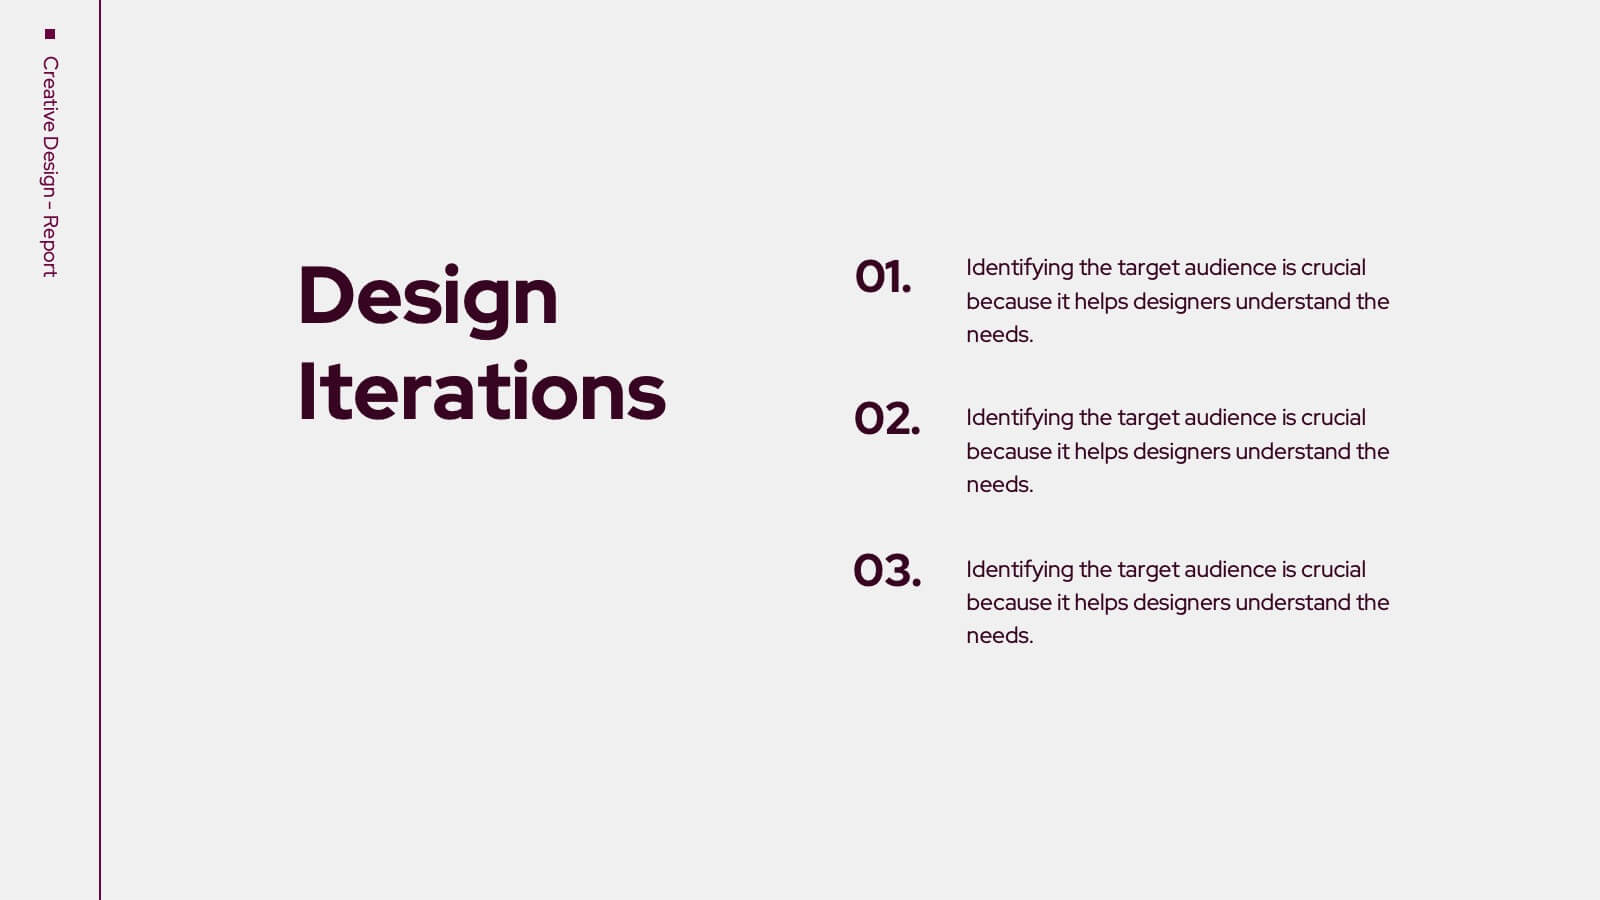
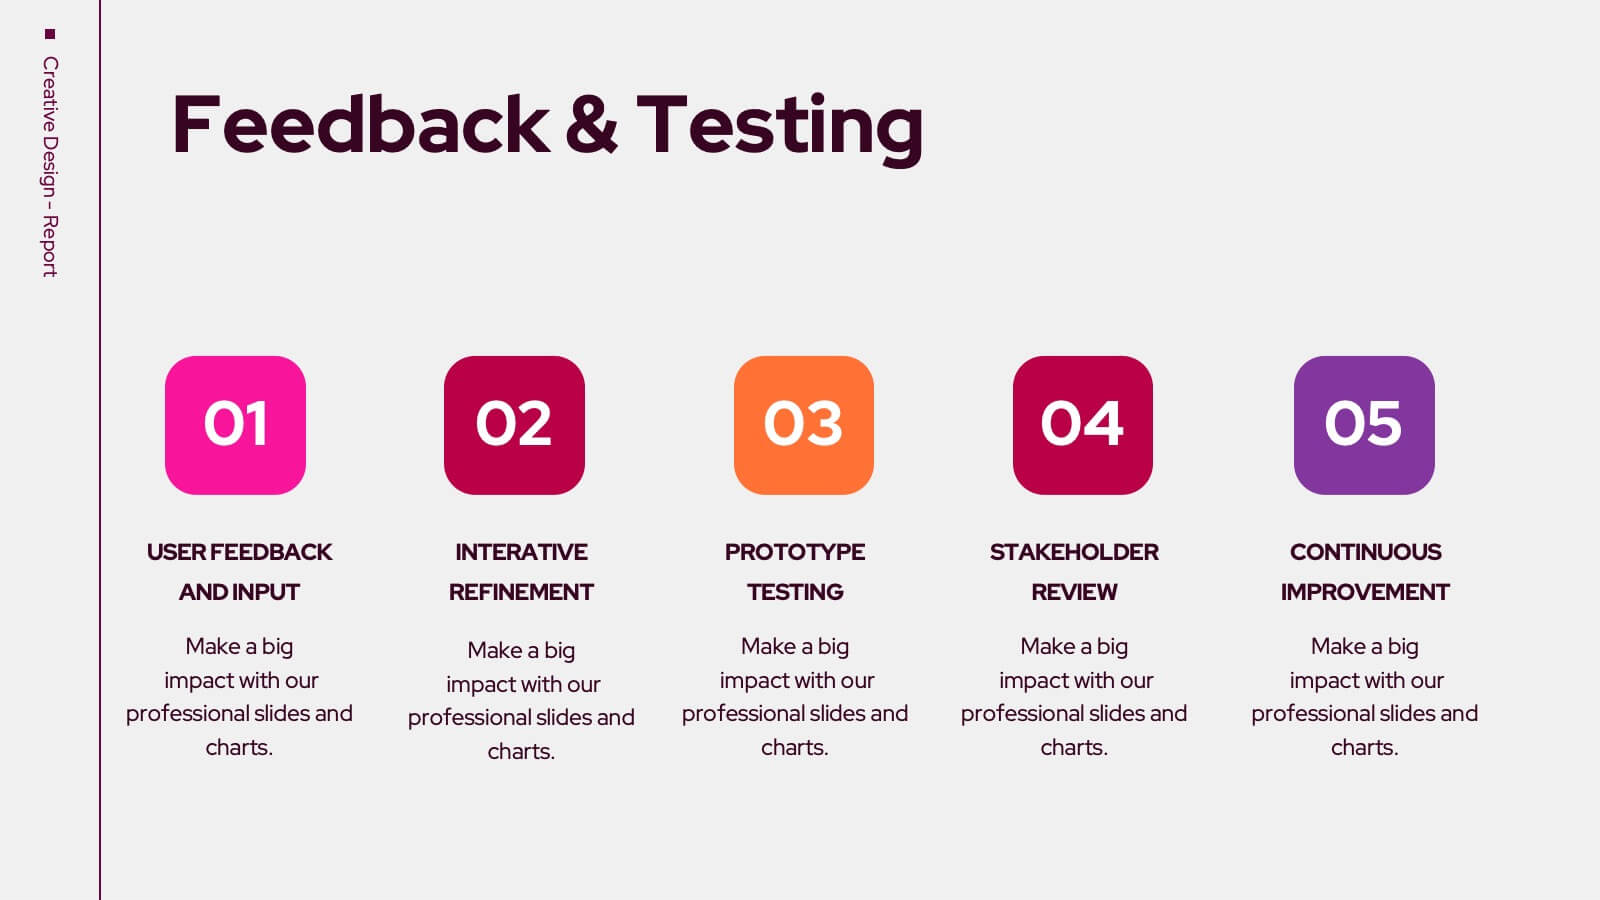
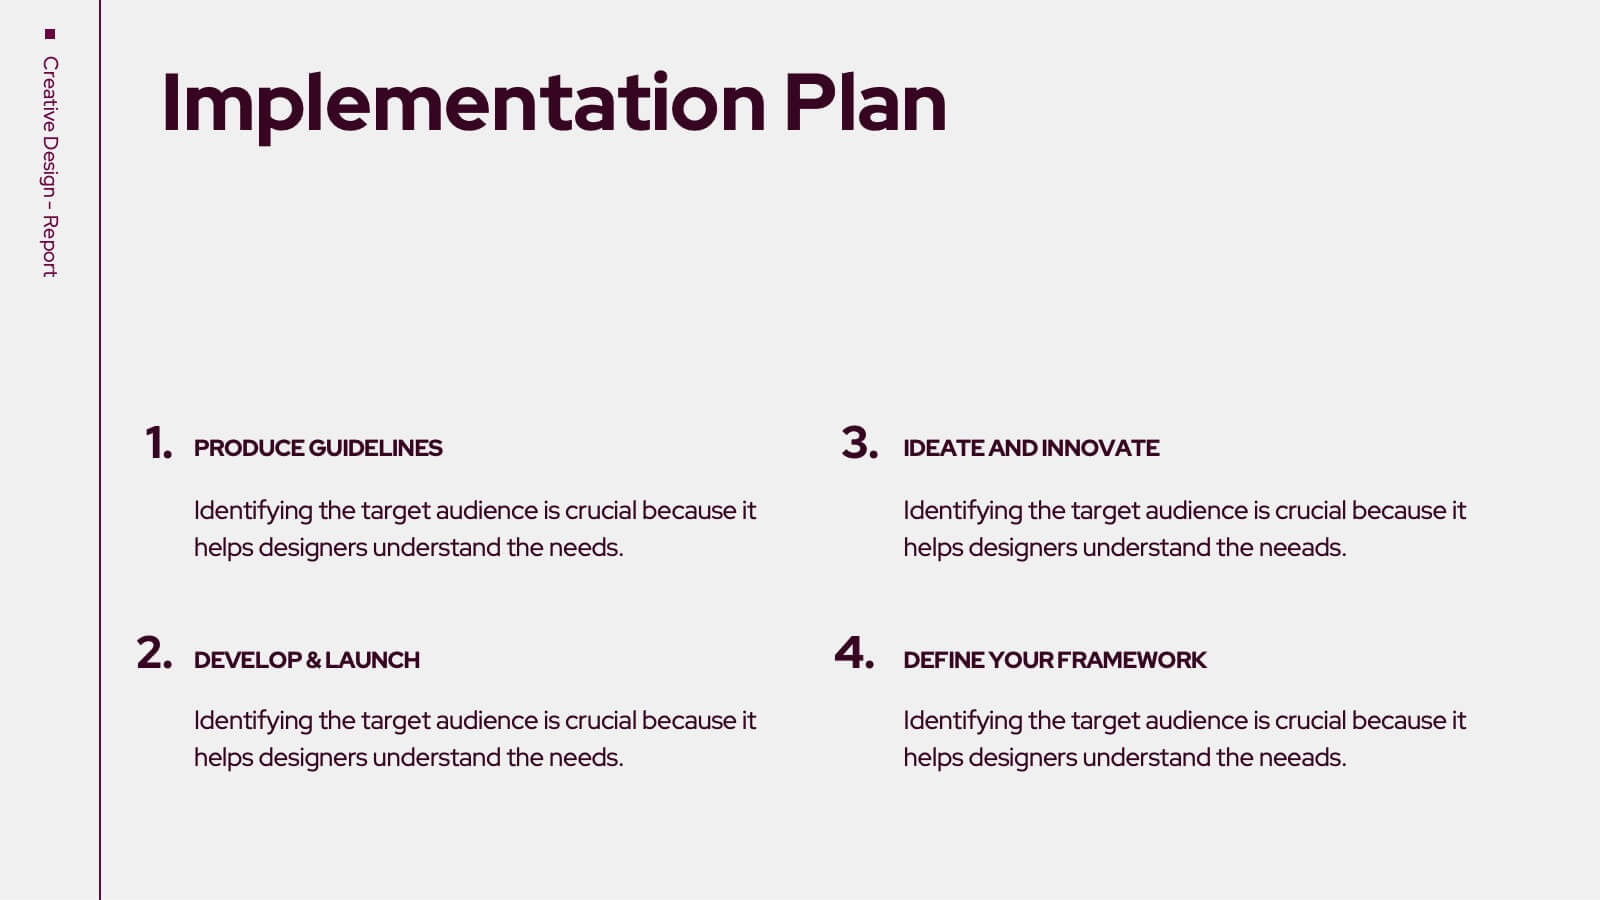
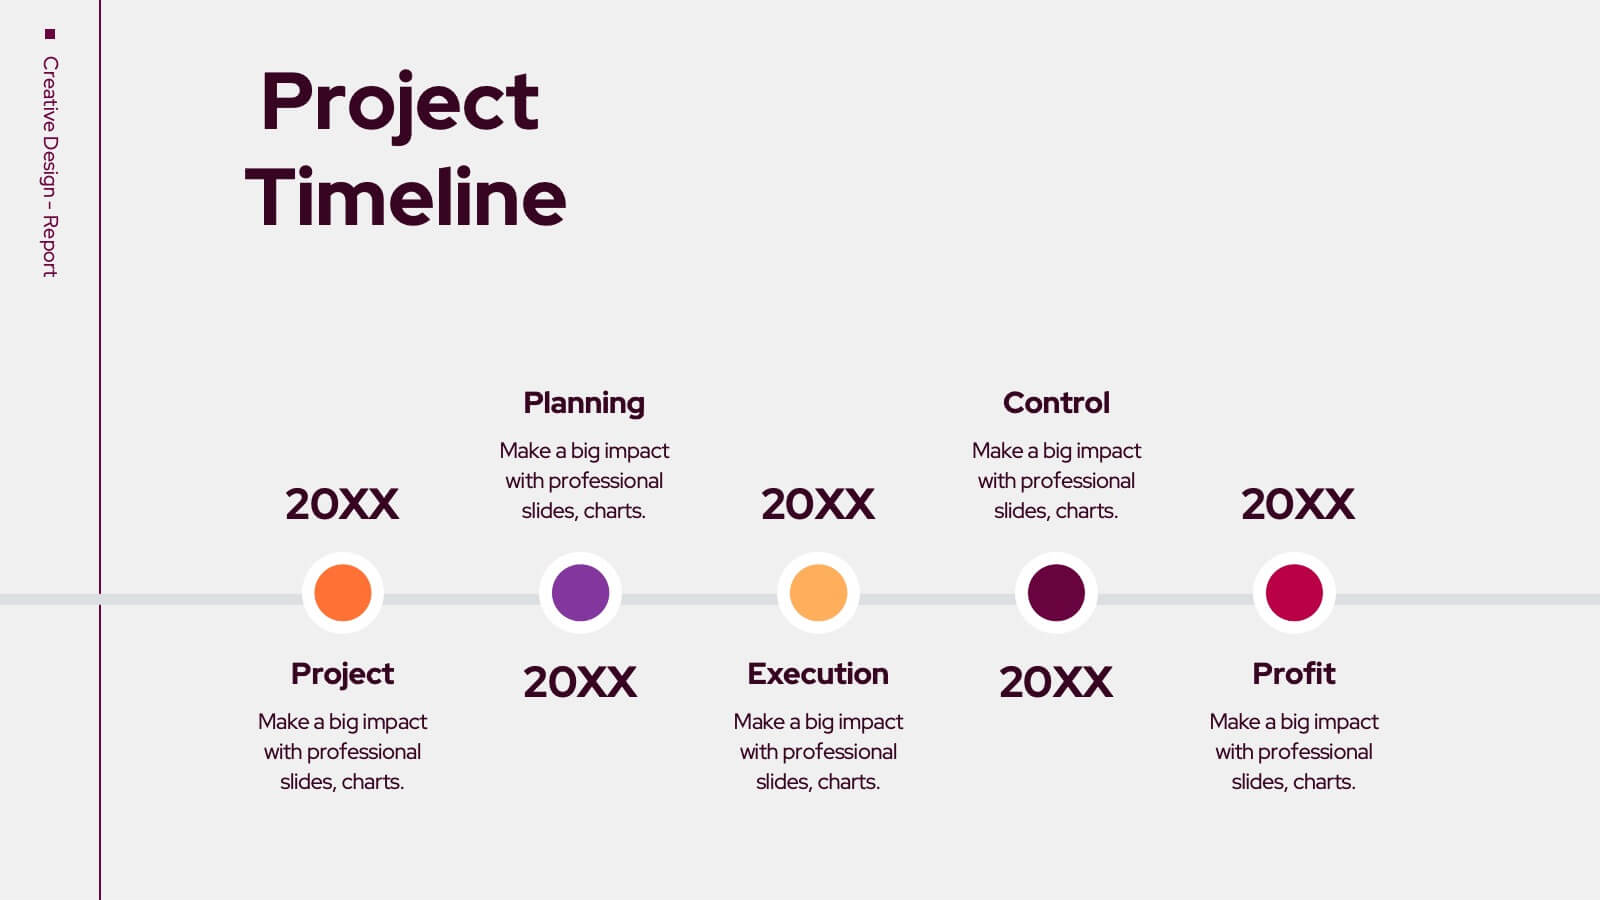
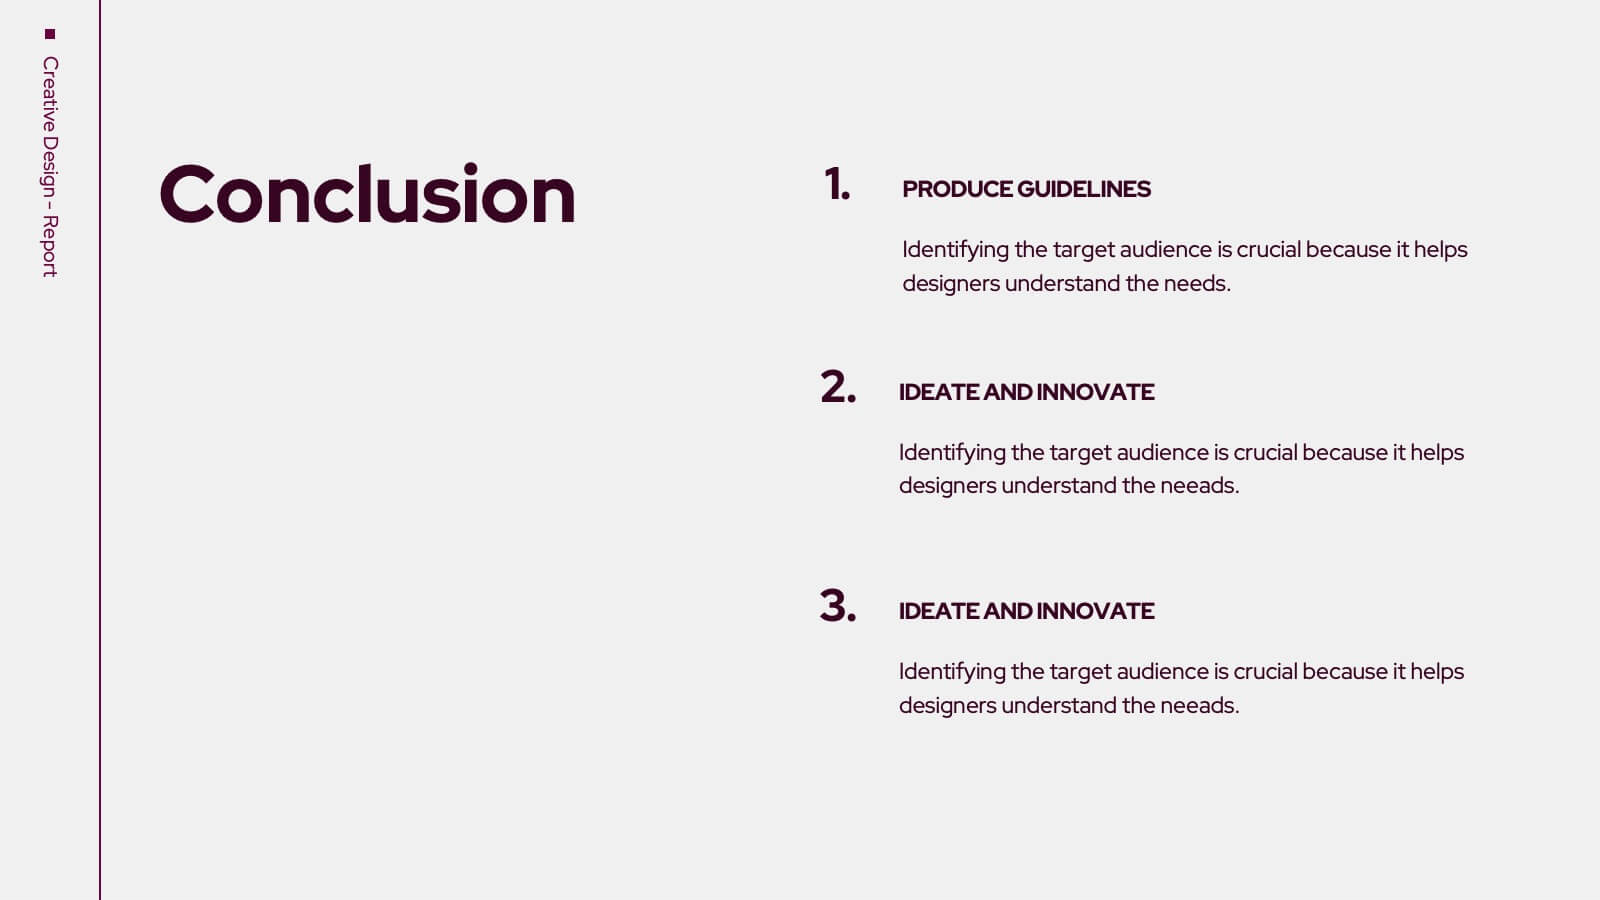
Trojan Creative Design Report Presentation
Unleash your creativity with this striking Trojan-inspired presentation template! Ideal for showcasing your design projects, this presentation enables you to highlight key concepts, inspirations, and visual elements effectively. Its engaging layout ensures your ideas shine through, captivating your audience. Compatible with PowerPoint, Keynote, and Google Slides for seamless presentations.


7 diapositivas
Fishbone Stitch Infographic
Thread together insights with our fishbone stitch infographic. Set on a crisp white canvas, accented with the depth of purple, the intensity of red, and the freshness of green, this template elegantly showcases the intricate details of the fishbone stitch technique. Accentuated with intuitive infographics, emblematic icons, and specific image placeholders, it provides a detailed walk-through of this unique stitching method. Perfectly tailored for Powerpoint, Keynote, or Google Slides. A must-have for fashion designers, textile students, craft enthusiasts, or anyone with a passion for intricate stitchwork.


7 diapositivas
Social Media Marketing Infographic
Social Media Marketing refers to the use of social media platforms and networks to promote a product, service, or brand. This fully editable, infographic template looks great on all devices and contains all complete set of slides shown above. You can use this colorful infographic to features tips on how to use social media posts, videos, chats and websites along with a brief explanation of each. Add your logo, banner images and call to action. The template is compatible with Powerpoint, Keynote and Google Slides, so you can easily add in your custom data for a professional finish.