


Características


¿Tienes alguna pregunta?
Recomendar


26 diapositivas
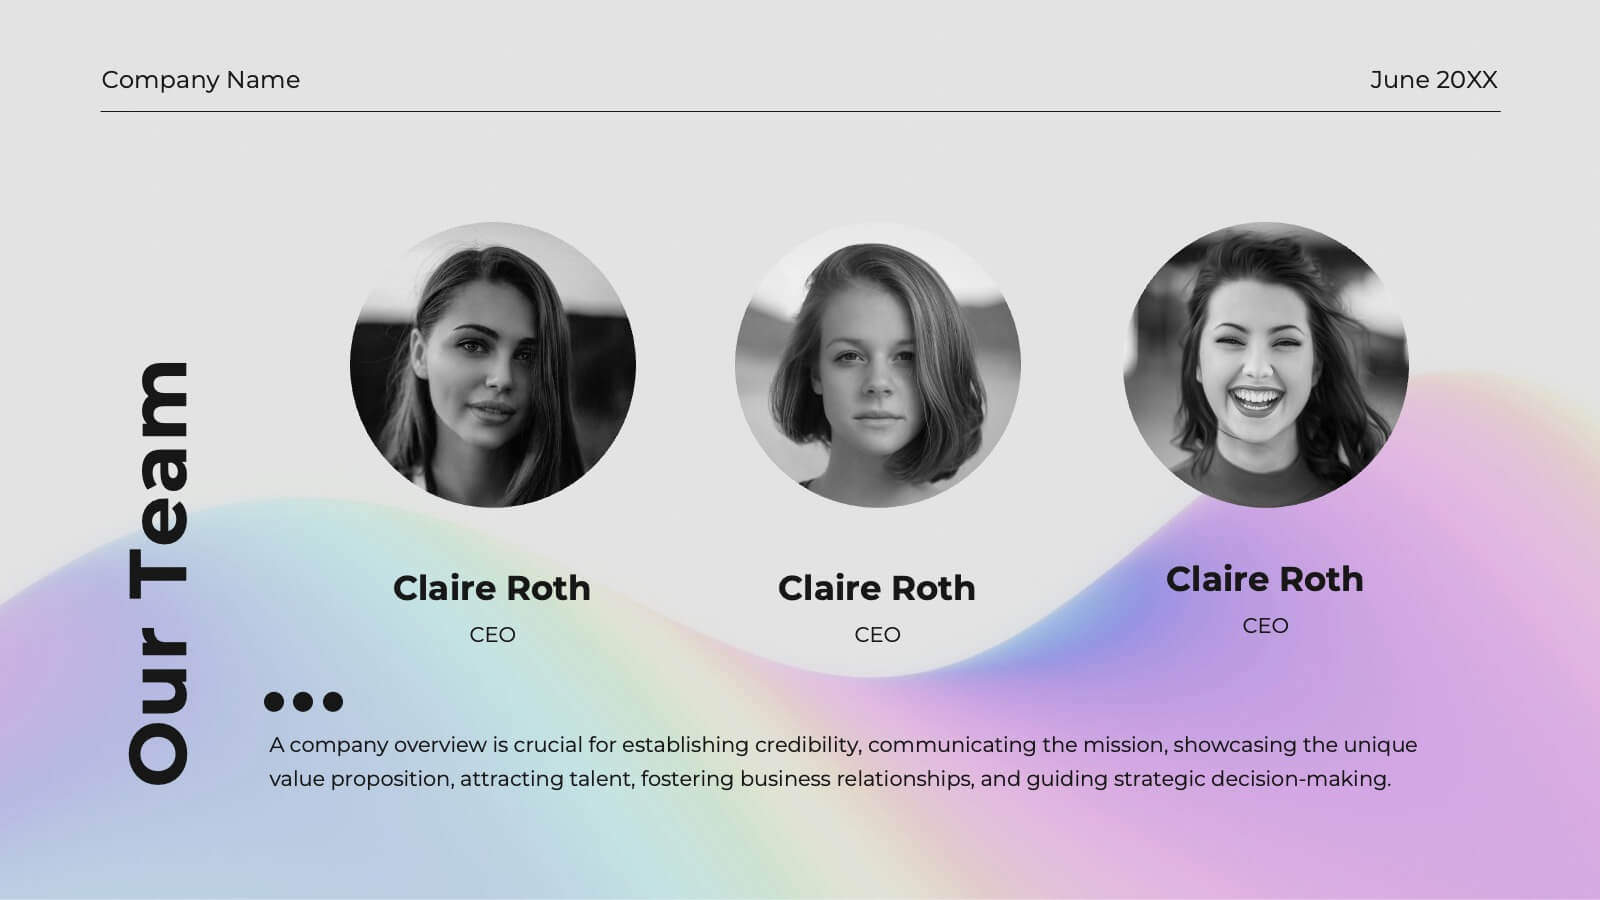
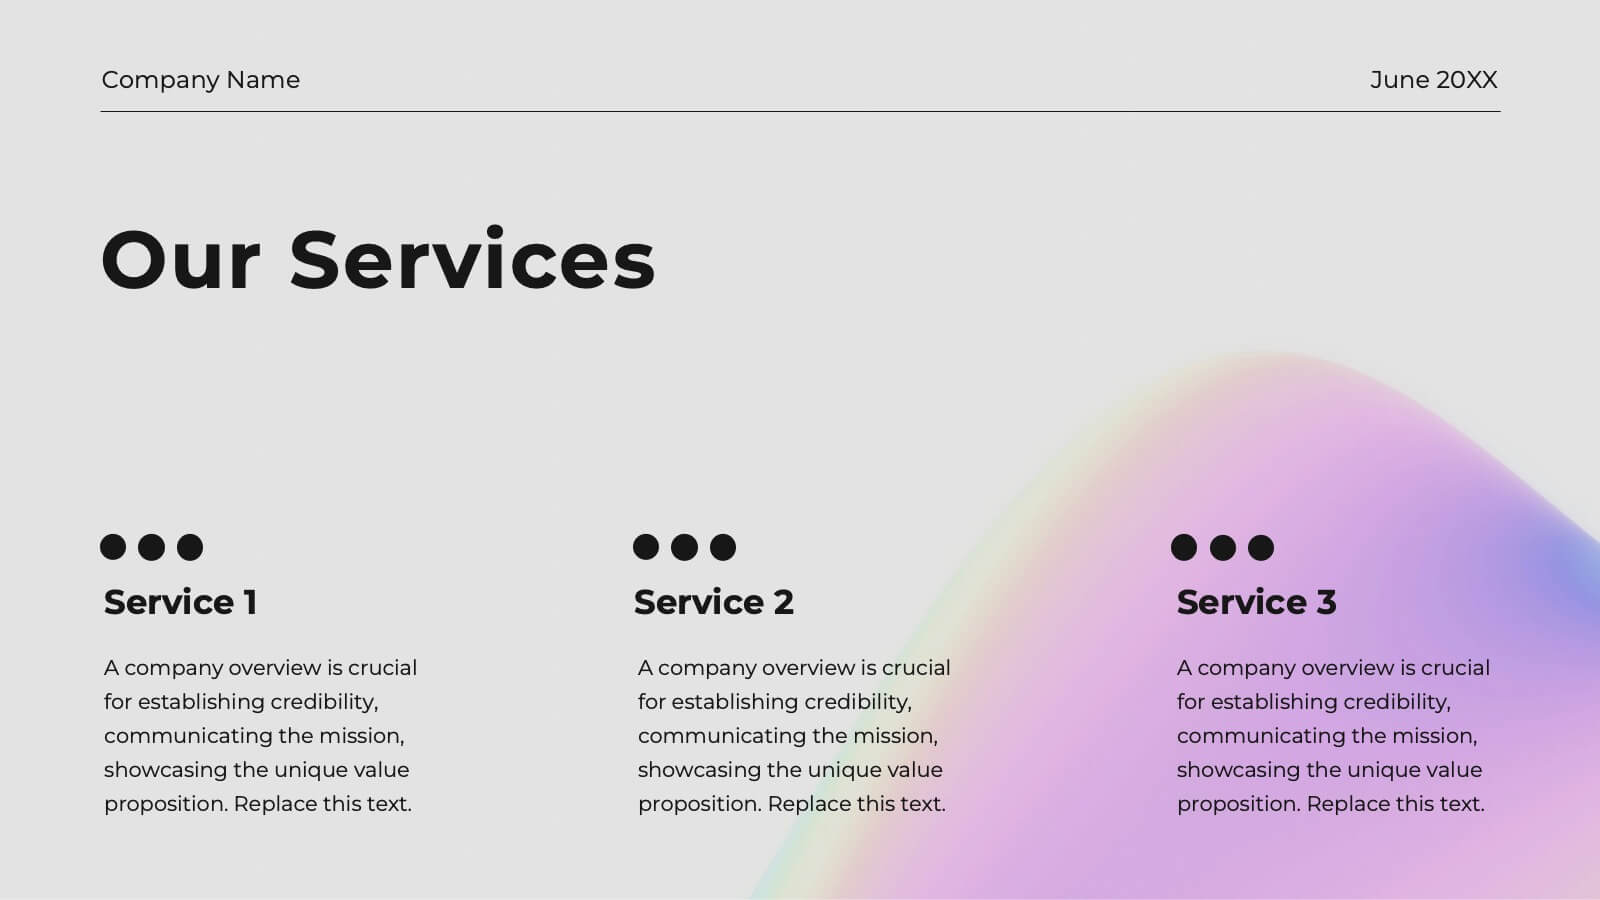
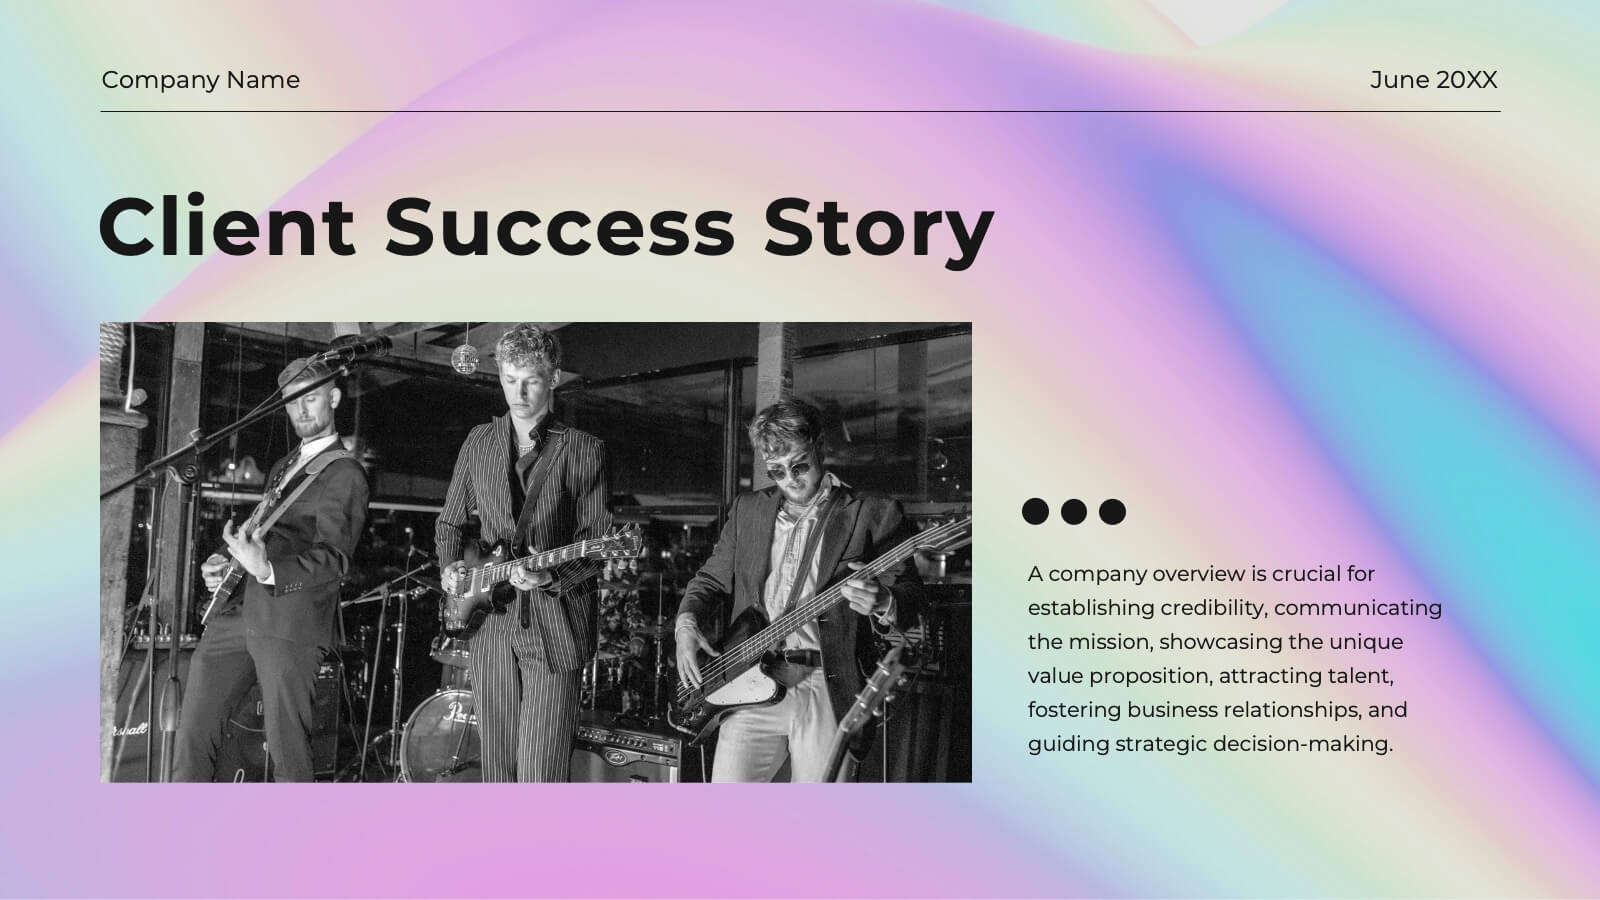
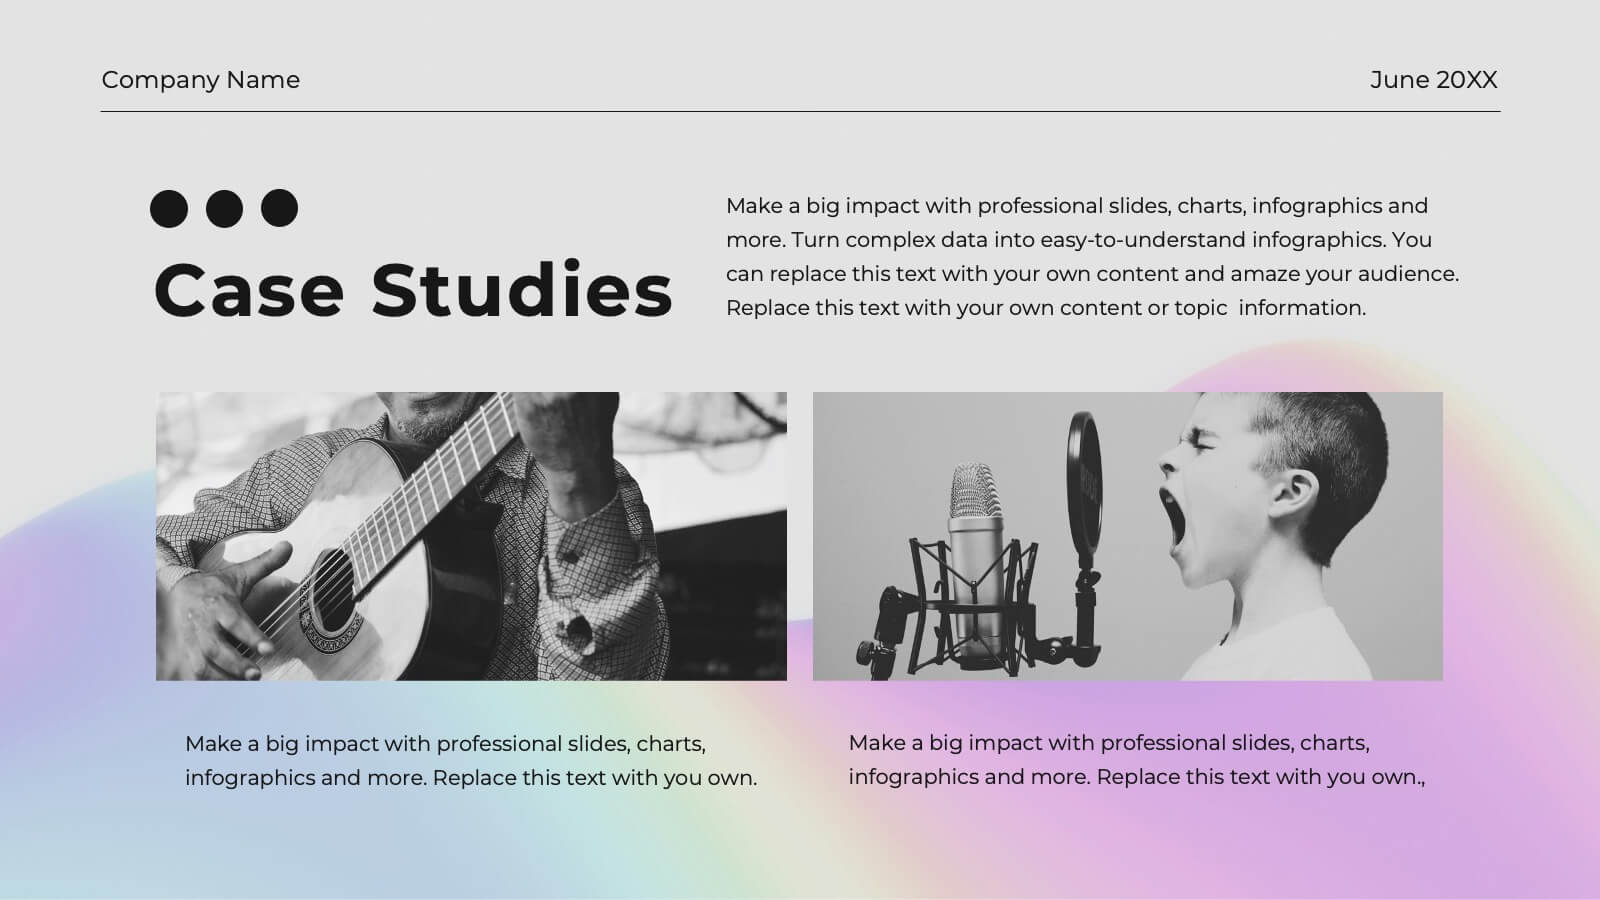
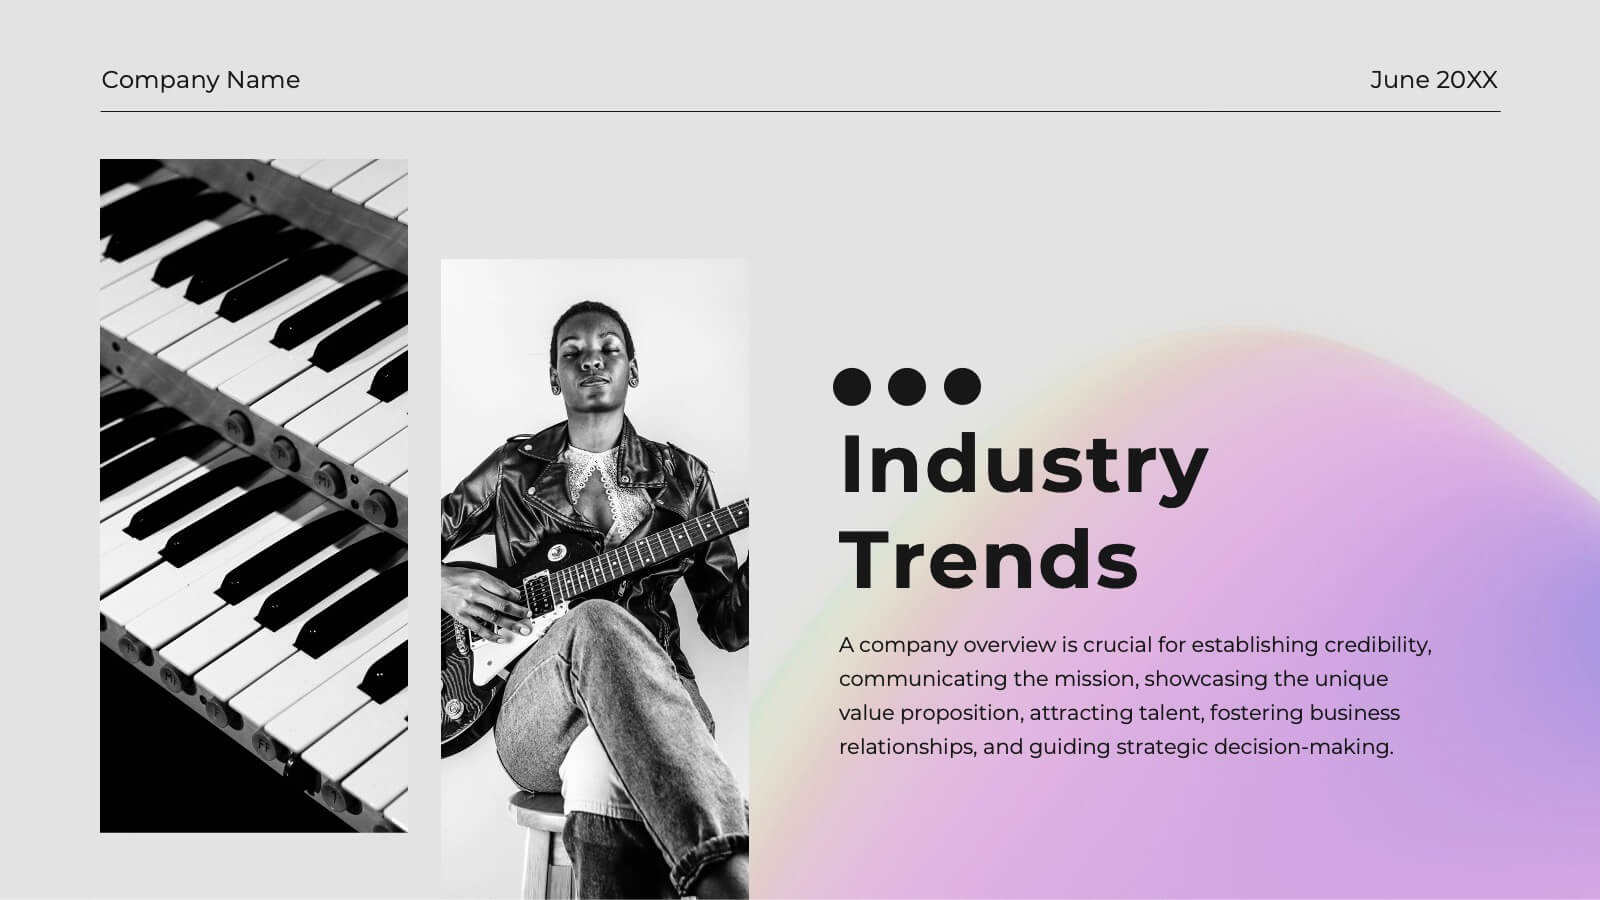
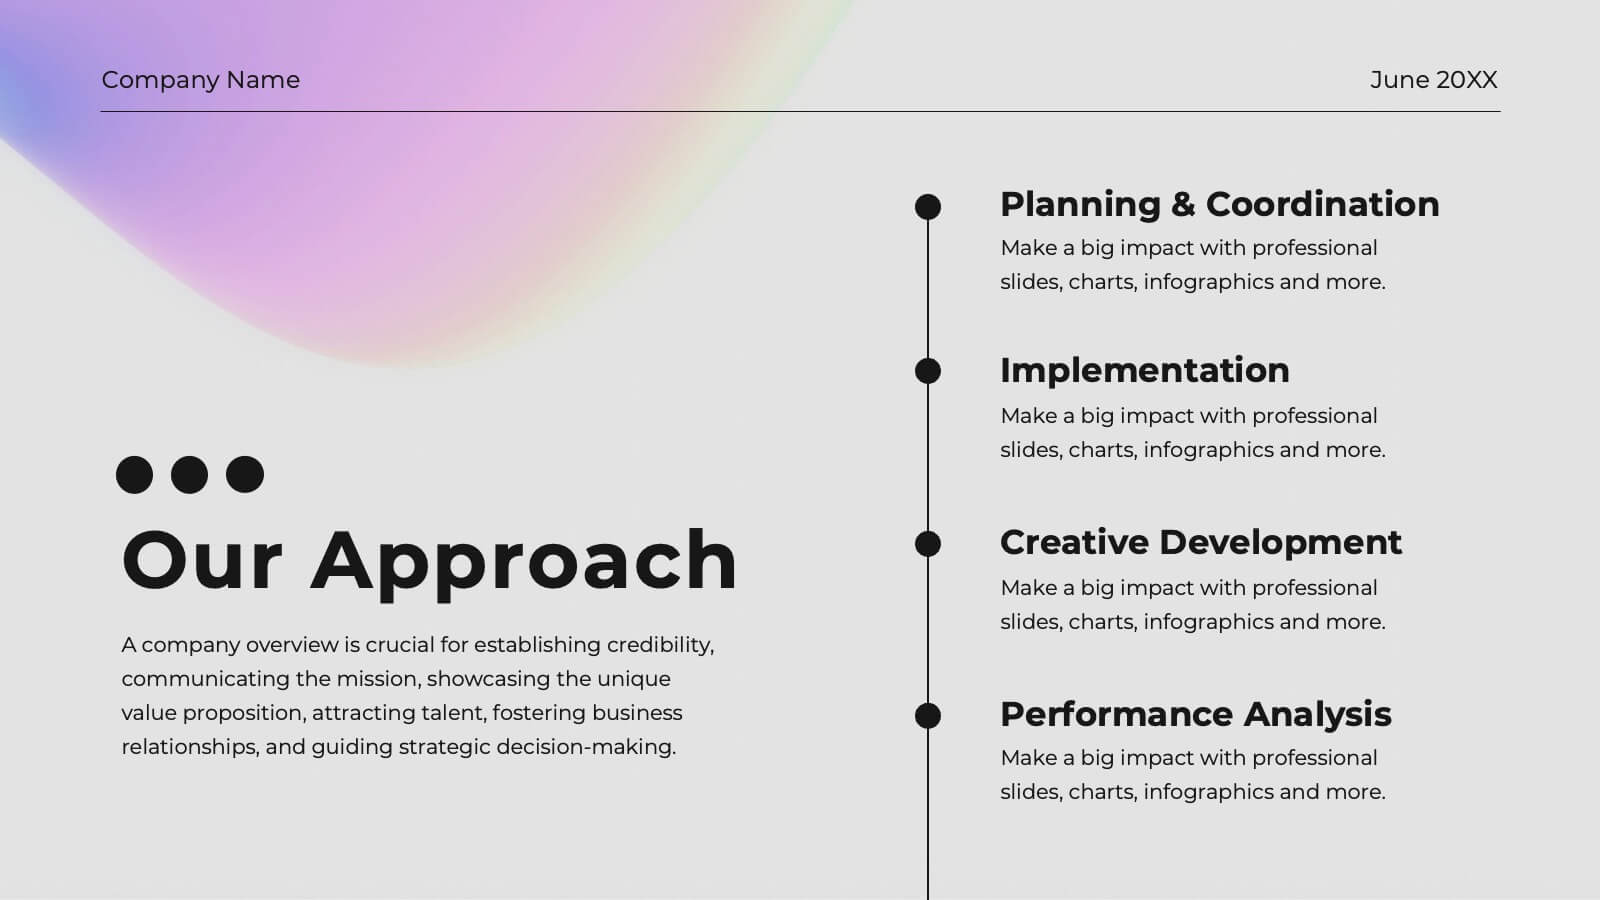
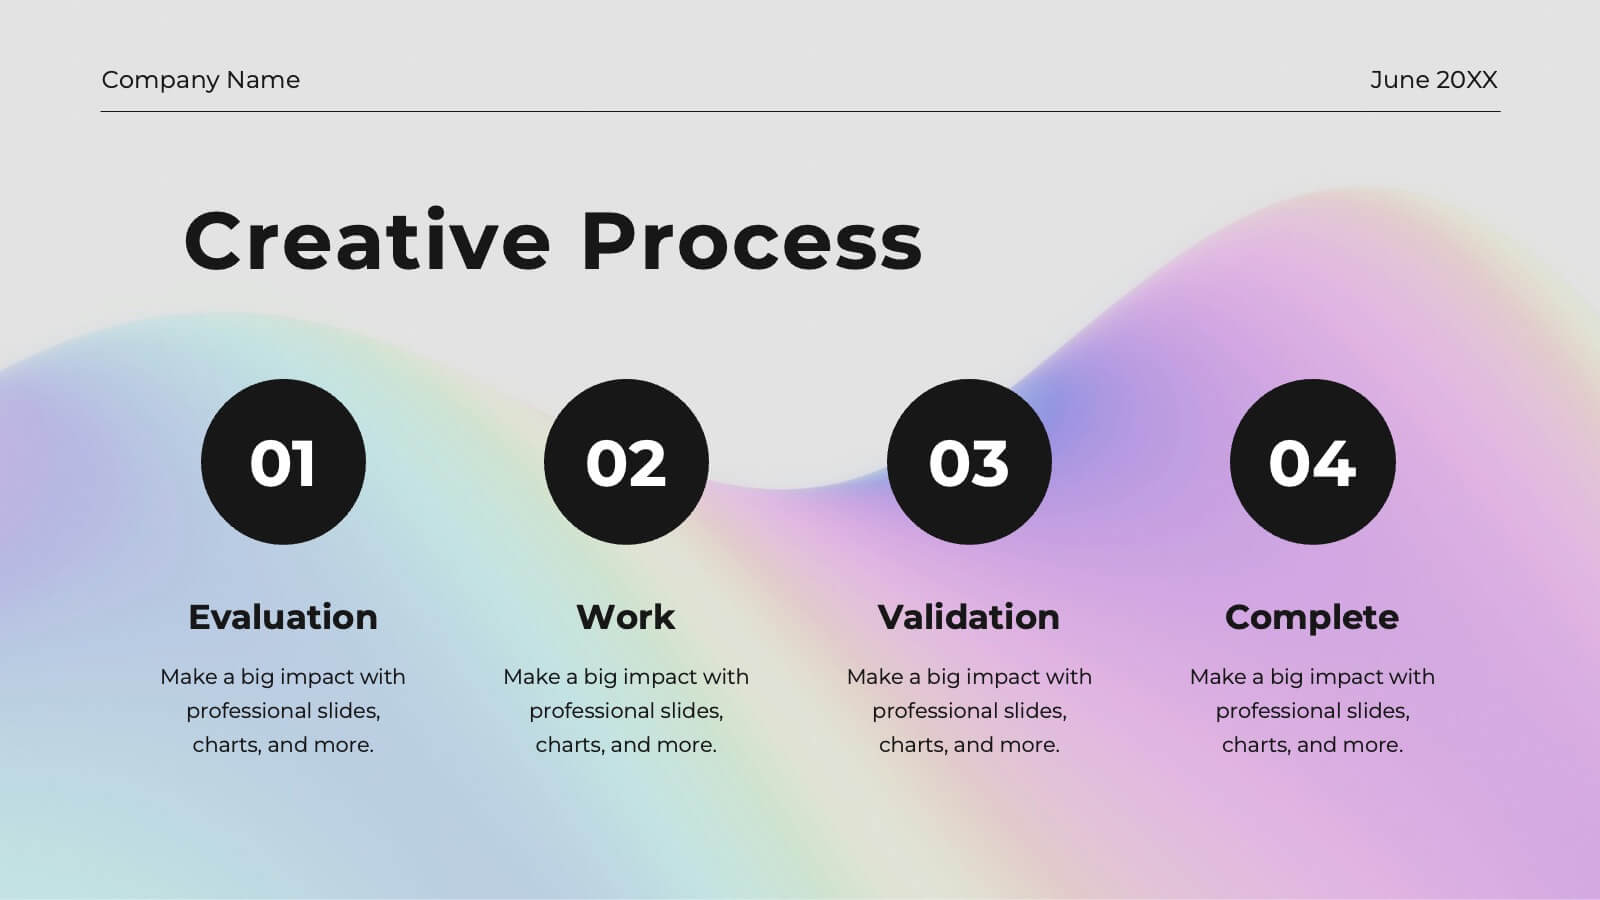
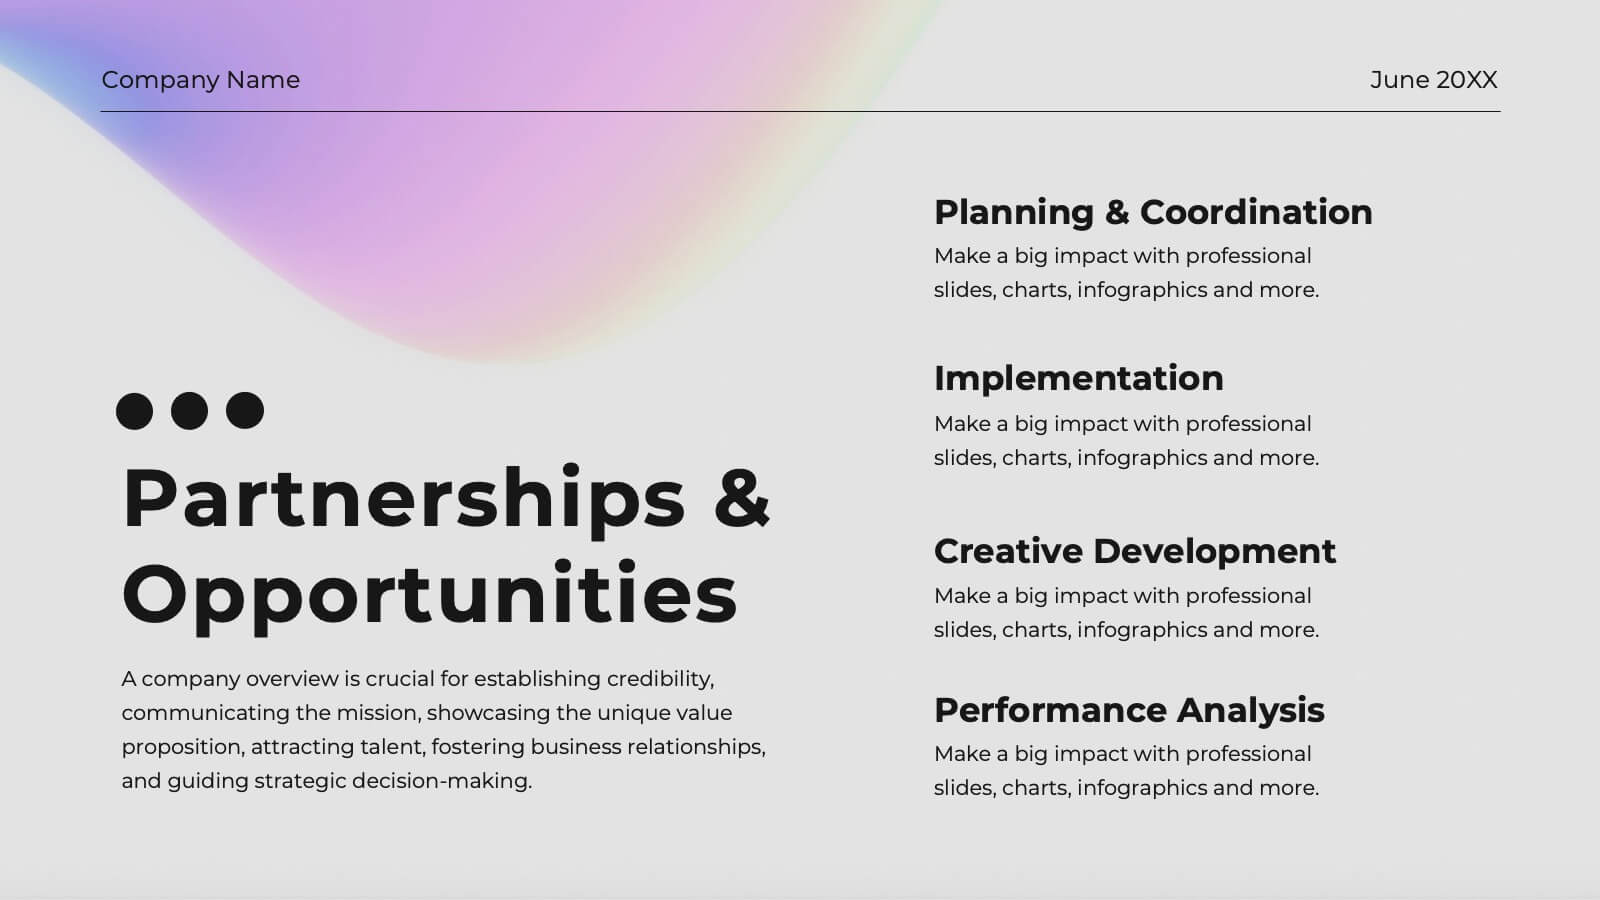
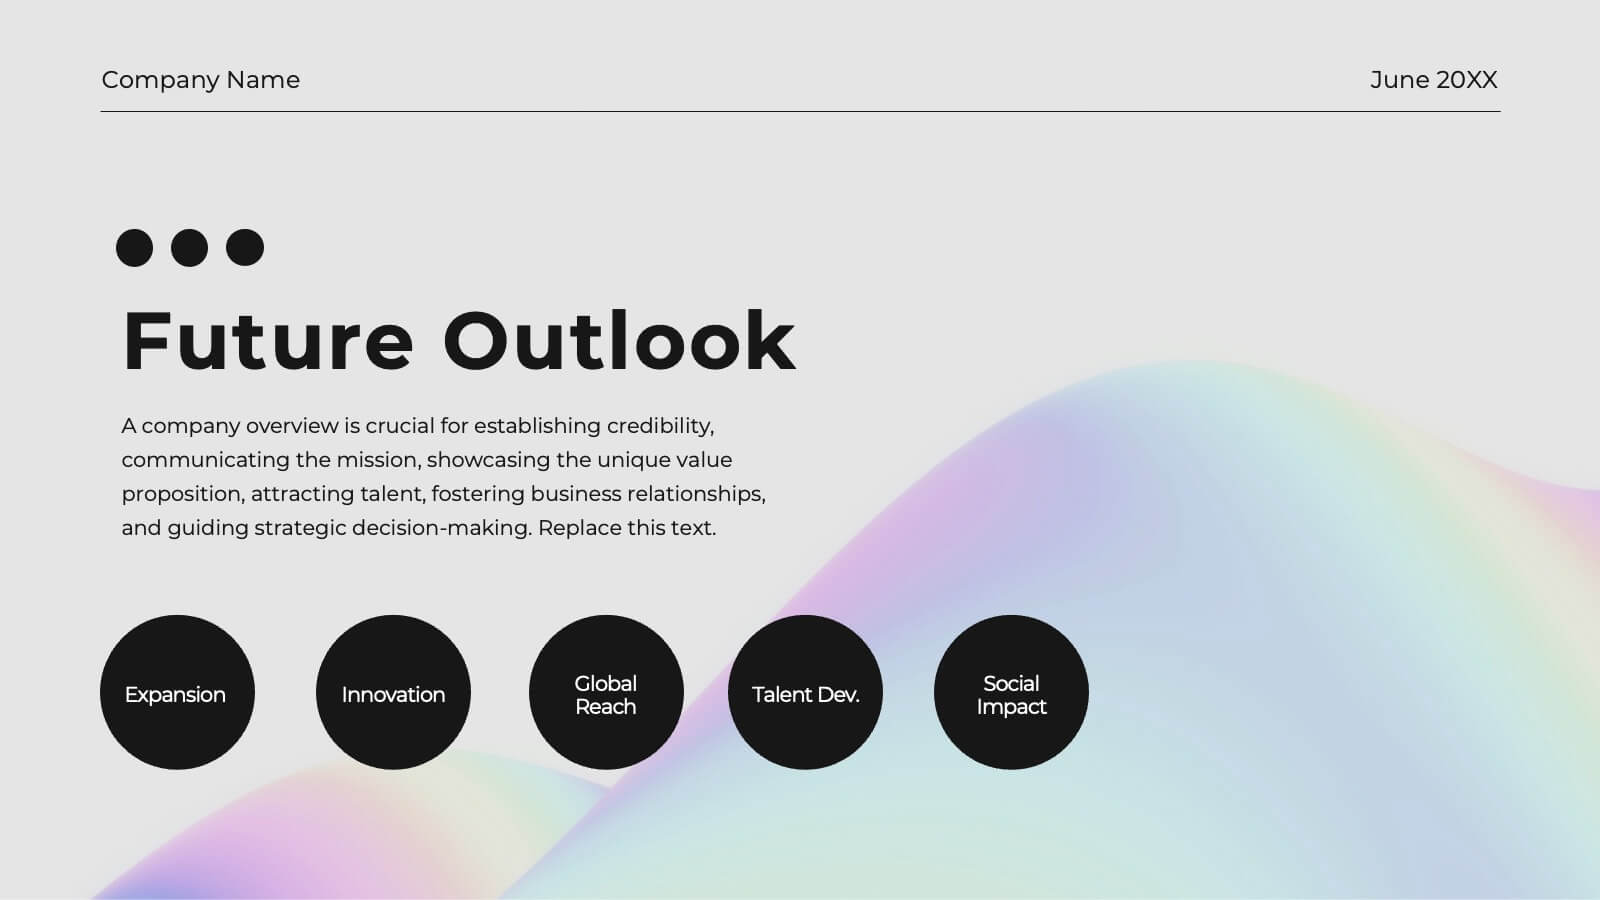
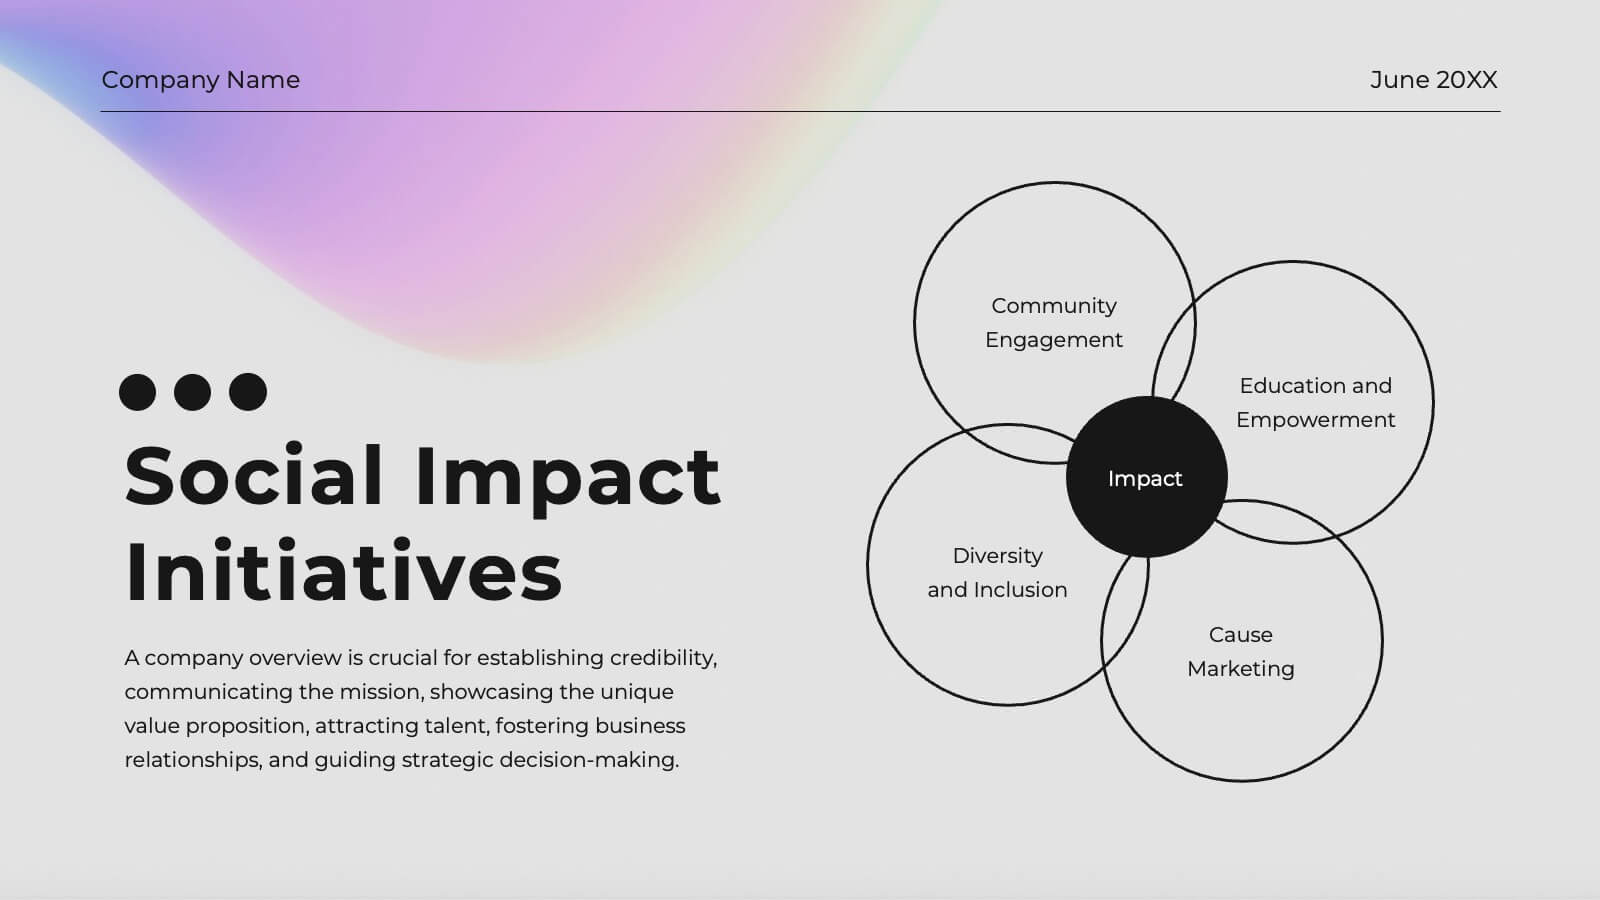
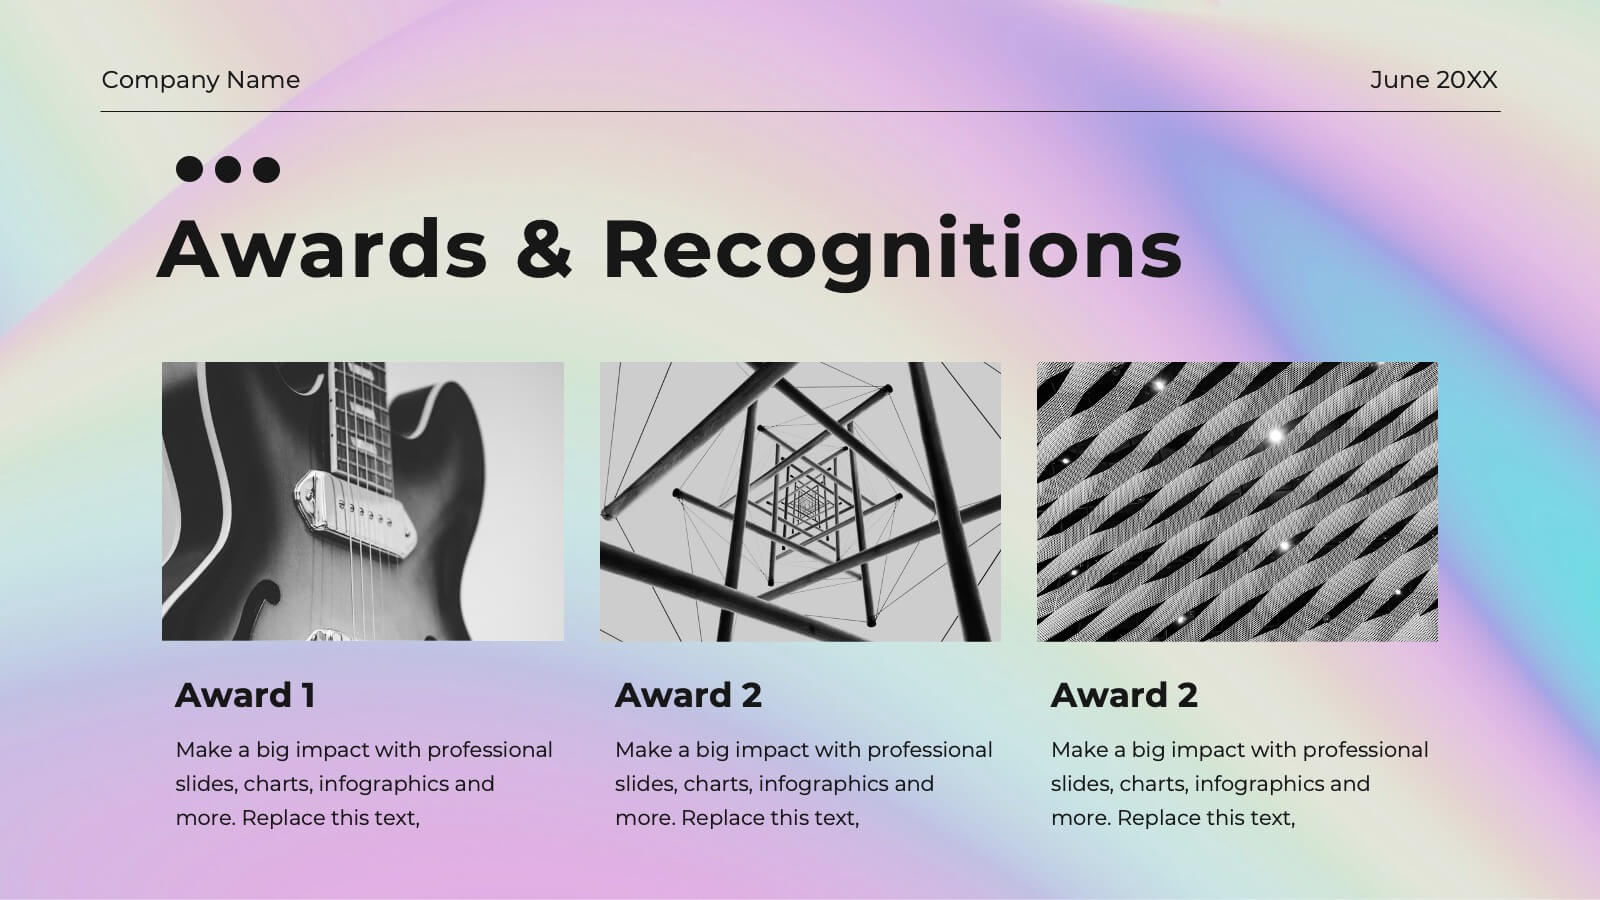
Arana Presentation Template
Arana is a minimal and stylish template to create stunning presentations. This template is perfect for training your business staff or team on how to use various services or products. It's easy to use, resulting in high quality presentations that look great to your clients or customers. Its slide designs can be used with each other to make more elaborate presentations complete with charts, images and text boxes. Arana simple yet stylish design makes it easy for anyone to use. With the large amount of information included, your presentation will look lighter, appealing, and easy to understand.


6 diapositivas
Cognitive Psychology Infographics
Delve into the fascinating realm of Cognitive Psychology with our customizable infographic template. This template is fully compatible with popular presentation software like PowerPoint, Keynote, and Google Slides, allowing you to easily tailor it to convey essential concepts and insights within the field of Cognitive Psychology. The Cognitive Psychology infographic template serves as a visually engaging platform for summarizing key principles, theories, and research findings. Whether you're a psychology student, educator, or simply intrigued by the workings of the human mind, this template provides a user-friendly canvas to create informative presentations and educational materials. Enhance your understanding of Cognitive Psychology with this SEO-optimized infographic template, designed for clarity and ease of use. Customize it to showcase cognitive processes, influential experiments, and practical applications, making complex concepts more accessible to your audience. Start crafting your personalized infographic today to explore the depths of Cognitive Psychology.
22 diapositivas
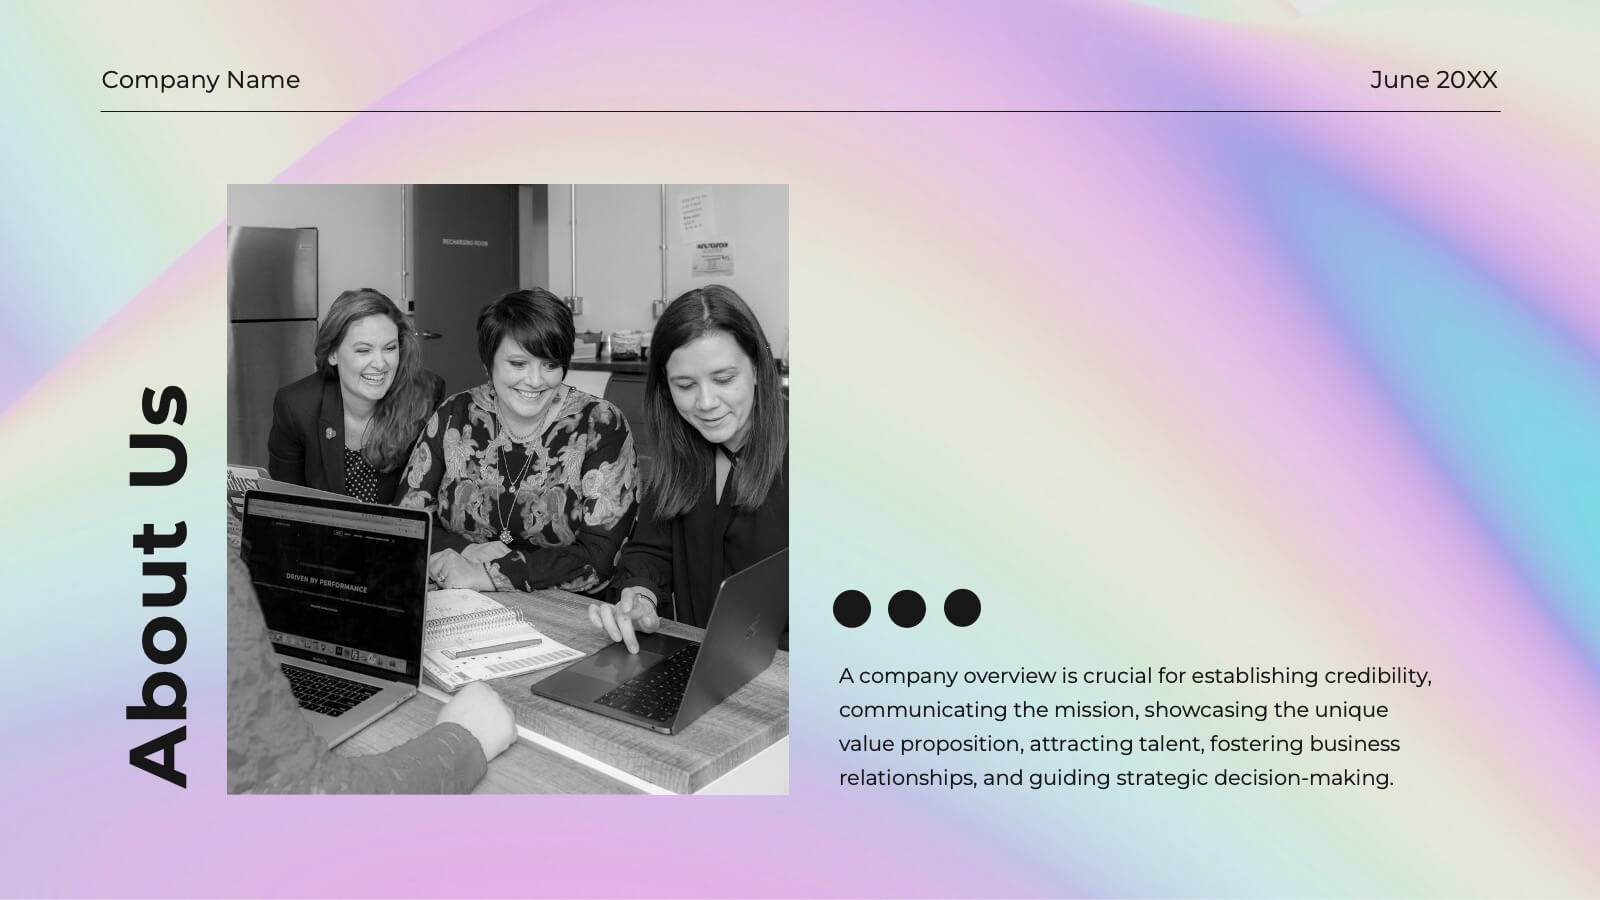
Frost Advertising Agency Proposal Presentation
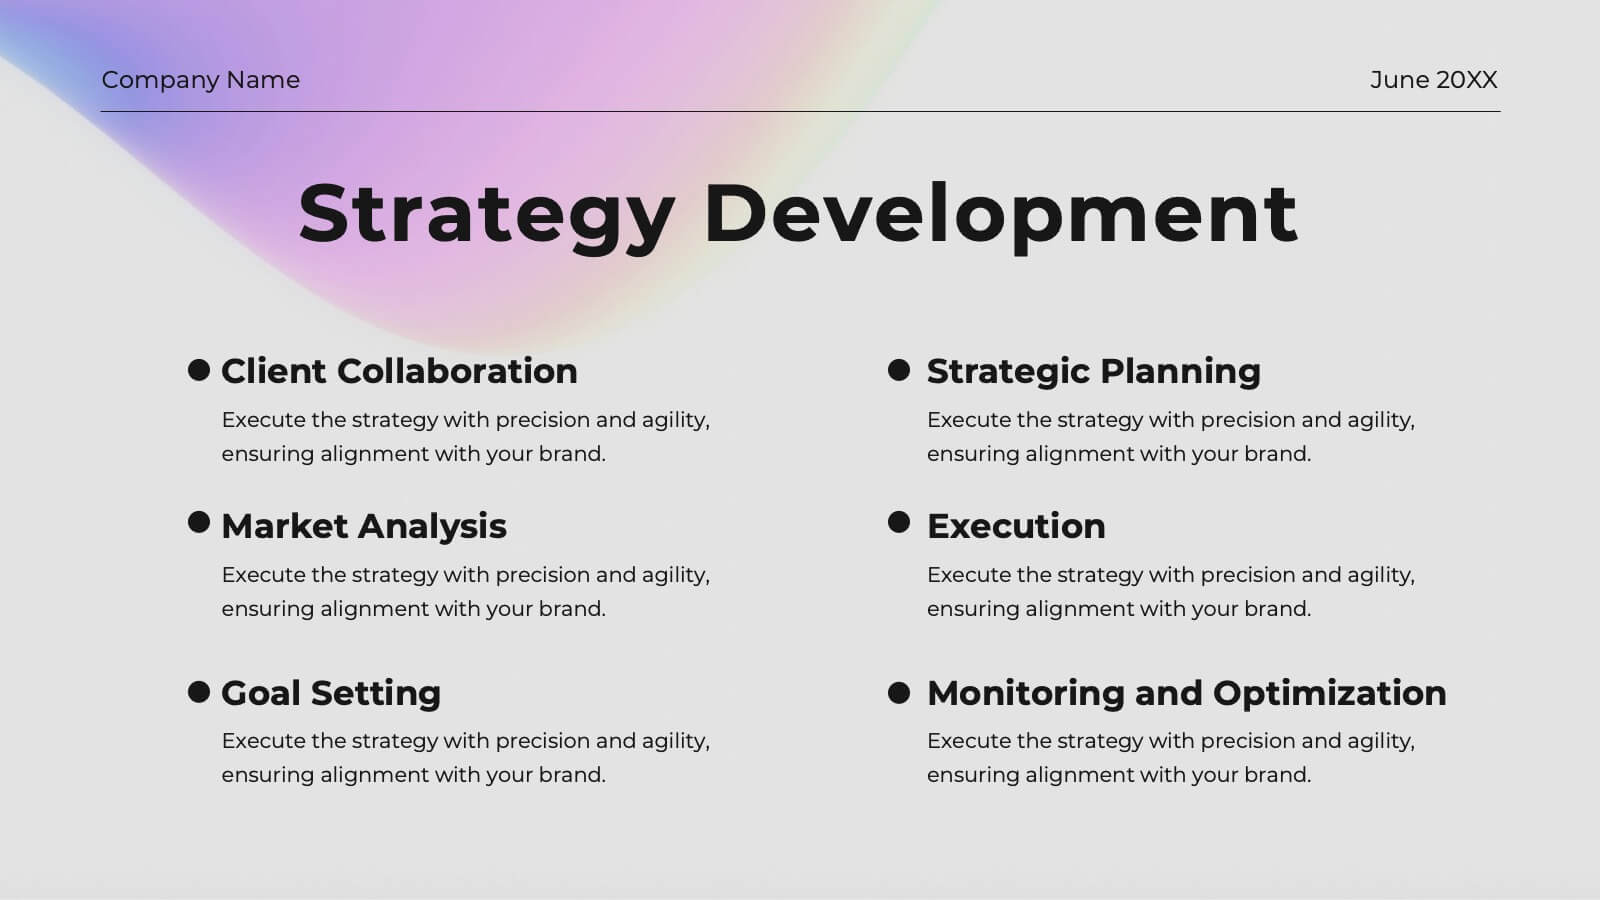
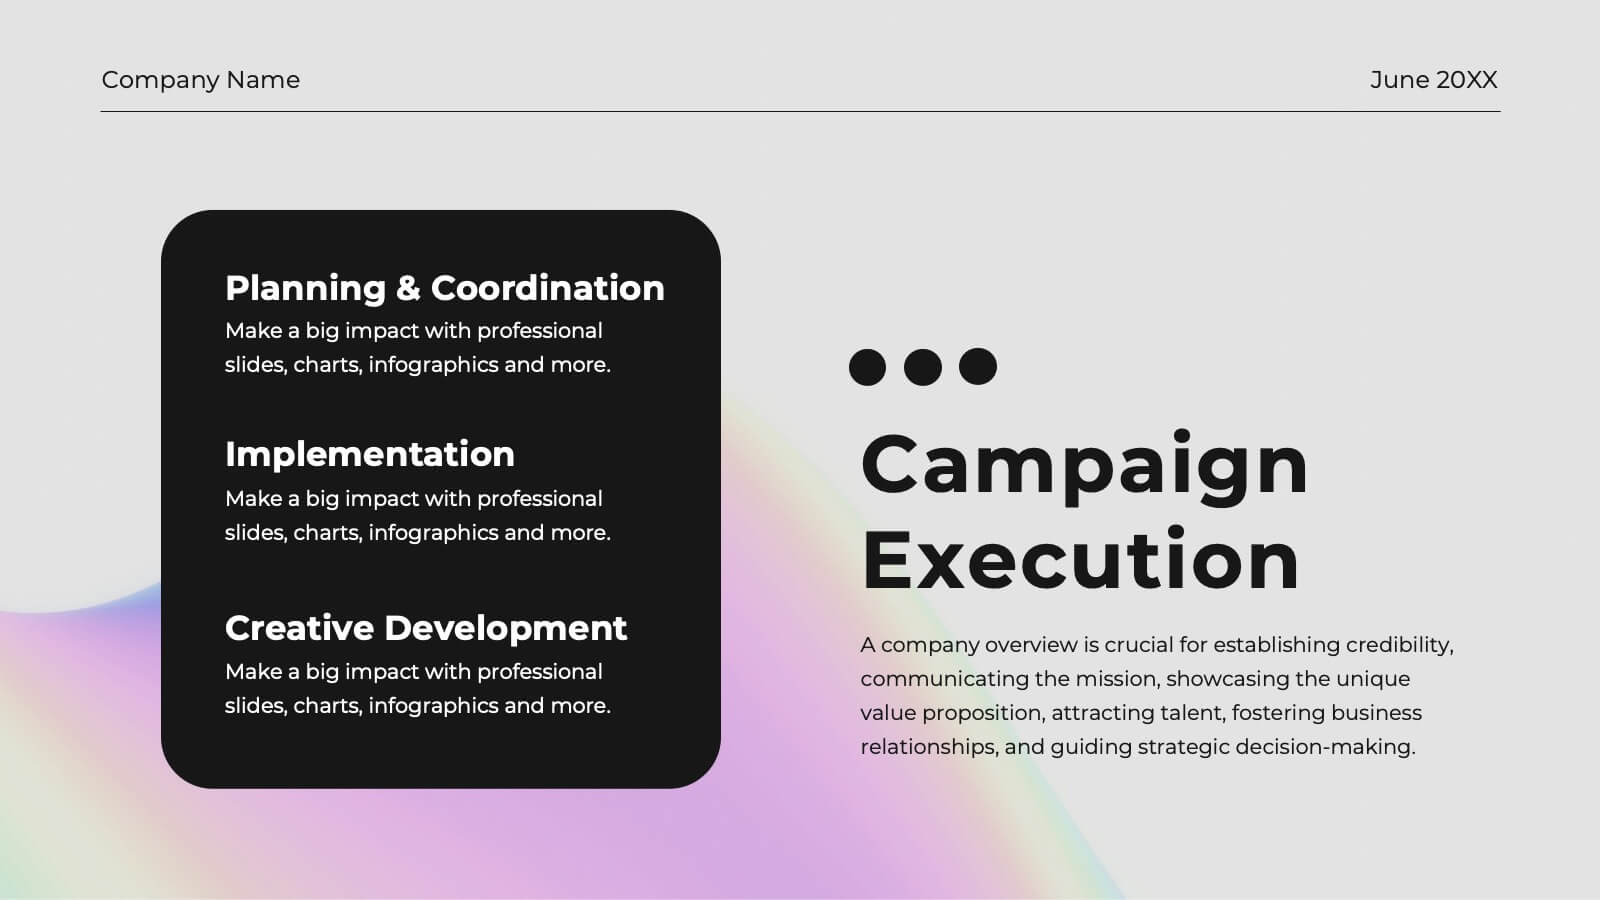
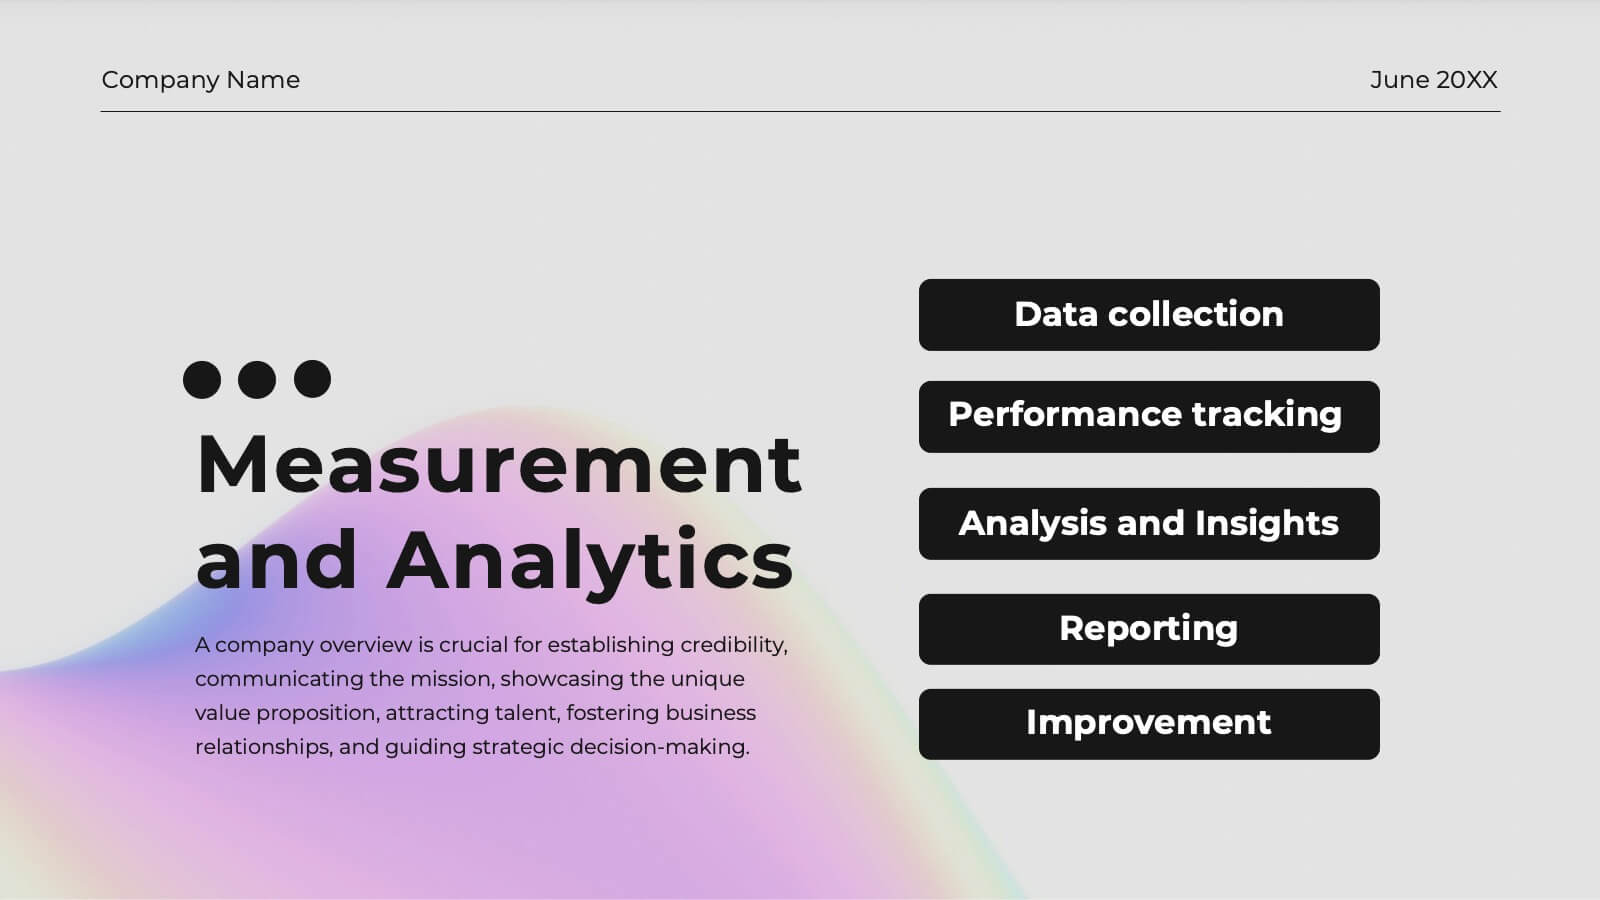
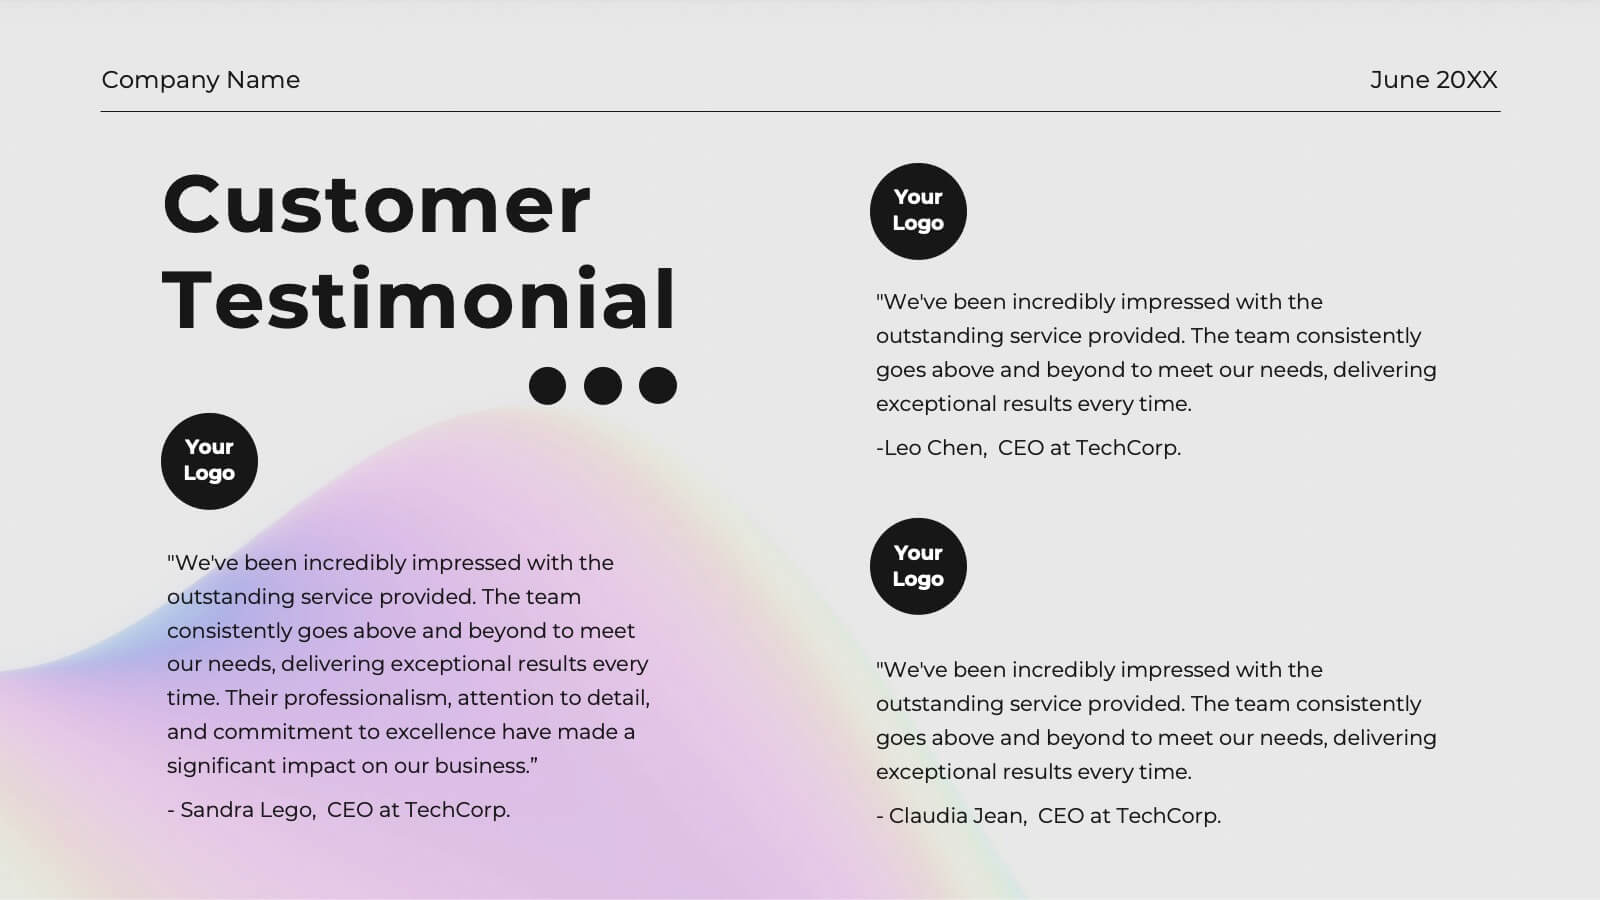
Dazzle your clients with this radiant agency proposal template! Perfect for presenting your mission, services, and market analysis, it includes slides for case studies, strategy development, and campaign execution. Impress stakeholders with vibrant visuals and detailed content. Compatible with PowerPoint, Keynote, and Google Slides for seamless presentations on any platform.


4 diapositivas
Audience Demographic Profile Overview
Present audience composition with clarity using the Audience Demographic Profile Overview Presentation. This slide is designed to showcase gender-based or group-specific data through visual figures, percentage markers, and supporting bar charts. Ideal for marketers, analysts, and researchers who need to communicate user distribution and behavior insights. Fully editable in PowerPoint, Keynote, and Google Slides.


21 diapositivas
Ember Echo Graphic Design Project Plan Presentation
The Ember Graphic Design Project Plan template is the perfect canvas for your creative journey! Kickstart your project with a sleek and professional introduction that sets the tone for your design vision. This template is designed to guide you through every step of the design process, from the initial brief to the final presentation. Highlight your target audience, concept development, and design elements with beautifully crafted slides that capture the essence of your project. Dive into the specifics with dedicated sections for brand identity components, textures, and the design process itself, ensuring that every detail is covered. The template also includes mood boards, prototypes, and design assets, making it easy to showcase your work in progress. With feedback and testing slides, you can iterate and refine your designs before presenting the final product. This template is fully compatible with PowerPoint, Keynote, and Google Slides, making it versatile and easy to use for any creative project.


6 diapositivas
Demographic Data Analysis Presentation
The "Demographic Data Analysis" presentation effectively visualizes demographic splits using a simple yet engaging pie chart. The template features a clean layout with distinct sections labeled for different demographic metrics, represented by the percentage splits of 35% and 65%. Each section includes placeholder text for inserting detailed insights, making it an excellent tool for presentations that need to communicate demographic data clearly and attractively. The design is versatile and can be adapted for various analysis needs in business or research contexts.


6 diapositivas
Customer Satisfaction Smile Chart Presentation
Bring your data to life with a slide that instantly shows how customers feel, blending clean visuals with an intuitive emotion scale. This presentation helps you communicate feedback trends, highlight satisfaction levels, and support decision-making with clarity. Ideal for reports, reviews, and strategy updates. Fully compatible with PowerPoint, Keynote, and Google Slides.


5 diapositivas
Closing Statement with Highlights Presentation
Wrap up your presentation with this clean, step-by-step summary slide. Featuring a rising arrow path and a trophy icon, it’s ideal for showcasing final insights or major achievements. Highlight up to five key points clearly and concisely. Fully customizable in PowerPoint, Keynote, and Google Slides for seamless presentation use.


5 diapositivas
Social Media Management Infographics
Social Media Management refers to the process of creating, scheduling, analyzing, and engaging with content posted on social media platforms on behalf of a business or individual. With these infographic templates, you can effectively communicate social media management strategies, educate your team or clients, and enhance your social media presence to achieve your marketing objectives. These are designed to showcase key concepts, strategies, and best practices for effective social media management. It is a valuable resource for social media managers, digital marketers, and business owners looking to enhance their social media presence and engagement.


5 diapositivas
SWOT Analysis Framework Presentation
The "SWOT Analysis Framework Presentation" template is strategically designed to help businesses and teams visually map out their Strengths, Weaknesses, Opportunities, and Threats. Each quadrant of the SWOT analysis is distinctly colored to facilitate quick recognition and understanding, enabling teams to efficiently analyze their internal and external environments. This template is versatile, suitable for a variety of industries and settings, from corporate strategic planning sessions to educational business courses. It aids in clearly identifying key factors that could influence future business decisions and strategies, making it an essential tool for any organization aiming to enhance its strategic planning process.


6 diapositivas
Project Timeline Infographic
A project timeline is a visual representation of the planned schedule and key milestones of a project. This infographic is designed to outline the sequence of activities, tasks, and events that need to be completed within a specific timeframe to achieve your project goals. This allows you to showcase the timeline of a project, from its inception to completion. It provides a clear and concise overview of the project's major milestones, tasks, and deadlines, enabling viewers to understand the project's progress at a glance. Compatible with Powerpoint, Keynote, and Google Slides.


7 diapositivas
Health Infographic Presentation Template
A health infographic is a visual representation of information and data related to health. This template can be used to convey complex information about a variety of health topics, such as disease symptoms, risk factors, and preventive measures, in a simple and easily understandable manner. This Health infographic displays graphics, images, and charts to help illustrate the information and make it more engaging and accessible to your audience. This template can be used for various purposes, such as educating the public, promoting healthy habits, and informing healthcare professionals.


7 diapositivas
Data Analysis Research Infographic
A Data Analysis Research infographic is a visual representation of the key findings of a research study that used data analysis techniques. The purpose of this template is to provide a clear summary of the research study's most important results, making it easier for your viewers to understand and interpret the findings. This infographic include visualizations such as charts, graphs, icons, and tables that present key data points in a visually compelling way. This template is designed to highlight differences between groups or subgroups, or show how various factors are related to one another.


7 diapositivas
Change Management Principles Infographic
Change is the only constant in the business realm, and mastering its management can be the linchpin to success. The change management principles infographic, in its harmonious palette of gray, blue, and red, provides a visually compelling overview of the key tenets governing successful change. Tailored for business leaders, project managers, HR professionals, and organizational consultants, this infographic streamlines complex ideas into easily digestible insights. Crafted to be fully compatible with PowerPoint, Keynote, and Google Slides, it serves as an invaluable tool to illuminate and drive conversations around change in any corporate presentation.


6 diapositivas
Circular Motion Business Wheel Diagram Presentation
Showcase continuous processes or interconnected strategies with the Circular Motion Business Wheel Diagram Presentation. This visually engaging template features a six-part circular layout, ideal for illustrating business cycles, project workflows, or recurring tasks. Each segment includes customizable titles, icons, and content areas to support clarity and impact. Fully compatible with PowerPoint, Keynote, and Google Slides.


7 diapositivas
Business Strategy Options Presentation
Bring clarity to your strategic choices with a clean, modern layout that helps you present multiple business directions side by side. Ideal for showcasing growth plans, decision paths, or market approaches, this presentation makes strategy easy to follow. Fully compatible with PowerPoint, Keynote, and Google Slides for effortless editing.


6 diapositivas
Internal Communication Strategy Presentation
Bring your message to life with a dynamic slide that turns communication goals into a simple, engaging visual story. This presentation highlights key steps, channels, and team roles to help audiences understand how information flows across an organization. Clean icons and structured layouts make every point clear and memorable. Fully compatible with PowerPoint, Keynote, and Google Slides.