


Características


¿Tienes alguna pregunta?
Recomendar


5 diapositivas
Political Campaign Strategies Infographics
A political campaign refers to the organized efforts of individuals or groups to promote a particular candidate, political party, or specific political agenda during an election or to raise awareness and support for a specific issue. These infographic templates are designed to showcase various strategies and techniques used in political campaigns. This is perfect for politicians, campaign managers, or anyone involved in the political arena who wants to present their campaign strategies. Its customizable layout and eye-catching design enable politicians to communicate their campaign, engage with their audience, and rally support for their goals.


8 diapositivas
Environmental and Social Sustainability
Showcase your sustainability efforts with this layered pyramid slide, perfect for visualizing tiered environmental or social responsibility strategies. Ideal for ESG reporting, sustainability workshops, or stakeholder presentations. Fully customizable in PowerPoint, Keynote, and Google Slides to match your brand and message.


6 diapositivas
Problem-Solving with Design Thinking
Communicate your innovation process with clarity using the Problem-Solving with Design Thinking Presentation. This slide visualizes the six key phases of the design thinking methodology (e.g., Empathize, Define, Ideate, Prototype, Test, Implement) arranged in a dynamic hexagonal loop. Each section is color-coded and icon-labeled for easy navigation, with editable titles and space for explanatory text. Ideal for creative workshops, team brainstorming, innovation strategy, and agile process presentations. Fully editable in PowerPoint, Keynote, and Google Slides.


5 diapositivas
Healthcare Solutions in Modern Medicine Presentation
Present pharmaceutical and medical data with clarity using these modern healthcare infographics. Designed with pill packs, bandages, and capsules, this editable template is ideal for illustrating treatment comparisons, solution options, or patient care data. Perfect for medical professionals, health startups, and researchers using PowerPoint, Keynote, or Google Slides.


6 diapositivas
Customer Journey Mapping with Buyer Persona Presentation
Clearly visualize the customer experience across all touchpoints with this structured journey mapping slide. Featuring a central buyer persona graphic and six customizable steps with icons, this layout helps you break down each stage of the customer path. Perfect for UX strategy, customer service insights, and product development. Fully editable and compatible with PowerPoint, Keynote, and Google Slides.


5 diapositivas
Diverse List Infographics
Diverse list refers to a compilation or collection of items that include a wide range of diverse elements. These infographic templates showcases a diverse range of categories and topics in a concise format. The infographic is designed to present information in a visually stimulating way, allowing viewers to easily navigate and understand the diverse list being presented. The infographics organizes the lists into categories or sections, so the viewers can identify and locate specific items of interest. The categories are represented by visually distinct sections and color-coded tabs or icons that provide a cue for each category.


3 diapositivas
Professional Introduction Slide
Introduce team members with clarity and style using this profile-focused slide. Designed to highlight key stats, roles, and responsibilities, it’s perfect for internal presentations, onboarding, or proposals. Easily customizable in PowerPoint, Keynote, and Google Slides.


8 diapositivas
Environmental Impact Reporting Presentation
Showcase sustainability data with clarity using the Environmental Impact Reporting Presentation. Perfect for tracking plastic usage, waste trends, and eco-initiatives. The infographic-style visuals highlight four distinct data points with bold icons and labeled callouts. Fully editable in PowerPoint, Keynote, and Google Slides—ideal for ESG reports, audits, or environmental awareness campaigns.


6 diapositivas
5-Step SEO Marketing Funnel Presentation
Ignite your marketing story with a bold, flowing visual that makes every step feel purposeful and easy to follow. This presentation breaks down each stage of the SEO funnel, helping you explain strategy, performance, and conversion paths with clarity. Fully compatible with PowerPoint, Keynote, and Google Slides.


5 diapositivas
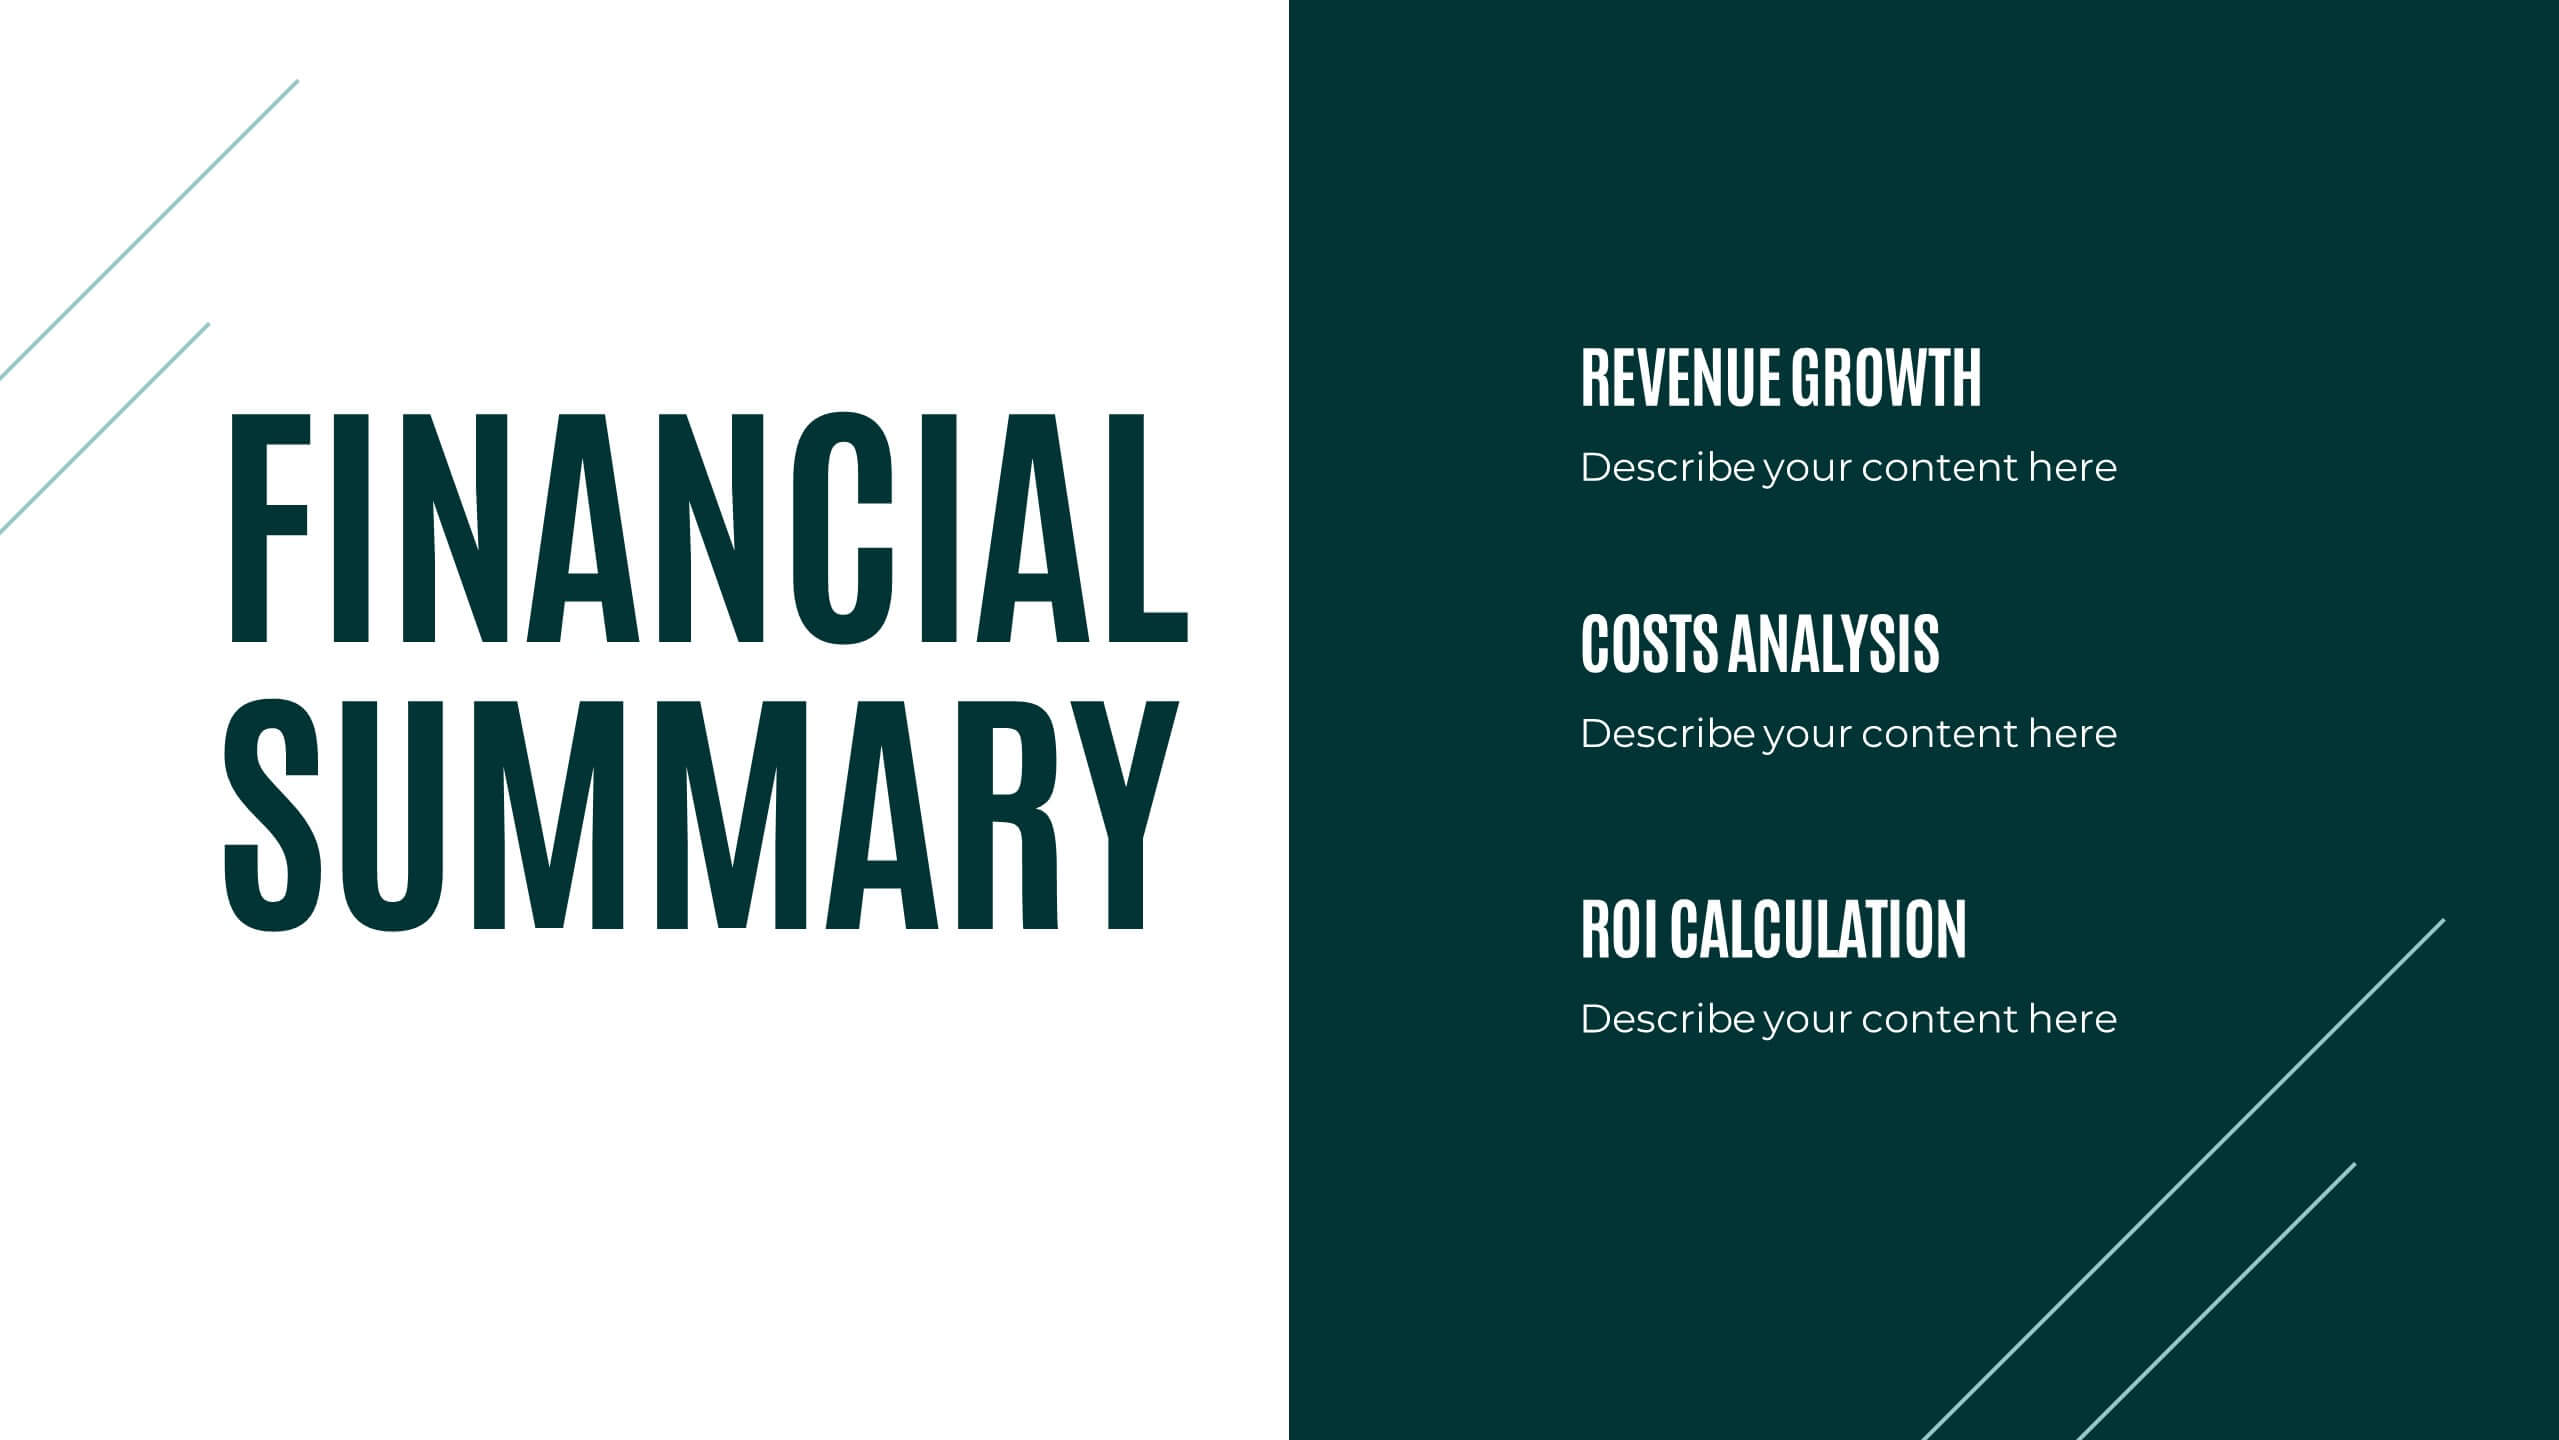
Monthly Financial Report Infographics
Dive into financial analytics with our monthly financial report infographics template. This indispensable tool, designed for finance professionals, managers, and business owners, comes in a stimulating mix of orange, pink, and green, reflecting the dynamic nature of finance. The template stands out with creative graphics, detailed icons, and designated areas for images that encapsulate various financial parameters. Ideal for depicting key statistics, trends, and financial insights in a clear, engaging manner, this vertical-style infographic template is perfect for simplifying complex data, ensuring your monthly reports are both comprehensive and captivating.


4 diapositivas
Virtual Team Meeting Guidelines Presentation
Streamline your remote collaborations with the "Virtual Team Meeting Guidelines" presentation template. Designed to enhance online interactions, this template offers a clear, structured layout for presenting effective communication strategies and meeting protocols. Its user-friendly design is ideal for guiding teams on maximizing productivity during virtual meetings. Compatible with PowerPoint, Keynote, and Google Slides, it's an essential tool for any team operating remotely.


4 diapositivas
Big Data Analytics Business
Simplify data complexity with this layered stack diagram designed for big data workflows and insights. Ideal for IT professionals, analytics teams, and consultants, it visually represents data input, processing, and output stages. Fully editable in PowerPoint, Keynote, and Google Slides for flexible customization.


4 diapositivas
Digital Funnel and Lead Generation Presentation
Visualize your customer journey clearly with the Digital Funnel and Lead Generation Presentation. This template uses stacked 3D-style funnel layers to illustrate each step—from awareness to conversion—making it perfect for marketing strategy, sales pipelines, or automation flows. Clean layout, customizable text, and icons included. Compatible with PowerPoint, Keynote, and Google Slides.


7 diapositivas
Drawing Anatomy Infographic
Dive into the captivating world of human anatomy with our drawing anatomy infographic. Crafted with vibrant hues of green, orange, red, and blue, this template brings to life the intricacies and artistry of the human form. Whether you're an aspiring artist, a seasoned illustrator, or an educator, this infographic is tailored to enhance your understanding or teaching of anatomical details. The fun, colorful design ensures engagement, making learning a visually pleasing experience. Seamlessly incorporate it into PowerPoint, Keynote, or Google Slides for versatile and effective presentations.


22 diapositivas
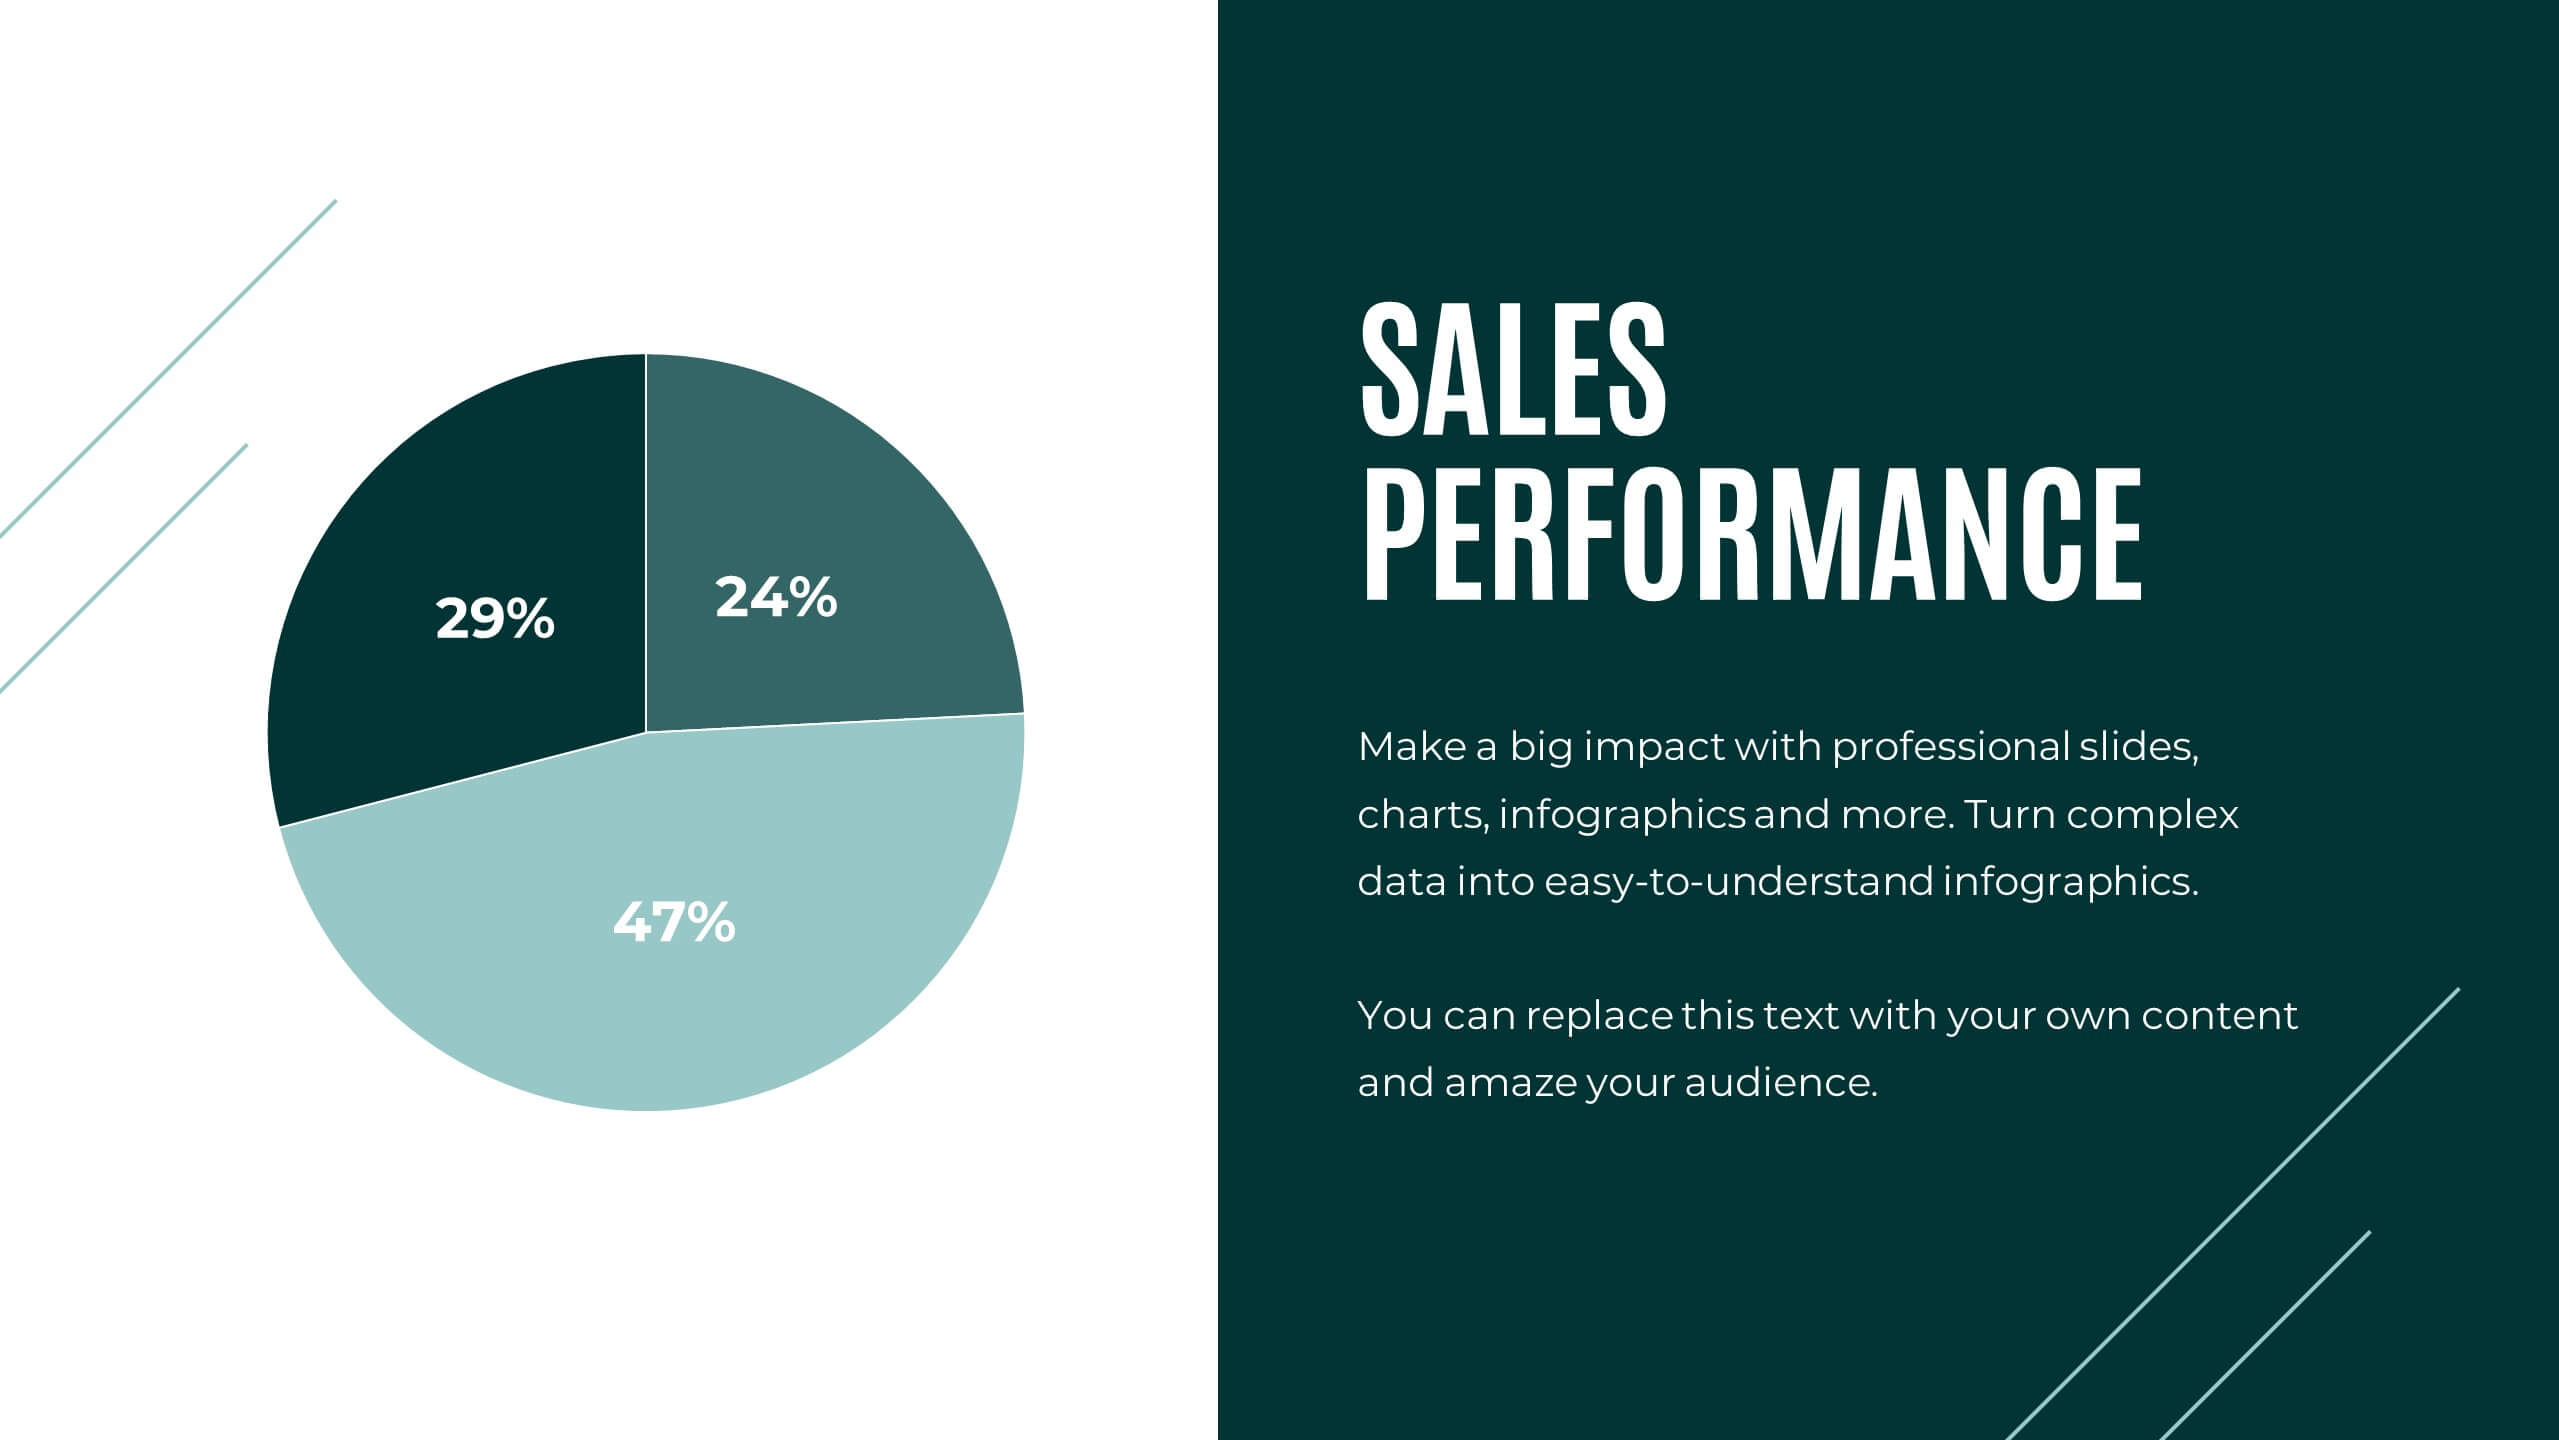
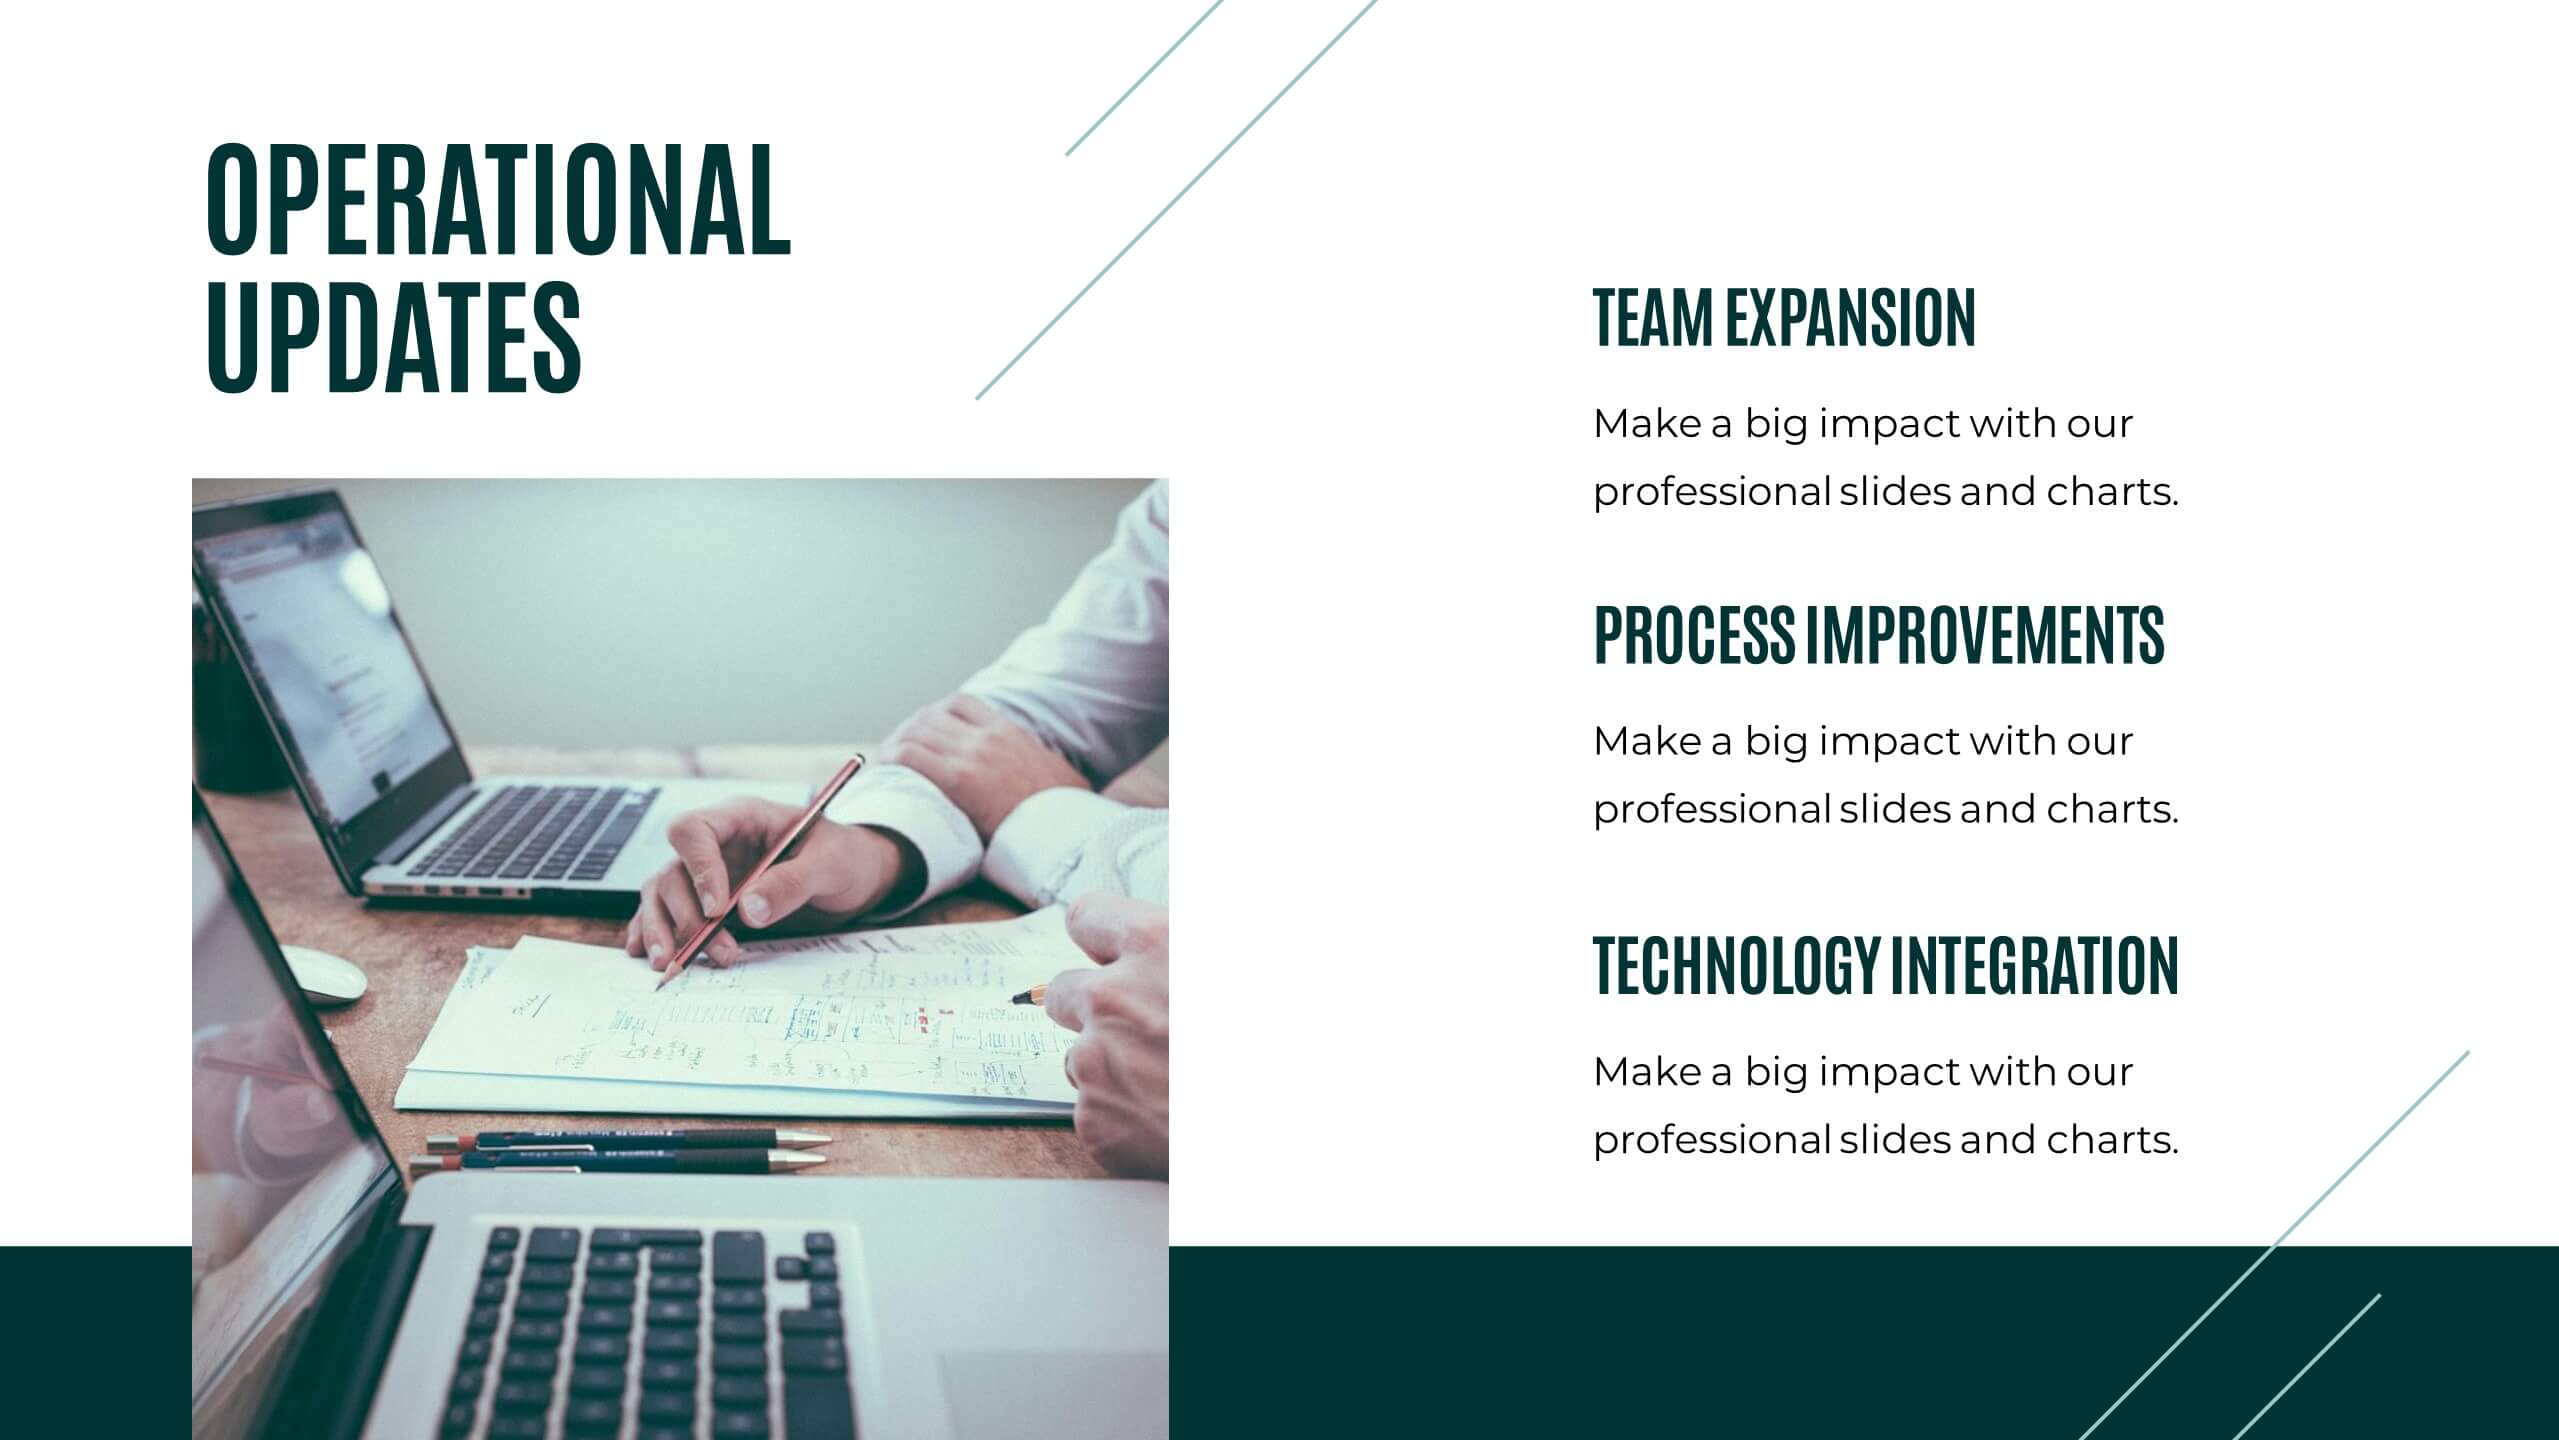
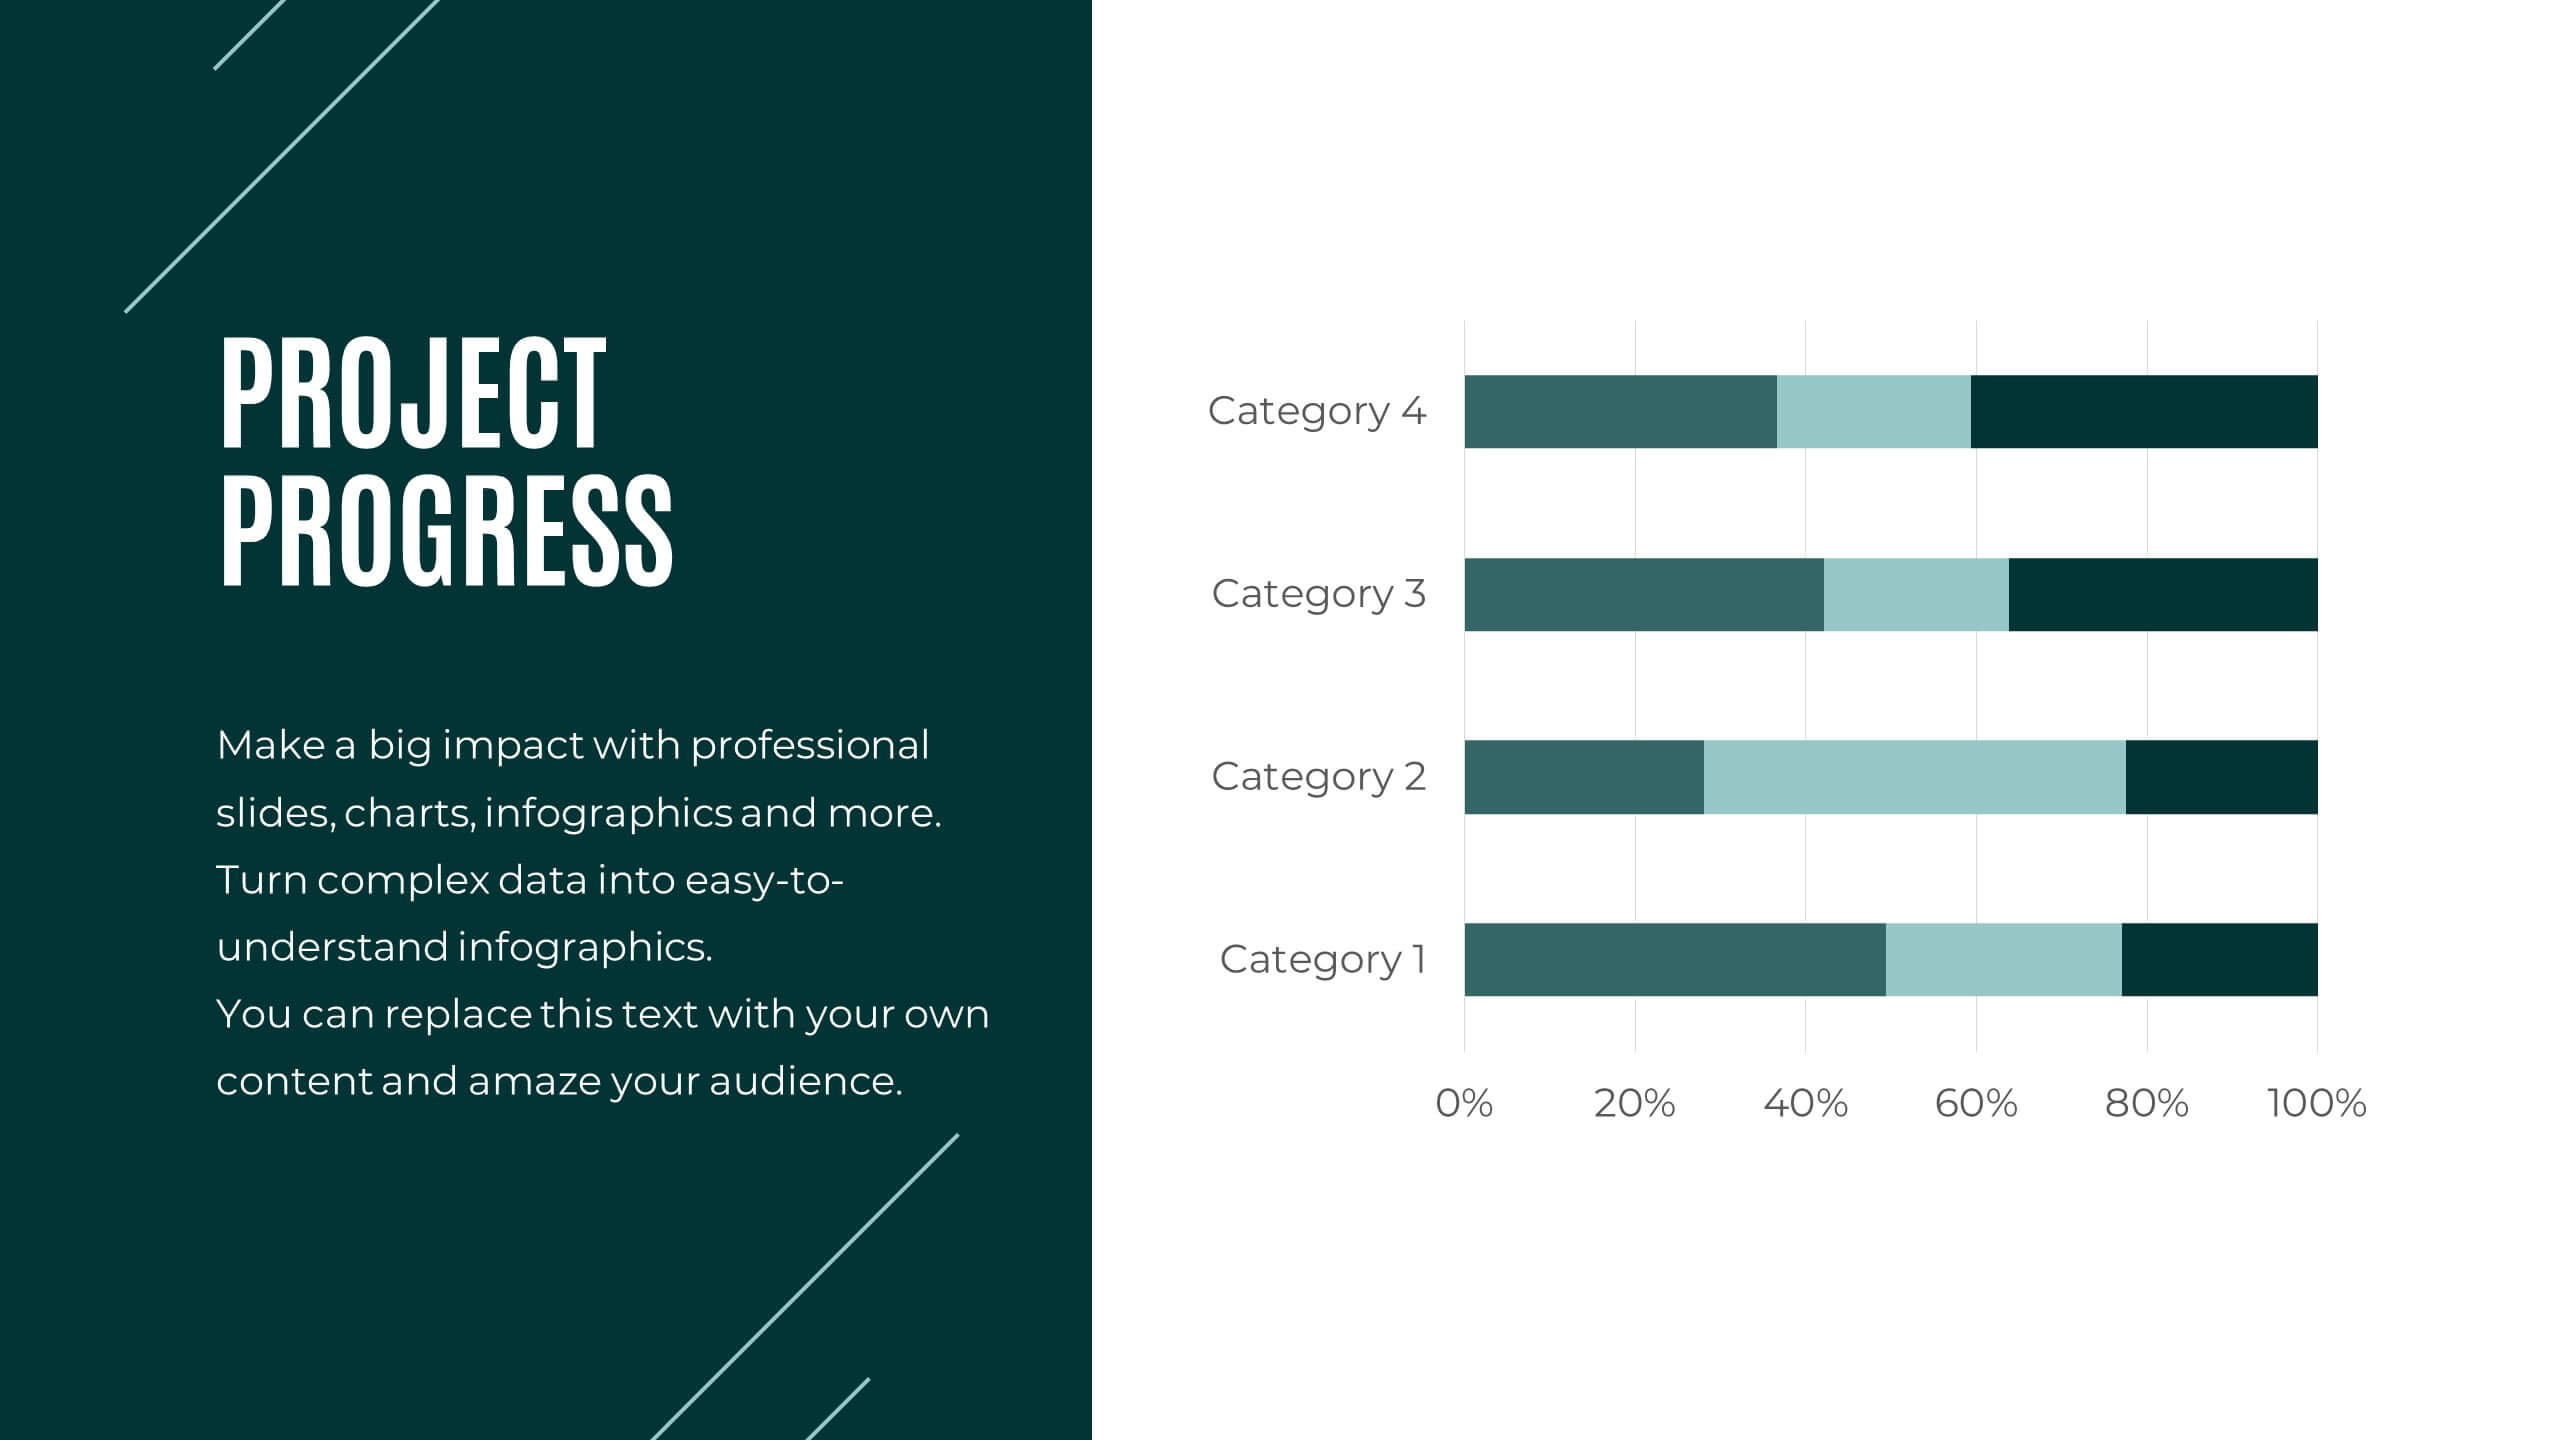
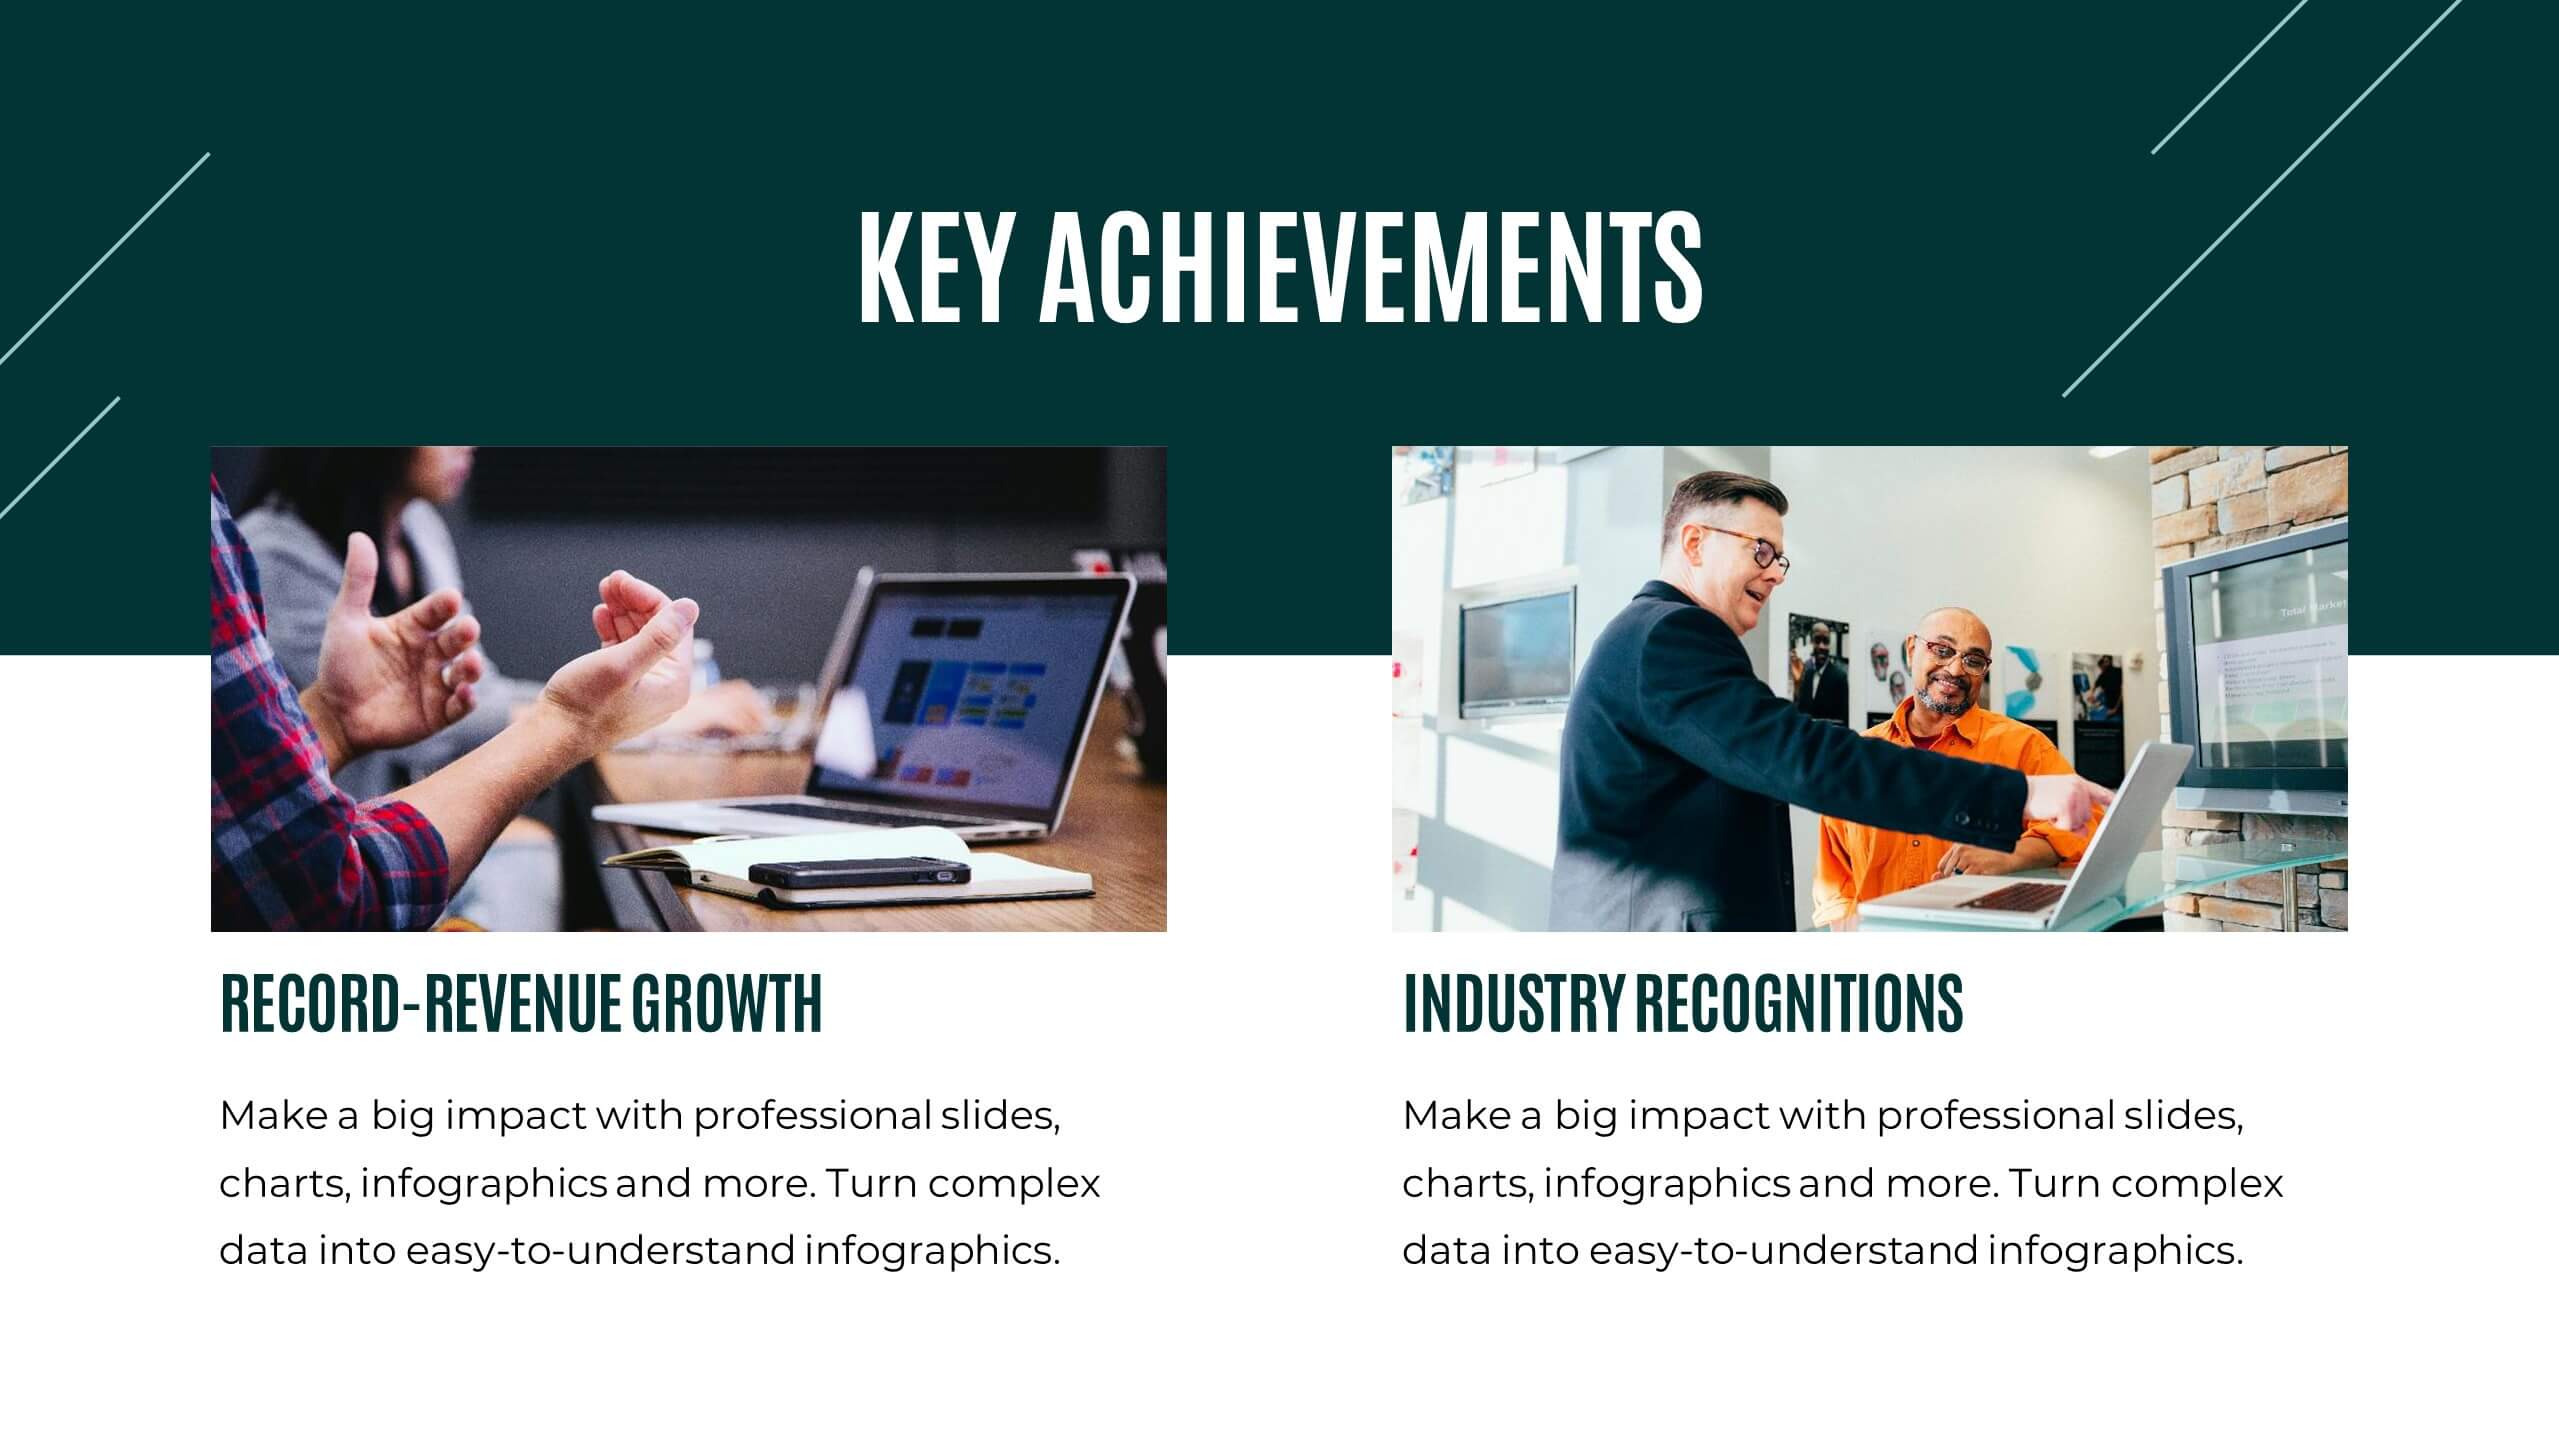
Prism Project Status Report Presentation
Deliver impactful updates with this comprehensive project status report template! Perfect for presenting key highlights, performance metrics, and strategic initiatives. Ideal for project managers aiming to keep stakeholders informed and aligned. Compatible with PowerPoint, Keynote, and Google Slides, this template ensures your reports are clear, professional, and engaging. Keep projects on track!


5 diapositivas
Pandemic Preventive Measures Infographics
Pandemic Preventive Measures refer to a set of actions taken to prevent the spread of infectious diseases. These vertical infographics are focused on informing the audience about the preventive measures that can be taken during a pandemic. They contains various customizable elements such as icons, charts, and diagrams that can be easily edited to suit your needs. The design is clean and easy to follow, making it an effective tool for communicating important information. Educate your audience on the essential pandemic preventive measures, and provide them with the necessary information to stay safe and healthy!


23 diapositivas
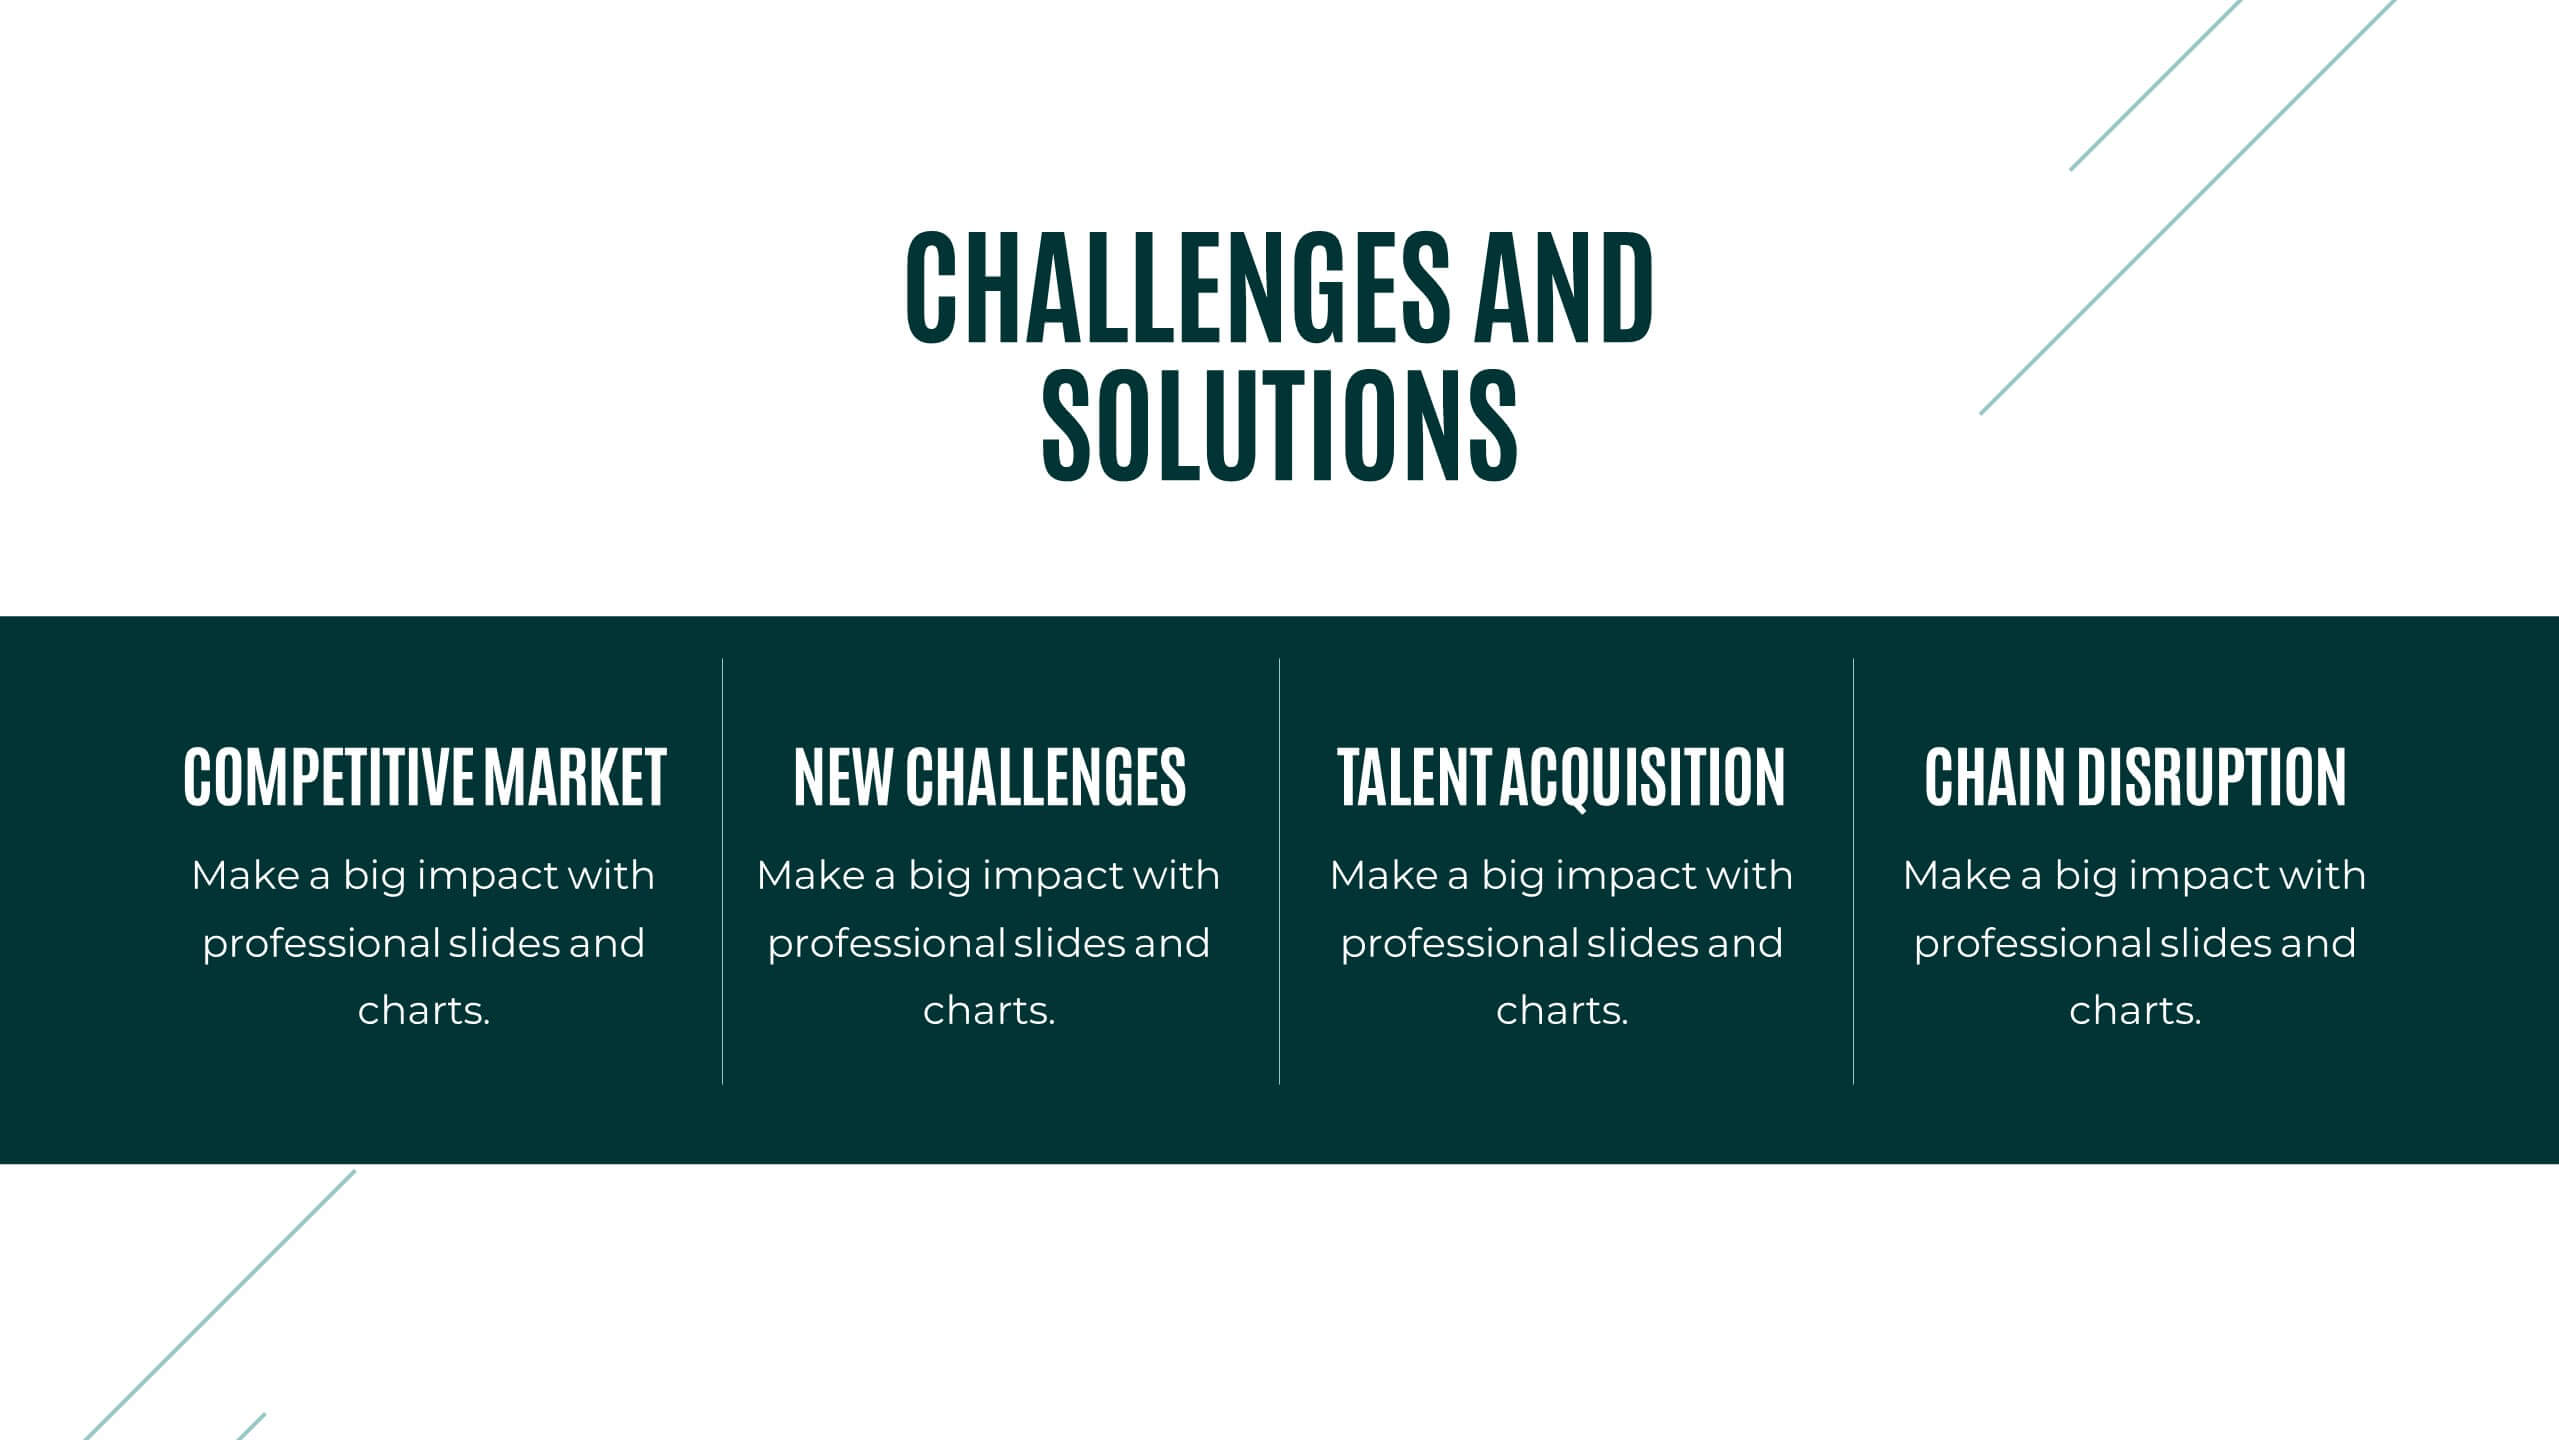
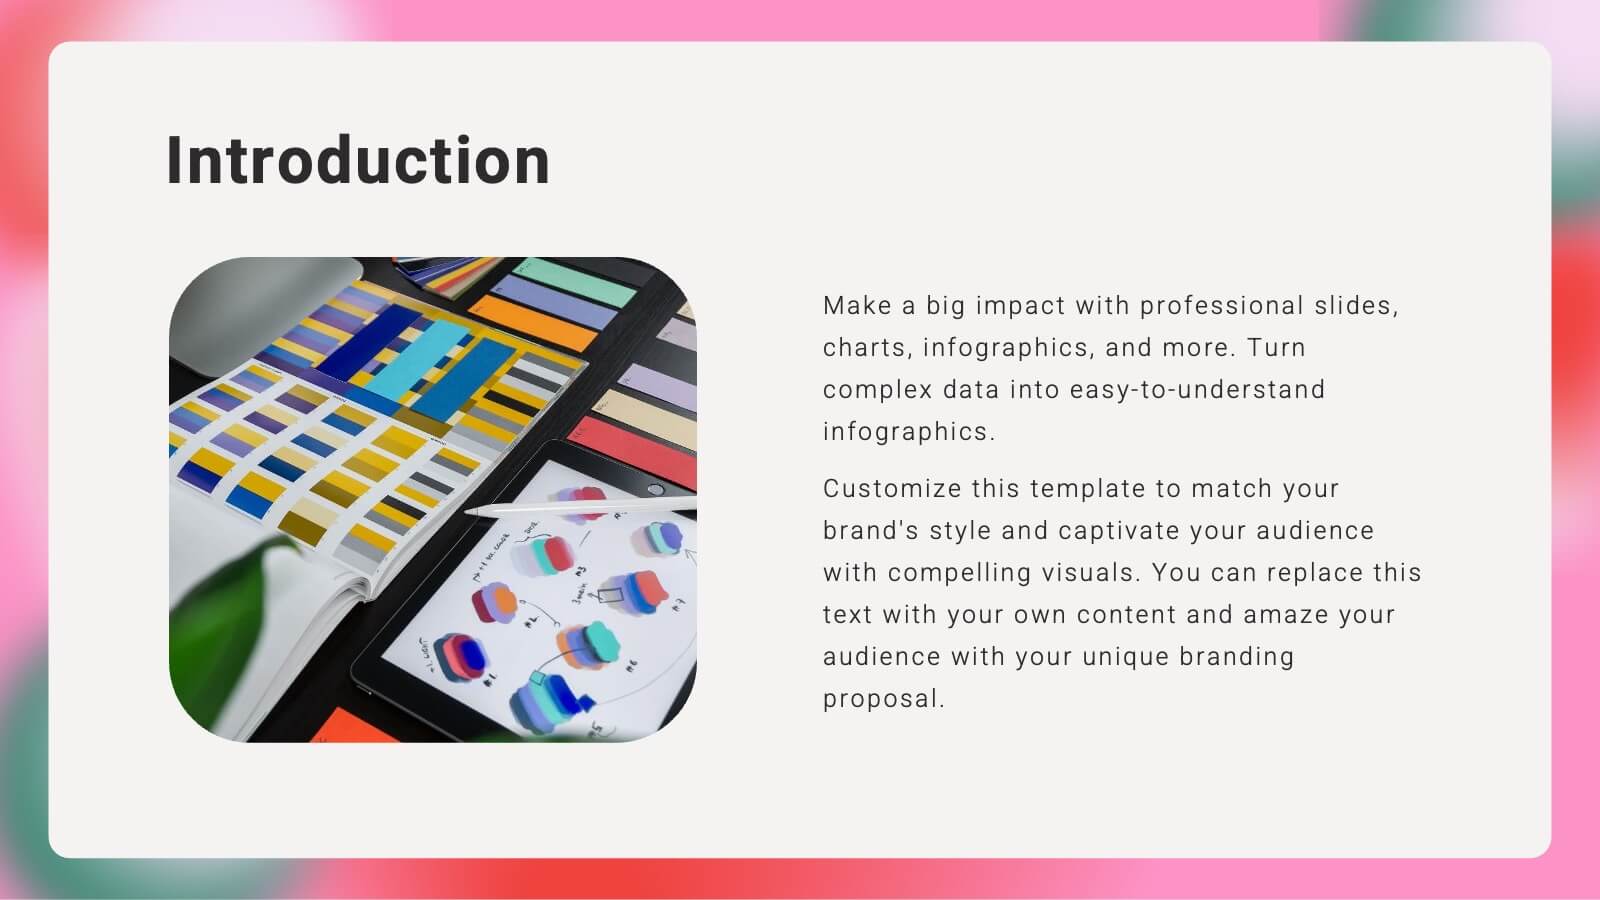
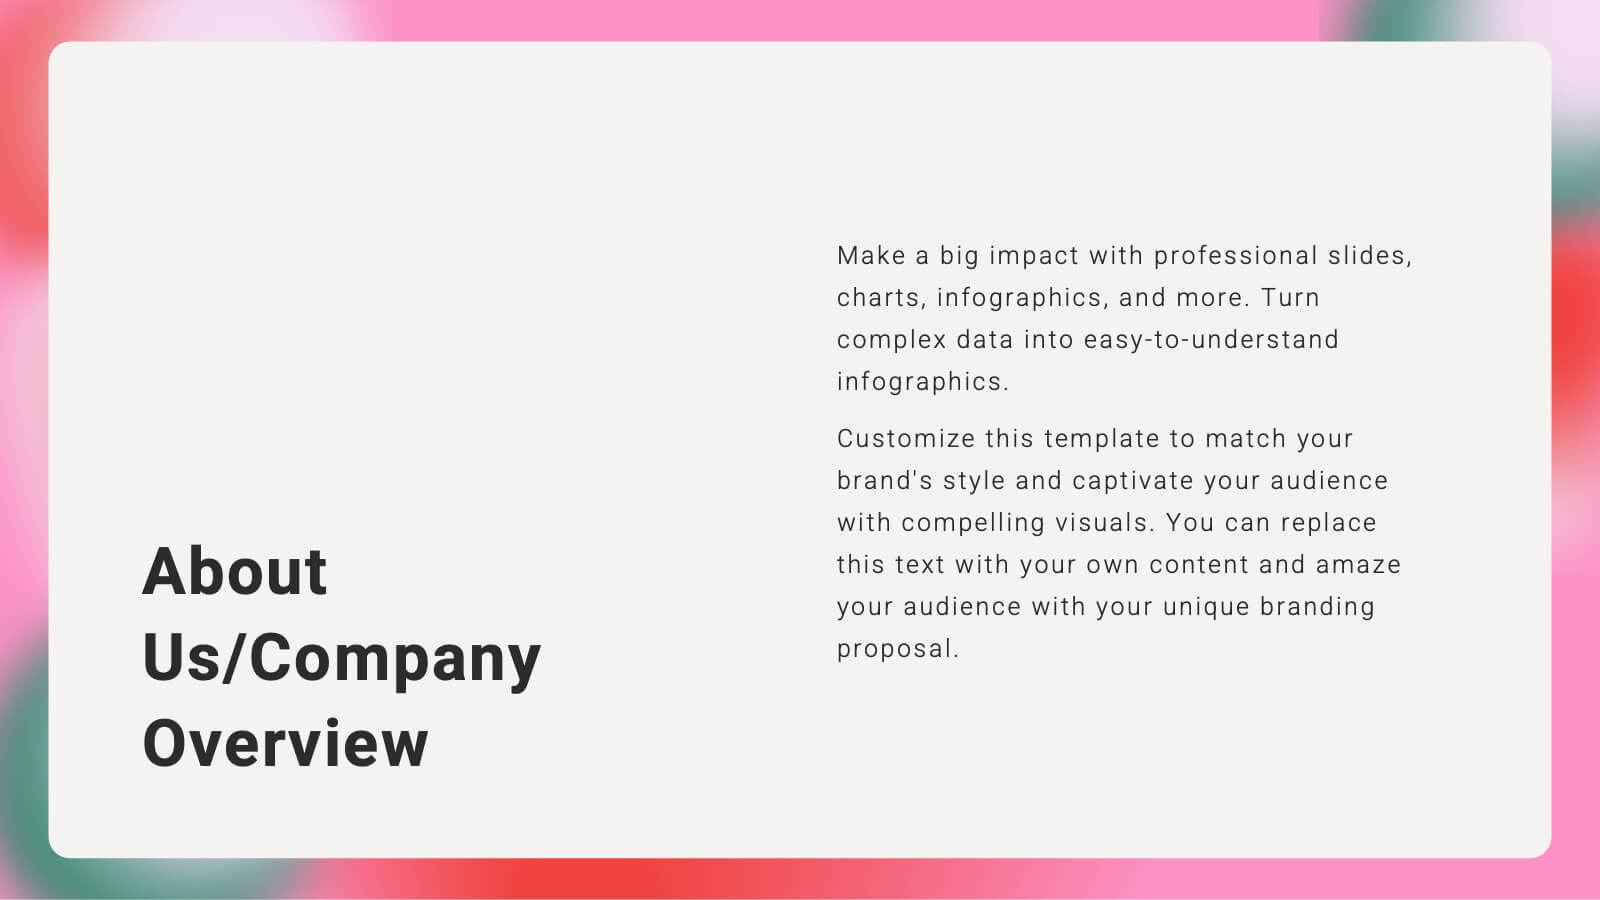
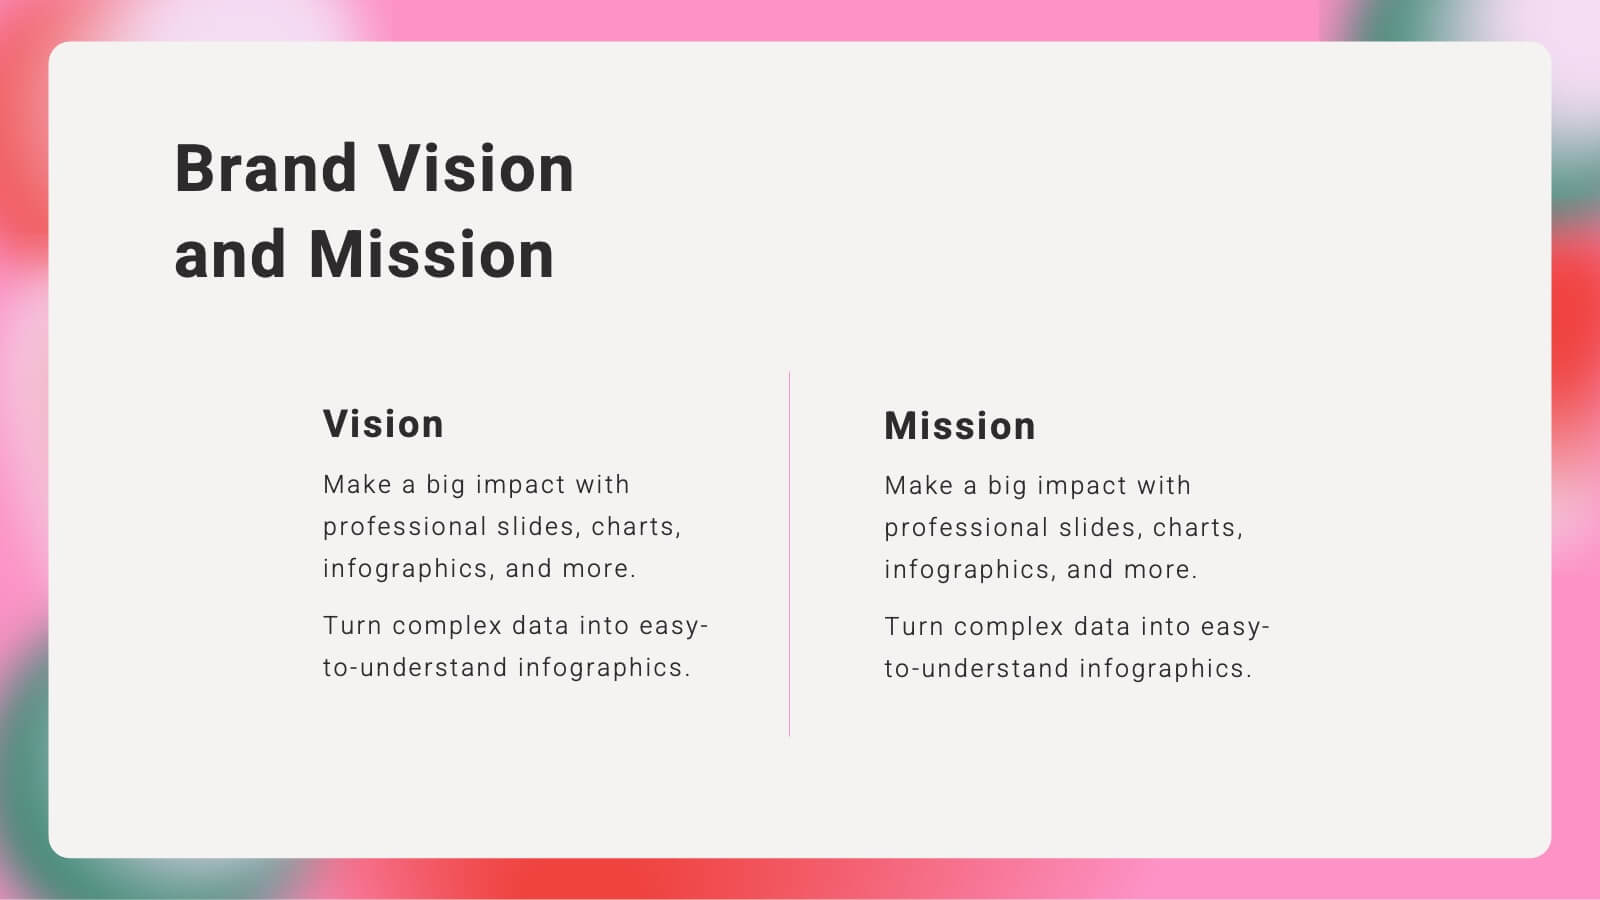
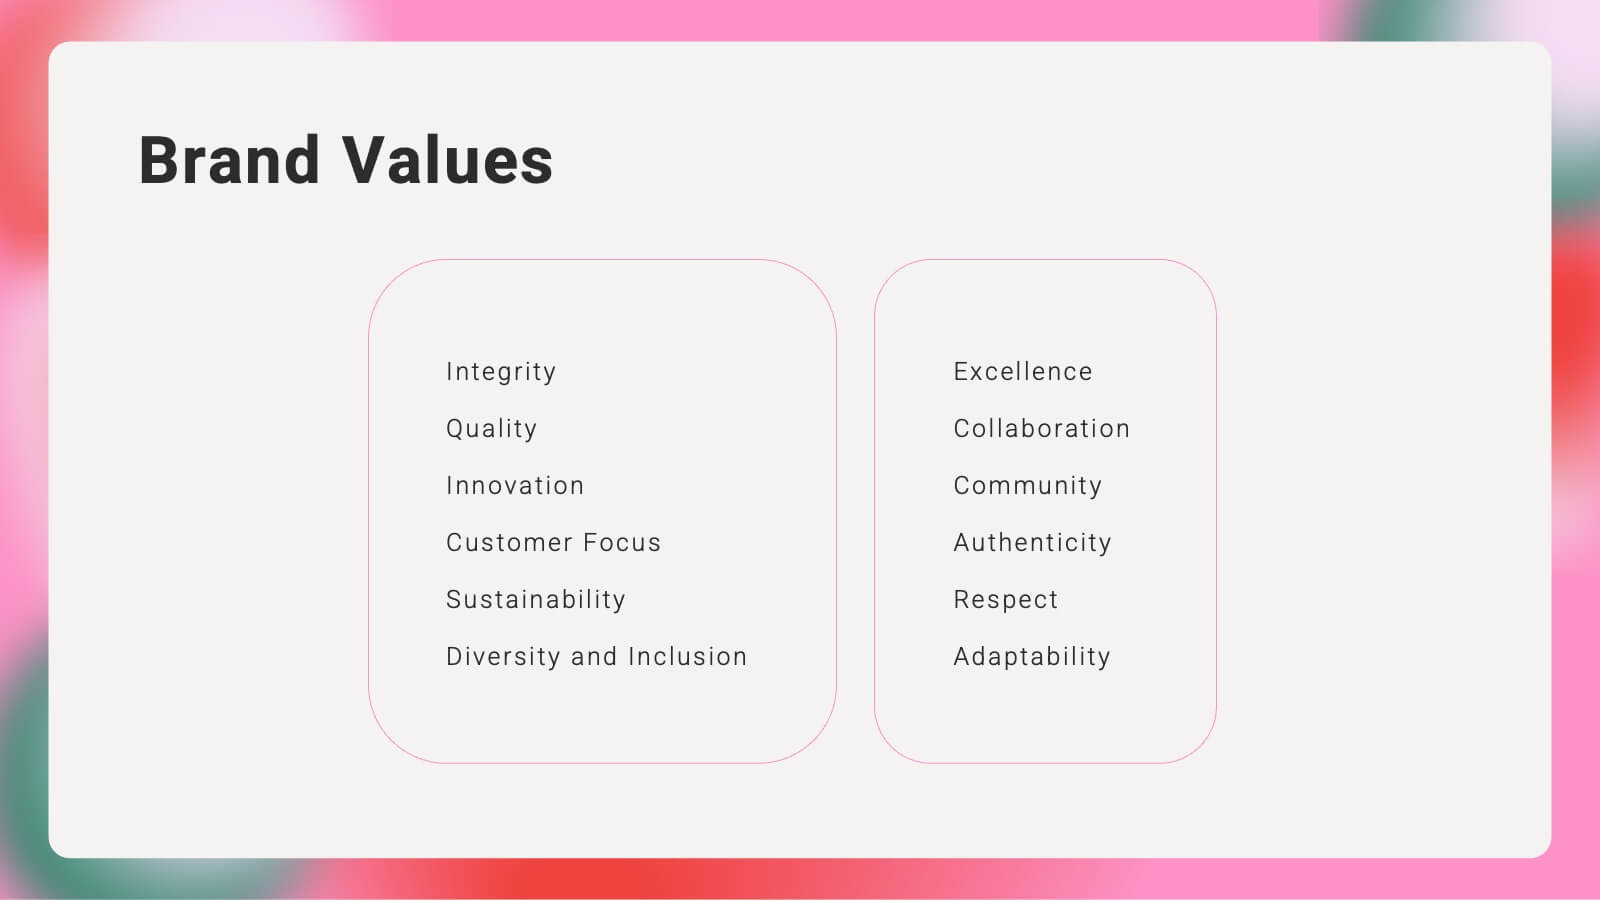
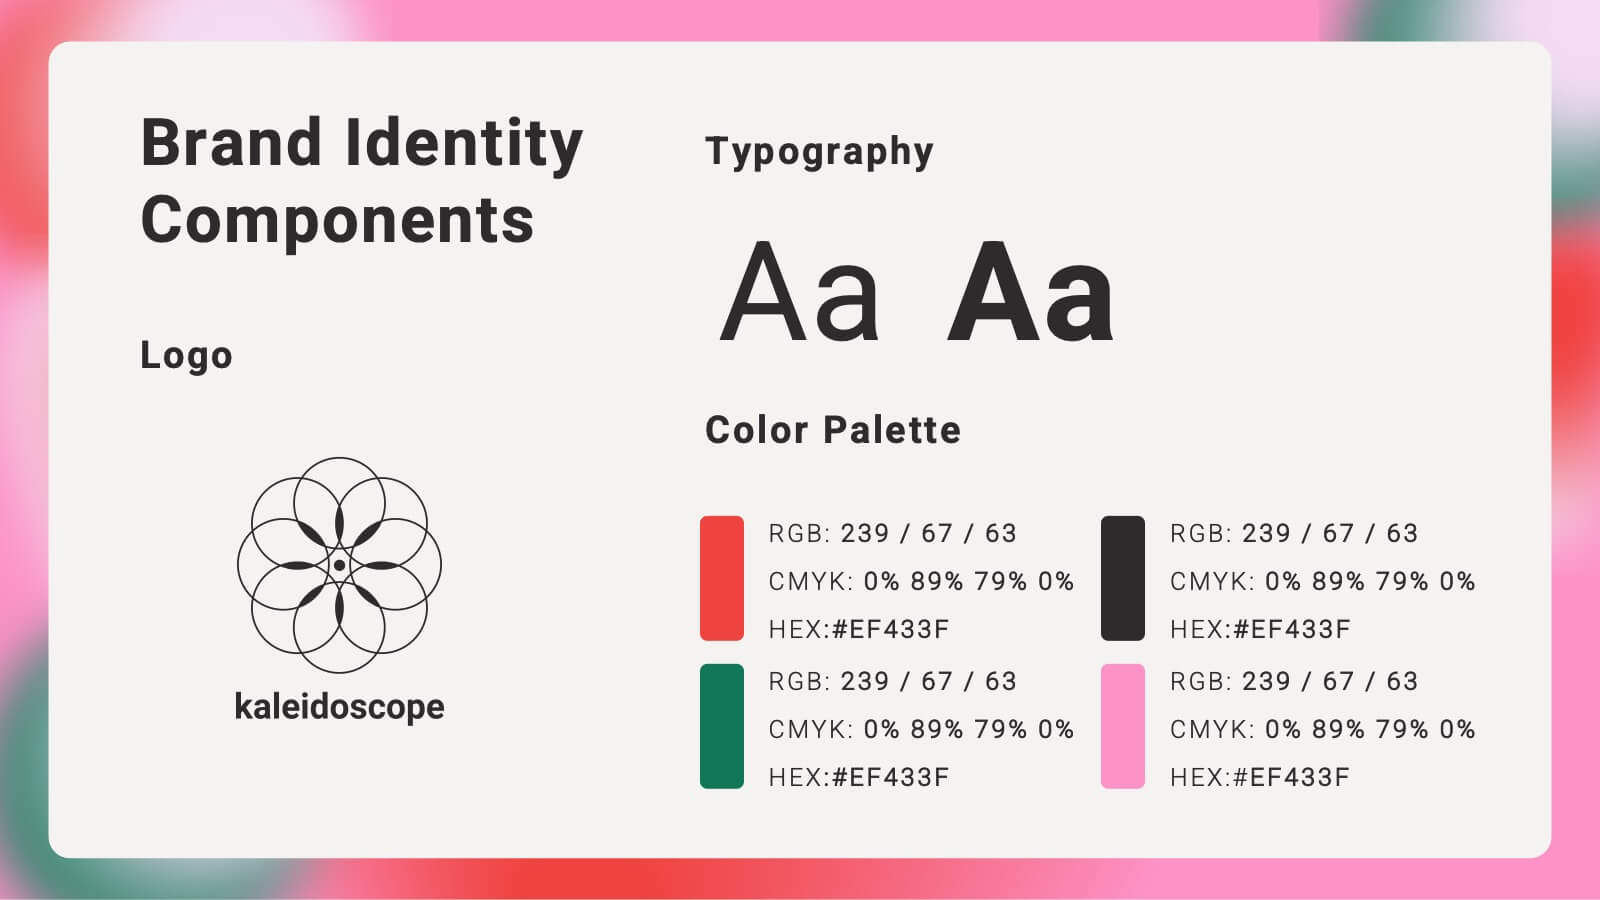
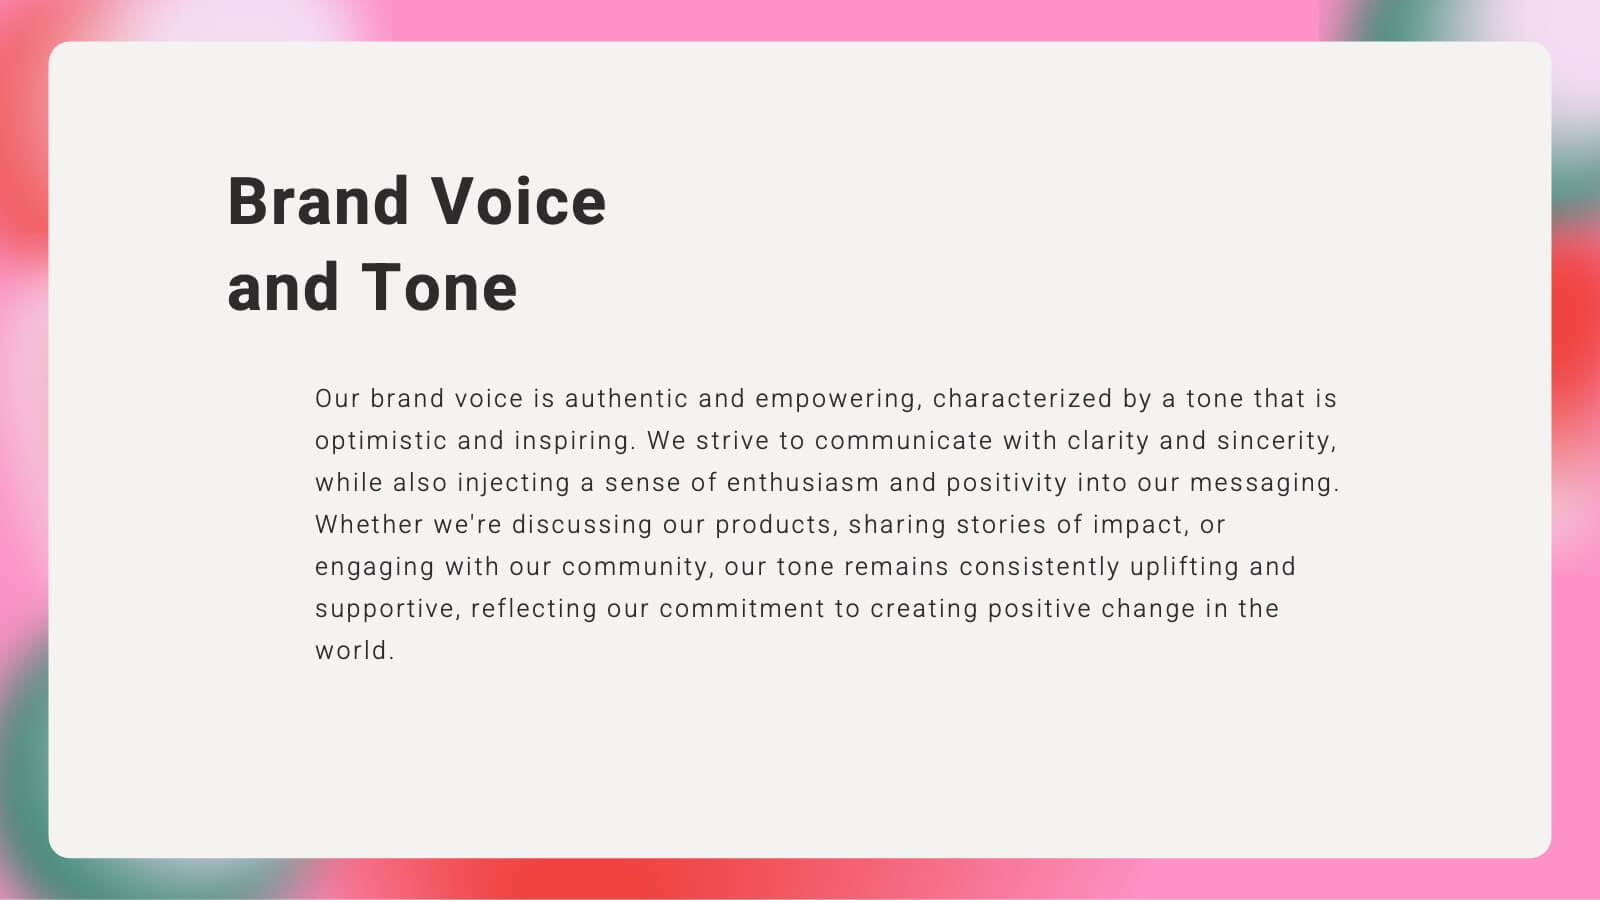
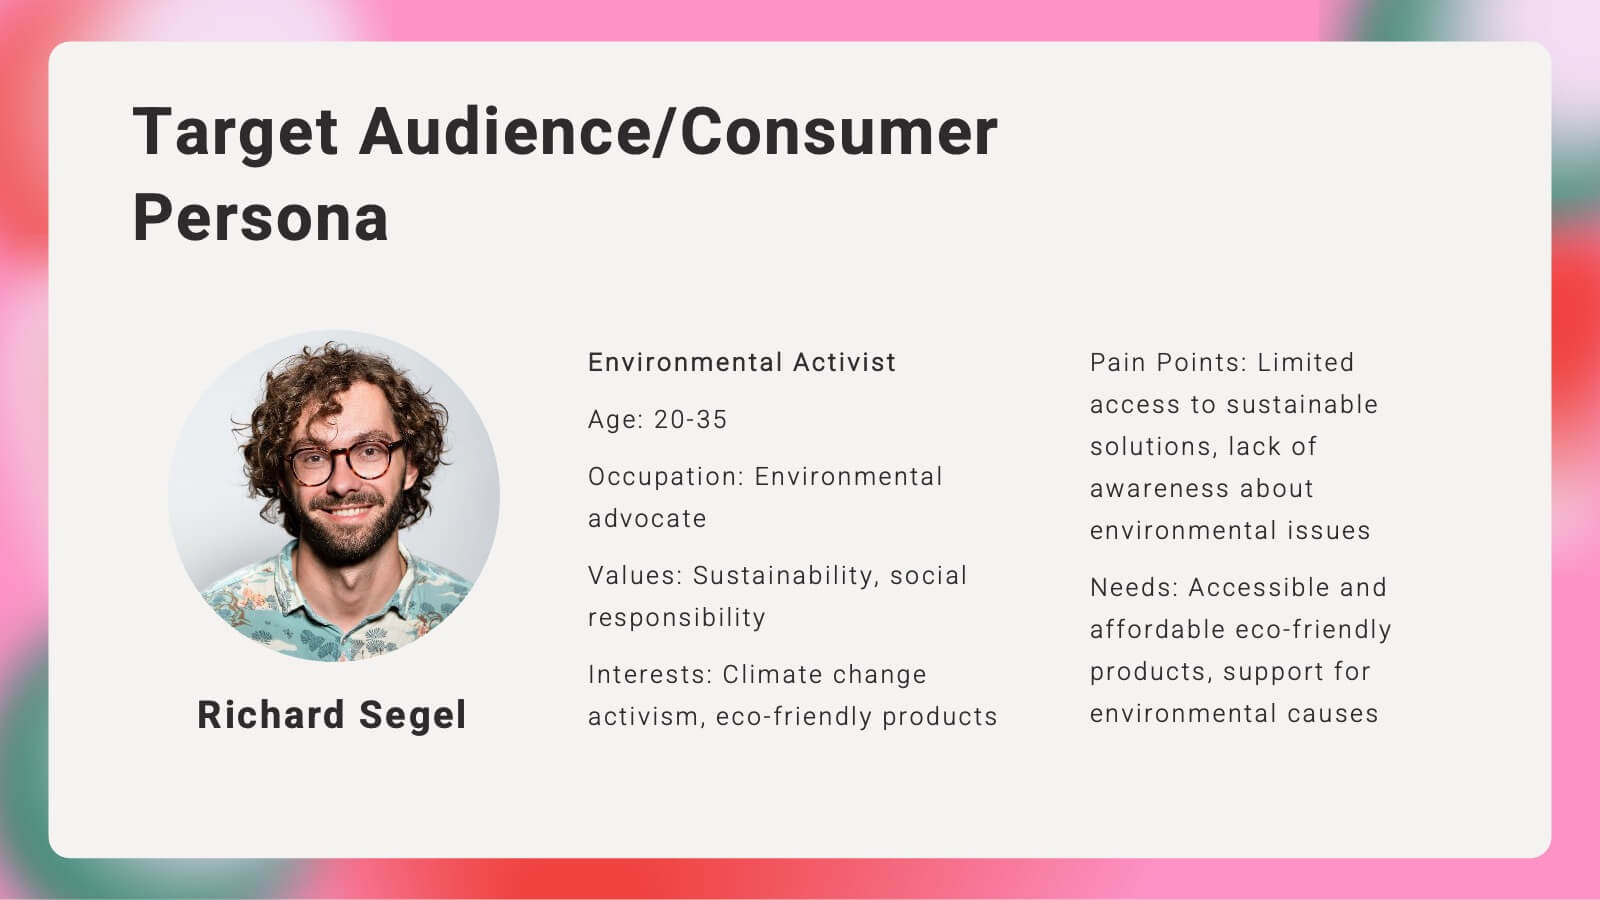
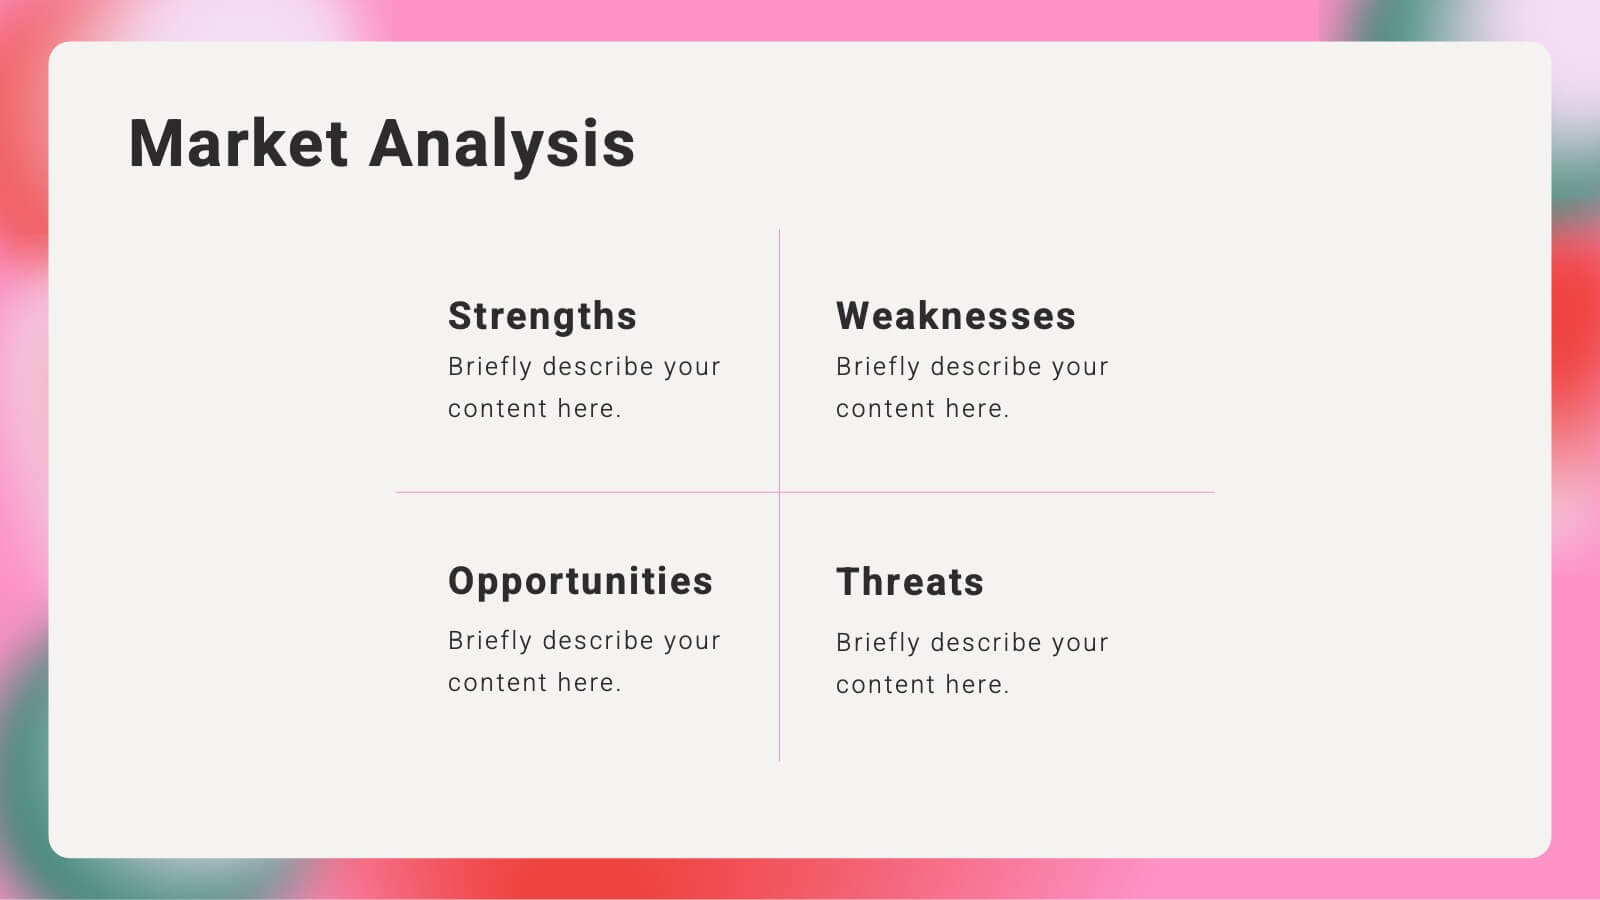
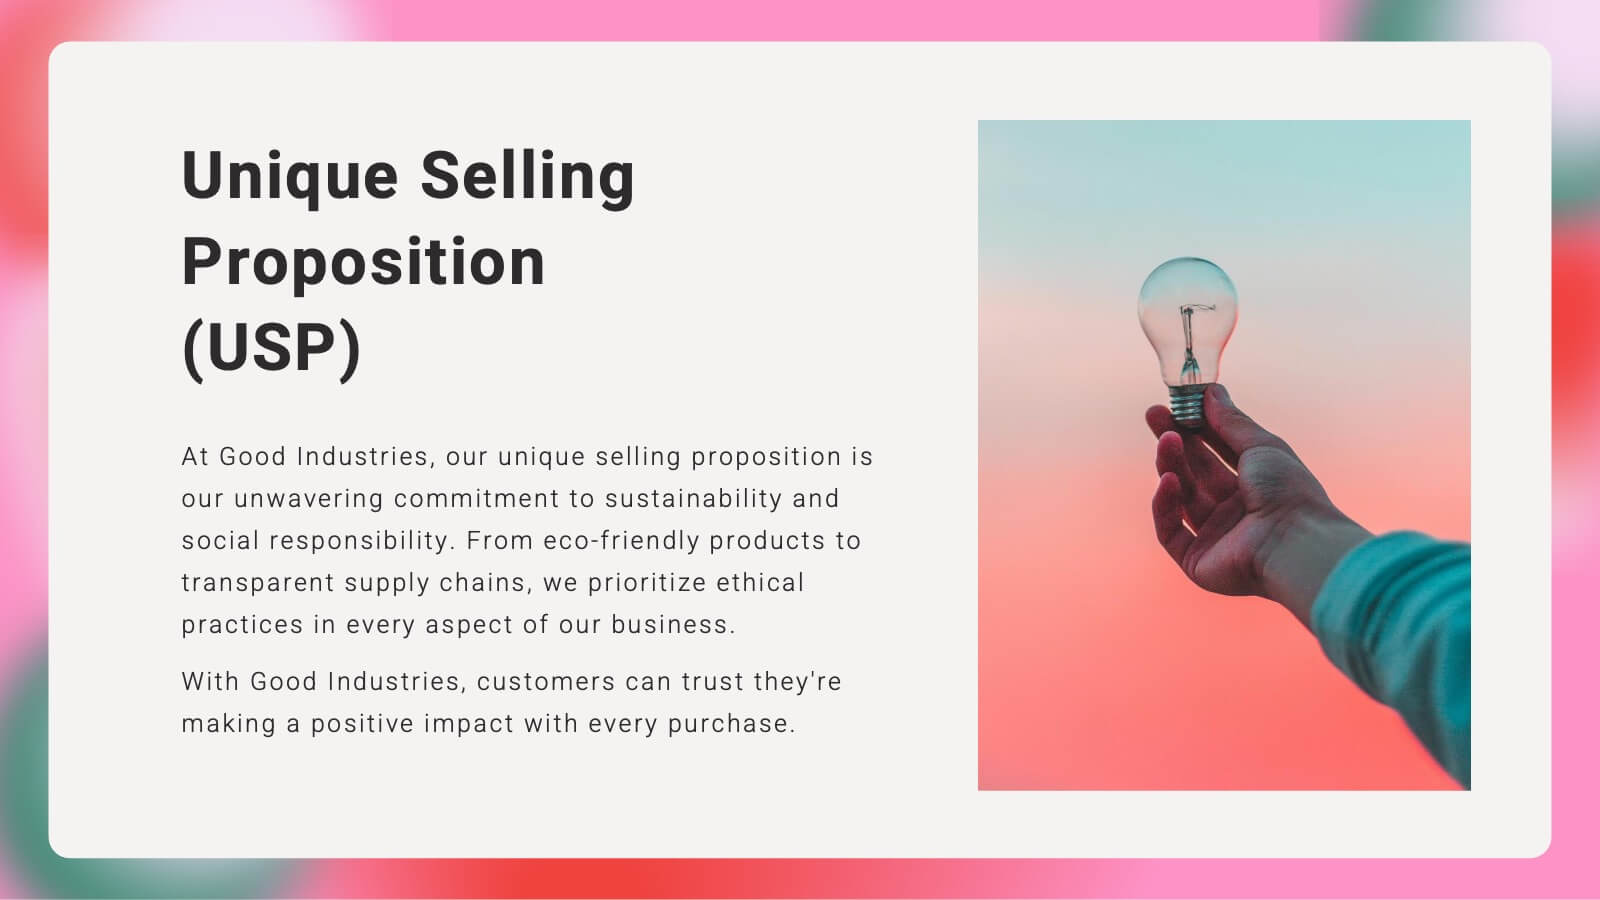
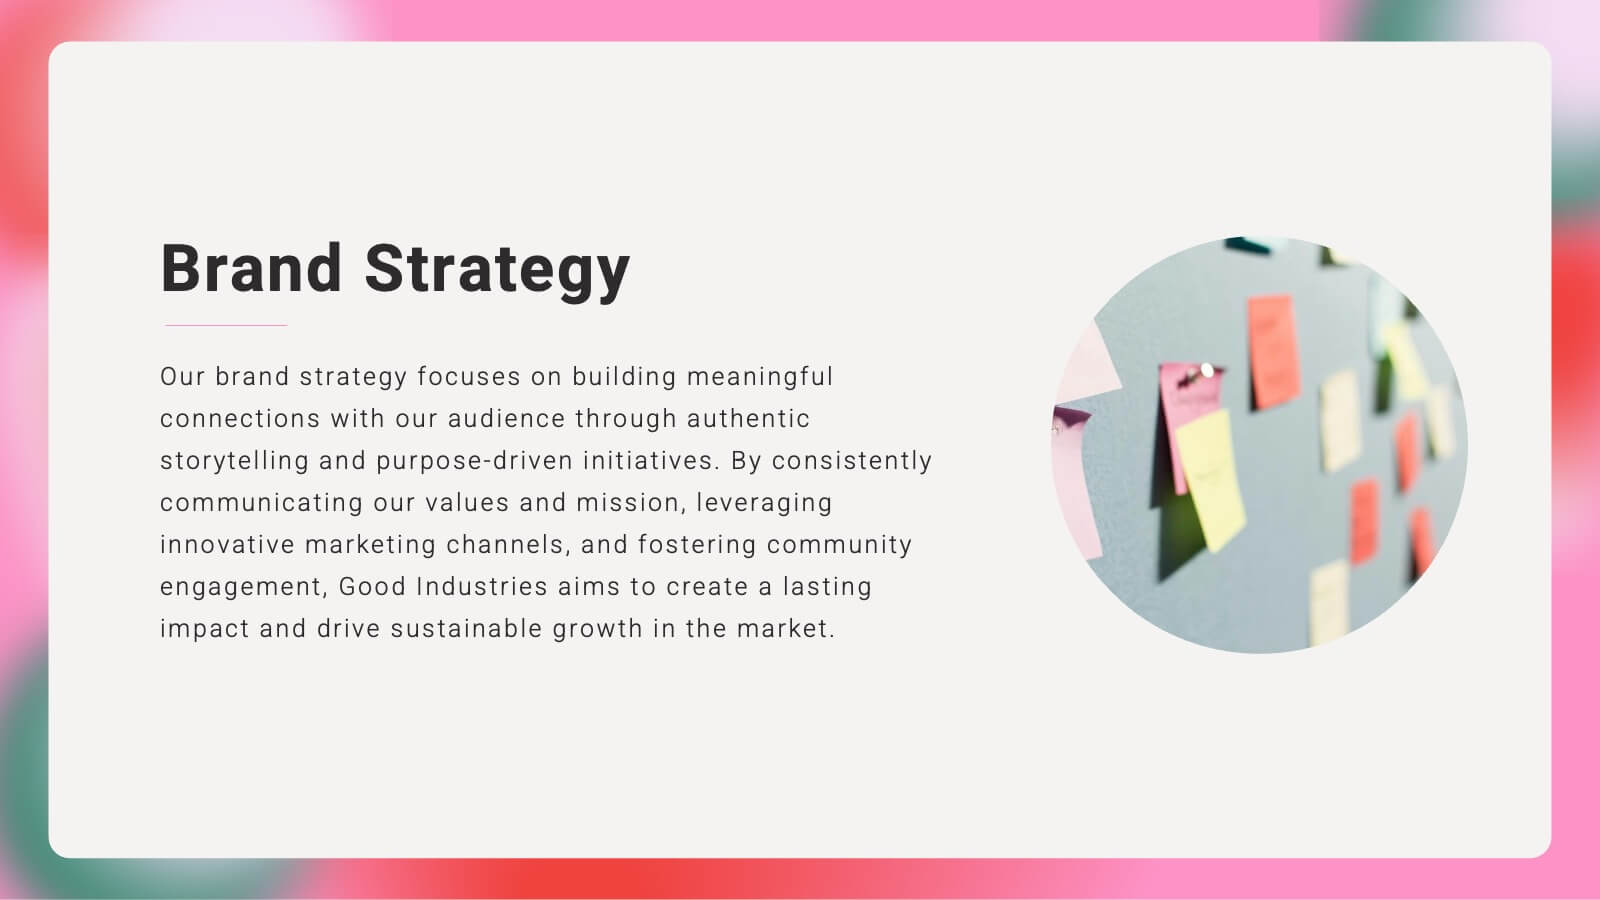
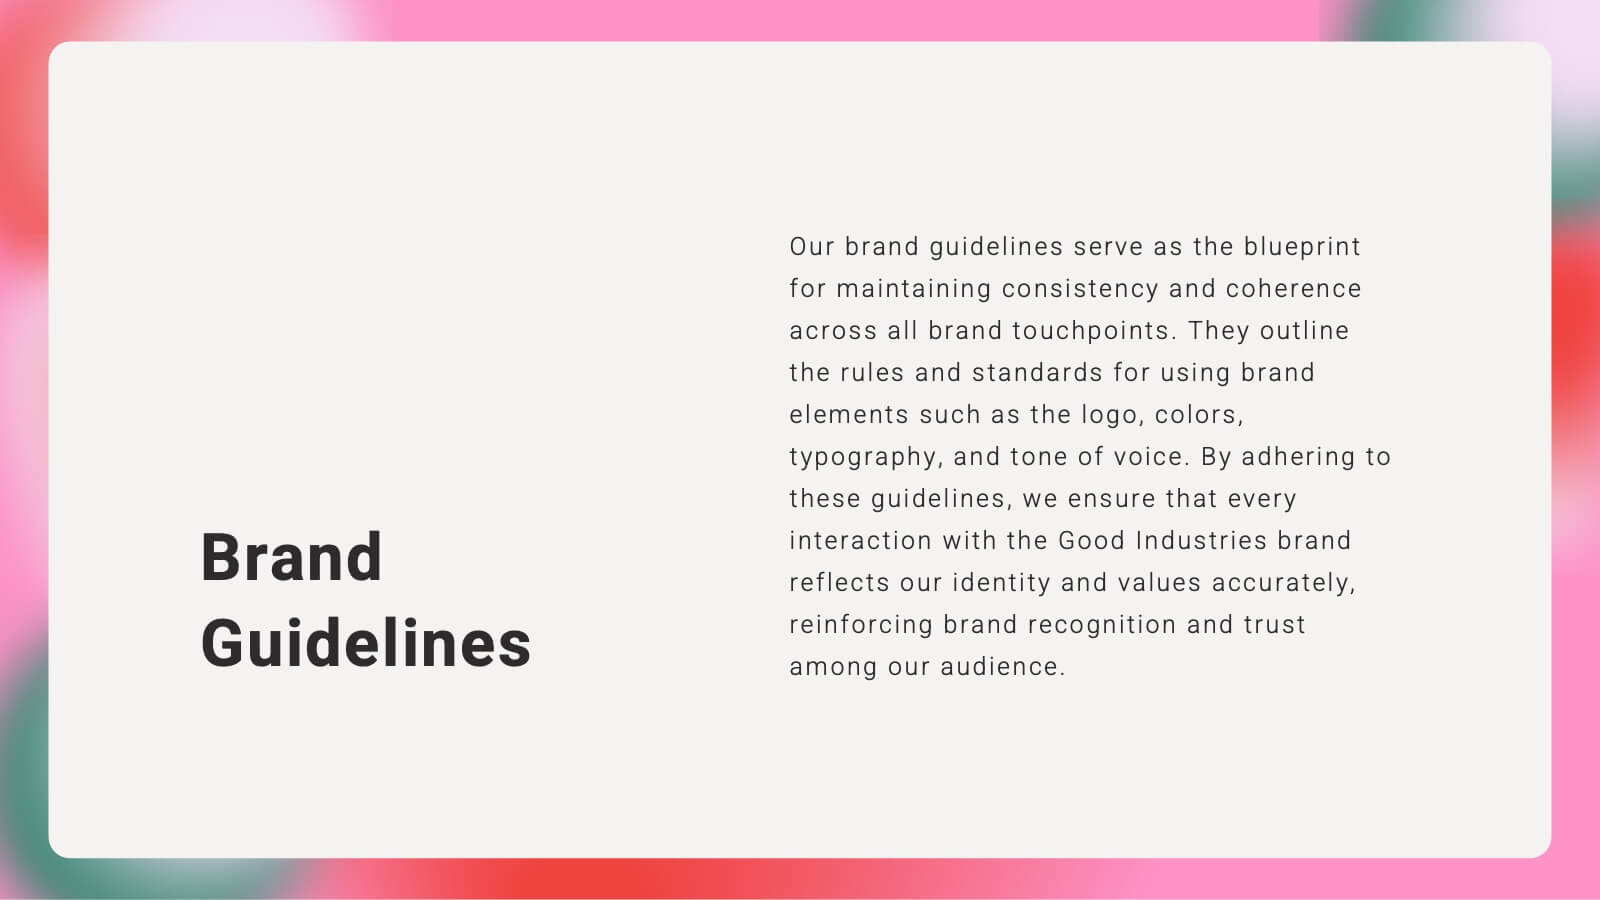
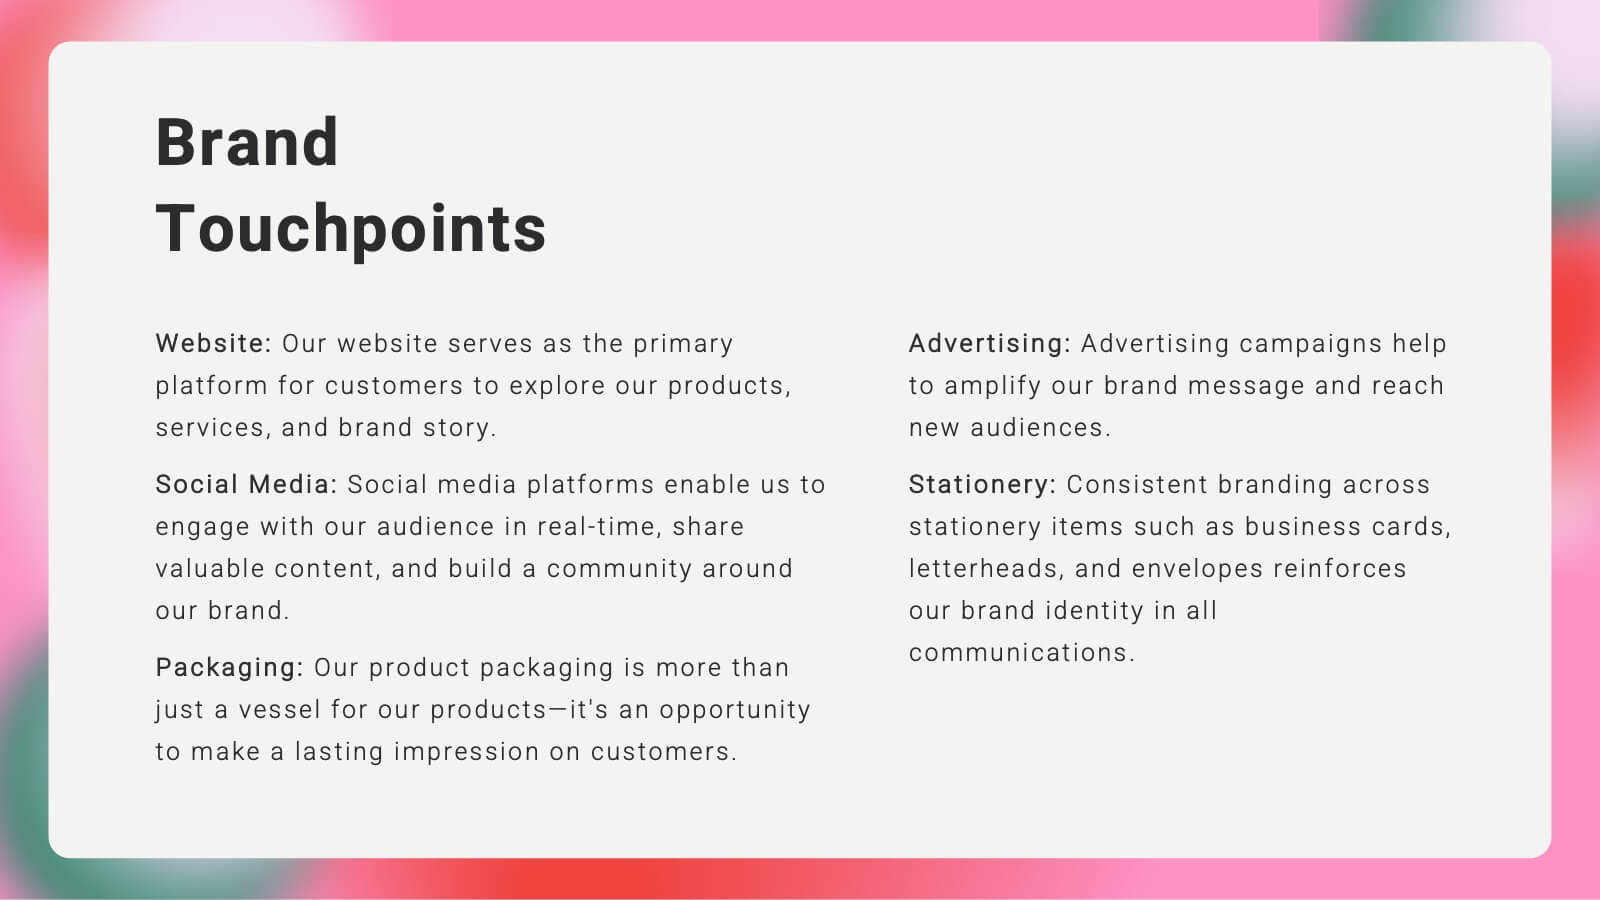
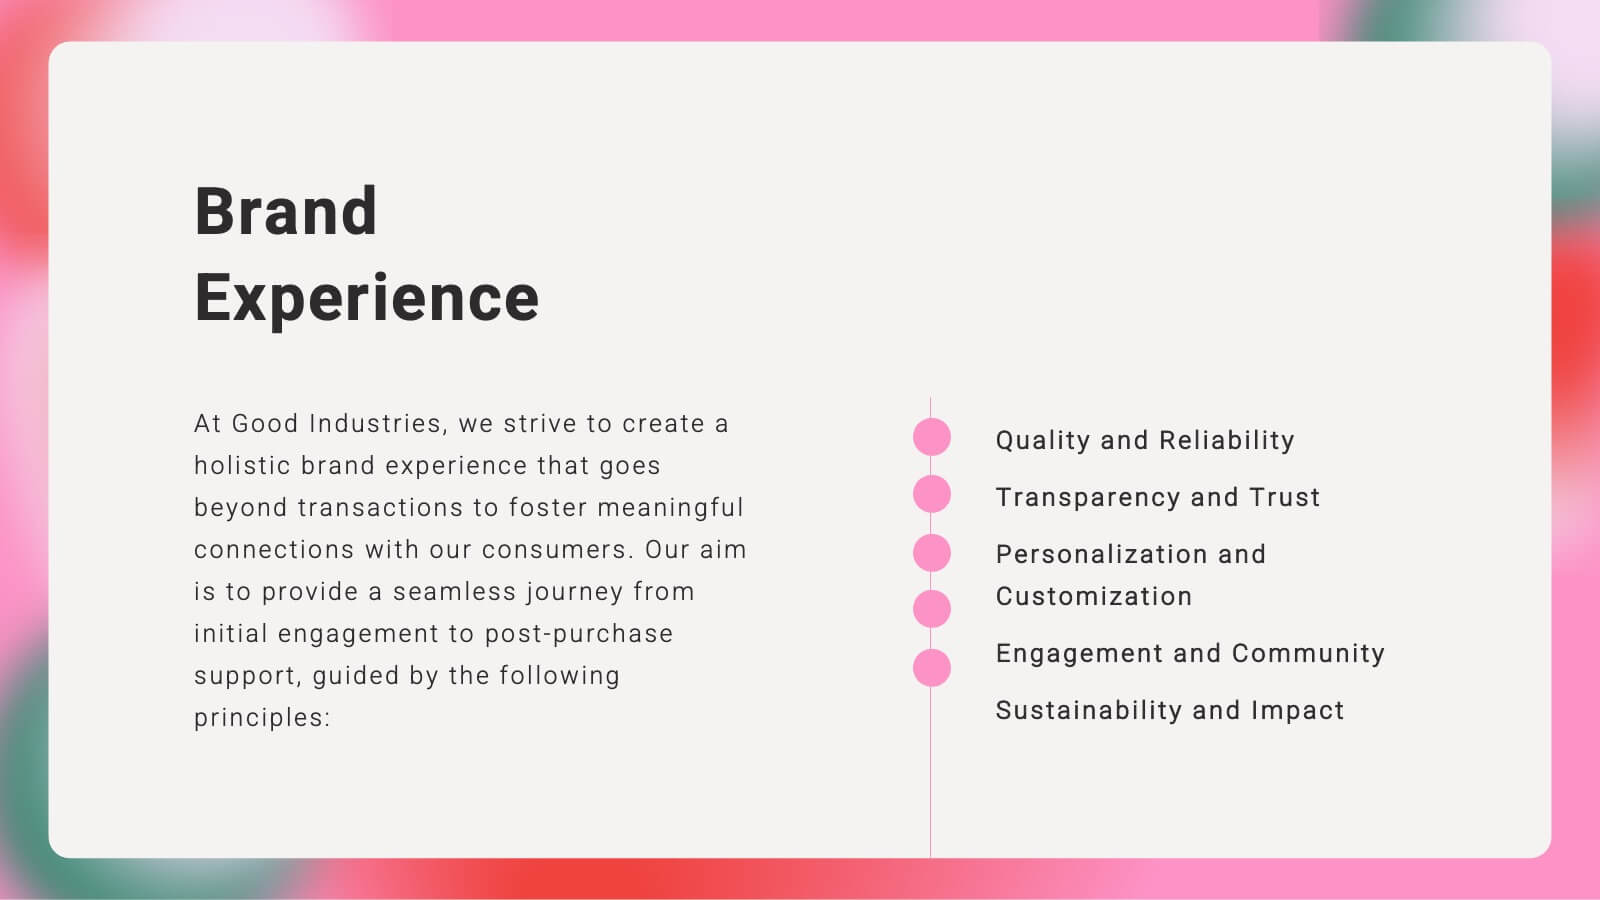
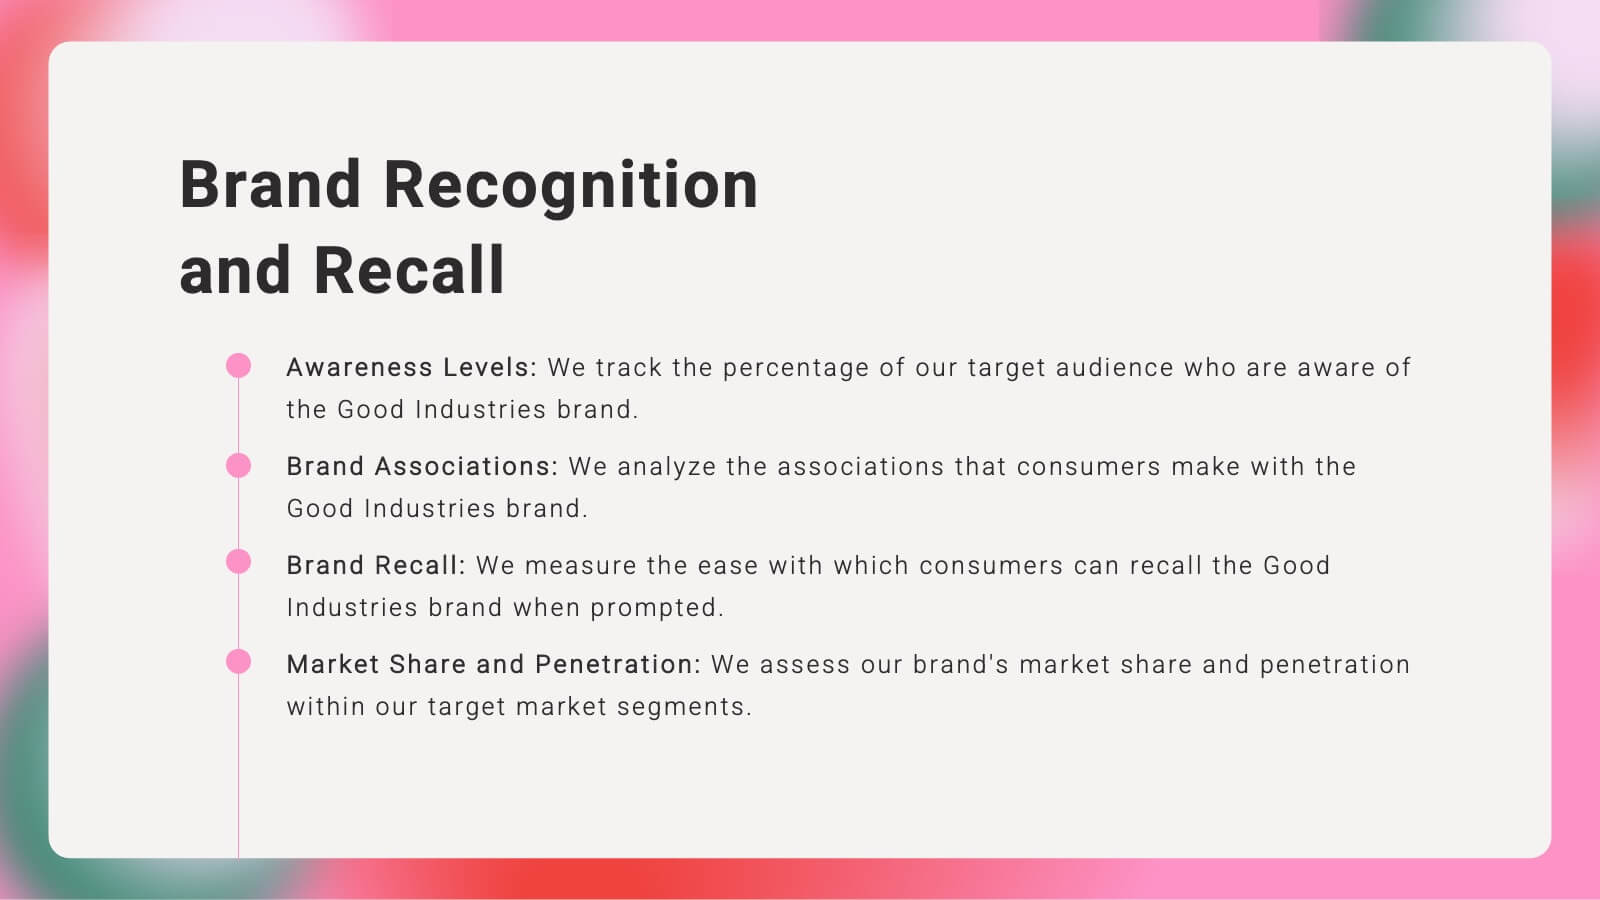
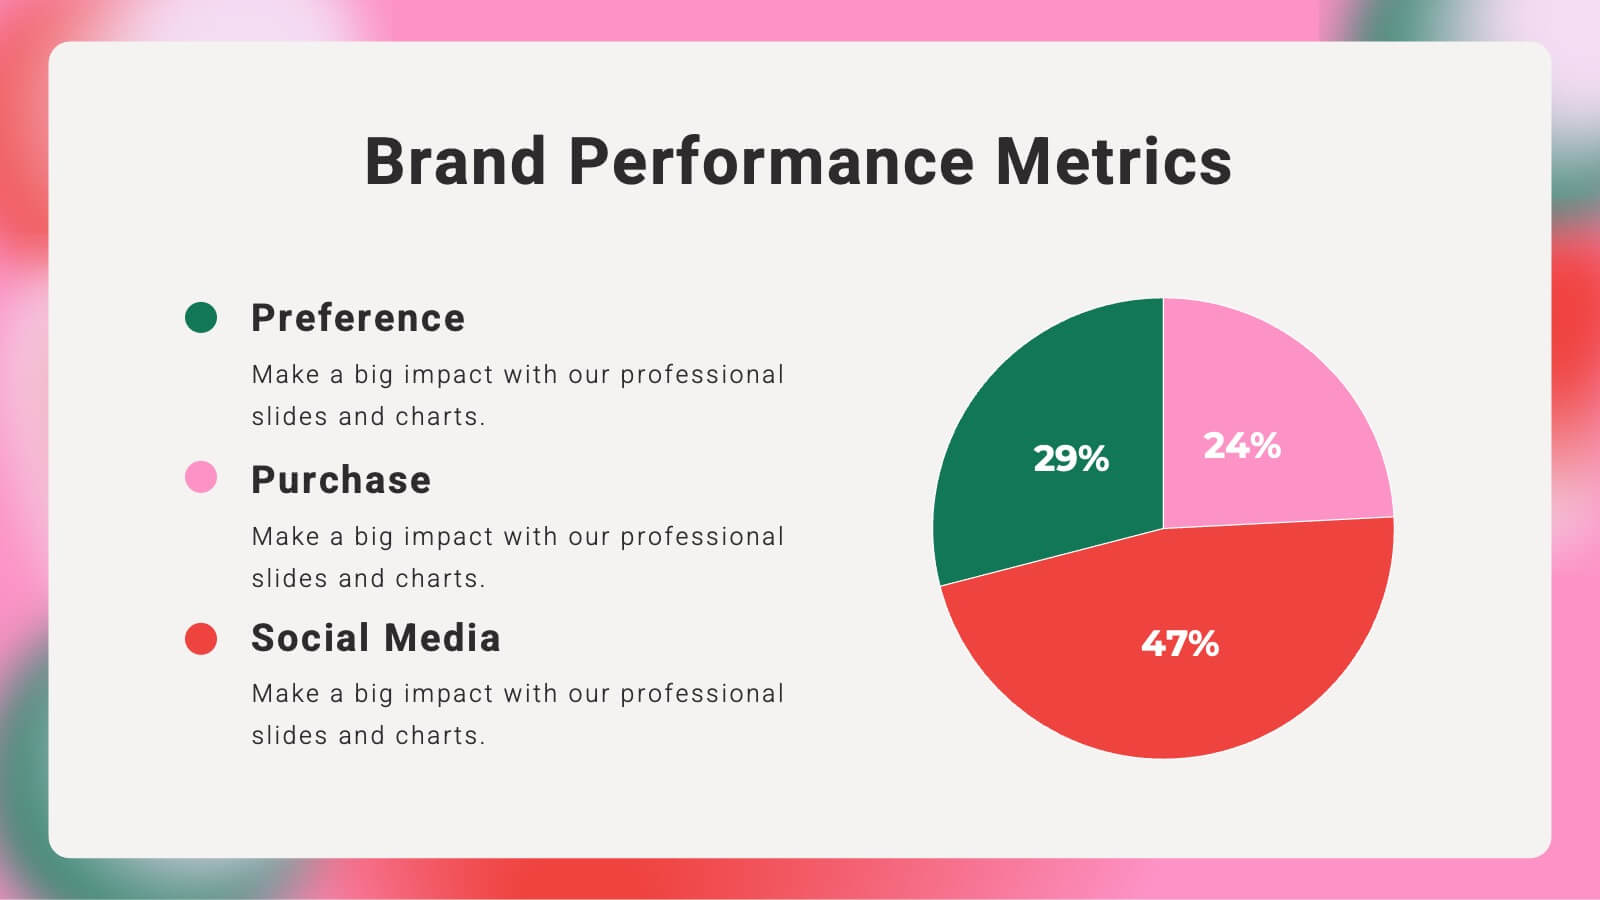
Kaleidoscope Brand Strategy Report Presentation
Craft a compelling narrative for your brand with this vibrant brand strategy presentation template. Designed to cover every facet of brand development, from vision and mission to market analysis and consumer personas, this template is an essential tool for businesses looking to establish a strong brand identity. It incorporates visually engaging slides that outline brand voice, values, and touchpoints, facilitating a thorough understanding of strategic branding. Compatible with platforms like PowerPoint, Google Slides, and Keynote, it is accessible across various devices, making it perfect for collaborative planning and presentations.