


Características


¿Tienes alguna pregunta?
Recomendar


5 diapositivas
Sports Performance Analysis Presentation
Visualize athletic metrics and improvement strategies with this Sports Performance Analysis slide layout. Designed around a dynamic running figure, it uses labeled circular markers (A–D) to clearly break down four key insights or action points. Perfect for sports reviews, training breakdowns, or coaching sessions. Fully editable in PowerPoint, Keynote, and Google Slides.


5 diapositivas
Innovative Business Solutions Presentation
Elevate your strategy discussions with the Innovative Business Solutions template, providing a visually engaging framework designed to present complex business solutions clearly and effectively. It features a unique puzzle design that integrates up to five key business insights, ensuring each piece contributes to a holistic understanding of strategies or solutions. It is compatible with PowerPoint, Keynote and Google Slides, providing flexibility and ease of use across different platforms.


3 diapositivas
Clean Water Initiative Overview Presentation
Communicate sustainability goals with this clean, modern layout featuring water droplet and faucet visuals. Ideal for summarizing three core focus areas of your environmental or nonprofit program. The minimalist design keeps attention on your key points. Fully editable and compatible with PowerPoint, Keynote, and Google Slides for easy customization.


20 diapositivas
Sphene Sales Proposal Presentation
Take your sales pitch to the next level with this elegant and structured presentation template! Featuring sections on sales objectives, process, pricing strategies, and performance metrics, this template is ideal for impressing potential clients and closing deals. It’s easy to customize and works seamlessly with PowerPoint, Keynote, and Google Slides for hassle-free presentation creation.


7 diapositivas
Media Table Infographic Presentation
A Table Infographic is a type of visual infographic that presents complex information in a clear and easy-to-understand way, using rows and columns to display data. Add a new and modern look to your next project with this infographic table template. This template uses a cool blue color scheme on a white background, making this an engaging presentation that will make sure your data tells a story. This infographic features a table layout with title slides and seven unique table layout options that you can easily customize. This template is compatible with Powerpoint, keynote and Google Slides.


22 diapositivas
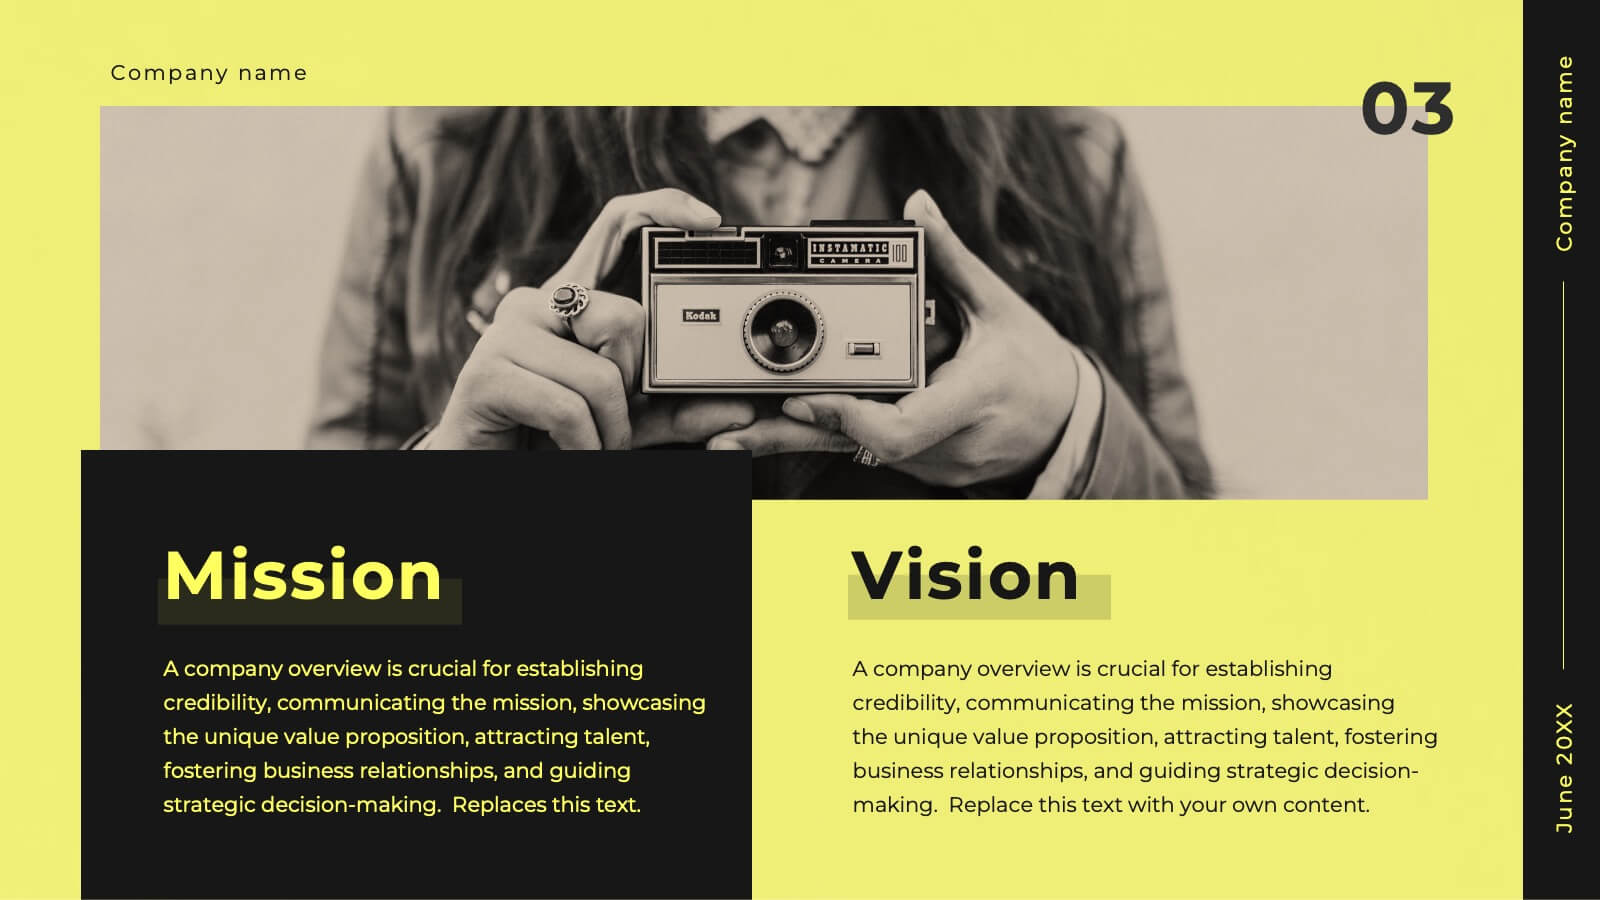
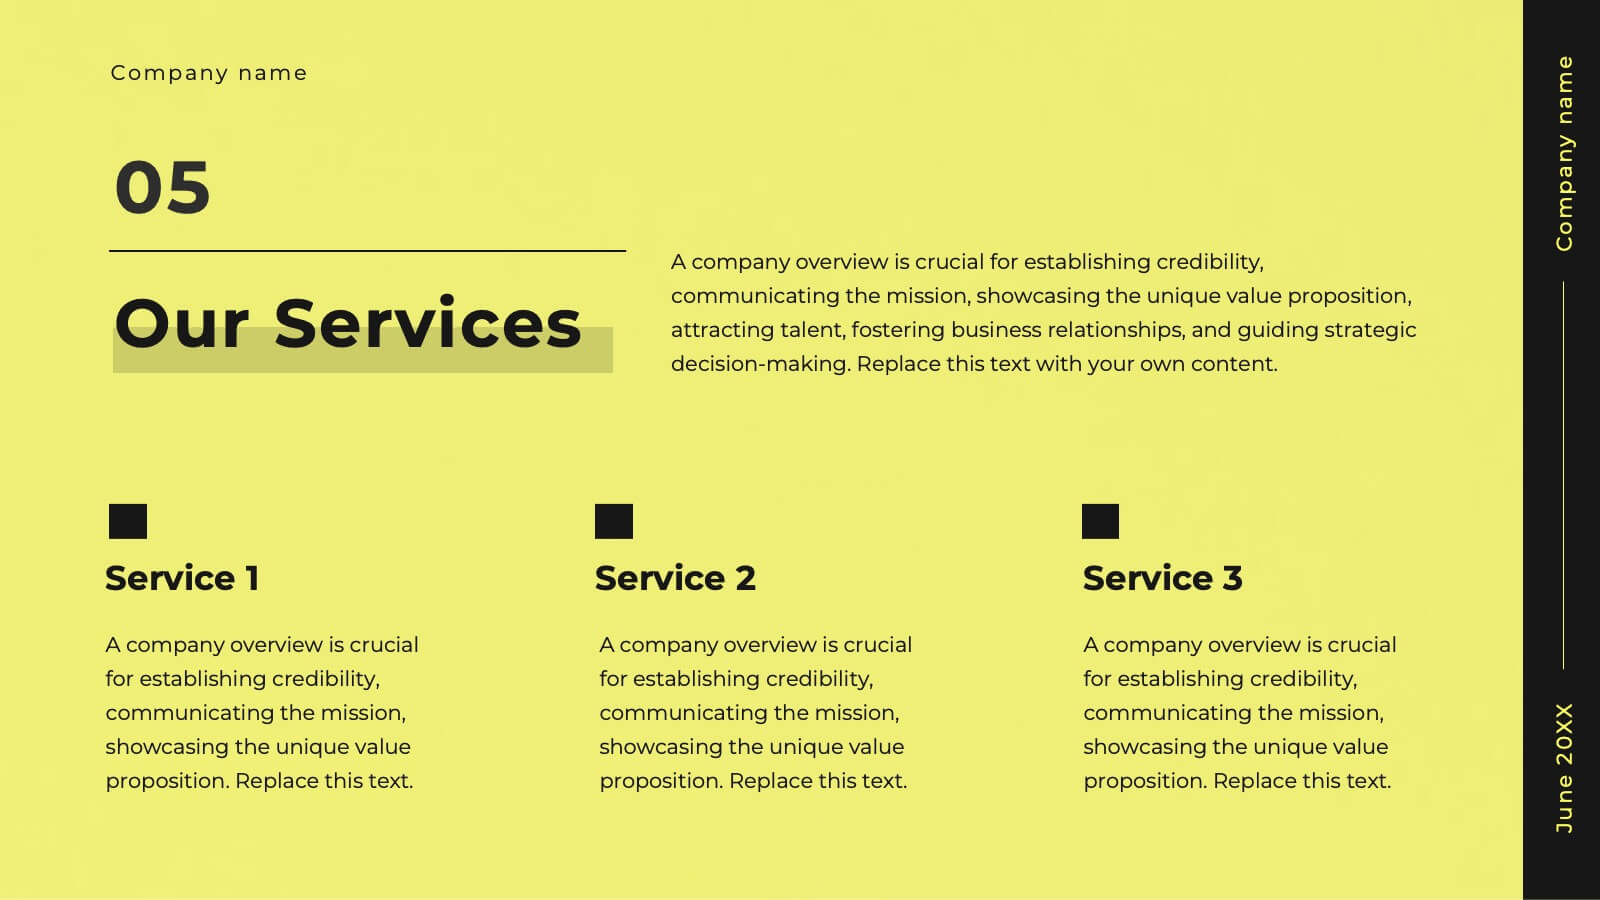
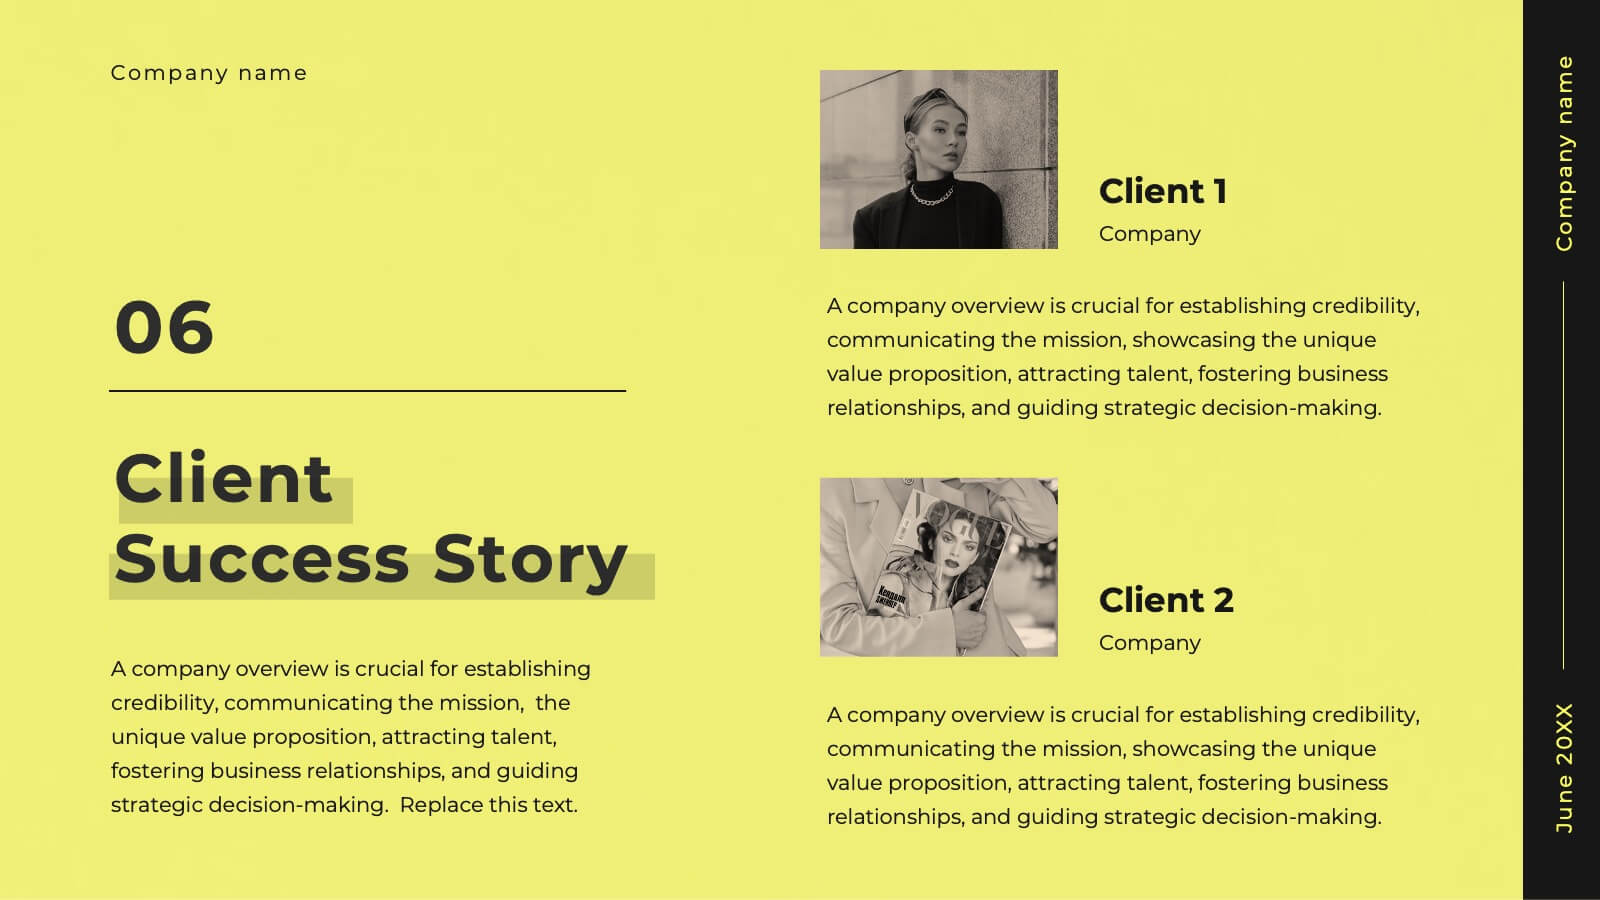
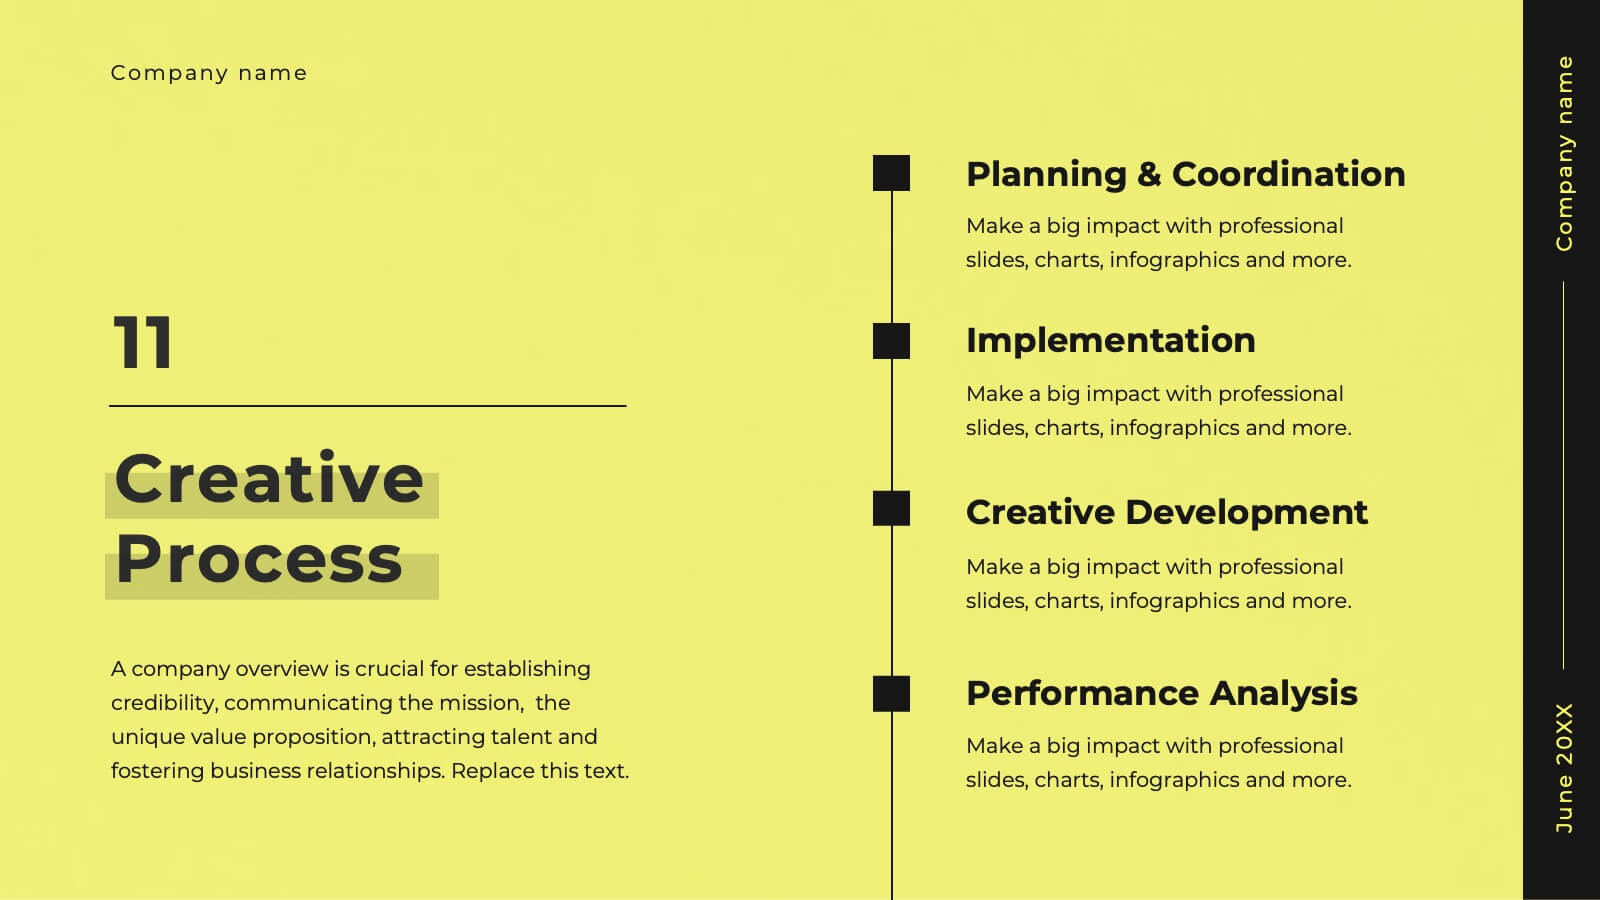
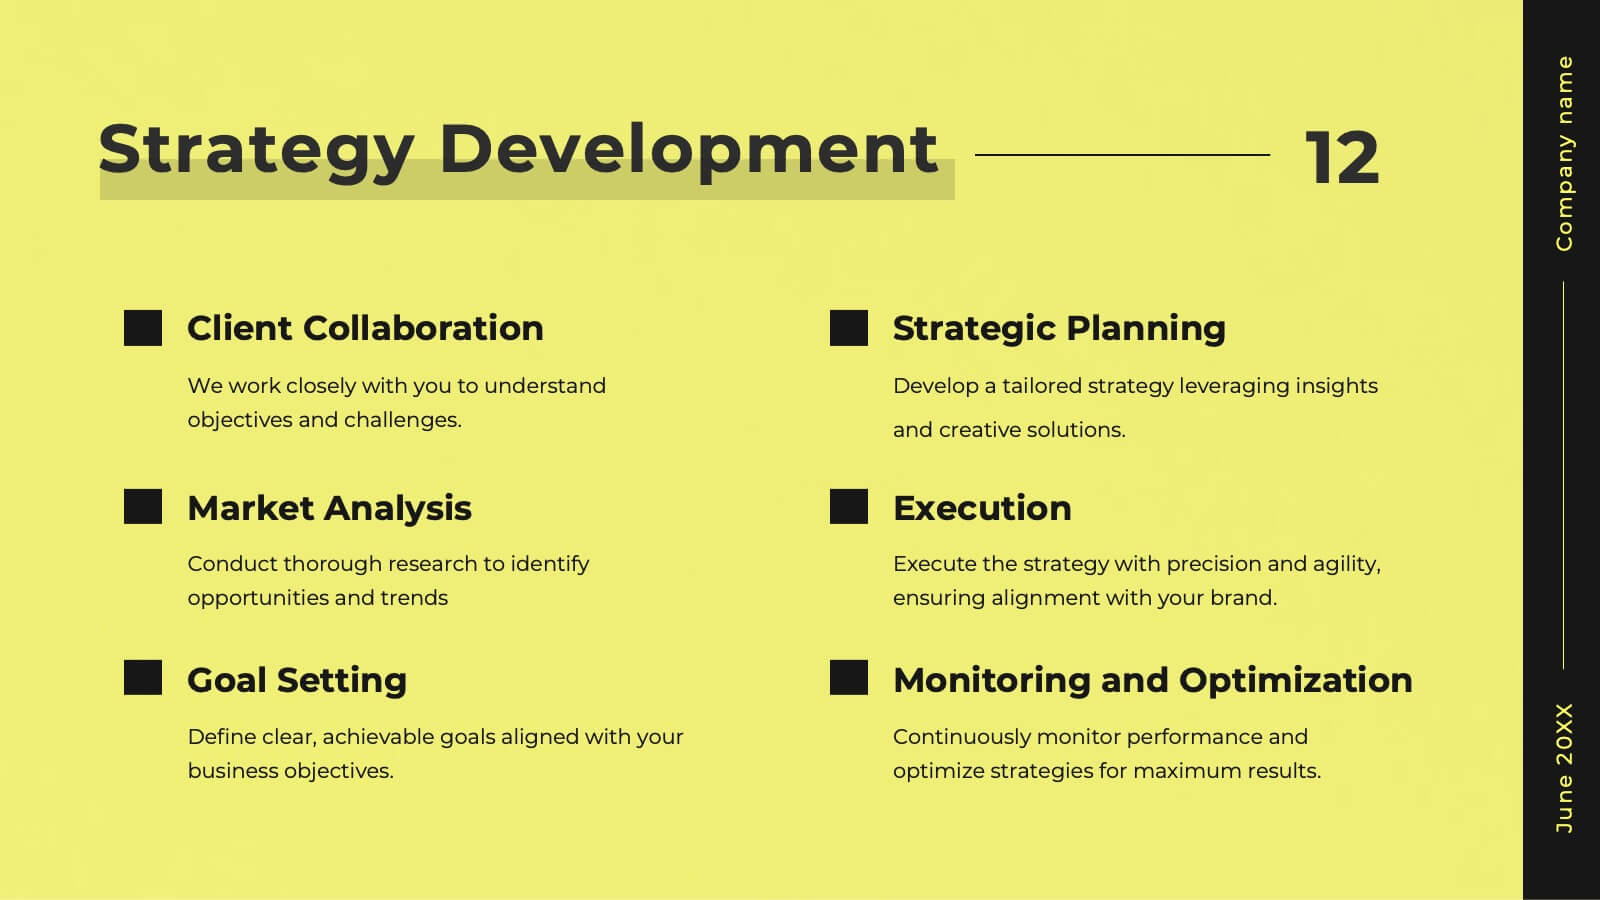
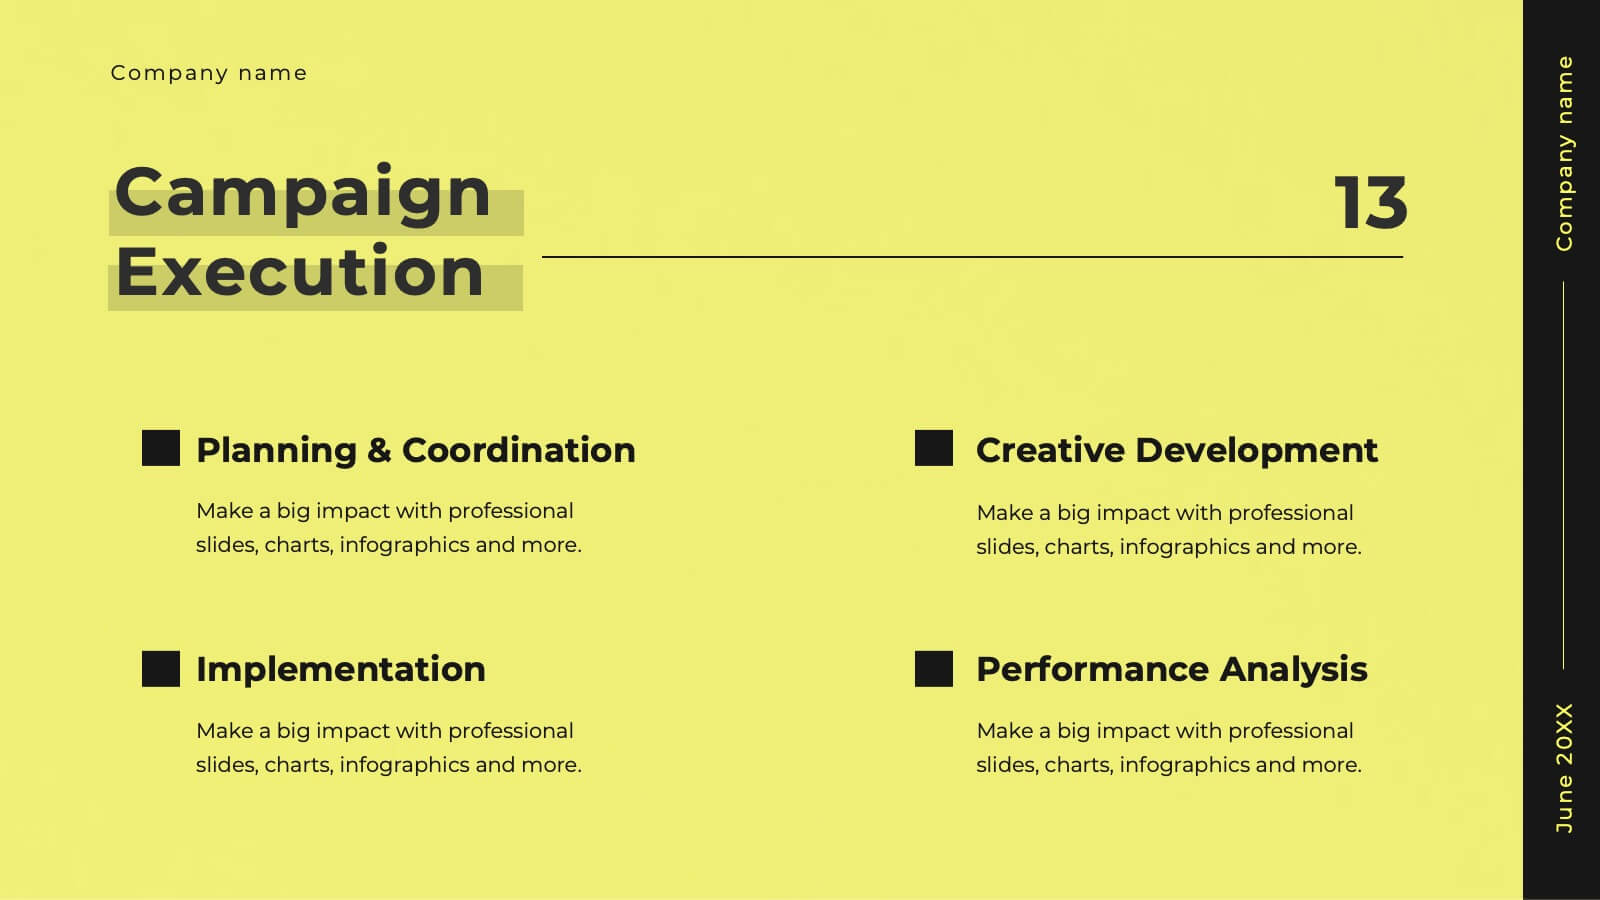
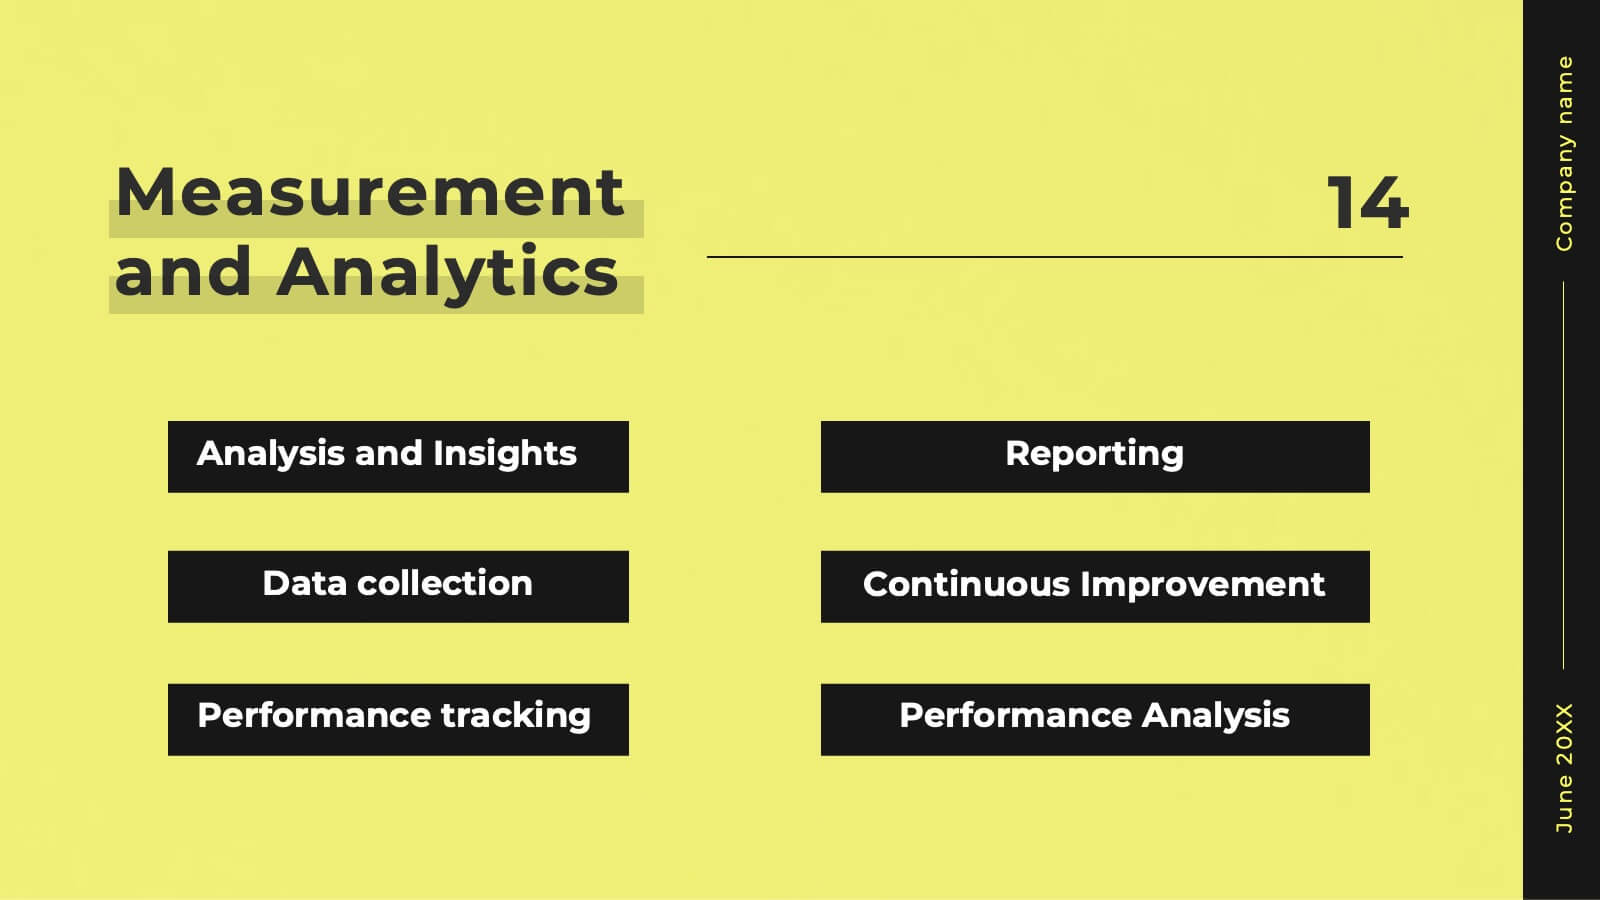
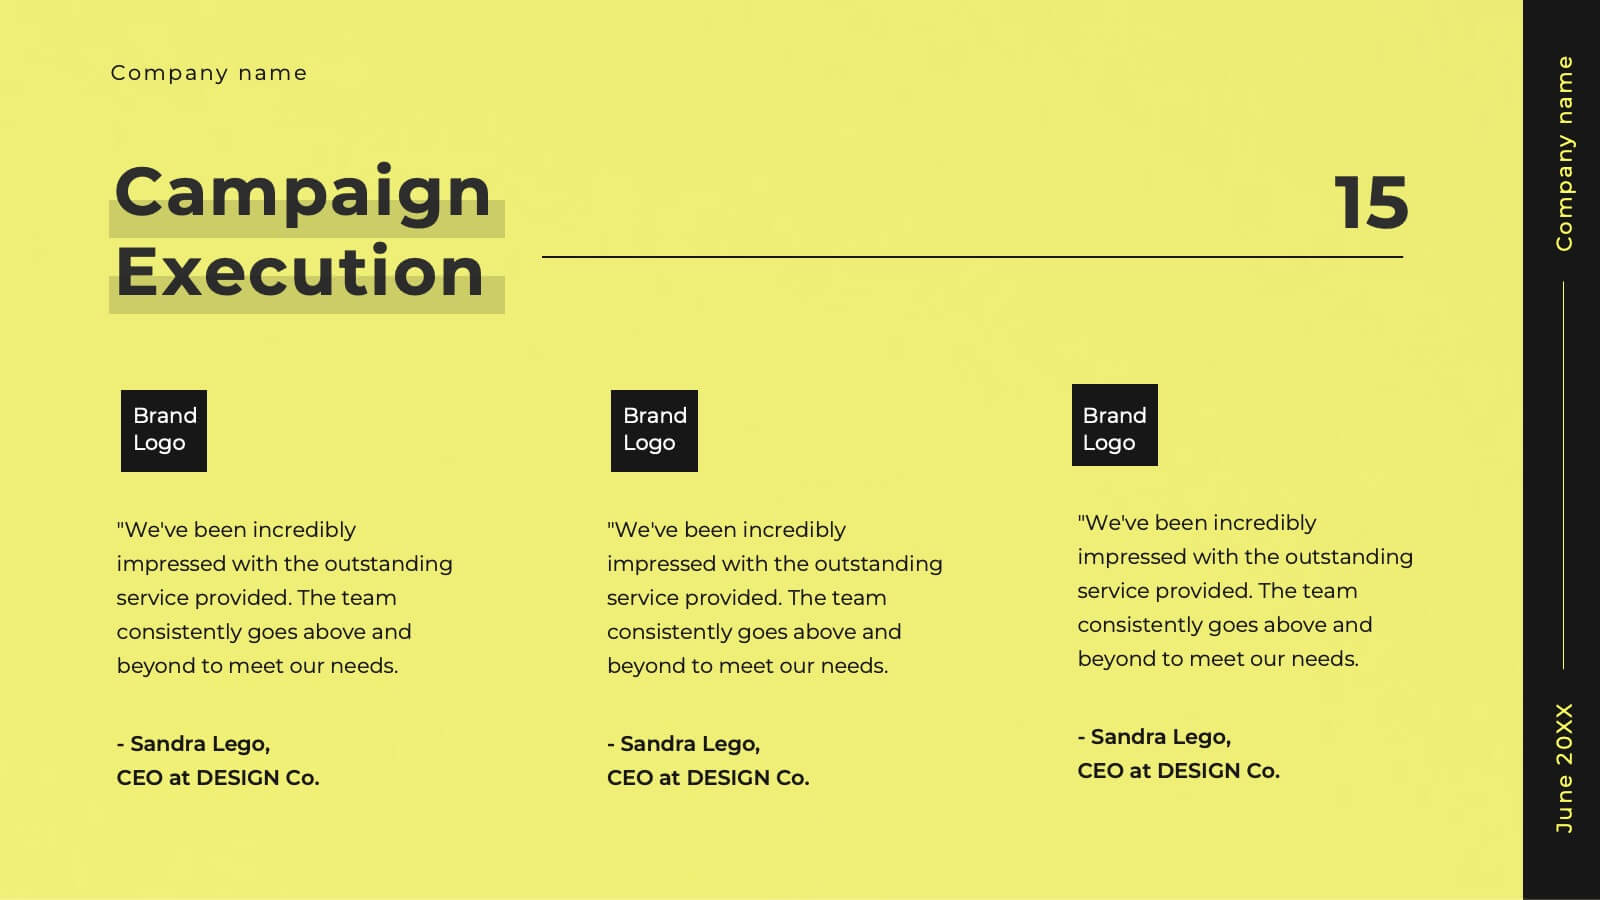
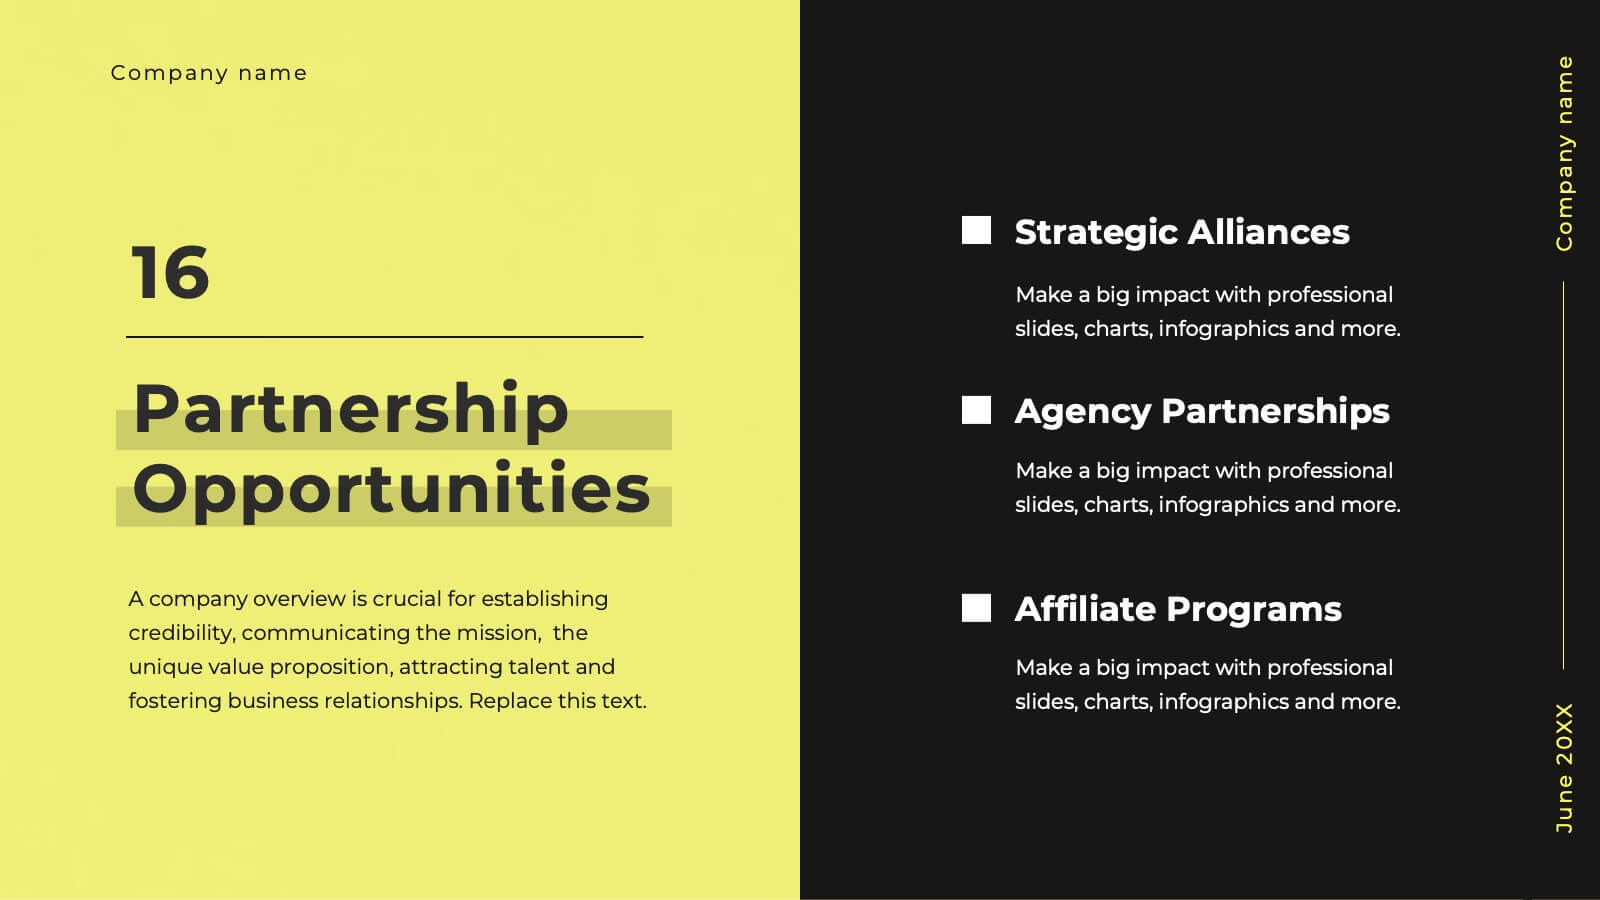
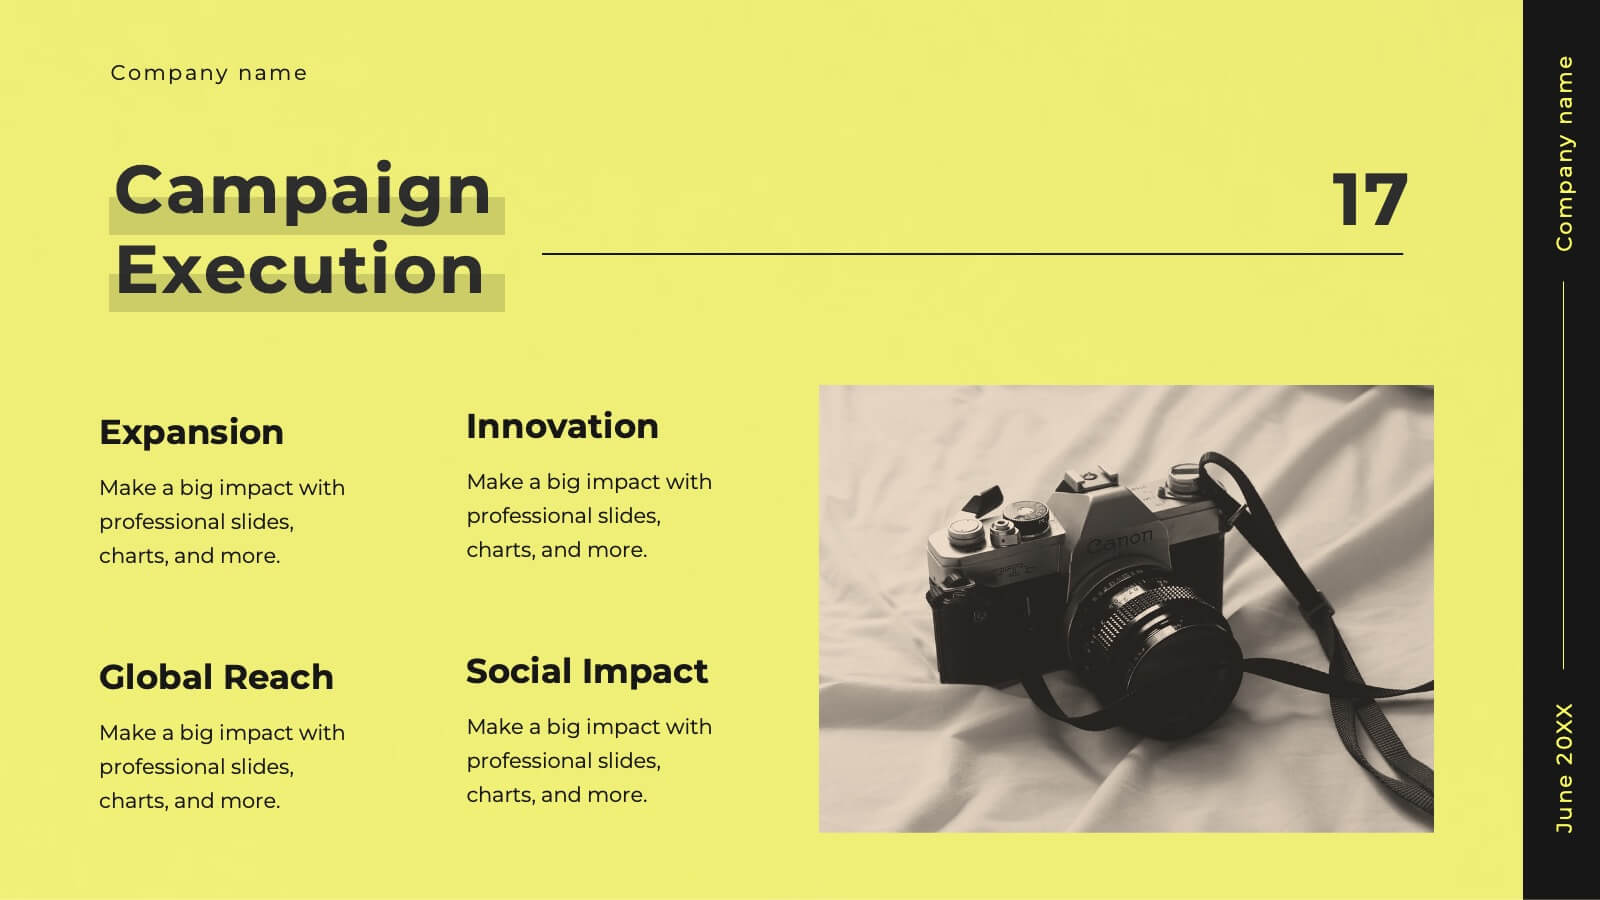
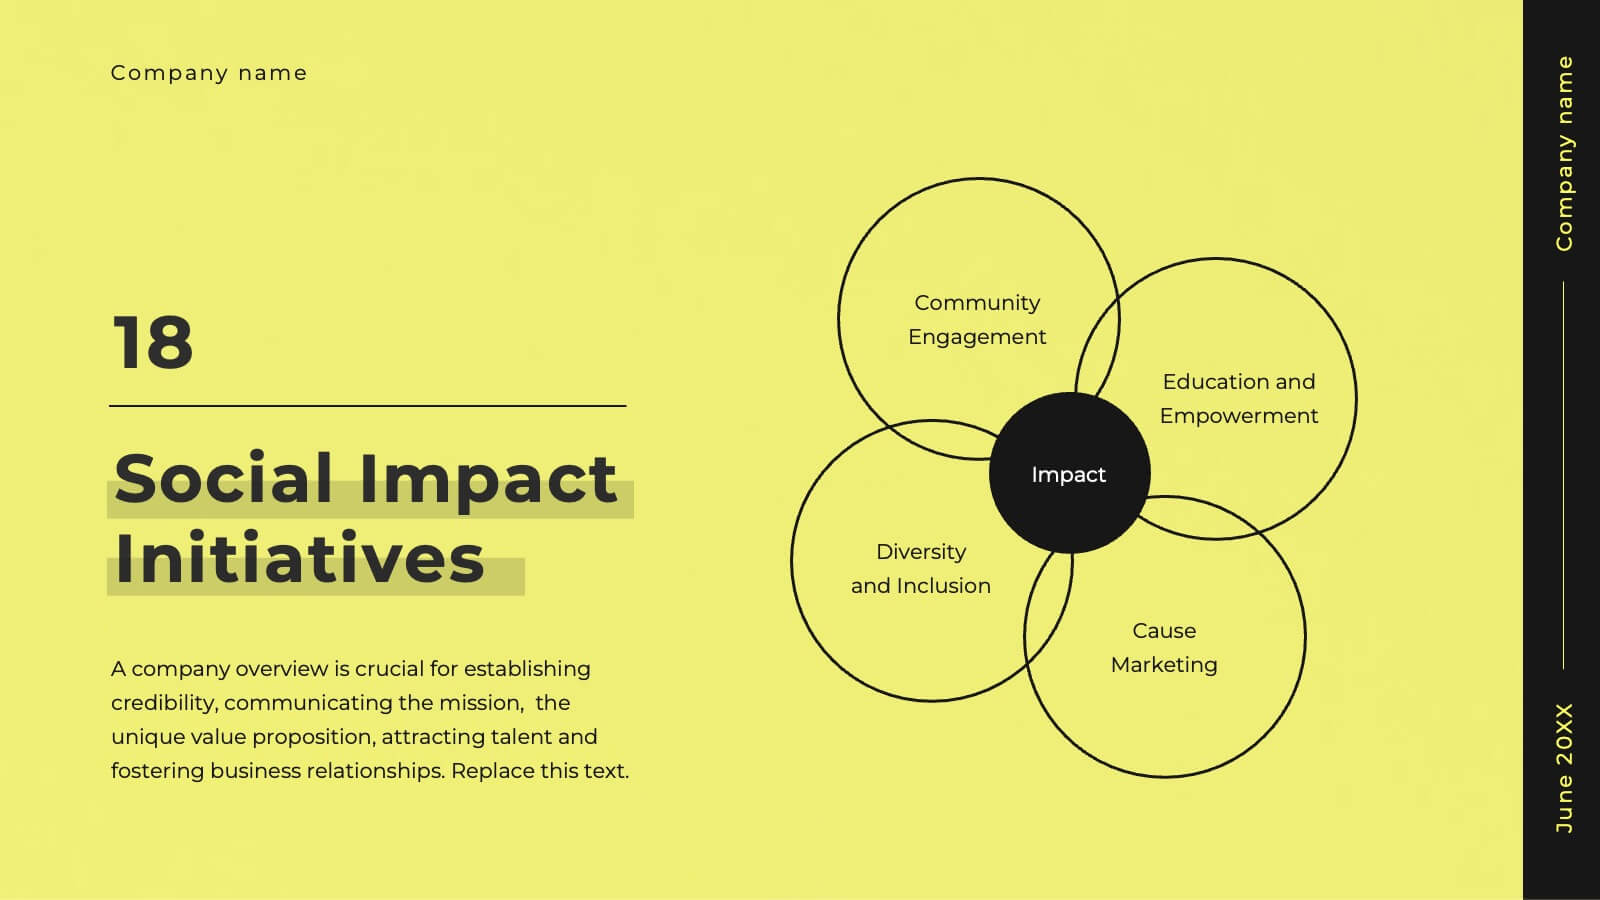
Glimmer Creative Agency Pitch Deck Presentation
Step up your game with this vibrant agency pitch deck template! Ideal for showcasing your services, client success stories, and strategic approach, it includes dynamic slides for market analysis and campaign execution. Engage potential clients with compelling visuals and well-organized content. Compatible with PowerPoint, Keynote, and Google Slides for a smooth presentation experience on any platform.


7 diapositivas
SCRUM Master Infographic Presentation
A Scrum infographic provides an overview of all the key components of the Scrum framework and helps teams and individuals understand this powerful agile methodology. This Infographic template is fully editable and can be easily customized to reflect your business, company or organization. It’s a great way to present your ideas in a clear and efficient manner. Full of charts and diagrams, this template creates an impactful visual effect. The blue color scheme will help create a fresh look in your presentations. This template is designed for use in Powerpoint, Google Sheets or Keynote.


6 diapositivas
Tables of Content Analysis Infographic
Table of Contents analysis refers to the examination and evaluation of the structure and content of a document's table of contents. It is commonly used as a preliminary step to understand the flow of information within a longer document, such as a book, report, thesis, or research paper. This infographic template provides insights into the document's structure and can help readers determine whether the document is relevant to their needs. This infographic is designed to provide a quick overview of the topics covered in the document and their distribution, helping readers understand the organization of the content at a glance.


5 diapositivas
Data Density Visualization via Heat Mapping Presentation
Turn complex datasets into clear insights with the Data Density Visualization via Heat Mapping Presentation. This layered area chart template is perfect for showcasing data intensity over time—ideal for monthly trends, usage spikes, or multi-variable performance analysis. Fully customizable in Canva, PowerPoint, Keynote, and Google Slides.


7 diapositivas
Budget Forecasting Infographic Presentation Template
The process of budget forecasting consists of estimates and analysis. By projecting future revenue and expenses you can plan for the future of your business. This technique aims to provide a quantitative assessment of an organization's financial position at a specific point in time. This template will help you budget forecast, organize income and expenses, and track spending over time. This template can be used to give a professional presentation on forecasting and projections. The diagrams and graphs ensure that the numbers are easy to read while the ideas they represent are clearly explained.


6 diapositivas
Matrix Diagram
A matrix diagram, also known as a matrix chart, is a visual tool used to analyze and organize complex information by displaying it in a matrix format. This infographic template provides a visual framework for analyzing complex information, and improving understanding of relationships between different elements or factors. This template allows users to effectively communicate complex relationships and categorize information using a matrix format. This is perfect to use in a wide range of contexts, including project management, problem-solving, decision-making, strategic planning, and data analysis.


5 diapositivas
Types of Pets Infographics
There are a wide variety of pets that people can choose from, depending on their preferences, lifestyle, and the level of care they are willing to provide. These infographic templates offer an engaging way to showcase different types of pets and provide valuable information to viewers. Its customizable features, visually appealing elements, and modern design make it an effective tool for educational presentations, pet-related events, or any presentation related to pet types and their characteristics. These infographics are perfect to showcase various types of pets that people can keep as companions.


4 diapositivas
Market Growth Strategy Presentation
Drive business success with this Market Growth Strategy template. Designed for marketers, entrepreneurs, and business analysts, this slide features a step-by-step financial growth visualization using stacked coin icons and peak markers. Showcase key strategies, revenue projections, and scaling tactics in an engaging, easy-to-follow format. Fully customizable and compatible with PowerPoint, Keynote, and Google Slides.


22 diapositivas
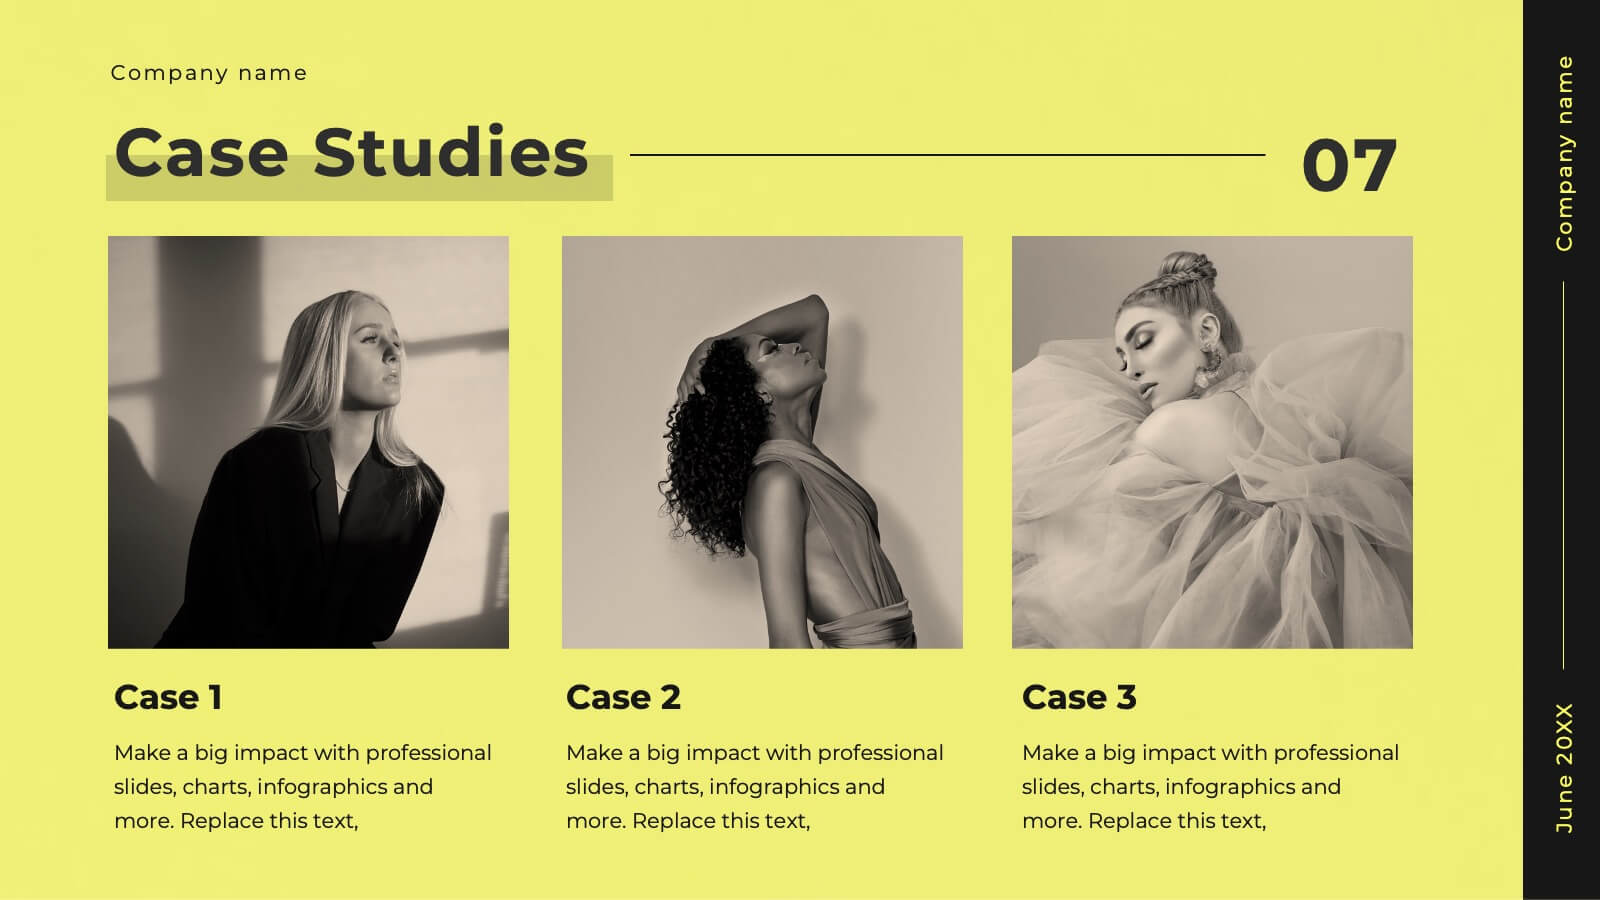
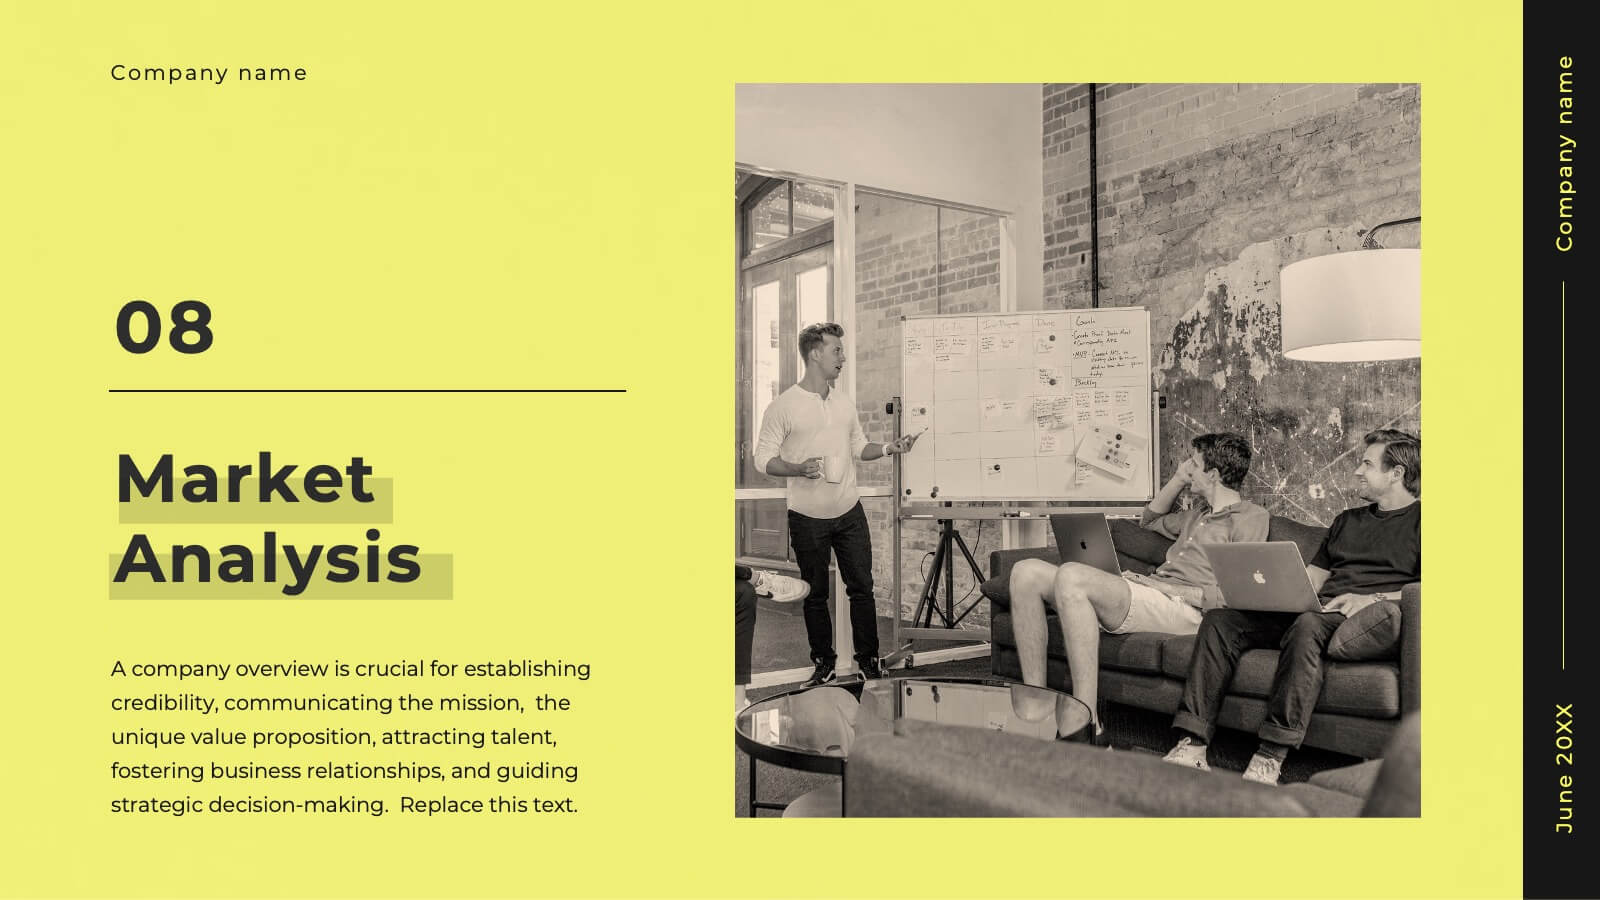
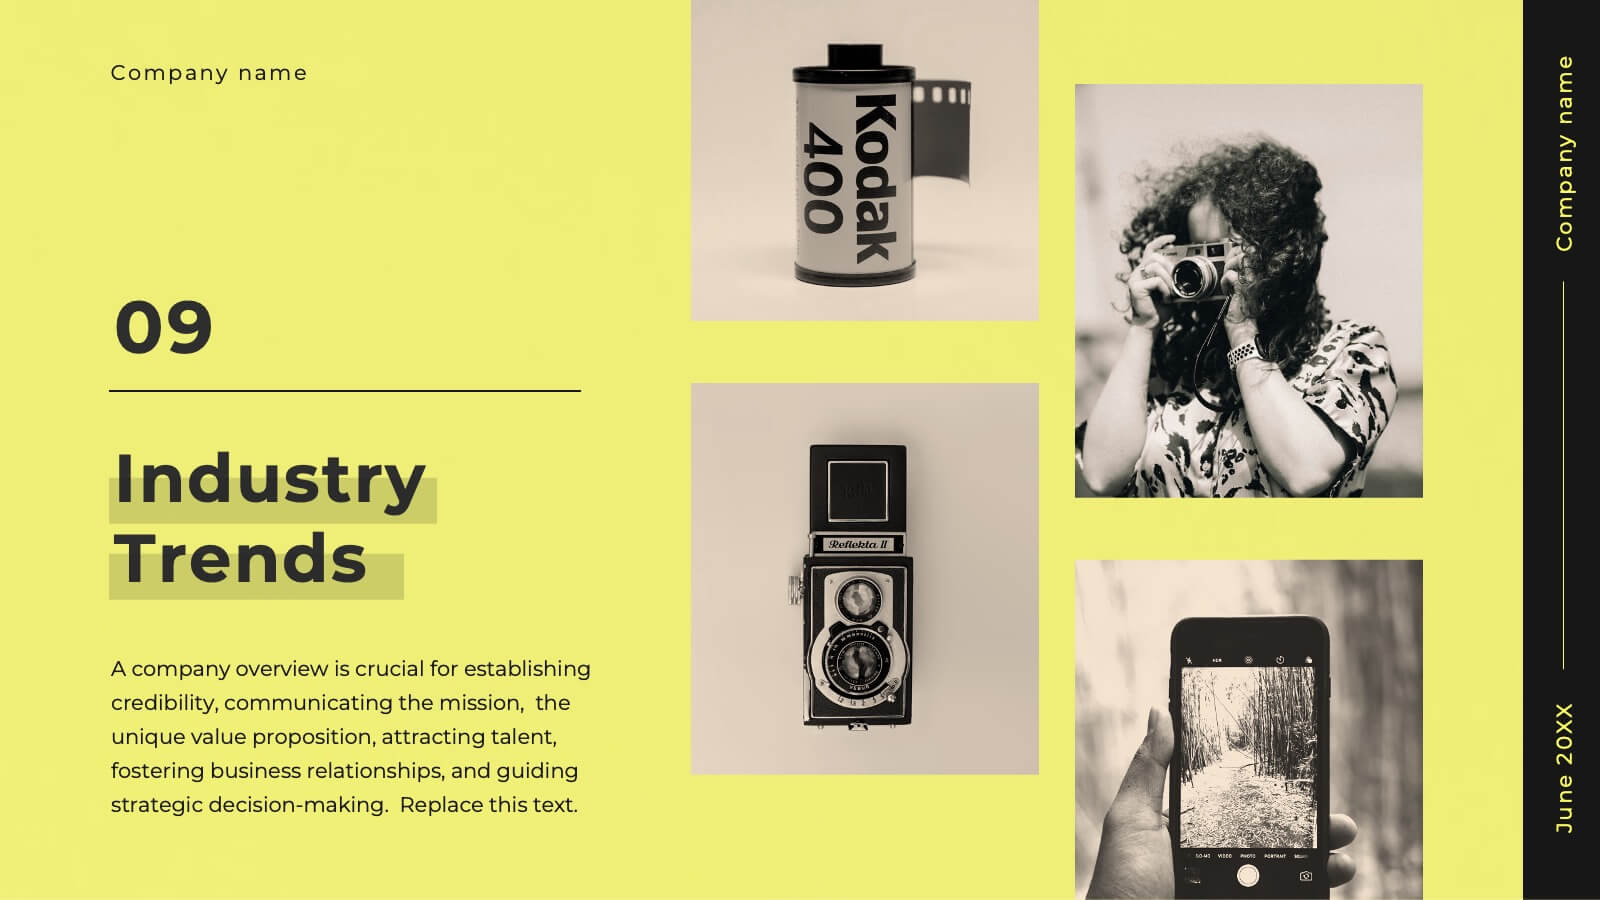
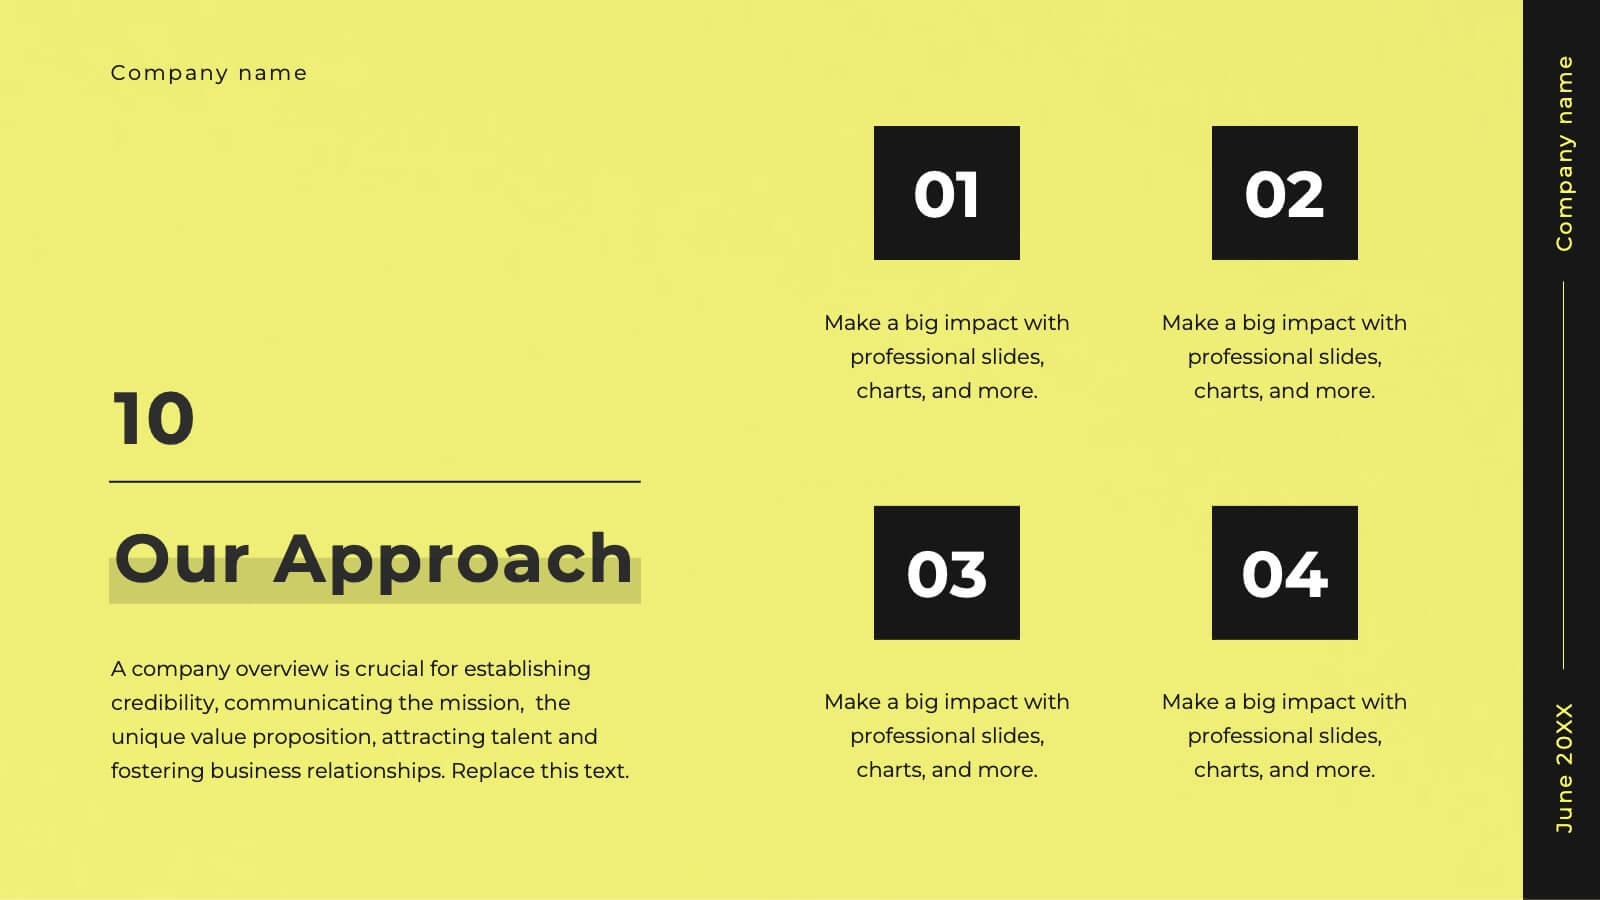
Verseon Full-Service Agency Project Plan Presentation
Deliver your agency’s strategy with this modern and professional presentation template. Covering key sections such as services, case studies, market analysis, strategy development, and future outlook, it’s designed for seamless customization. Fully editable and compatible with PowerPoint, Keynote, and Google Slides.


5 diapositivas
Survey Findings and Summary Report Presentation
Present survey data clearly with this layered, step-style layout. Each section is color-coded with matching icons for quick insight into key findings. Ideal for summarizing feedback, analytics, or market research. Fully editable in Canva, PowerPoint, or Google Slides—perfect for making data-driven presentations engaging and easy to follow.


5 diapositivas
Corporate Framework and Structure
Visualize governance, compliance, and assurance in a streamlined framework. This structured slide is ideal for outlining business functions, responsibilities, and reporting lines across departments. Fully editable in PowerPoint, Keynote, and Google Slides for seamless customization.


23 diapositivas
Orbit Marketing Strategy Plan Presentation
Elevate your marketing strategy presentations with this vibrant and dynamic template! Perfect for analyzing market trends, identifying target audiences, and outlining strategic objectives. Ideal for marketing professionals aiming to captivate their audience and drive results. Compatible with PowerPoint, Keynote, and Google Slides, this template ensures your strategy is clear, compelling, and effective.