


Características


¿Tienes alguna pregunta?
Recomendar


8 diapositivas
Yearly Calendar Planning Presentation
The "Yearly Calendar Planning" presentation template is designed to help visualize task progress over a 12-month period. Each row represents a specific task, labeled as Task 01 through Task 04, with each month represented by a square. The color coding—orange for "Done", gray for "In Progress", red for "Revision", and yellow for "Hold On"—provides a clear visual status of each task's progress. This template is ideal for project managers and team leads who need to track and report on the status of multiple tasks over the course of a year, ensuring a comprehensive view of project timelines and milestones.


10 diapositivas
Hierarchy Tree Structure Slide Presentation
Bring your ideas to life with a dynamic visual flow that connects every stage of your business strategy. Perfect for mapping growth, processes, or team structures, this clean and modern layout keeps your data clear and engaging. Fully compatible with PowerPoint, Keynote, and Google Slides for effortless customization.


26 diapositivas
Linear Technology Presentation
Cyberspace is the realm of digital information that can be accessed, shared, and stored using electronic devices. Focus on the future of technology with this template! This presentation's linear design will put your ideas front-and-center. This design is high-tech the theme colors and icons are sure to make an inspiring first impression on your audience. This can be used for business presentations, academic projects and conferences. This template consists of 26 slides that will bring your ideas to the next level by putting emphasis on key points and keeping your ideas concise and organized.


4 diapositivas
Social Media Content Strategy Presentation
Engage your audience with this Social Media Content Strategy Presentation. Featuring side-by-side thumbs-up icons, this template visually contrasts two key focus areas—ideal for comparing campaign goals, content pillars, or platform strategies. Each section includes editable text blocks to outline insights clearly. Fully customizable and compatible with PowerPoint, Keynote, and Google Slides.
22 diapositivas
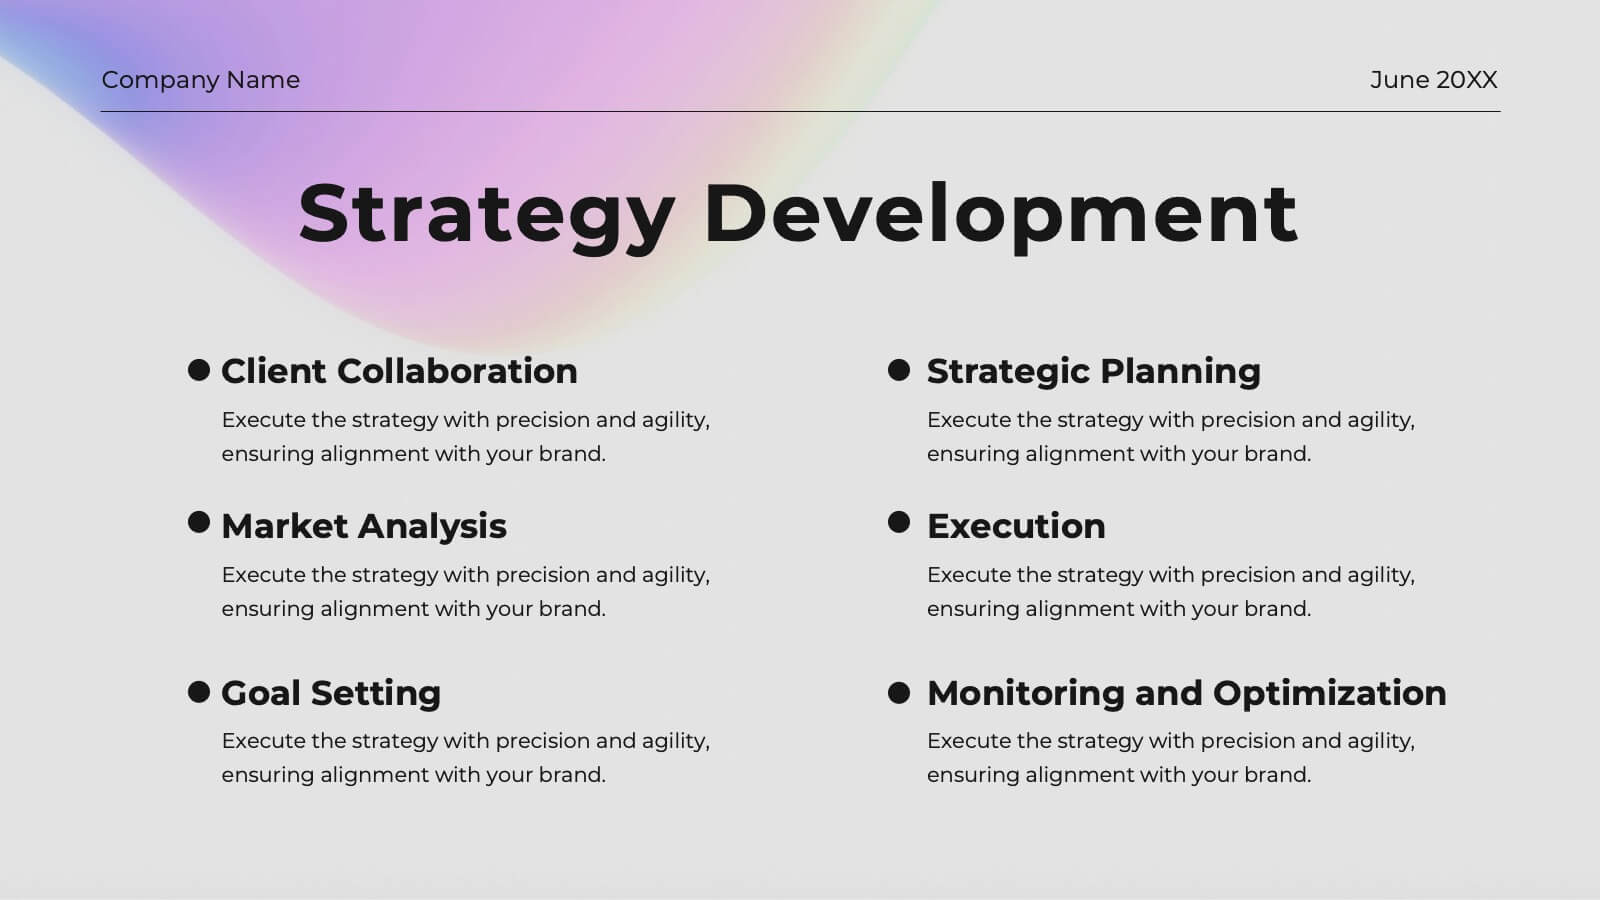
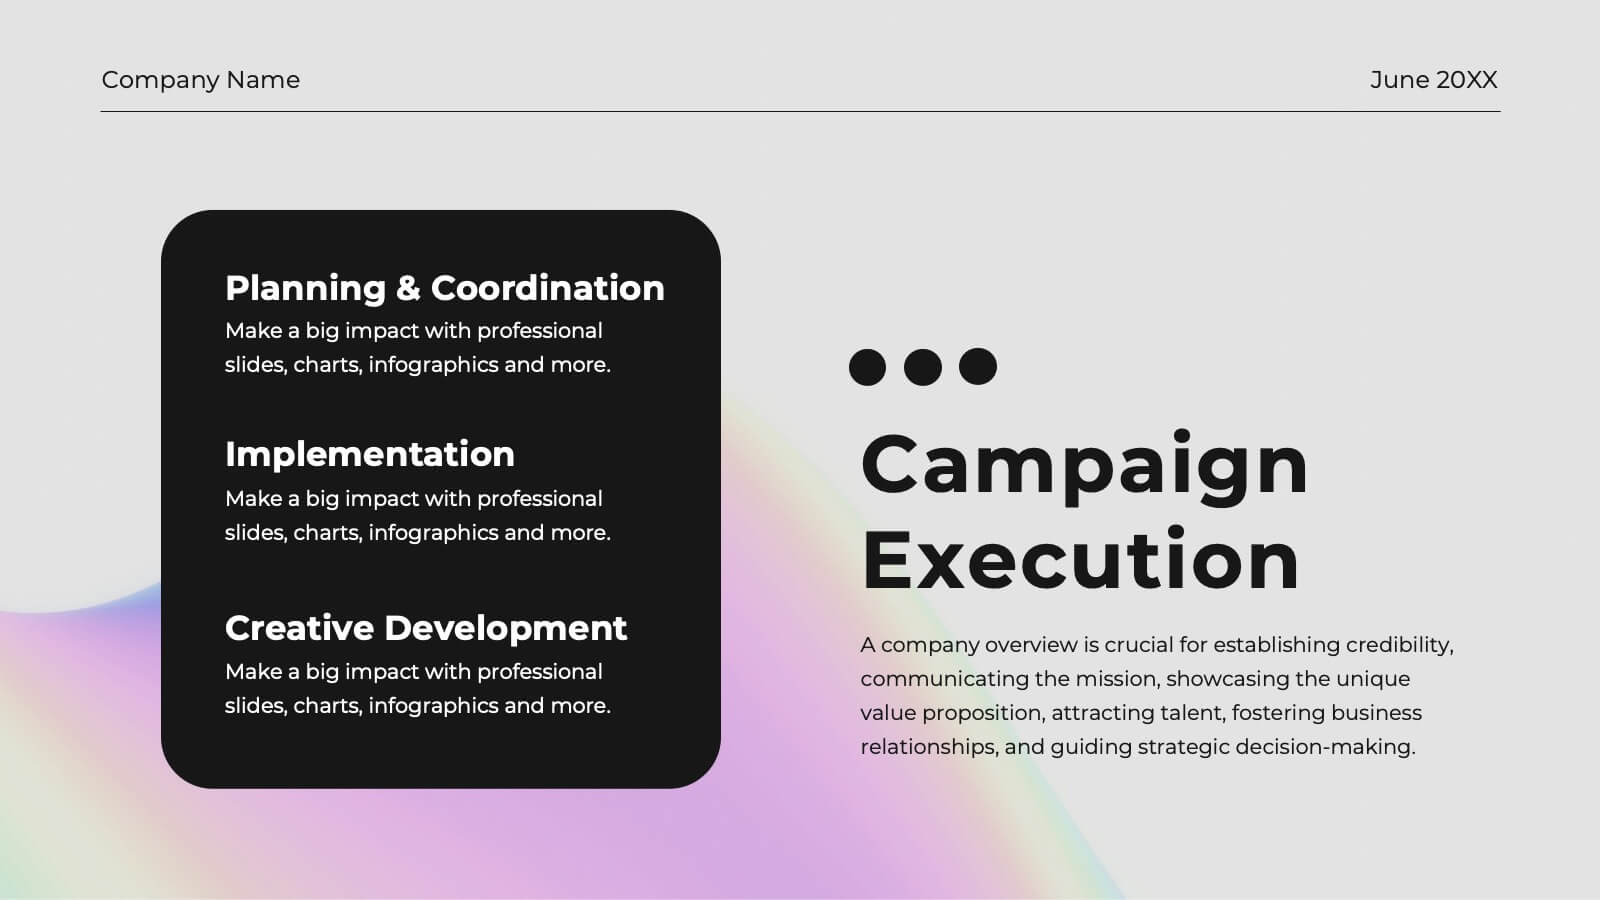
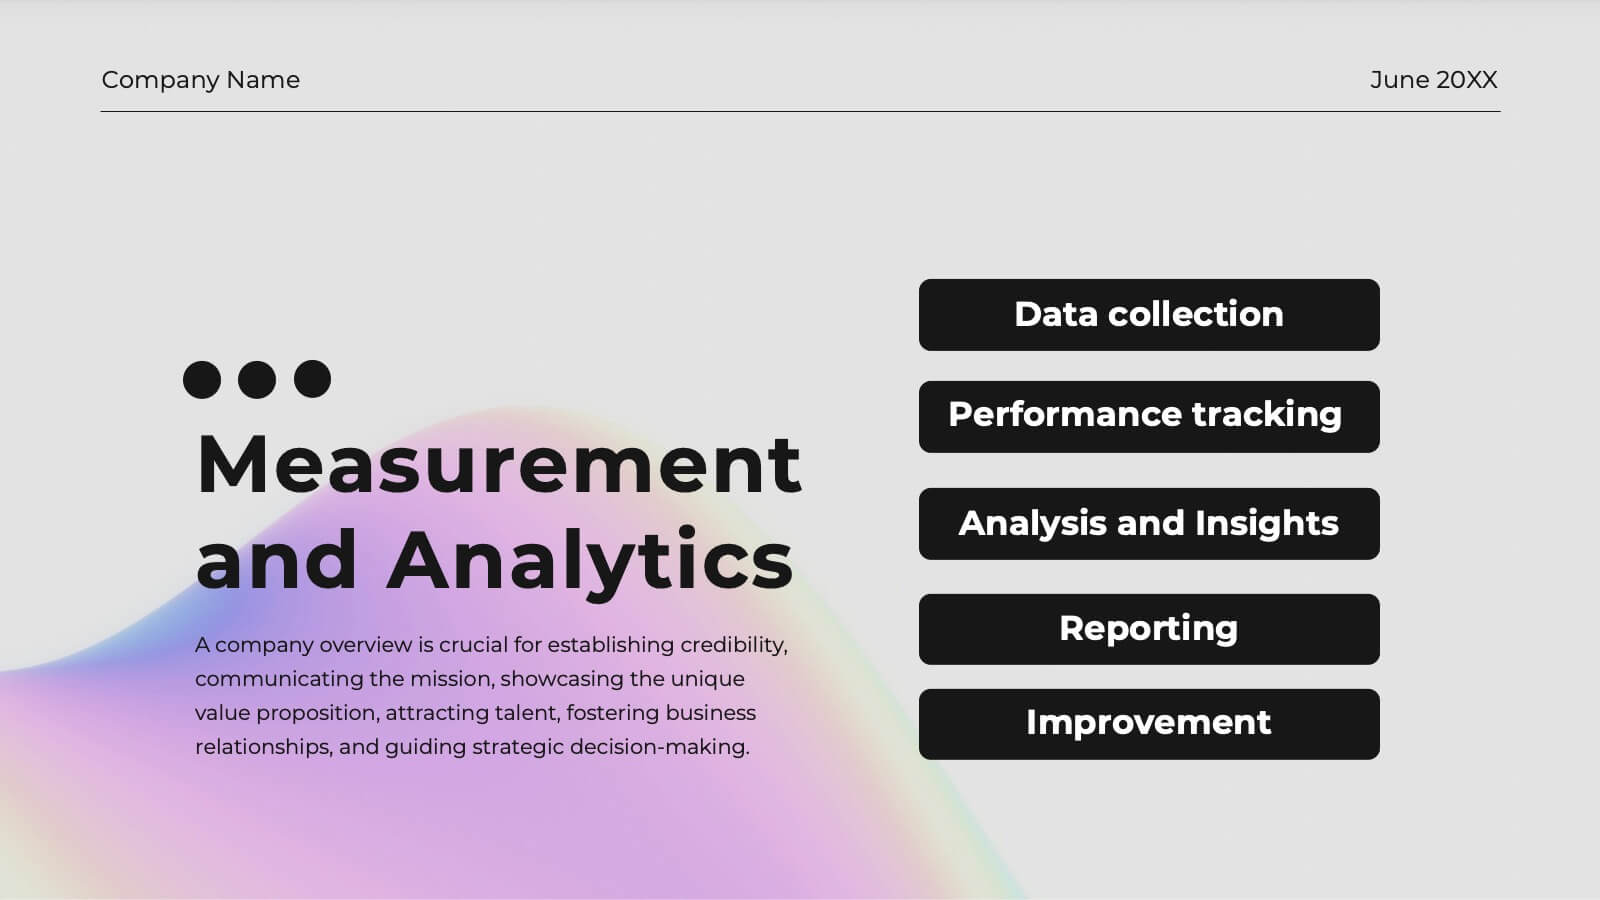
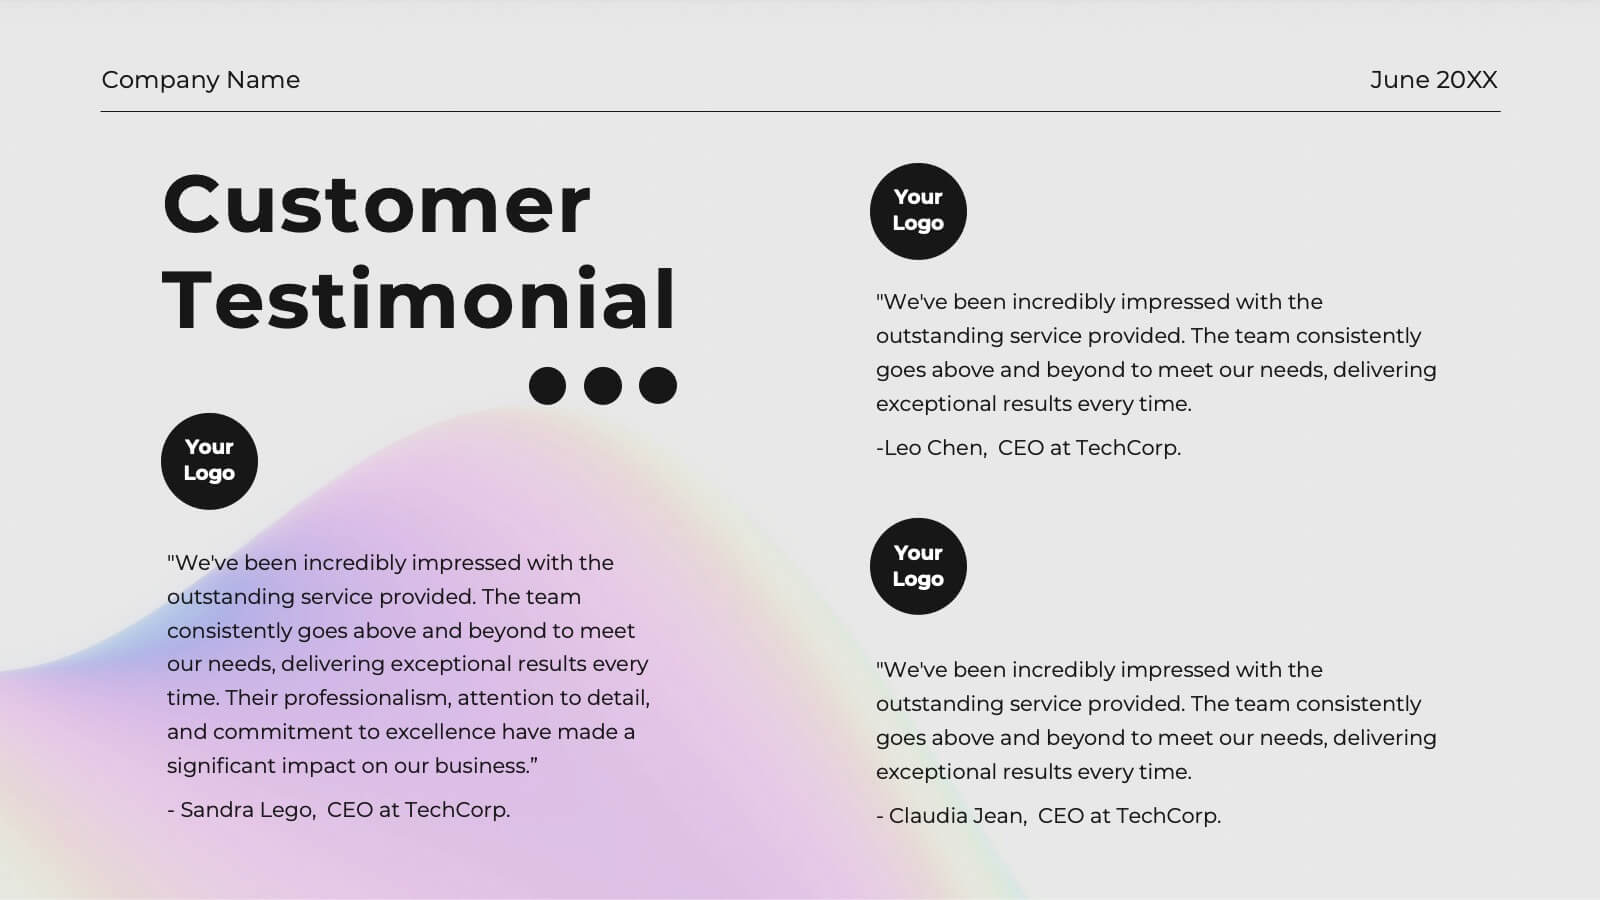
Frost Advertising Agency Proposal Presentation
Dazzle your clients with this radiant agency proposal template! Perfect for presenting your mission, services, and market analysis, it includes slides for case studies, strategy development, and campaign execution. Impress stakeholders with vibrant visuals and detailed content. Compatible with PowerPoint, Keynote, and Google Slides for seamless presentations on any platform.


5 diapositivas
Chemistry Lessons Infographics
Dive into the fascinating world of chemistry with our chemistry lessons infographics. Set against a backdrop of bold orange, black, and blue, this template captures the vibrant essence of chemical reactions and laboratory experiments. Tailored for educators, students, and science enthusiasts, this collection is perfect for enhancing lesson plans, study materials, or research presentations. Compatible with Powerpoint, Keynote, and Google Slides. With its creative, lab-themed design, each infographic is enriched with striking graphics and icons, providing a visual feast that simplifies complex concepts and promotes the joy of learning chemistry.


4 diapositivas
Root Cause Problem Solving Presentation
Uncover insights with a clear, visual approach that makes complex issues easy to understand and communicate. This presentation guides audiences through identifying underlying problems, mapping causes, and highlighting solutions in a structured, memorable way. Clean icons and tree-based visuals keep your message engaging. Fully compatible with PowerPoint, Keynote, and Google Slides.


4 diapositivas
Creative Brush Stroke Theme Design Presentation
Bring a bold, artistic flair to your presentation with this Creative Brush Stroke Theme Design. Featuring layered paint-like strokes in vibrant tones, this layout blends creativity with clarity—perfect for design pitches, brainstorming sessions, or visual storytelling. Fully customizable in PowerPoint, Google Slides, and Canva for seamless editing.


23 diapositivas
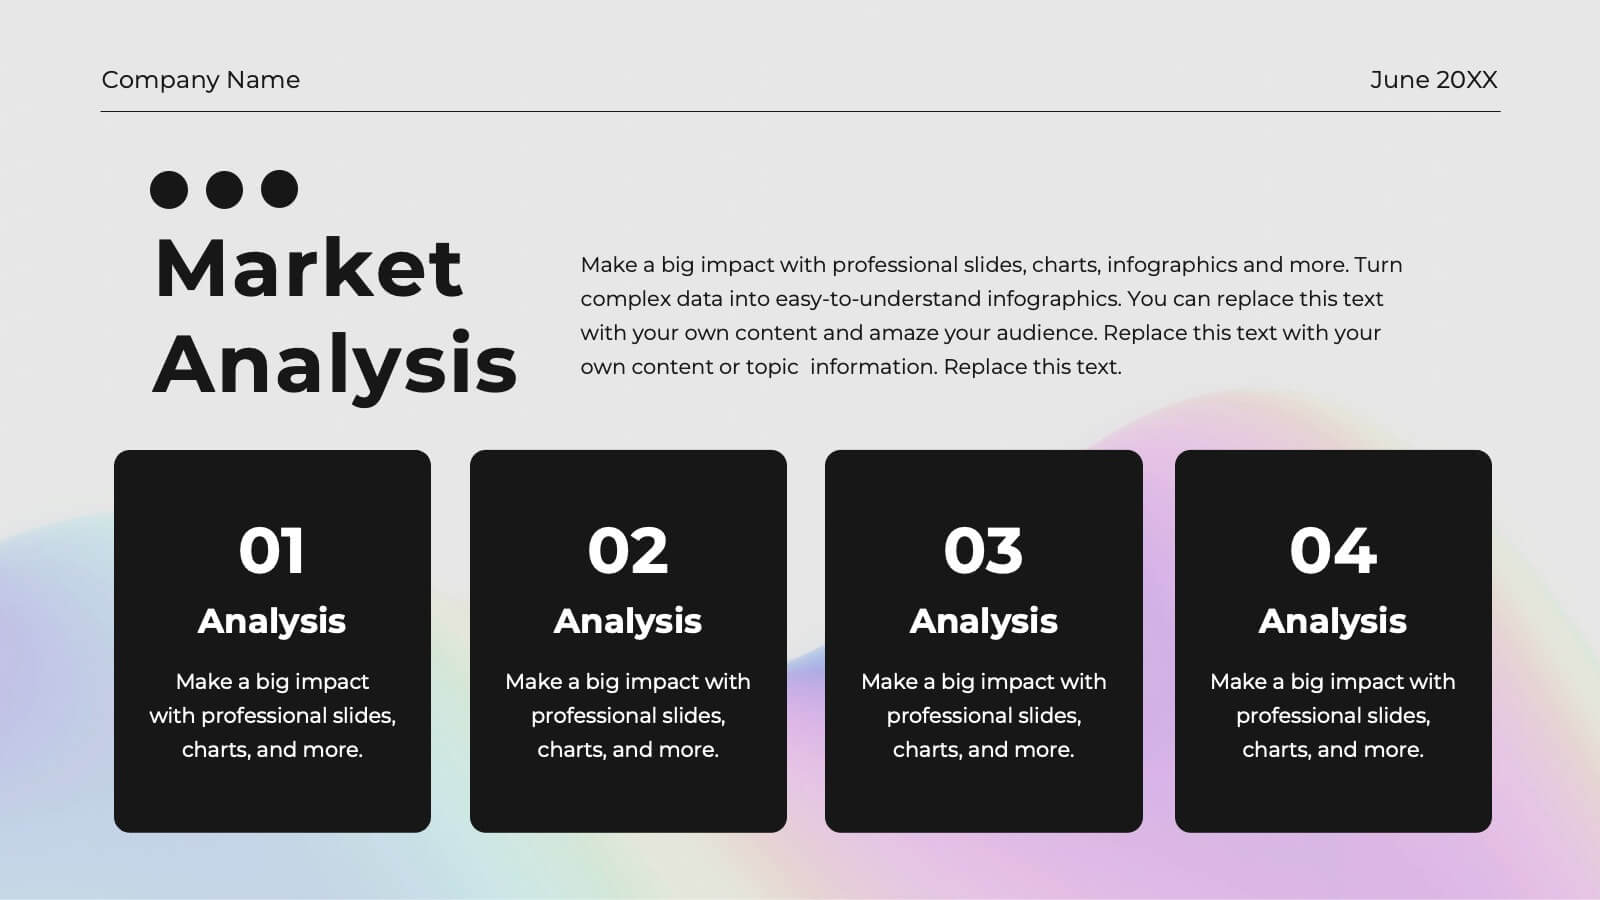
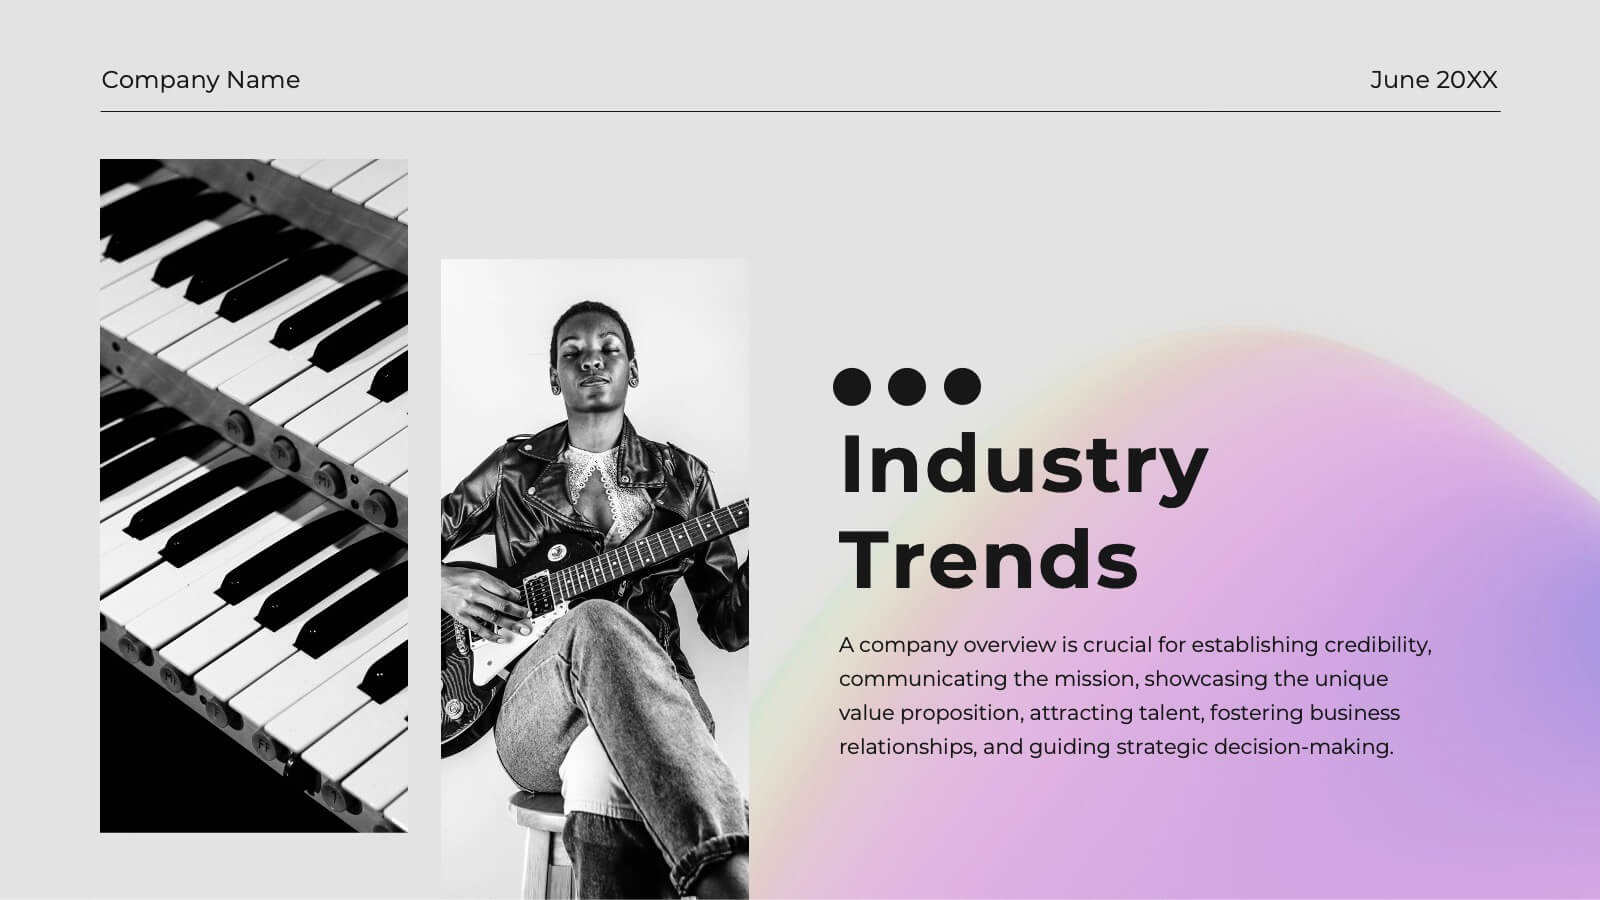
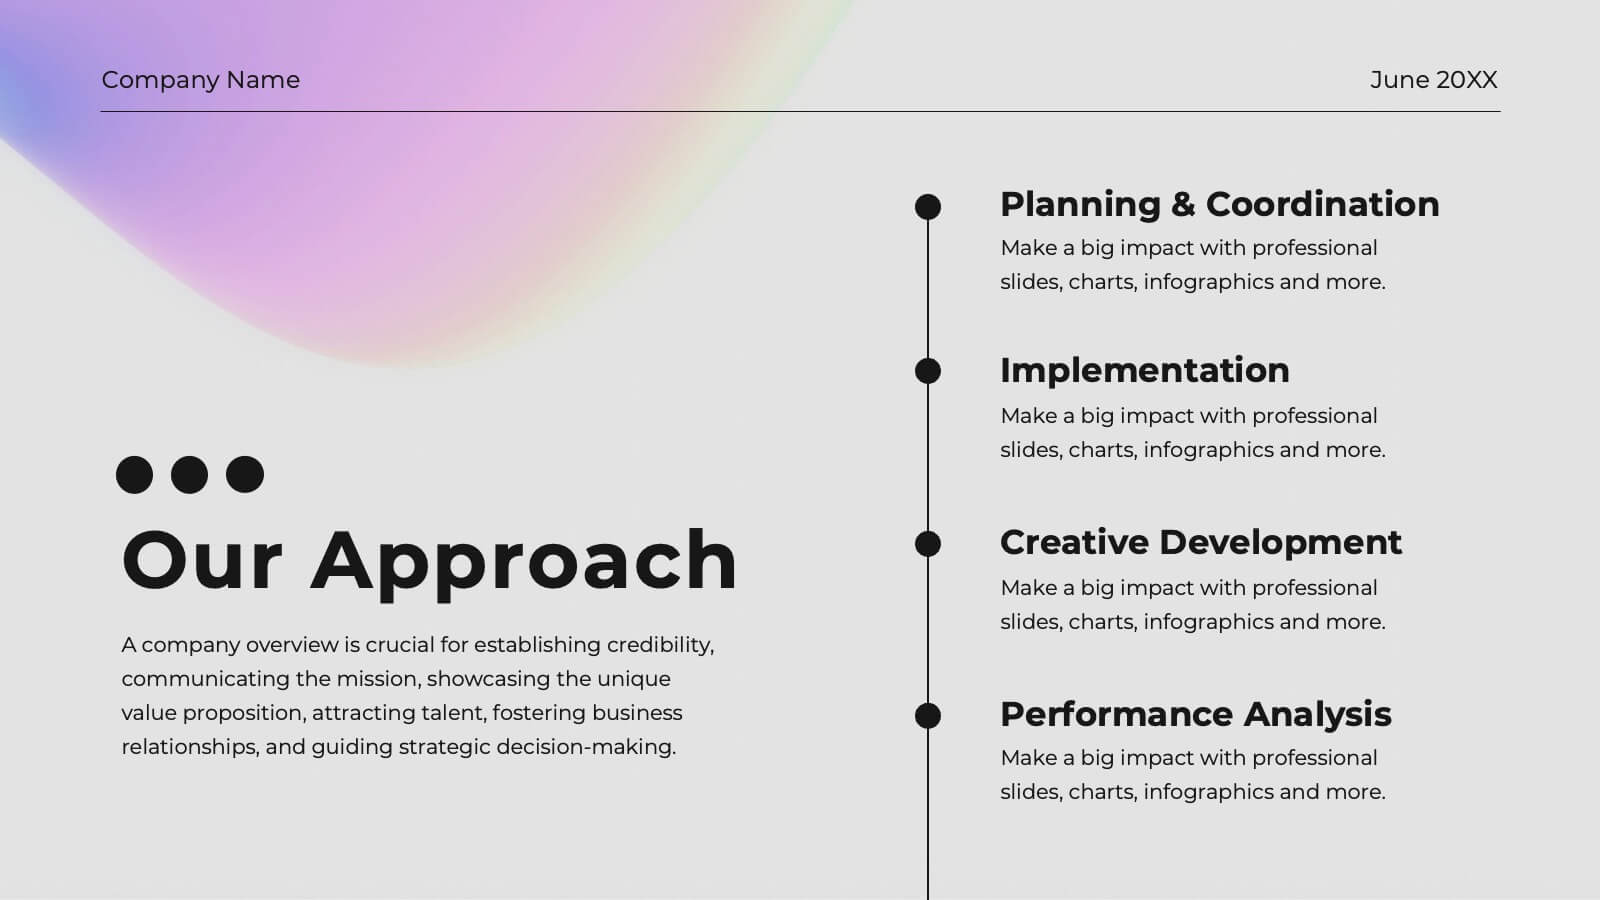
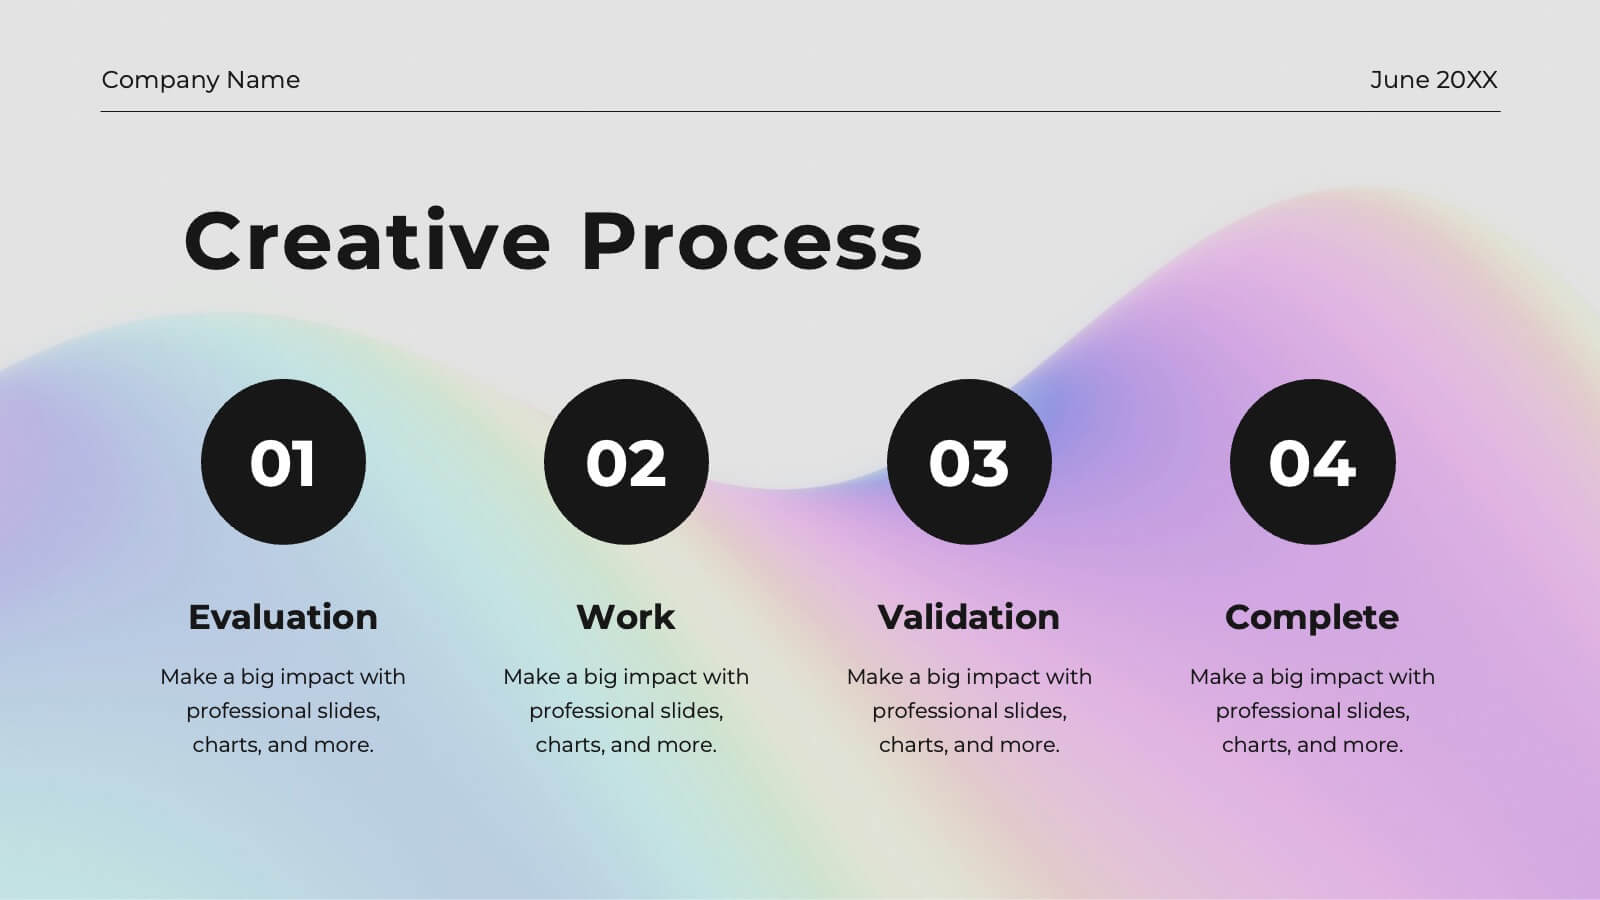
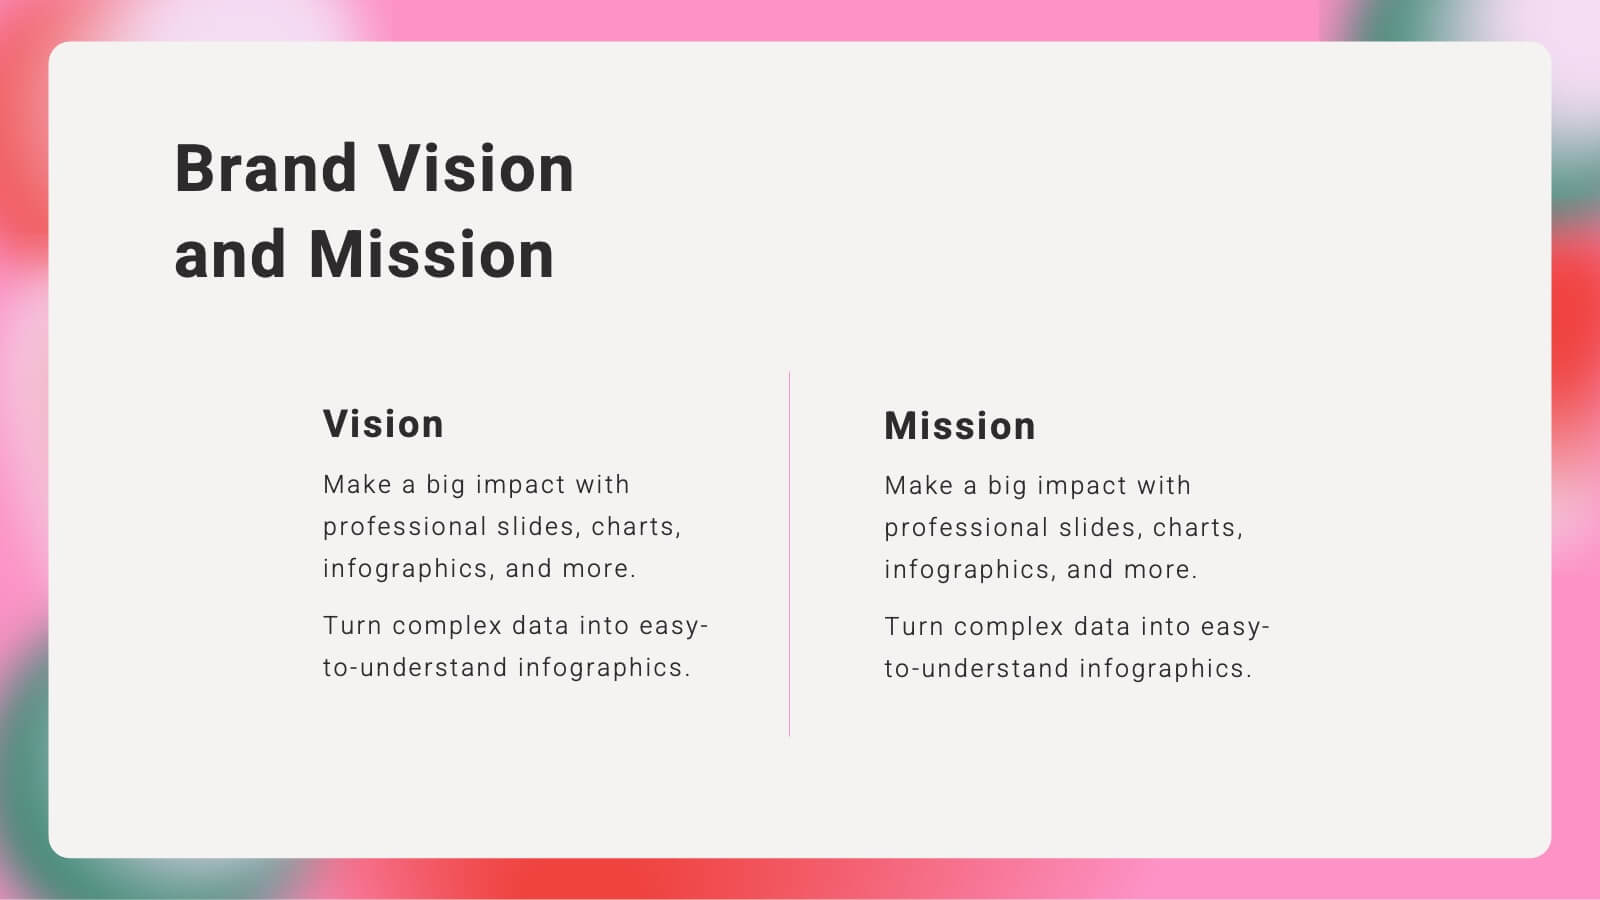
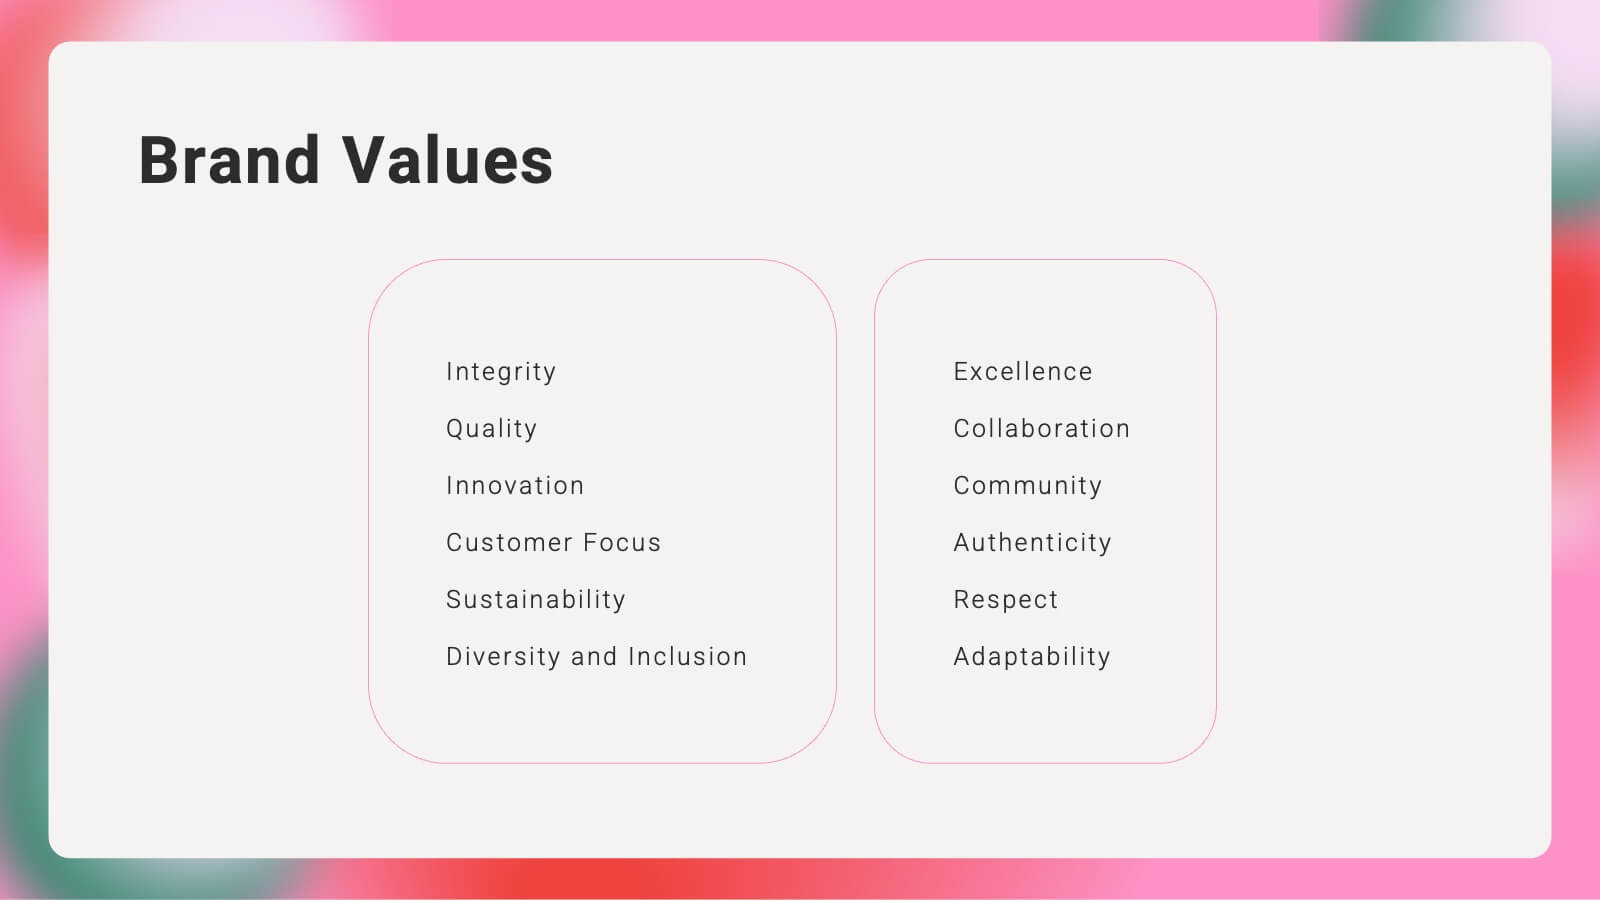
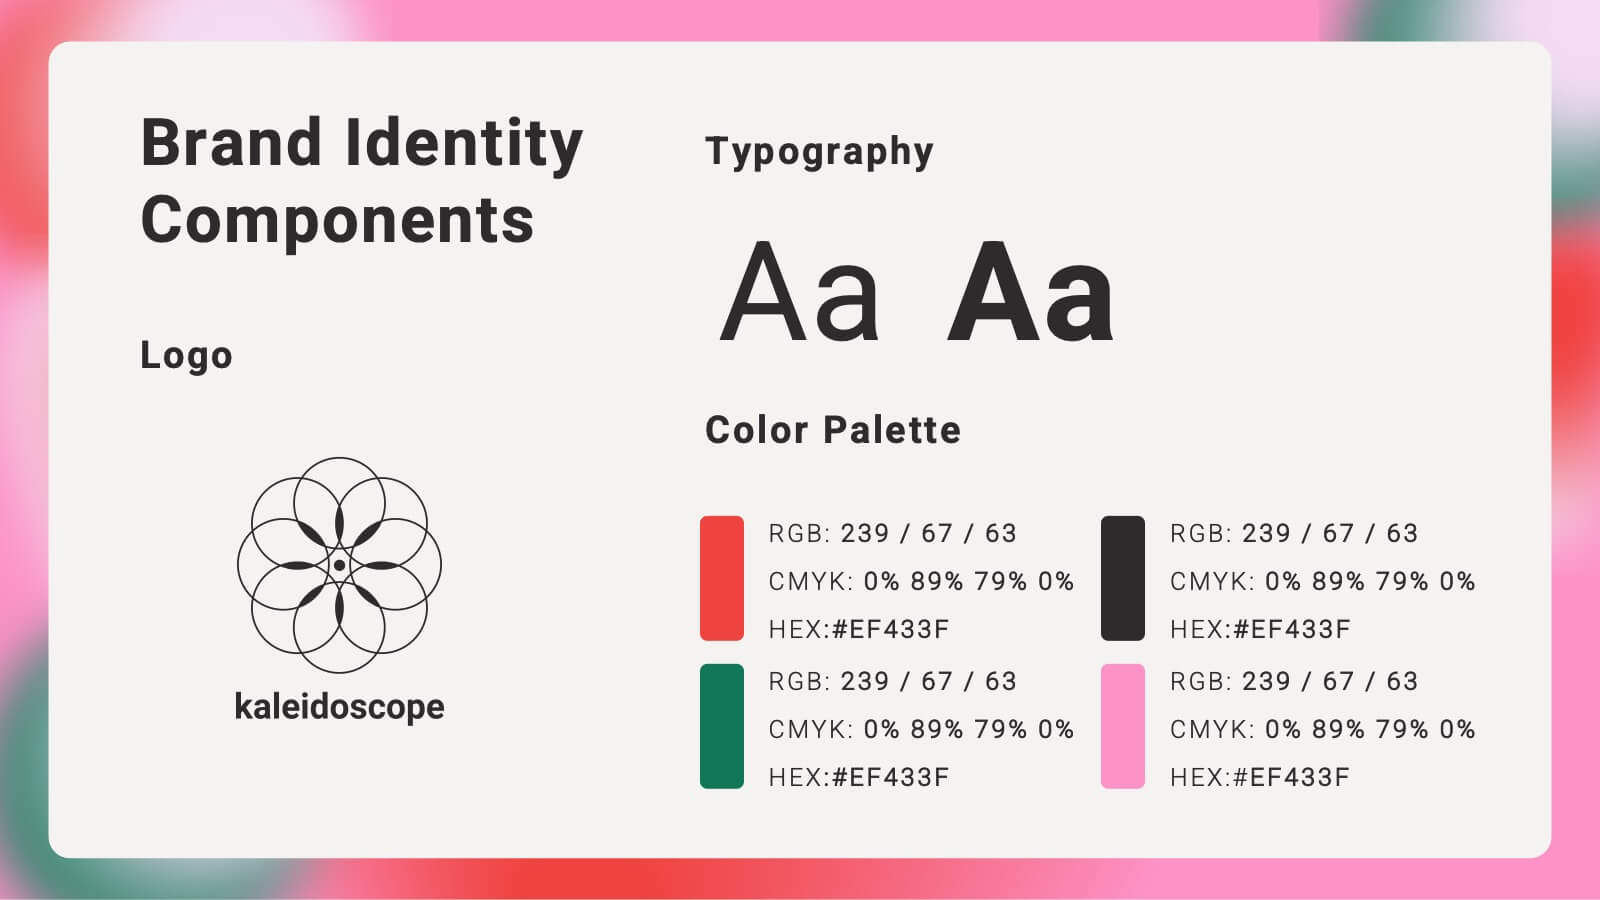
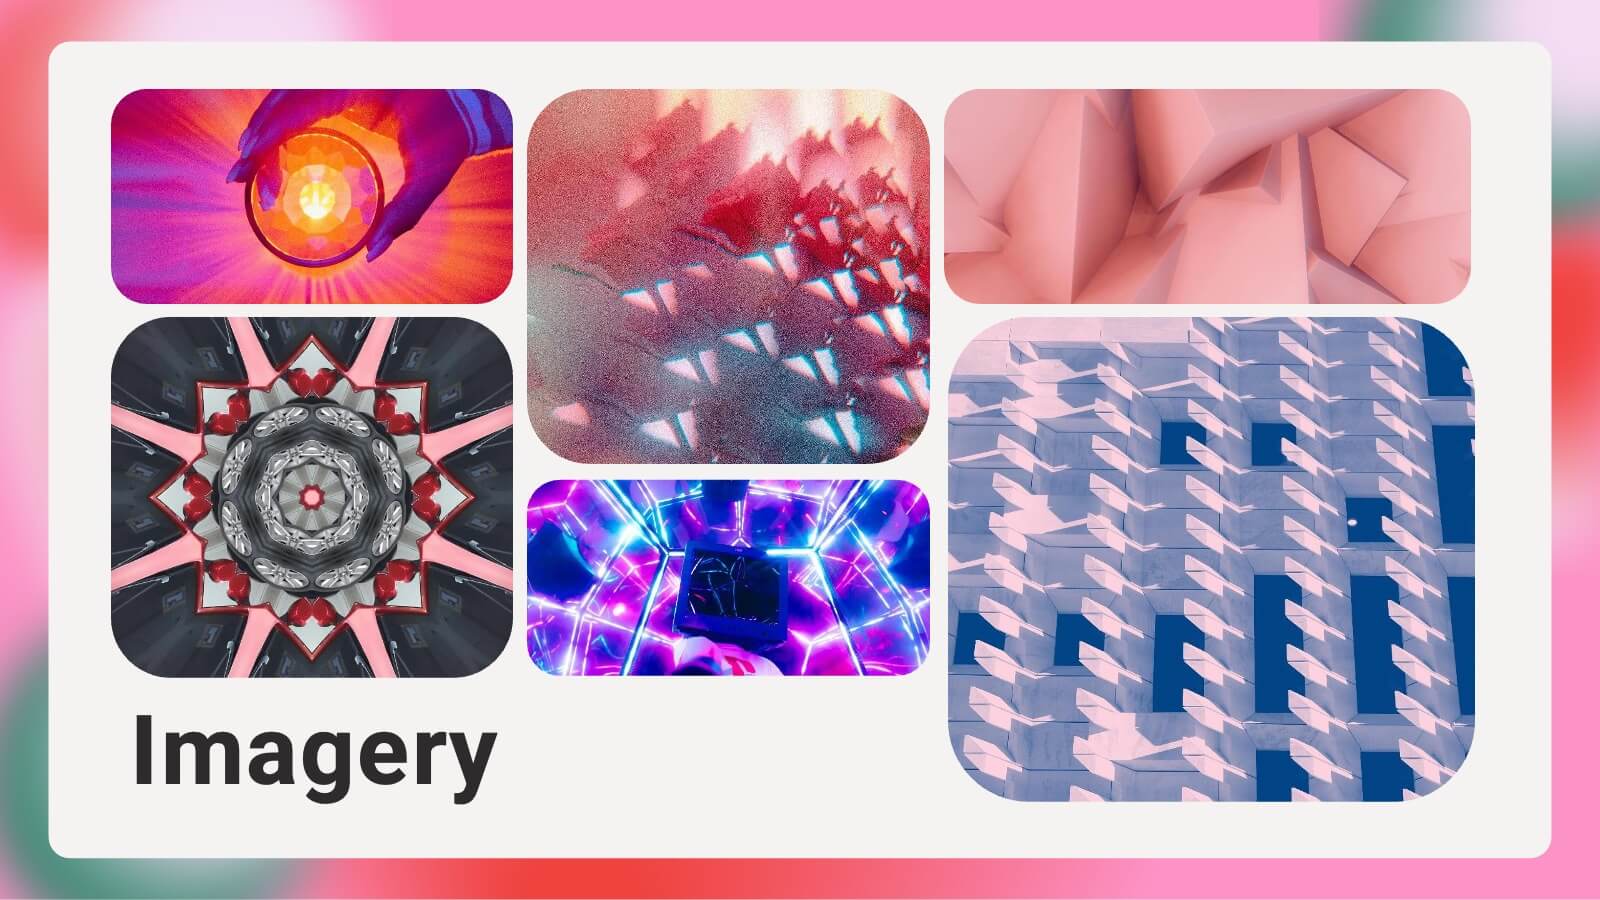
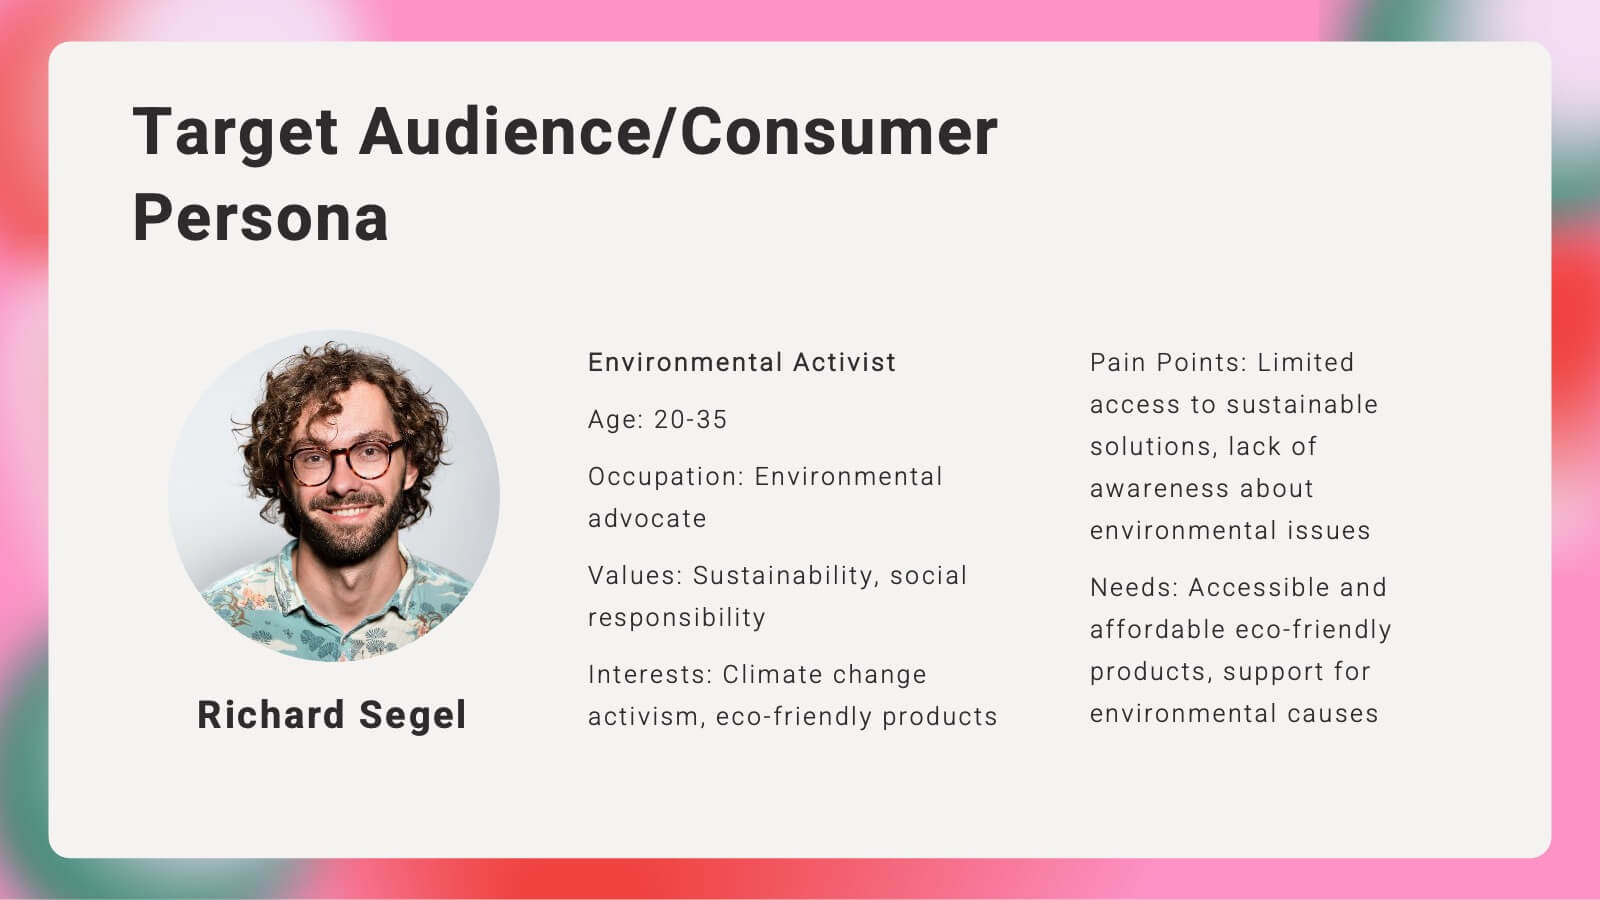
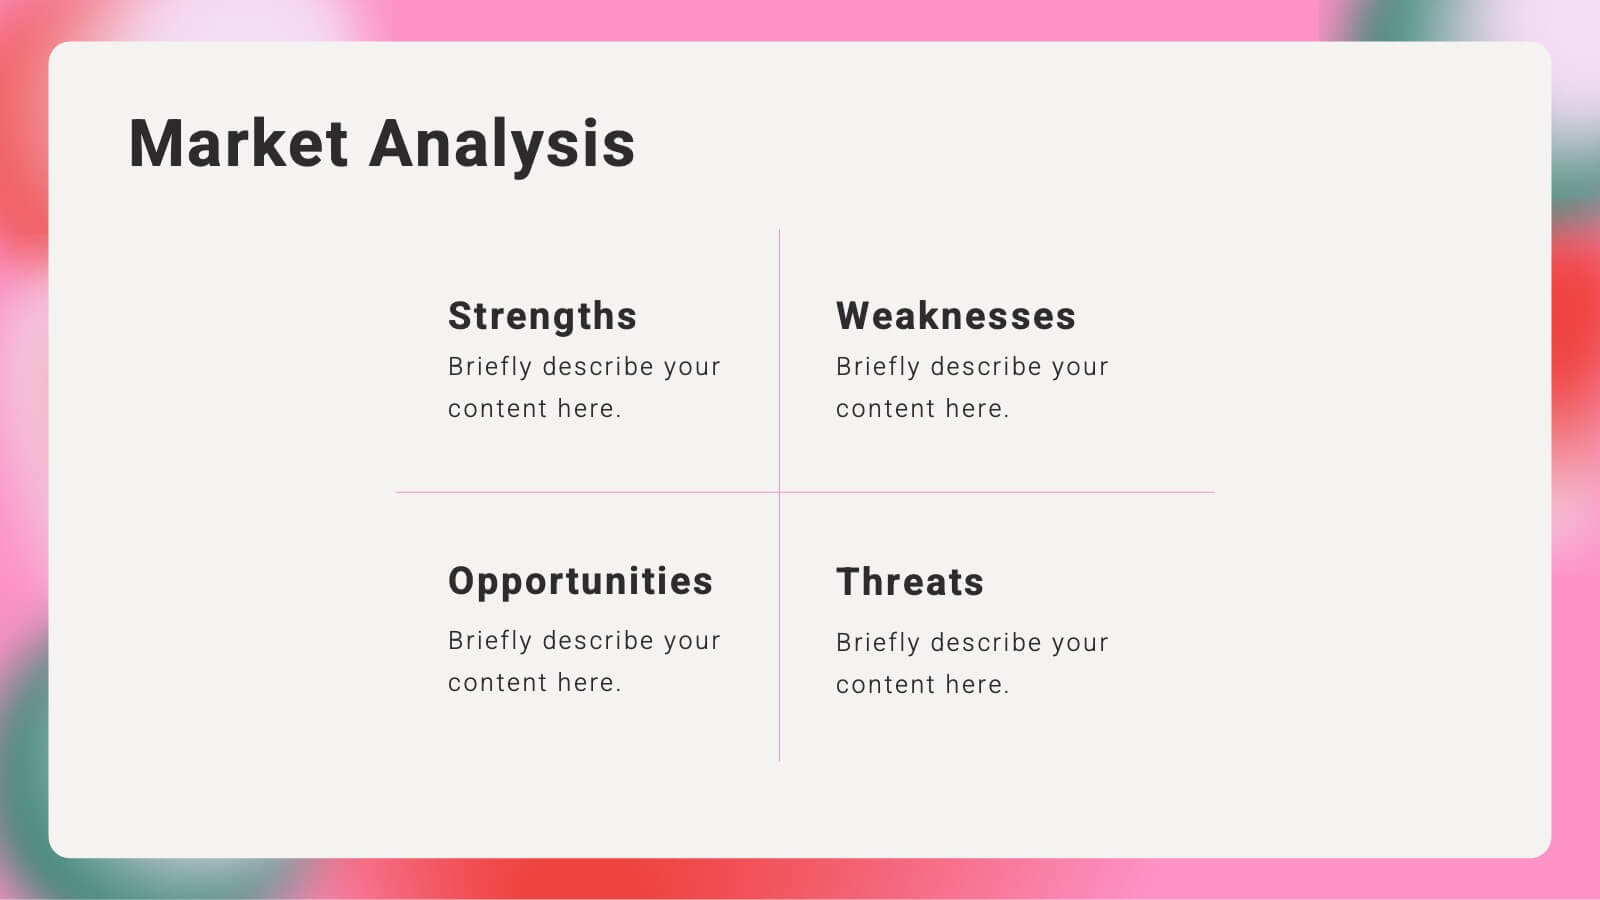
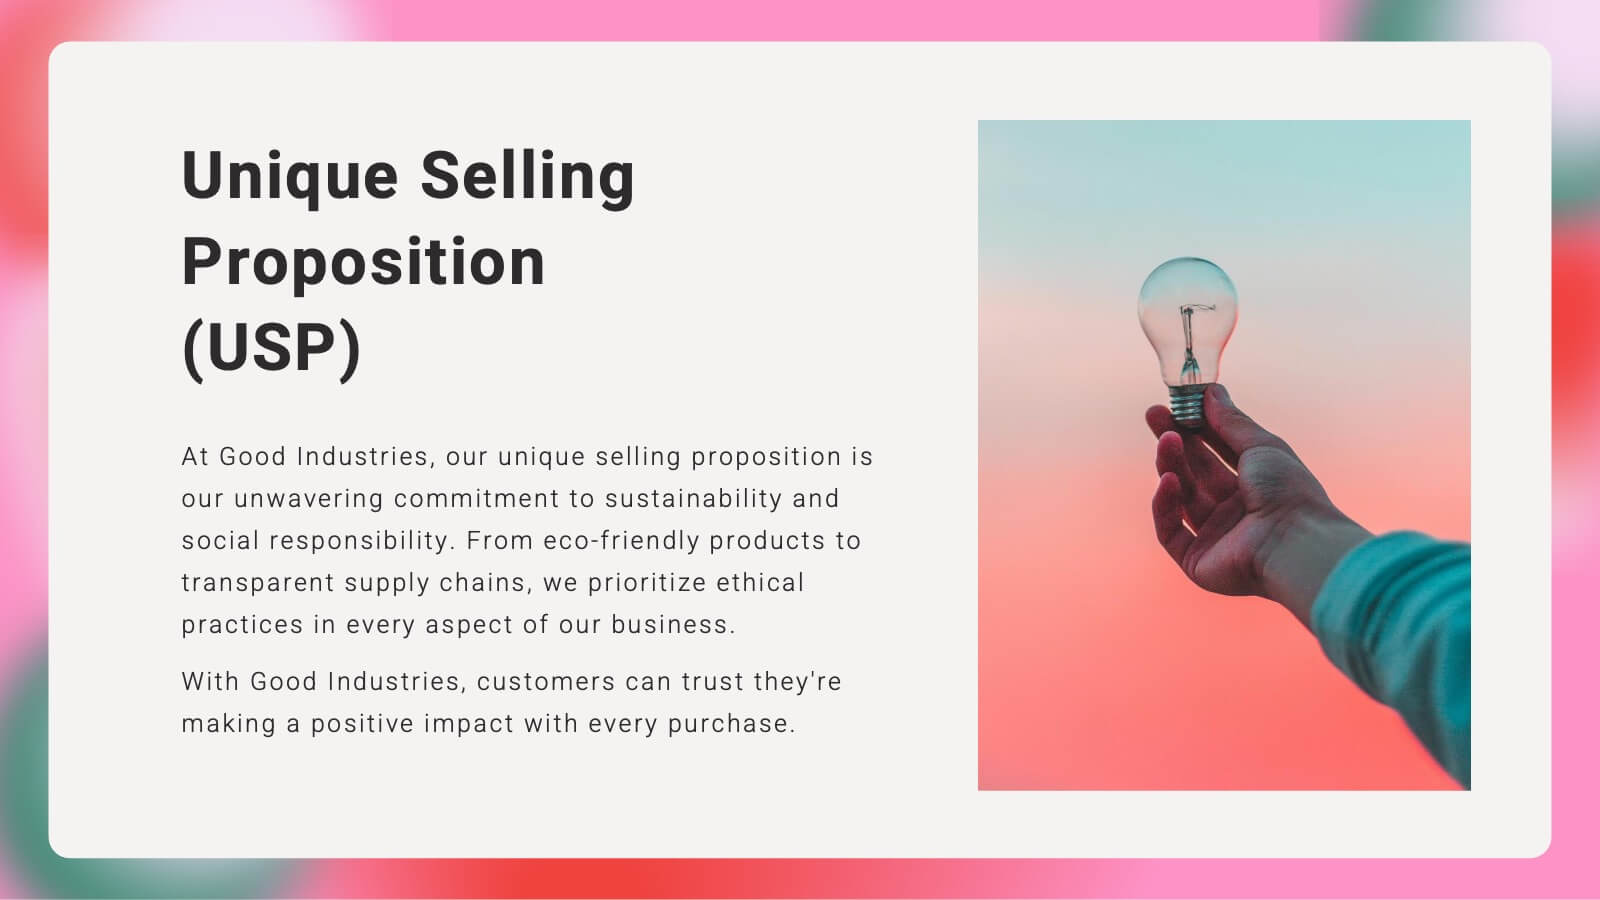
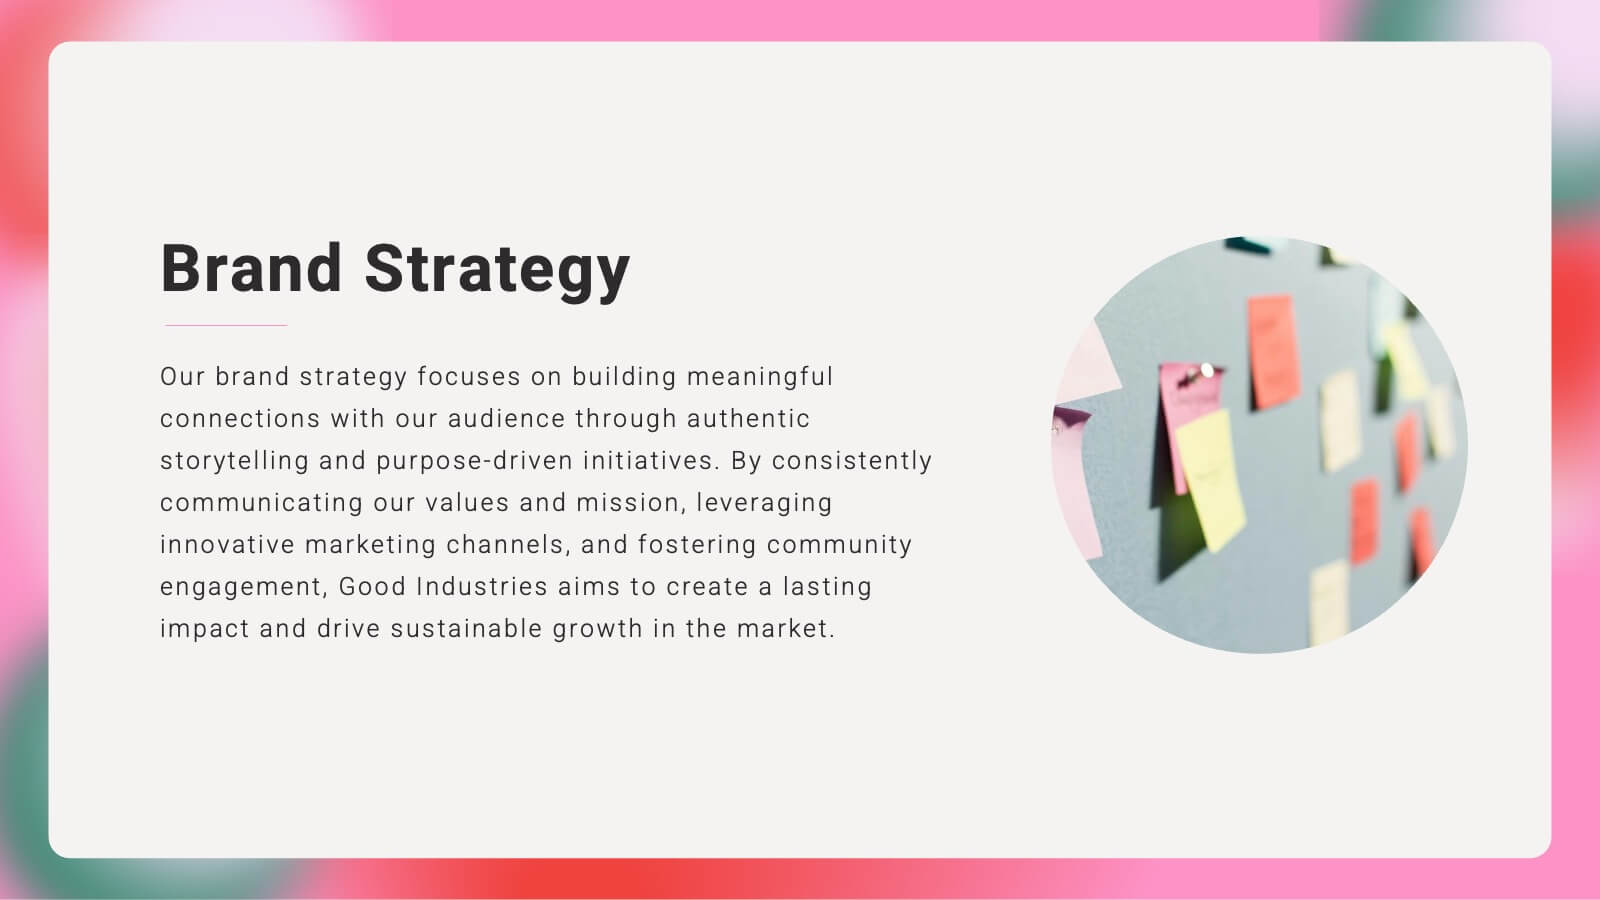
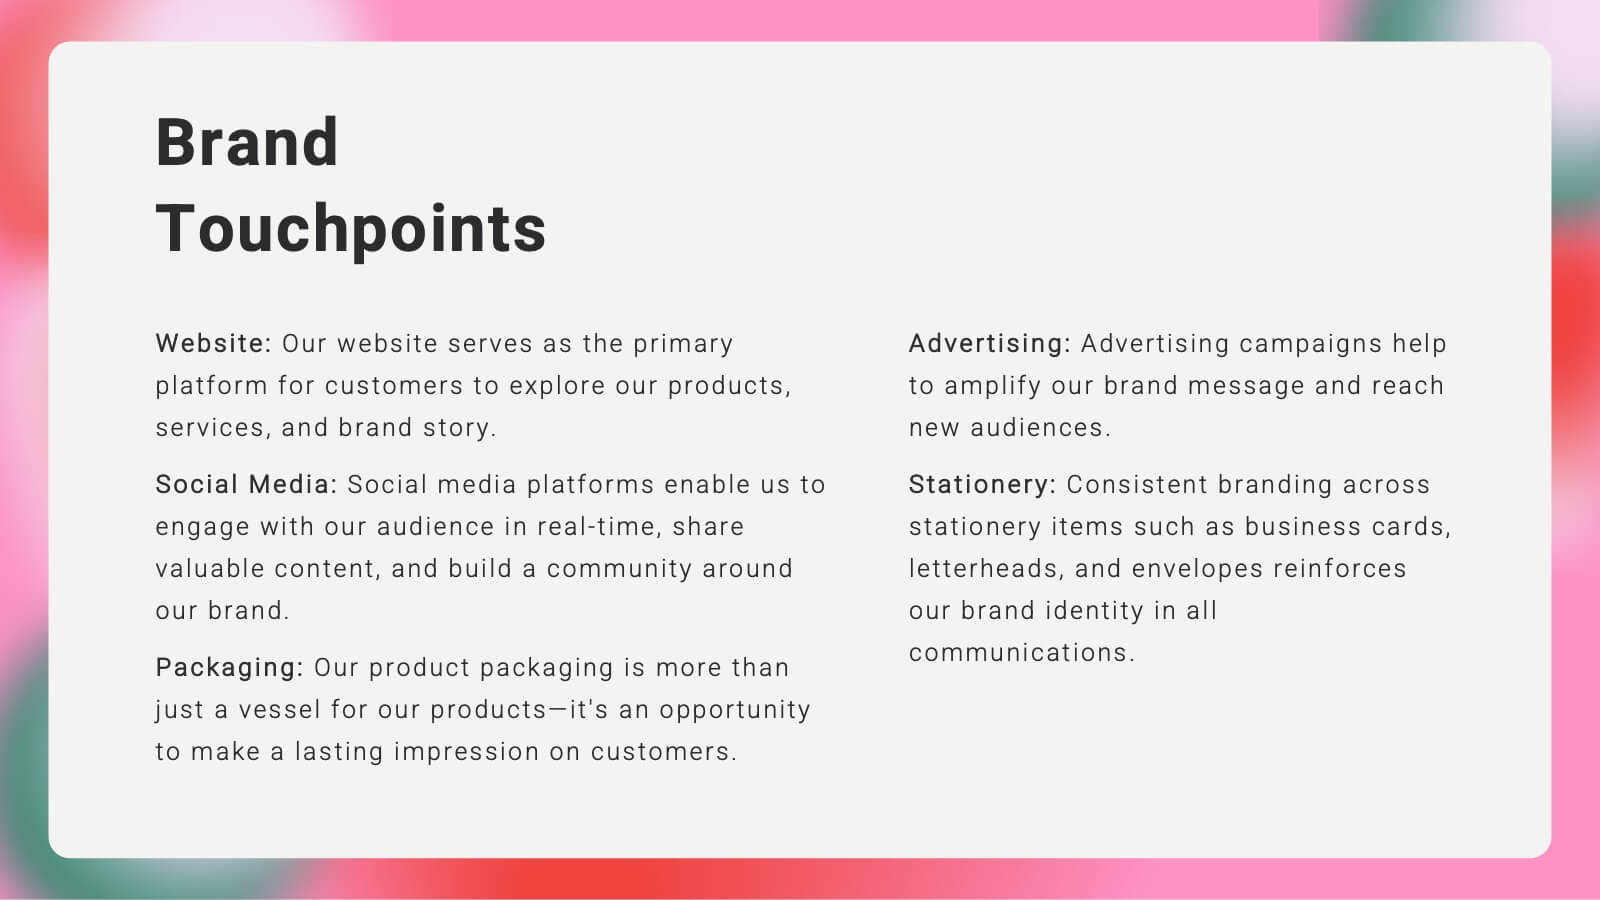
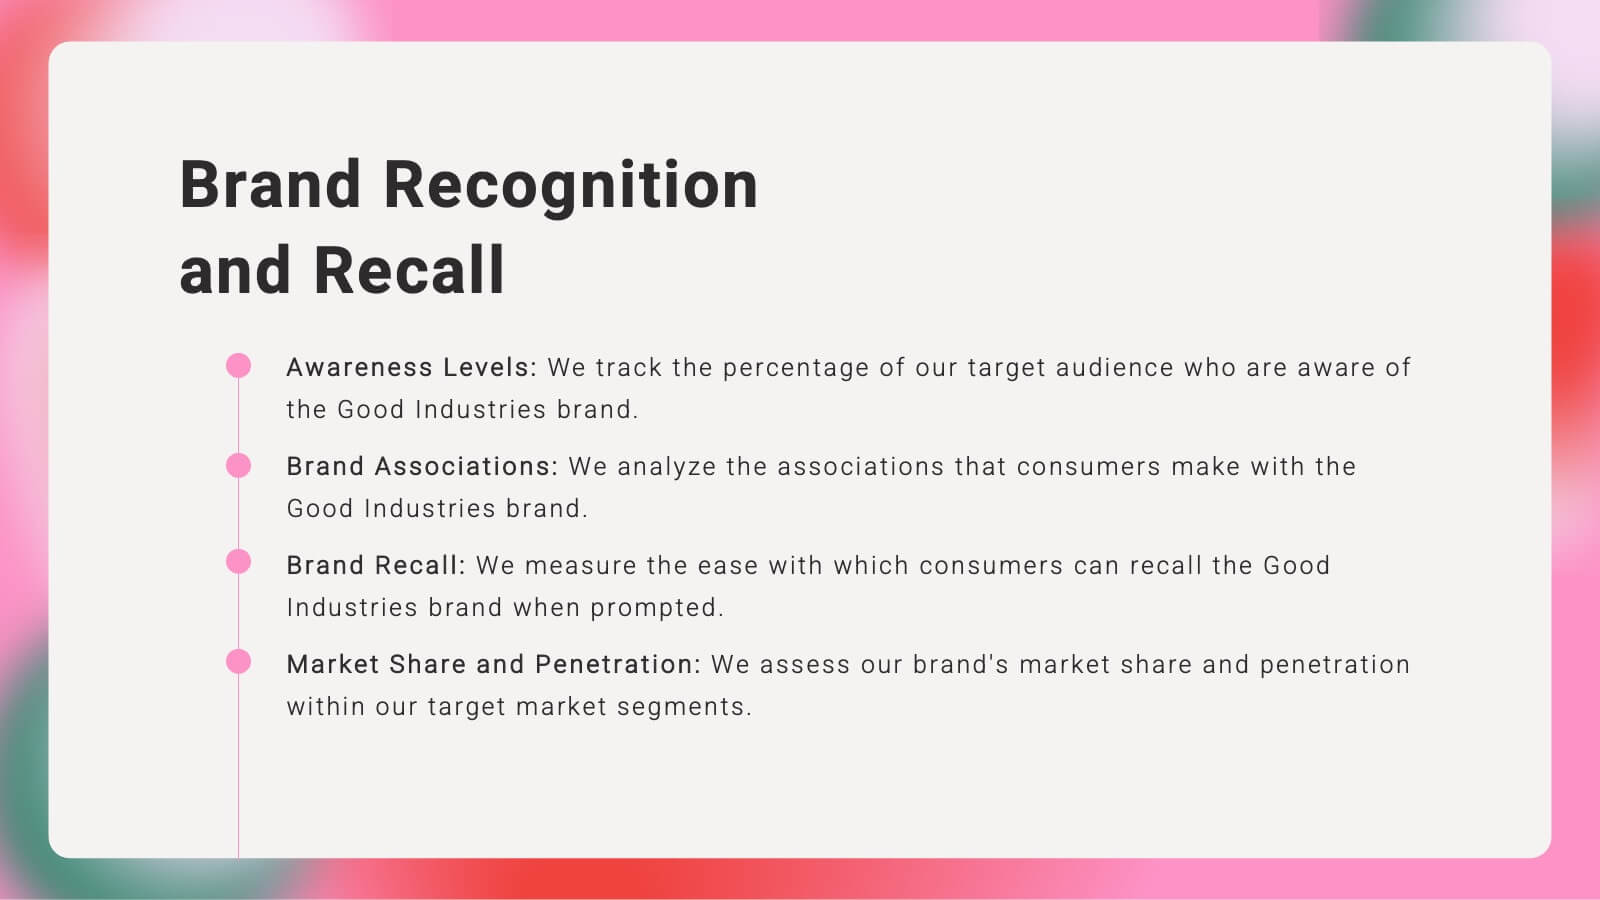
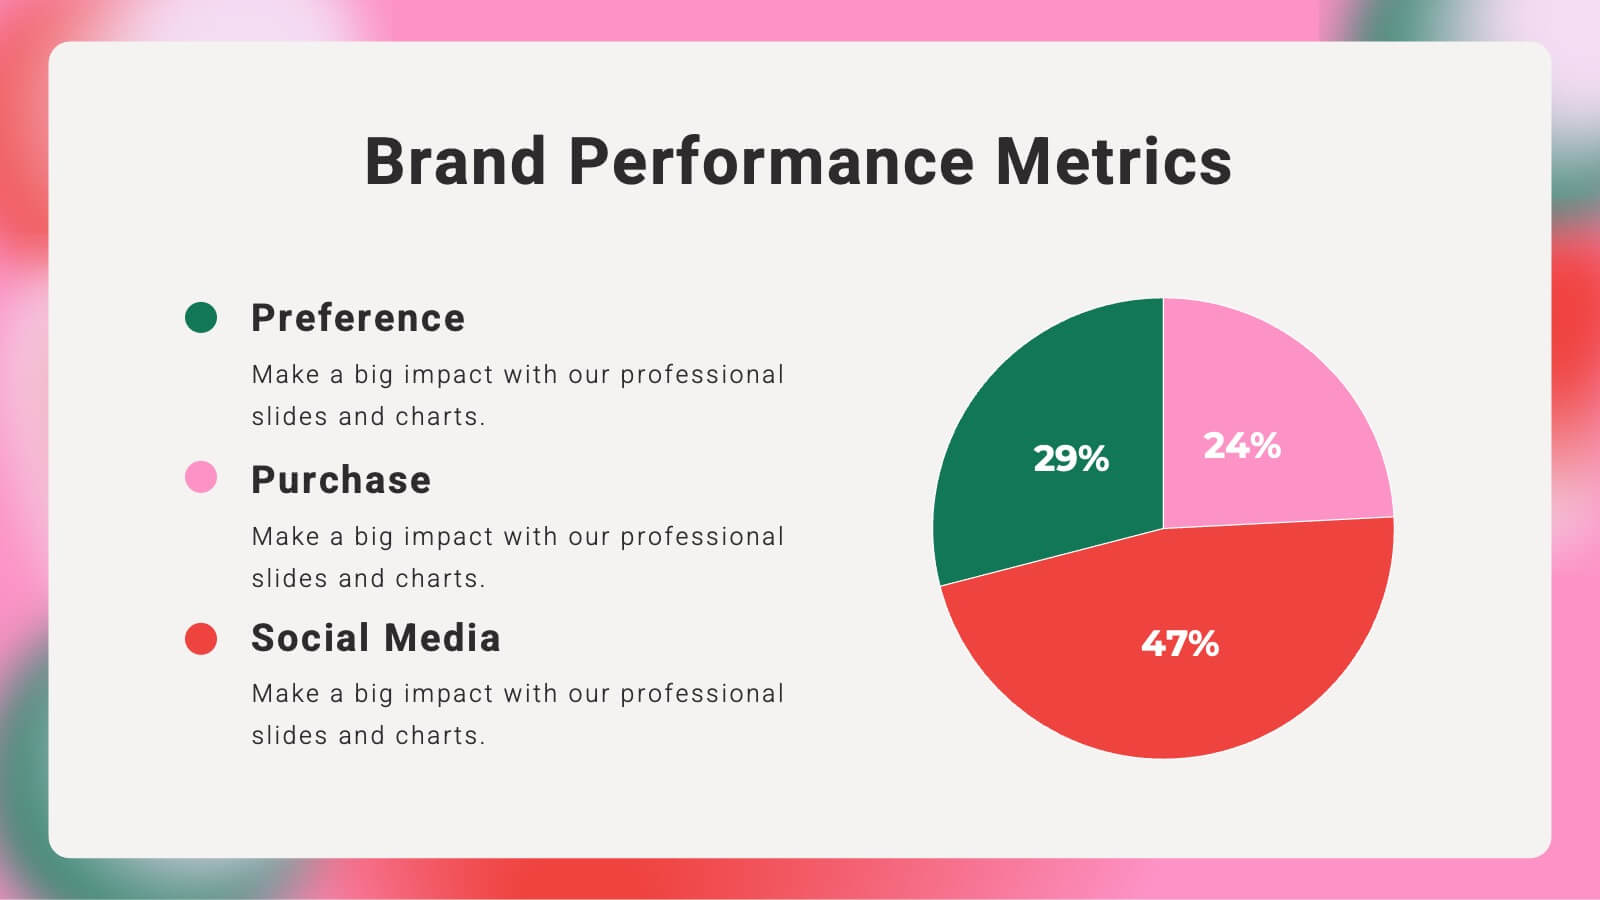
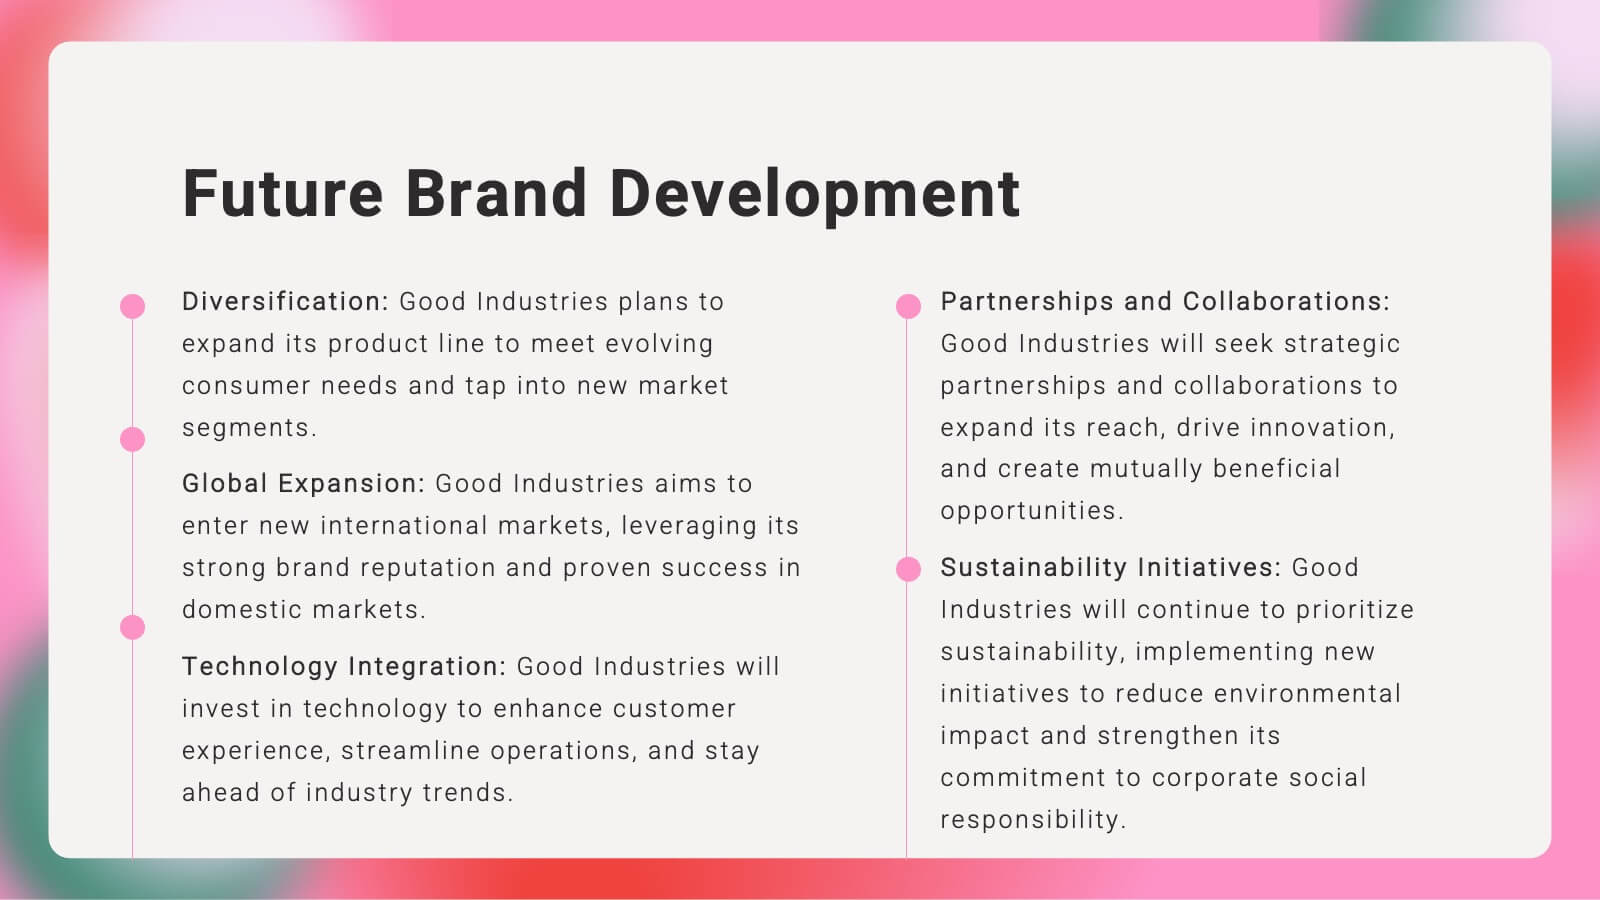
Kaleidoscope Brand Strategy Report Presentation
Craft a compelling narrative for your brand with this vibrant brand strategy presentation template. Designed to cover every facet of brand development, from vision and mission to market analysis and consumer personas, this template is an essential tool for businesses looking to establish a strong brand identity. It incorporates visually engaging slides that outline brand voice, values, and touchpoints, facilitating a thorough understanding of strategic branding. Compatible with platforms like PowerPoint, Google Slides, and Keynote, it is accessible across various devices, making it perfect for collaborative planning and presentations.


7 diapositivas
Core Business Values Slide Presentation
Show what your company stands for with a bold, structured layout that highlights the principles driving your success. This presentation is ideal for communicating organizational values, culture, and goals in a professional, visually balanced way. Fully editable and compatible with PowerPoint, Keynote, and Google Slides for easy customization.


5 diapositivas
Coffee Brewing Methods Infographics
Coffee brewing methods refer to the various techniques and processes used to extract flavor and aroma from coffee beans. These infographic templates are a visually appealing and informative presentation tool designed to showcase various methods of brewing coffee. Whether you're a coffee enthusiast, a barista, or someone interested in learning more about coffee preparation, this template provides an engaging way to explore different brewing techniques and their unique characteristics. These allows you to showcase and educate others about various coffee brewing techniques. Fully customizable and compatible with Powerpoint, Keynote, and Google Notes.


7 diapositivas
Brain Planning Infographic Presentation
Looking for a modern and personable brain Infographic? This template is the perfect choice! It contains all the elements you need to make a successful and engaging infographic. This template is perfect for brainstorming, business marketing, academic projects and personal infographics. You can use this template to help you plan, refine and present a successful pitch. From project to execution and profit this brain infographic breaks down the process into smaller, more manageable steps. Impress your audience with your facts and figures using this unique, colorful infographic!


7 diapositivas
Asia Map Economy Infographic
Delve into the economic landscape of Asia with our series of infographic slides designed to outline key economic indicators across the continent. These templates provide a comprehensive visual representation of various economic data, including GDP growth, trade volumes, and sector-specific performance, making them invaluable for analysts, educators, and business professionals. Each infographic features a detailed map of Asia, annotated with data points and statistics that highlight economic trends and disparities between nations. The use of contrasting colors and clear, legible fonts ensures that the information is accessible and engaging. Graphs and charts are integrated within the map, offering a dynamic overview of the economic health of the region. These templates are fully customizable, allowing you to tailor the content to specific presentations or reports. Whether used in academic environments, corporate settings, or public presentations, these slides help to communicate complex economic concepts in a visually appealing and straightforward manner.


4 diapositivas
3-Tier Hierarchical Pyramid Breakdown
Simplify your strategy presentation with the 3-Tier Hierarchical Pyramid Breakdown Presentation. This clear and modern slide features a three-level pyramid with horizontal progress bars and percentage indicators—perfect for visualizing goals, KPIs, or organizational layers. Each tier includes editable text boxes for quick customization. Works seamlessly in PowerPoint, Keynote, and Google Slides.


20 diapositivas
Moonfern Product Launch Presentation
Introduce your product to the market with confidence using this expertly designed presentation template. Featuring a sleek and modern layout, it covers essential sections such as product overview, target market, and unique selling proposition. Dive into product features, pricing strategy, and competitive analysis to effectively communicate value and strategy. The template also includes slides for marketing plans, distribution channels, and use cases, ensuring a comprehensive approach to your launch. Perfect for PowerPoint, Google Slides, and Keynote, it allows for easy customization, ensuring your presentation aligns seamlessly with your branding and goals.


21 diapositivas
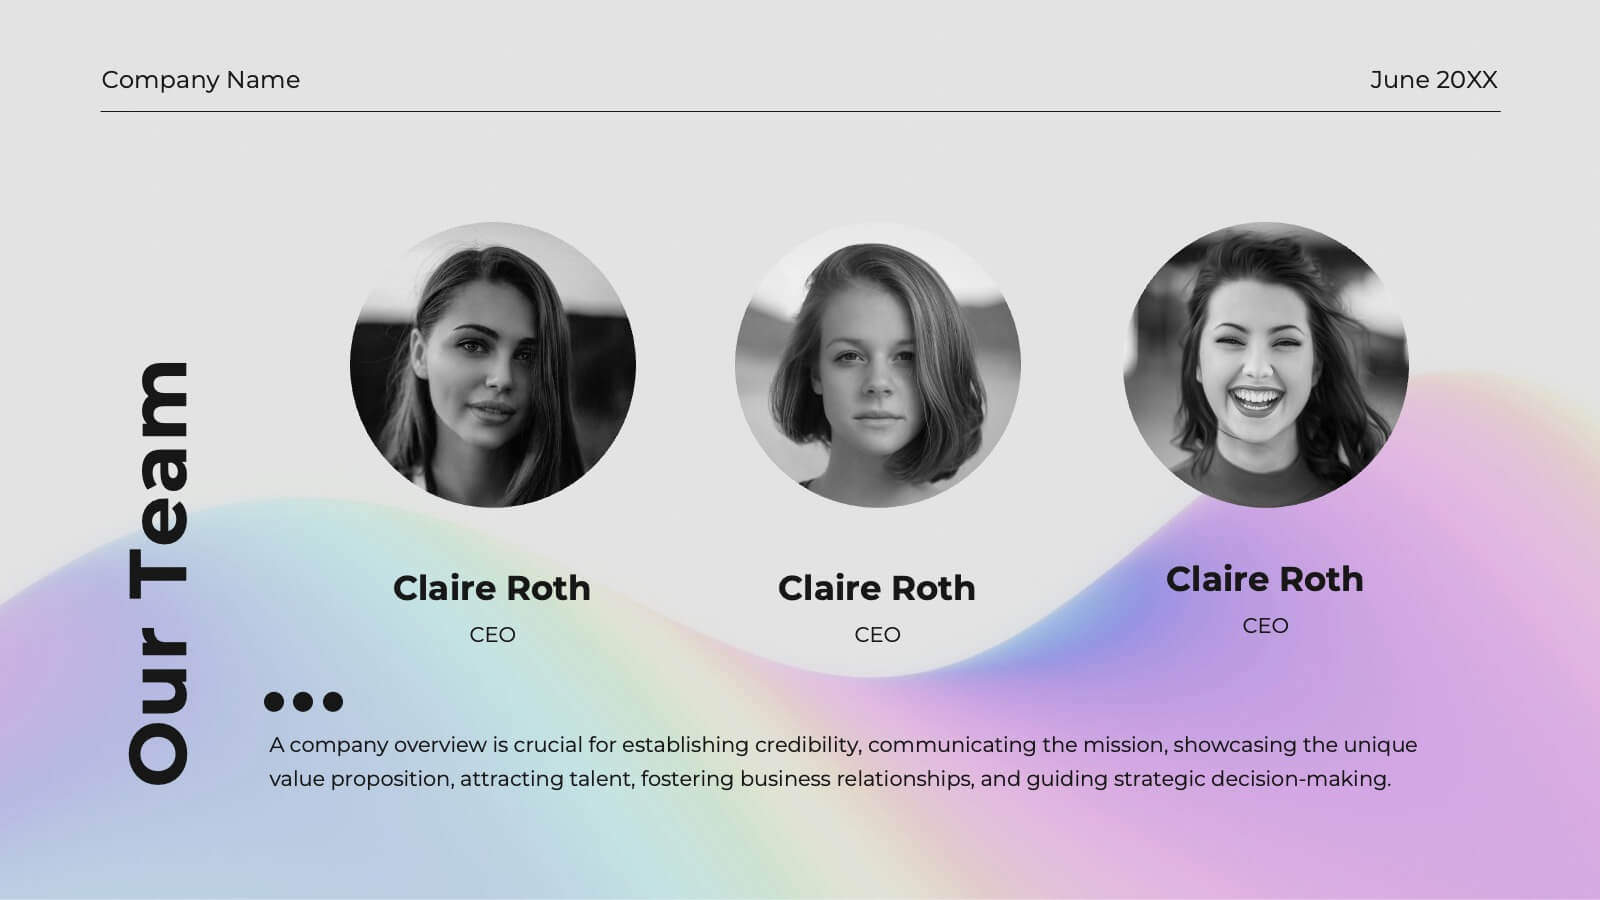
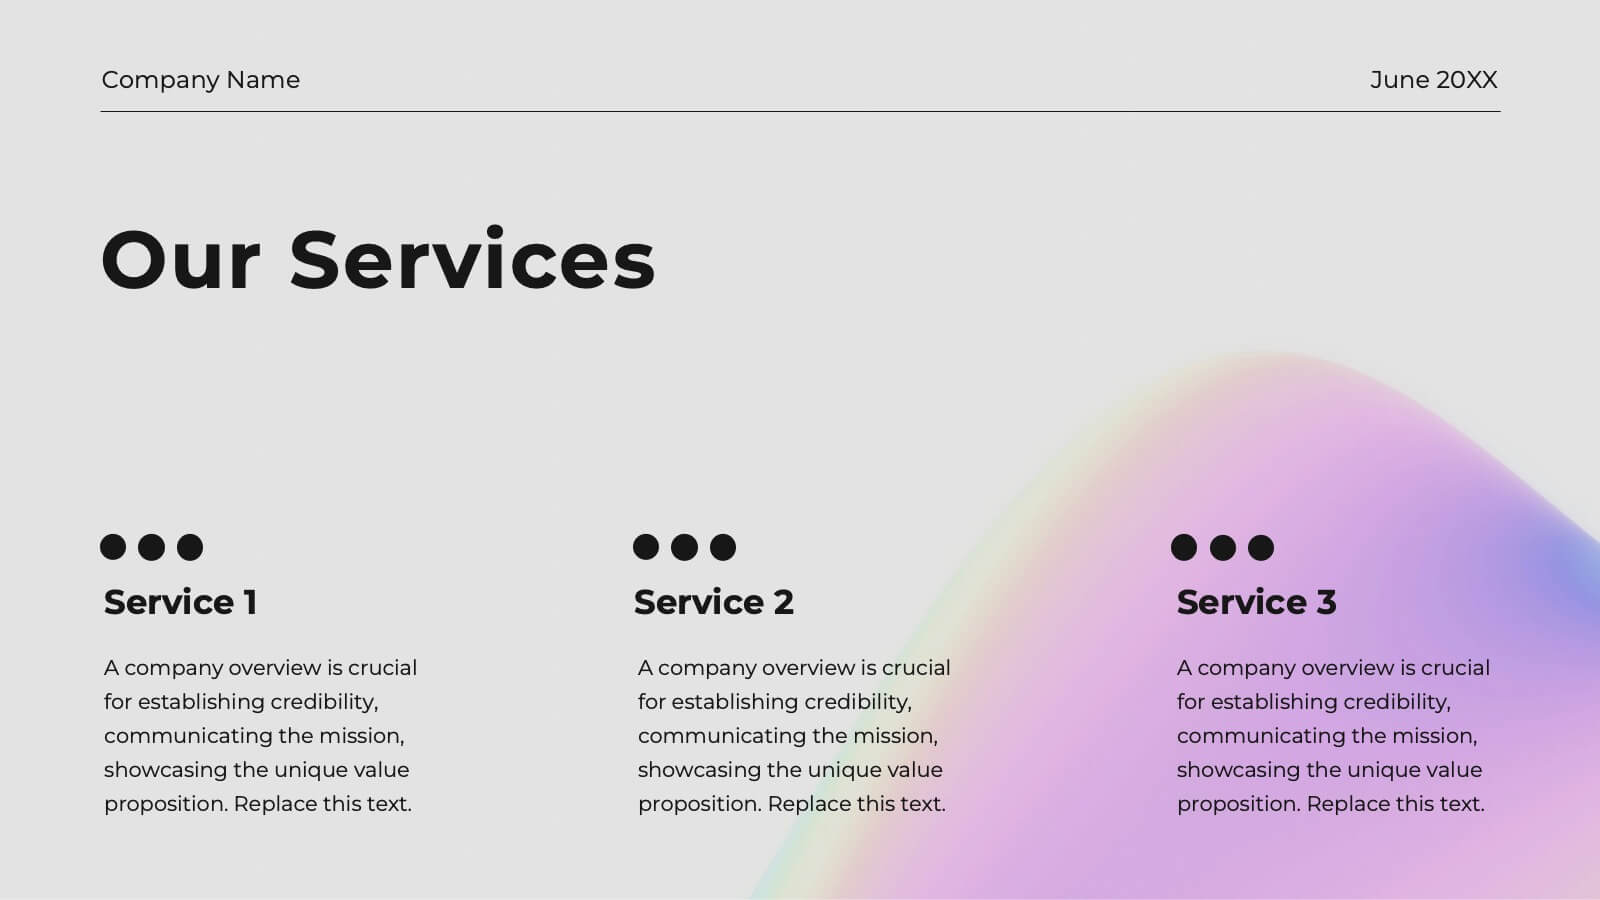
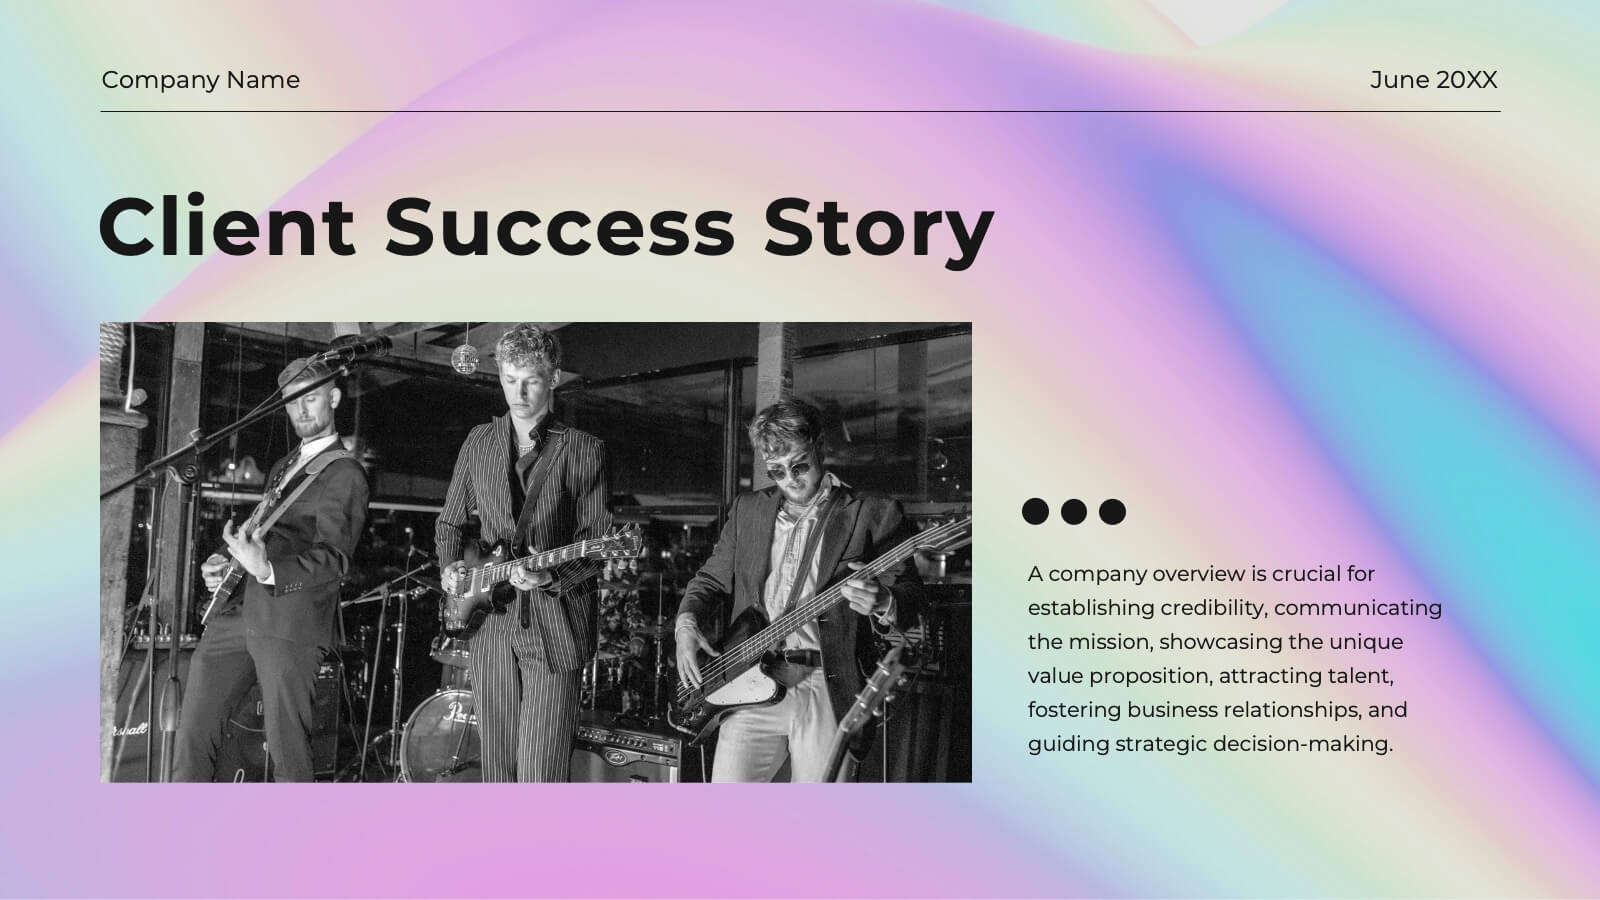
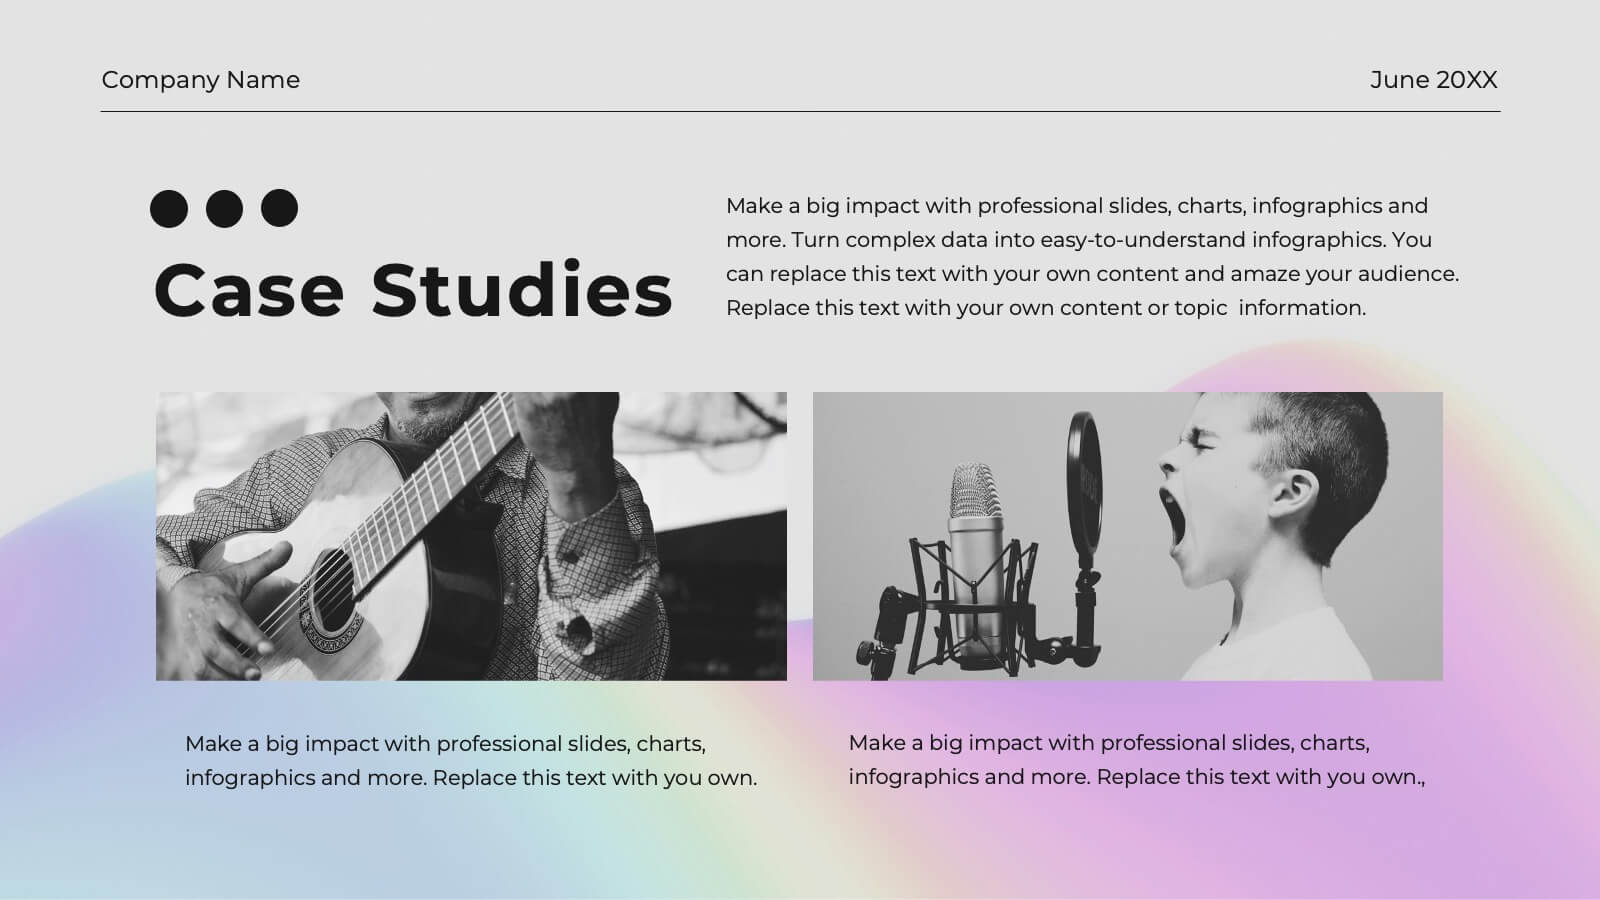
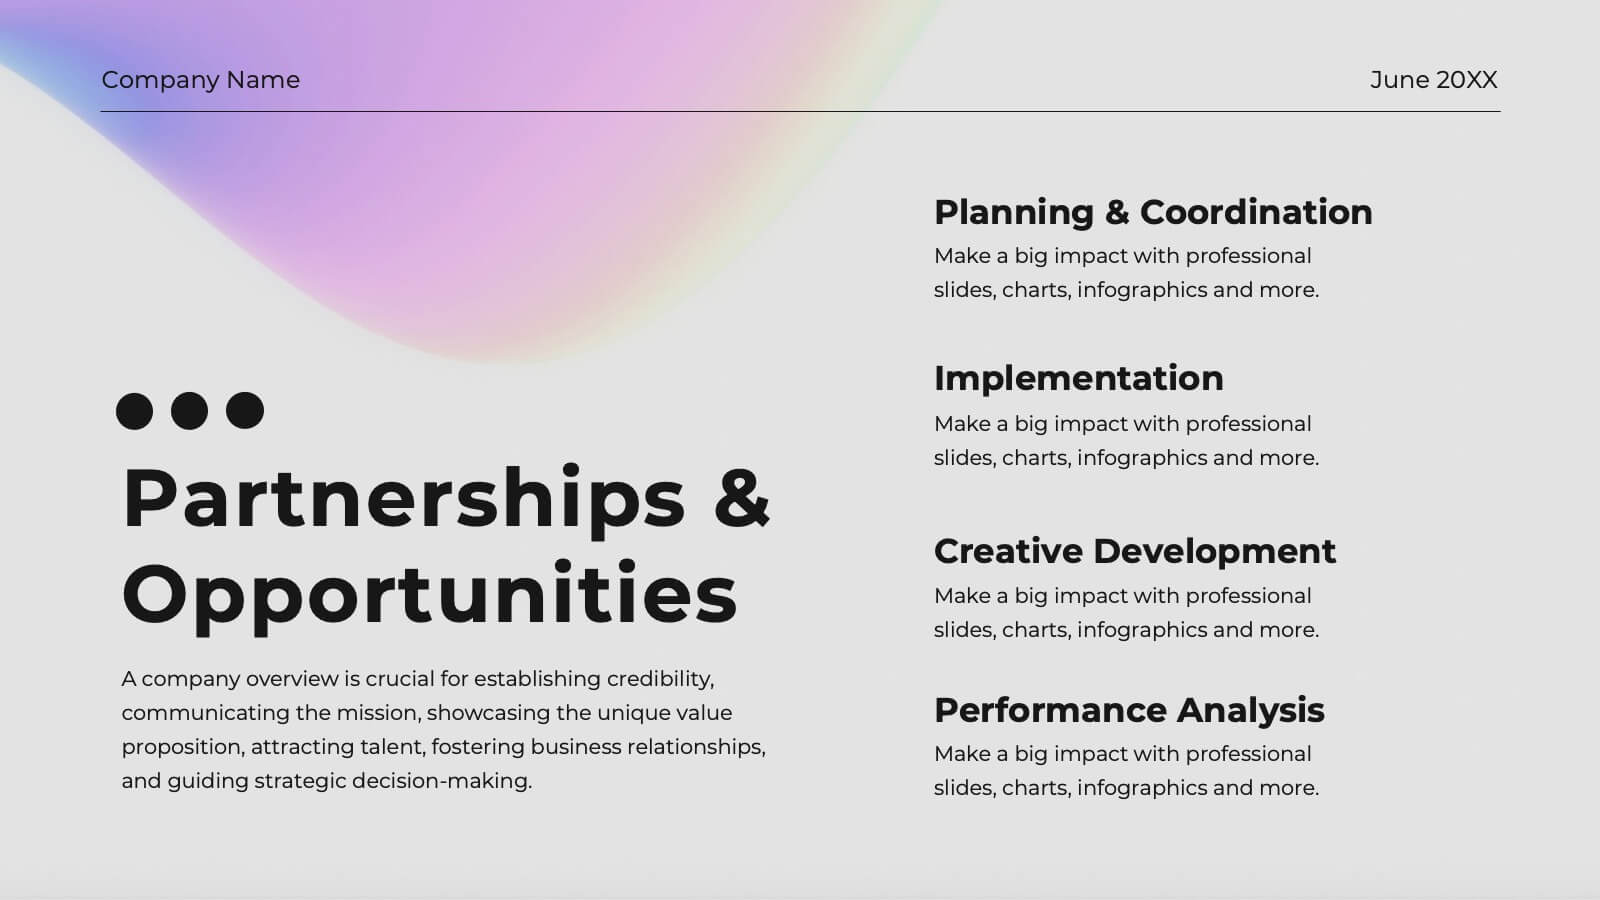
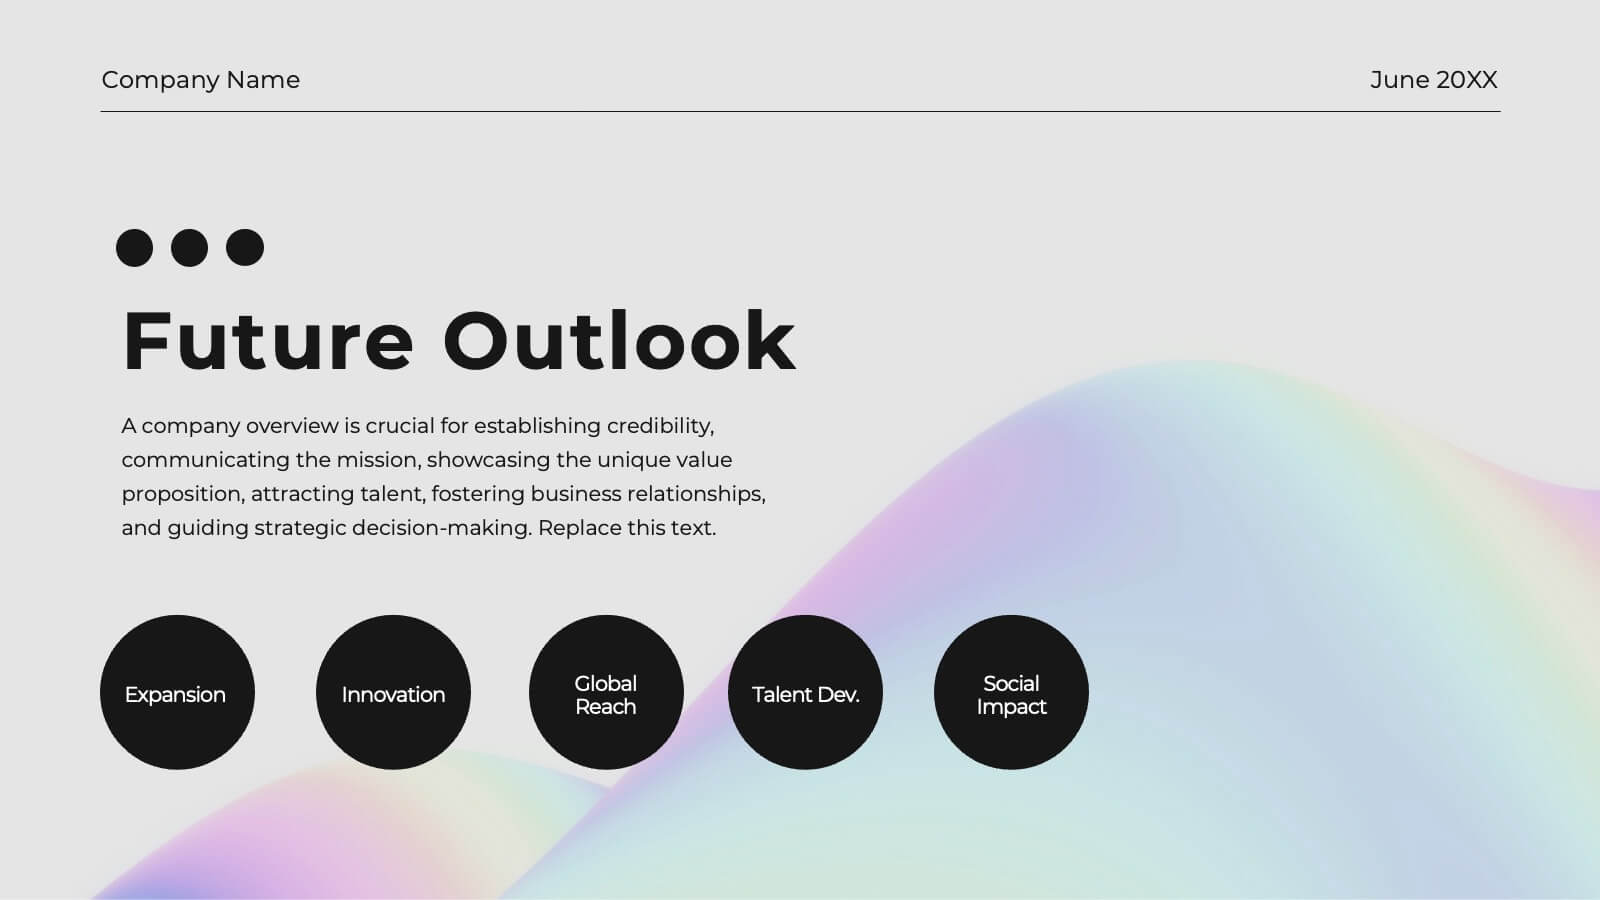
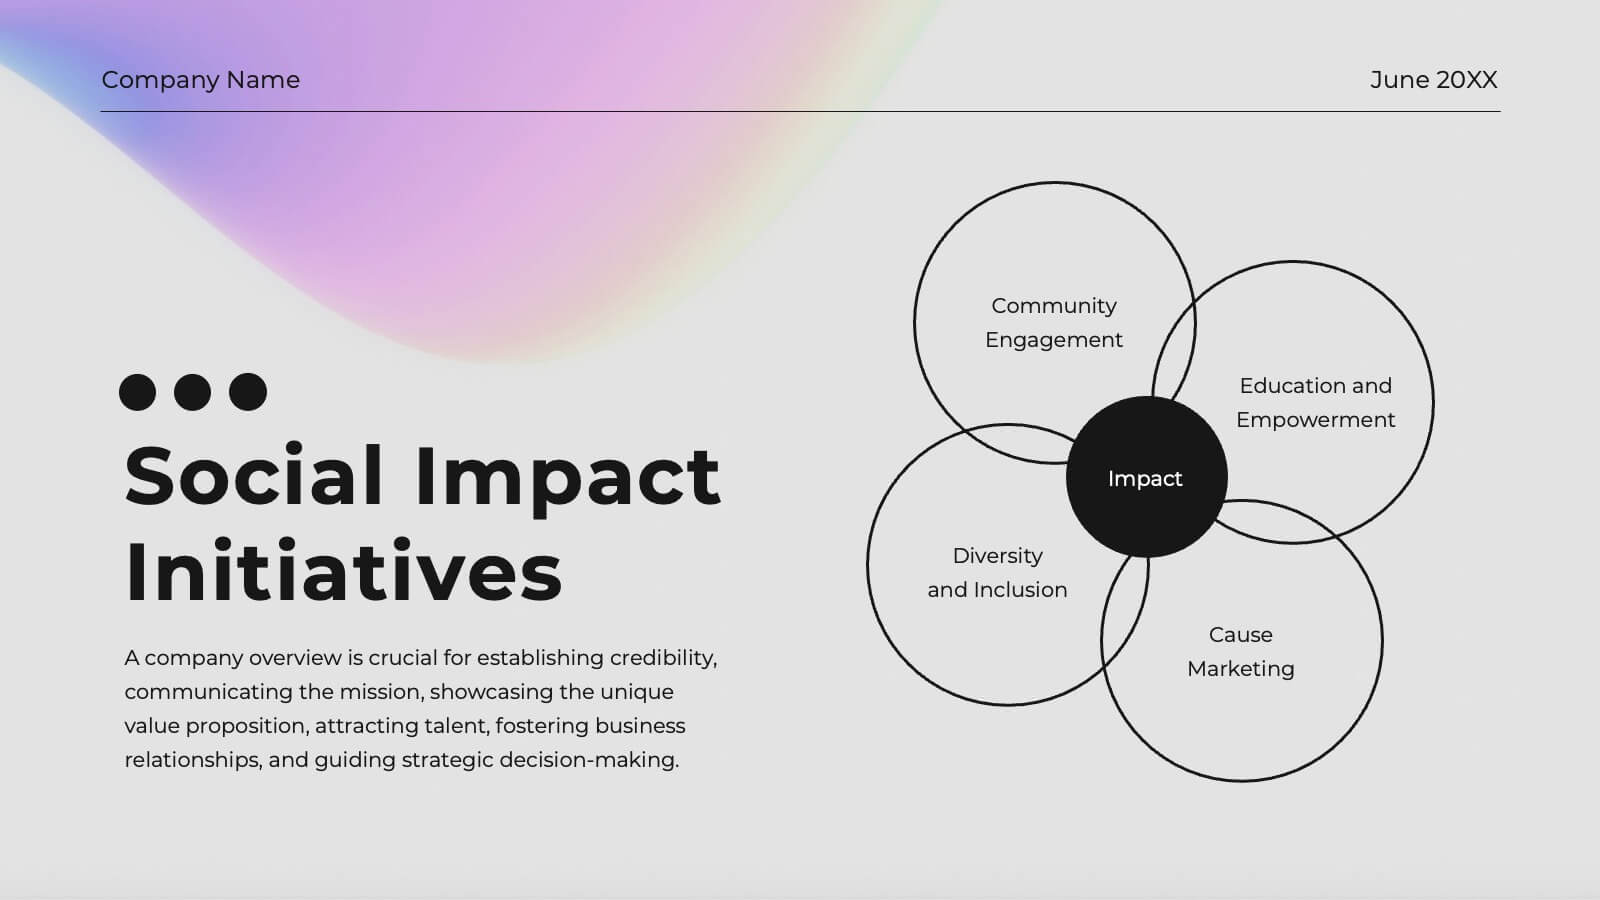
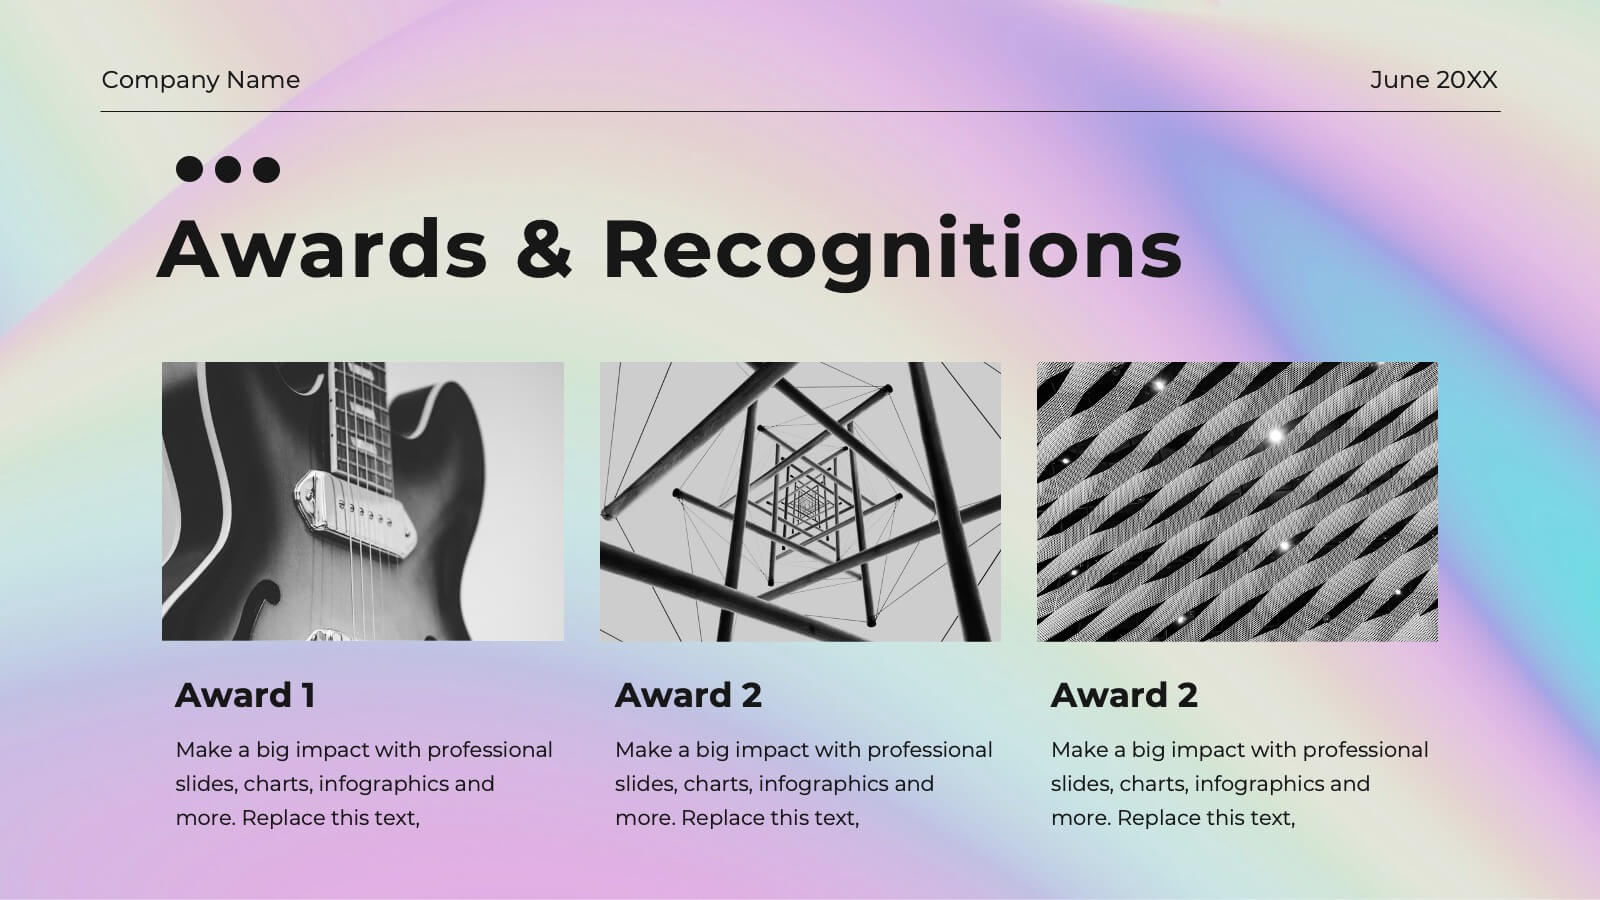
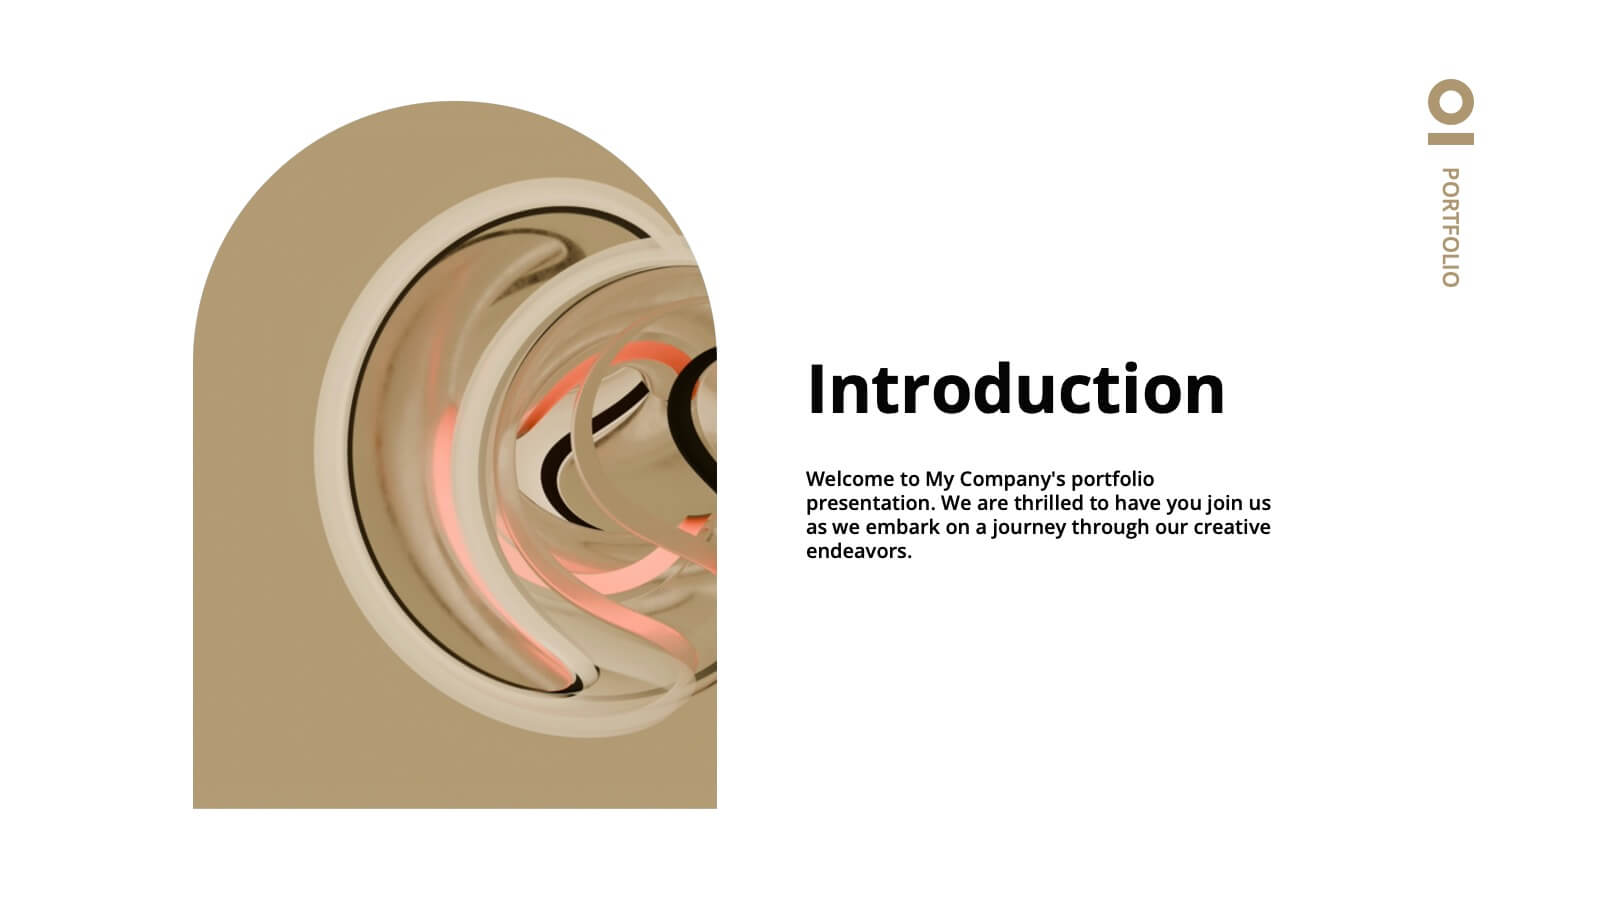
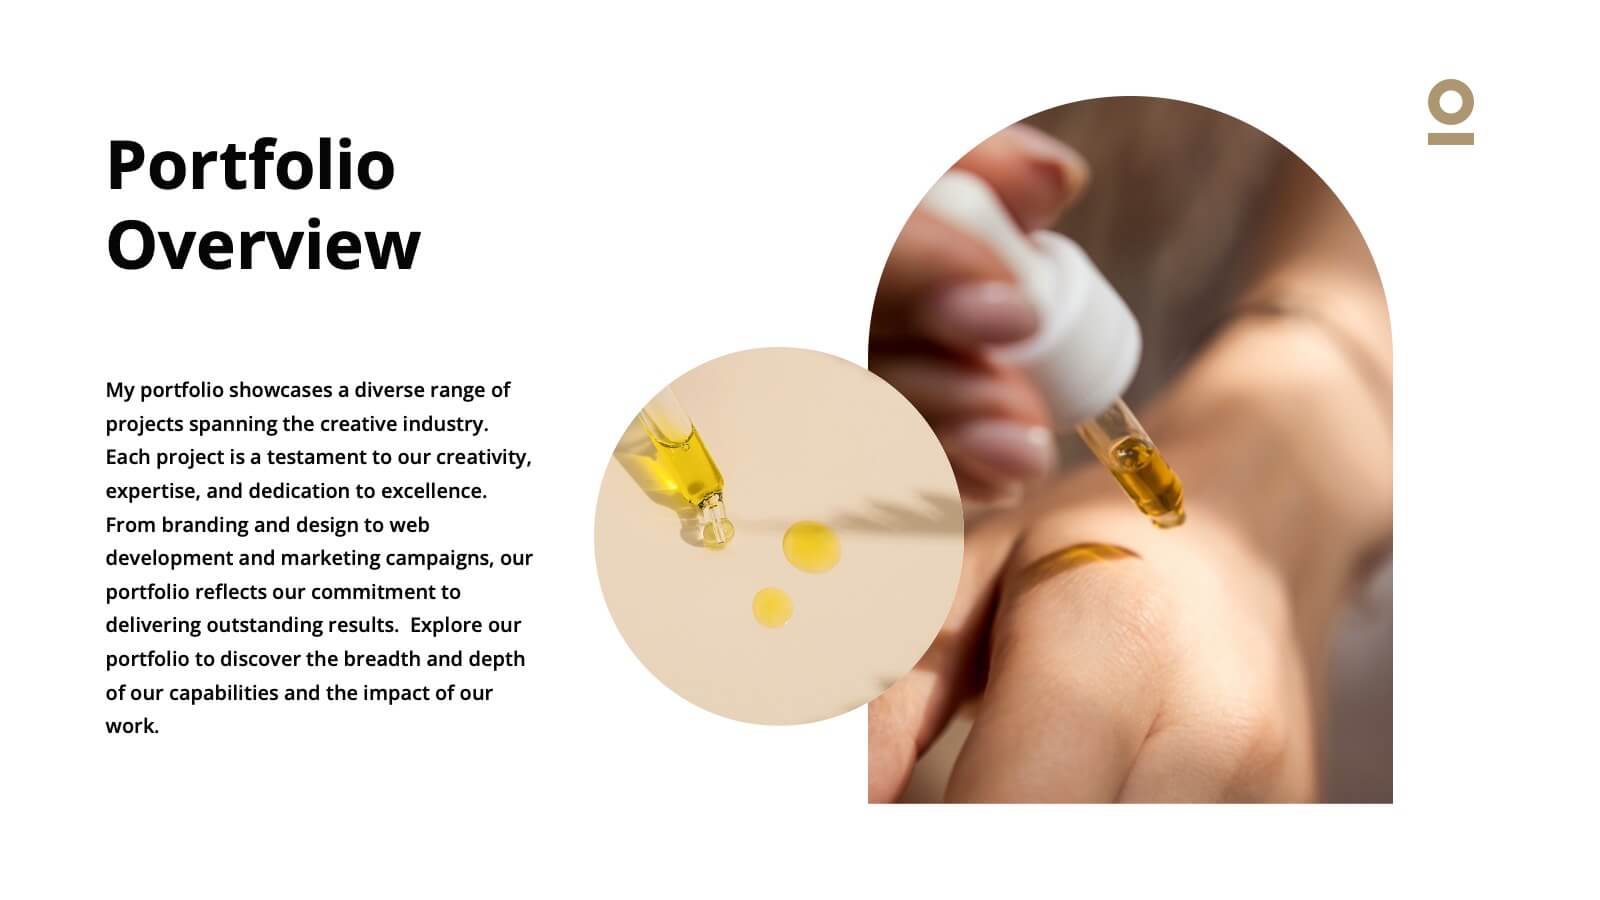
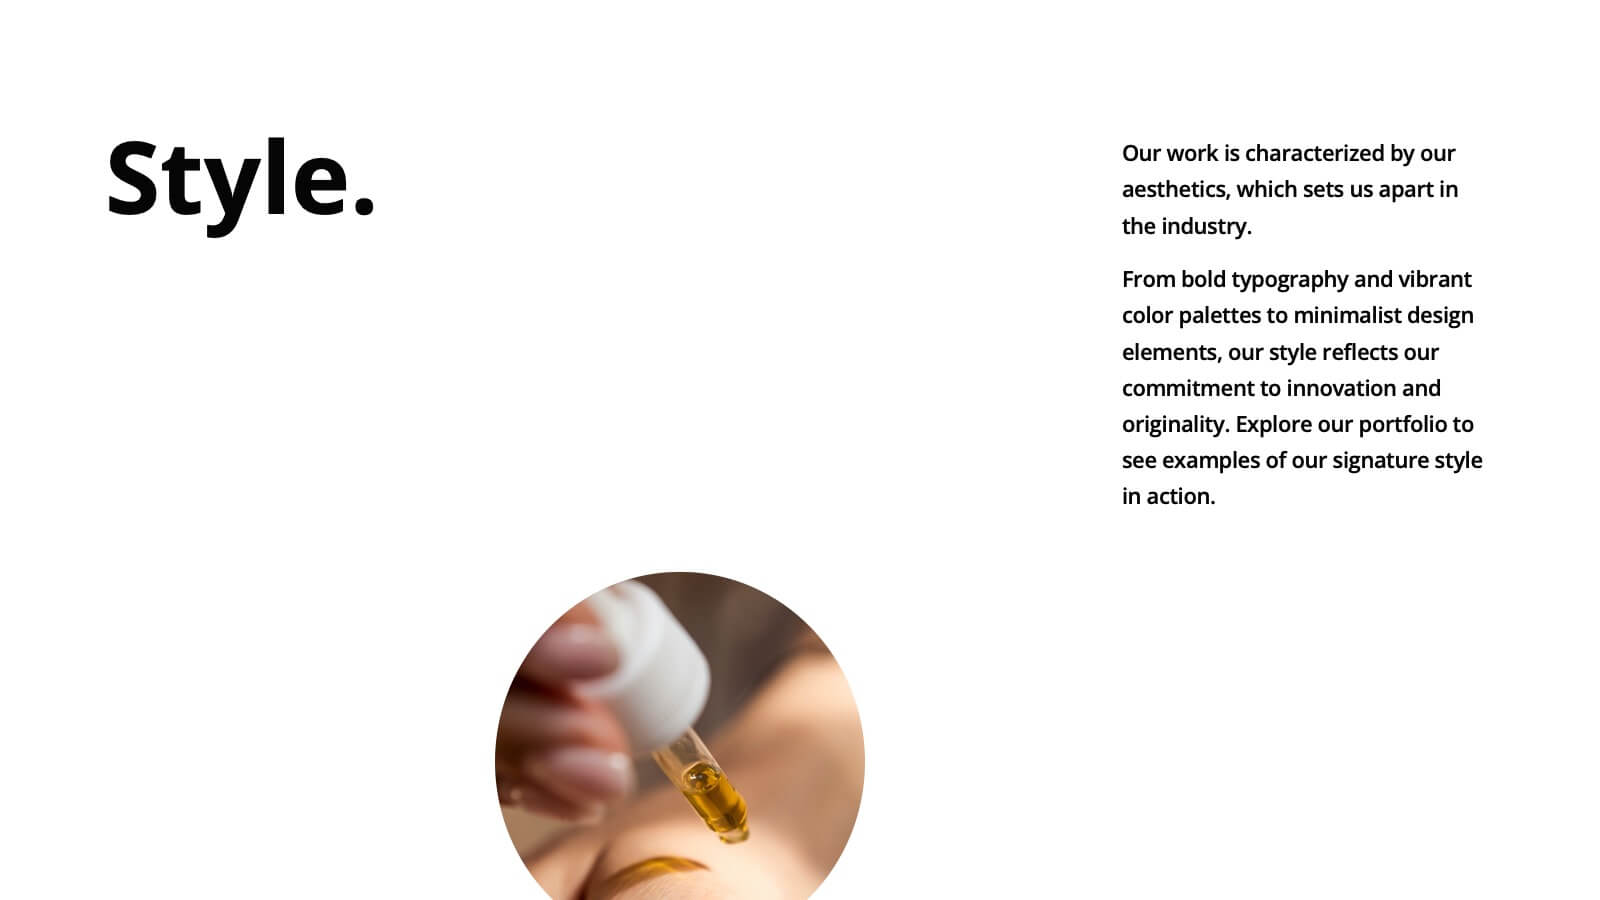
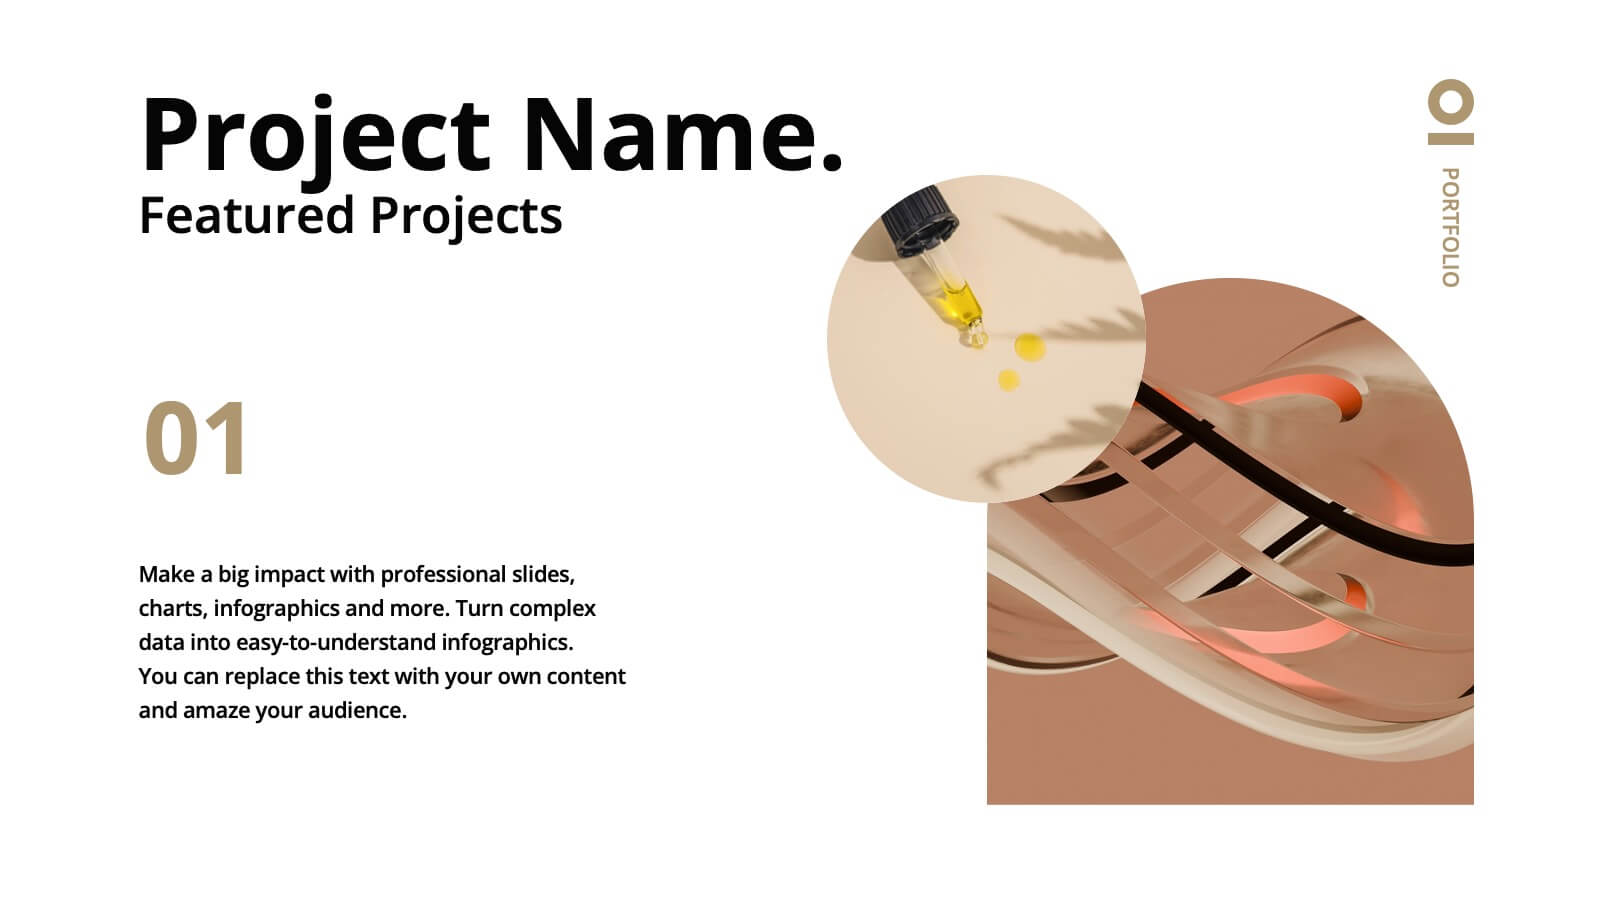
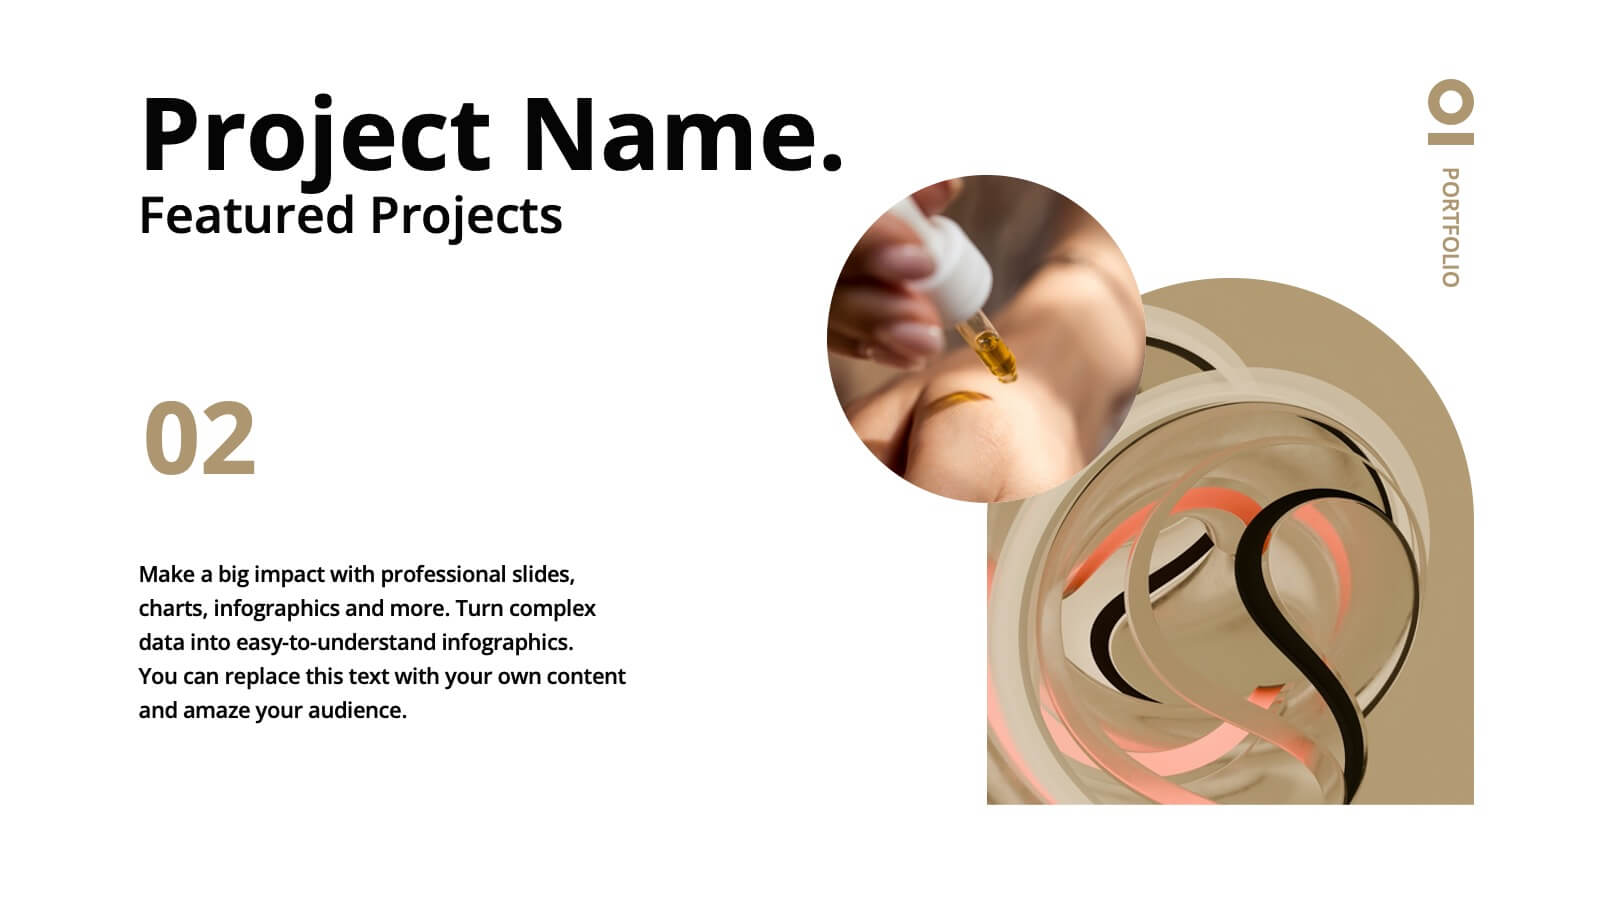
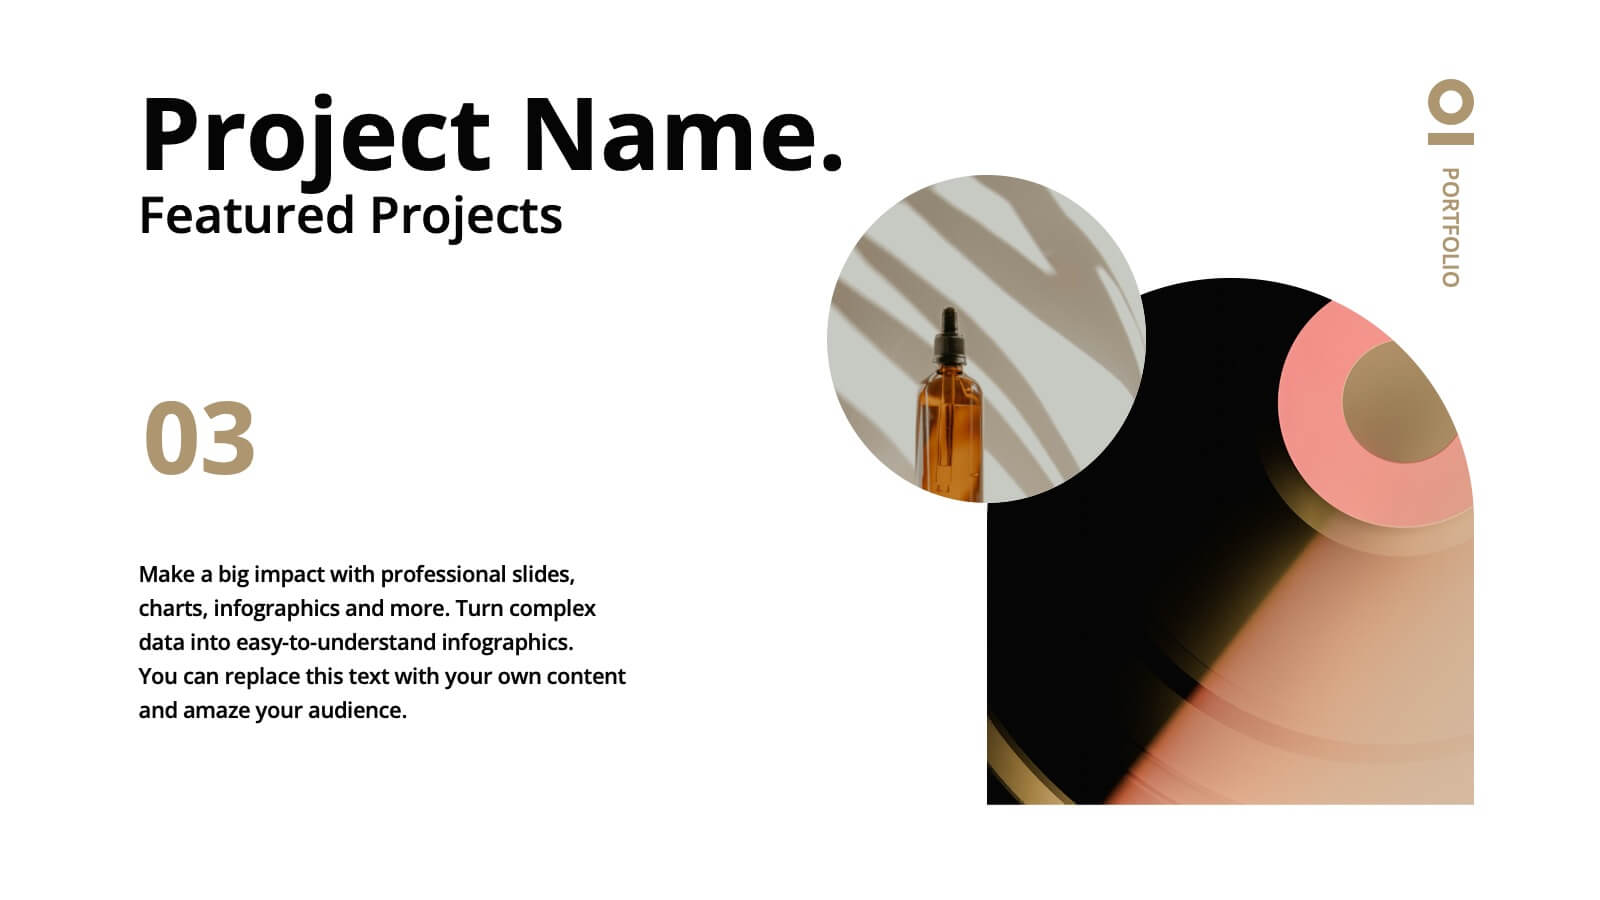
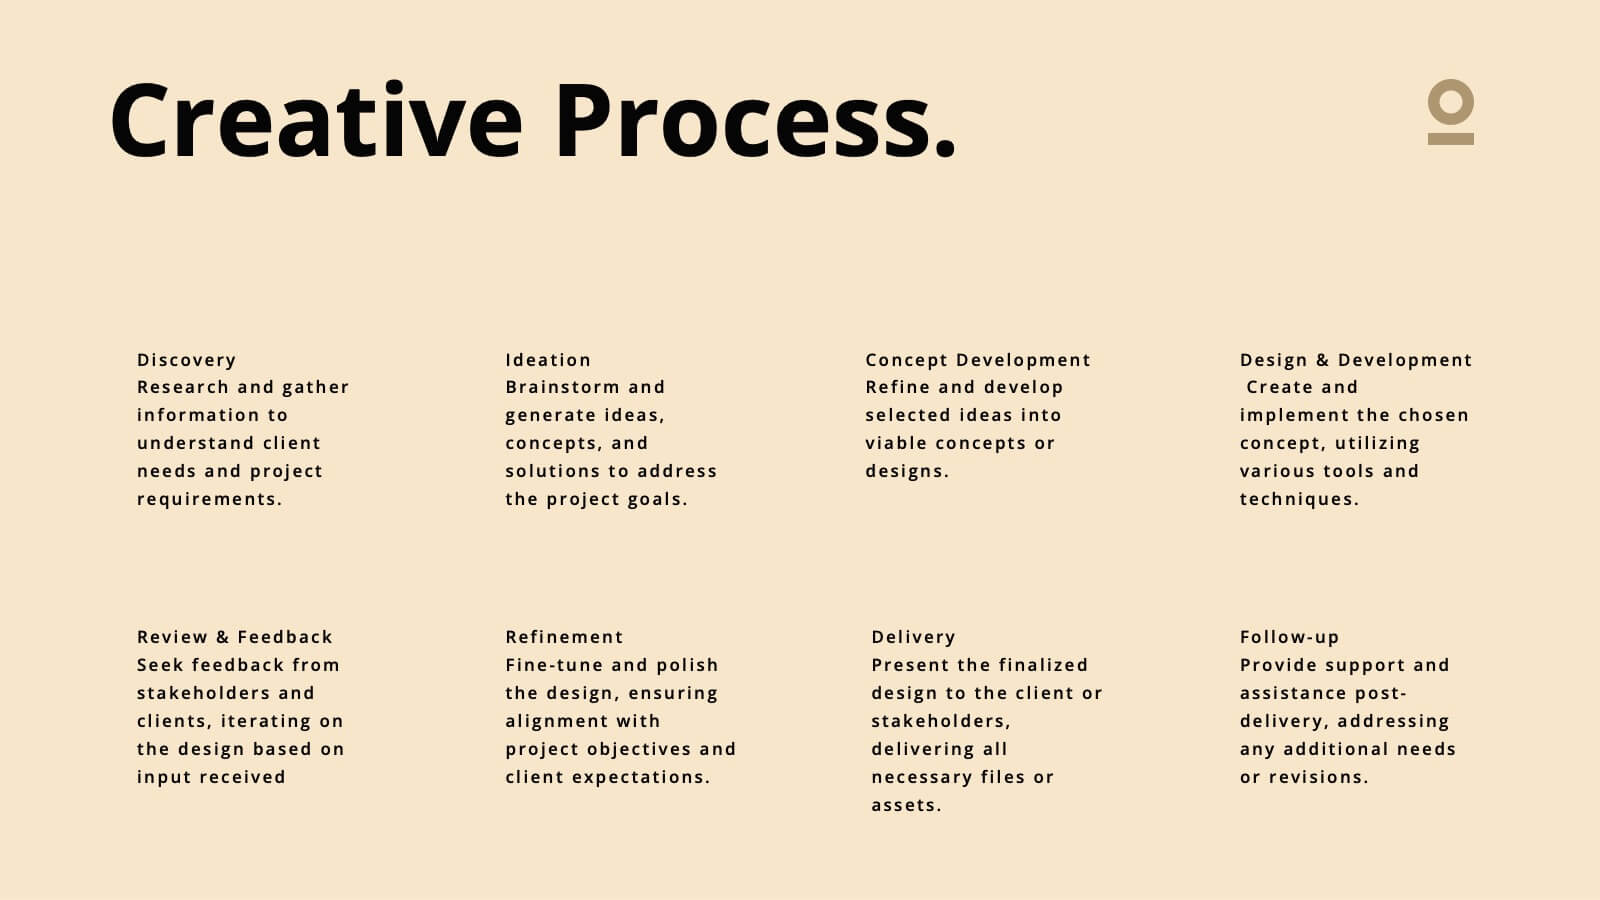
Haze Professional Portfolio Showcase Presentation
Elevate your professional presence with this stunning haze-inspired presentation template! Ideal for showcasing your portfolio, it beautifully highlights your skills, projects, and achievements with a clean and sophisticated design. This template ensures your work stands out, captivating potential clients and employers. Compatible with PowerPoint, Keynote, and Google Slides.


5 diapositivas
Brainstorming Session Diagram Presentation
Spark creativity and structure your next idea session with the Brainstorming Session Diagram Presentation. Featuring a central brain icon and four labeled input areas, this layout makes it easy to visualize and organize group contributions. Fully editable in PowerPoint, Canva, and Google Slides for seamless collaboration and customization.