


Características


¿Tienes alguna pregunta?
Recomendar


7 diapositivas
Positive Feedback Infographic Presentation
A Feedback Infographic presents information related to feedback, including what it is, why it is important, and how to provide and receive it effectively. Feedback is important to help understand performance or behavior and make improvements. This template is designed to help you effectively communicate the importance of feedback and provide tips and strategies for giving and receiving it. This template is compatible with Powerpoint, Keynote, and Google Slides, allowing you to easily add your images and data to illustrate your points, and customize content to fit your specific needs.


10 diapositivas
Data Security and Privacy Measures Presentation
Illustrate your protection protocols clearly with the Data Security and Privacy Measures presentation slide. Featuring a smartphone icon secured with lock, shield, and magnifying glass elements, this layout is ideal for communicating encryption policies, access controls, and compliance steps. Fully editable in PowerPoint, Keynote, and Google Slides.


7 diapositivas
Productivity Comparison Infographic
Step into the dynamic realm of efficiency with our Productivity Comparison Infographic. Set against a pristine white backdrop, the palette dances with the invigorating energy of orange, the reliability of blue, and the fervor of red. This lively template boasts engaging infographics, custom-designed icons, and adaptable image placeholders that vividly illustrate the highs and lows of productivity metrics, tools, and strategies. Expertly crafted for Powerpoint, Keynote, or Google Slides. A must-have for business analysts, team leads, productivity coaches, or any professional keen on spotlighting productivity contrasts.


6 diapositivas
Identifying Market Challenges Presentation
Stay ahead of the competition by breaking down market challenges with this dynamic presentation template! Designed for business strategists, marketers, and analysts, this layout helps you visually structure key obstacles and opportunities. Perfect for market research and competitive analysis. Fully customizable and compatible with PowerPoint, Keynote, and Google Slides.


8 diapositivas
Workforce Engagement Strategy Presentation
Visualize employee engagement plans with the Workforce Engagement Strategy Presentation. This template includes timeline-style layouts to communicate team initiatives, motivation tactics, and HR strategies effectively. Ideal for team leads, HR managers, and consultants. Fully customizable in PowerPoint, Keynote, and Google Slides to suit your brand and communication goals.


14 diapositivas
Pitch Deck Presentation
Craft a compelling narrative for your startup or business proposal with our professionally designed Pitch Deck presentation template. Perfect for entrepreneurs and innovators, this template simplifies conveying your vision to investors and stakeholders. The sleek slides cover all critical aspects of a pitch: from the problem statement, solution, market opportunity, to the business model, and financial projections. Each slide is crafted to facilitate clear and persuasive communication of your ideas. The intuitive layout ensures that your market strategies, competitive analysis, and go-to-market plans are presented with clarity and impact. The templates are seamlessly compatible with PowerPoint, Keynote, and Google Slides, providing flexibility and ease of use across platforms. With our Pitch Deck template, you’re equipped to make a lasting impression that could propel your business to success. Make your data-driven points with confidence, backed by our engaging design that's primed for your next big pitch.


4 diapositivas
Content Calendar and Engagement Plan Presentation
Plan and track content effectively with this calendar-style engagement layout. Visualize posting frequency, engagement goals, and campaign performance in a single view. Ideal for content strategists and marketers managing social or editorial schedules. Fully editable in PowerPoint, Keynote, or Google Slides to suit your unique workflow and branding needs.


7 diapositivas
Side-by-Side Feature Comparison Presentation
Clearly showcase differences across multiple categories with this Side-by-Side Feature Comparison Presentation. Designed with a visual grid system and bold colors, it's perfect for highlighting product or service variations at a glance. Fully customizable in PowerPoint, Keynote, and Google Slides.


4 diapositivas
Case Analysis for Executive Decision Making Presentation
Guide stakeholders through data-driven insights with the Case Analysis for Executive Decision Making Presentation. This layout uses a clear upward progression with labeled steps to showcase milestones, challenges, or strategic outcomes—perfect for leadership meetings or high-level reviews. Fully customizable in PowerPoint, Keynote, and Google Slides.


3 diapositivas
TAM SAM SOM Strategy Slide Presentation
Transform data into strategy with a clean, layered visual that helps you present market opportunities with precision and style. Ideal for illustrating market reach and segmentation, this professional layout keeps your insights clear and impactful. Fully compatible with PowerPoint, Keynote, and Google Slides for seamless customization and presentation use.


6 diapositivas
Mission Goals Infographic
These professionally designed slide templates are tailored to help you articulate your organization's mission goals with clarity and impact. Each slide is structured to emphasize the strategic objectives that guide your operations, making them ideal for communicating with stakeholders, teams, and external partners. Featuring a variety of layouts that include real-life imagery and concise text areas, these templates not only convey your goals but also illustrate the values that underpin your mission. They are perfect for enhancing corporate presentations, annual meetings, or internal strategy discussions, providing a visual and textual guide to what drives your organization forward. Customizable for various communication needs, these templates can be adapted to highlight specific mission goals or to align with different thematic elements of your presentations. They are an essential tool for organizations aiming to foster a unified understanding of their mission and to inspire alignment and action among all stakeholders.
22 diapositivas
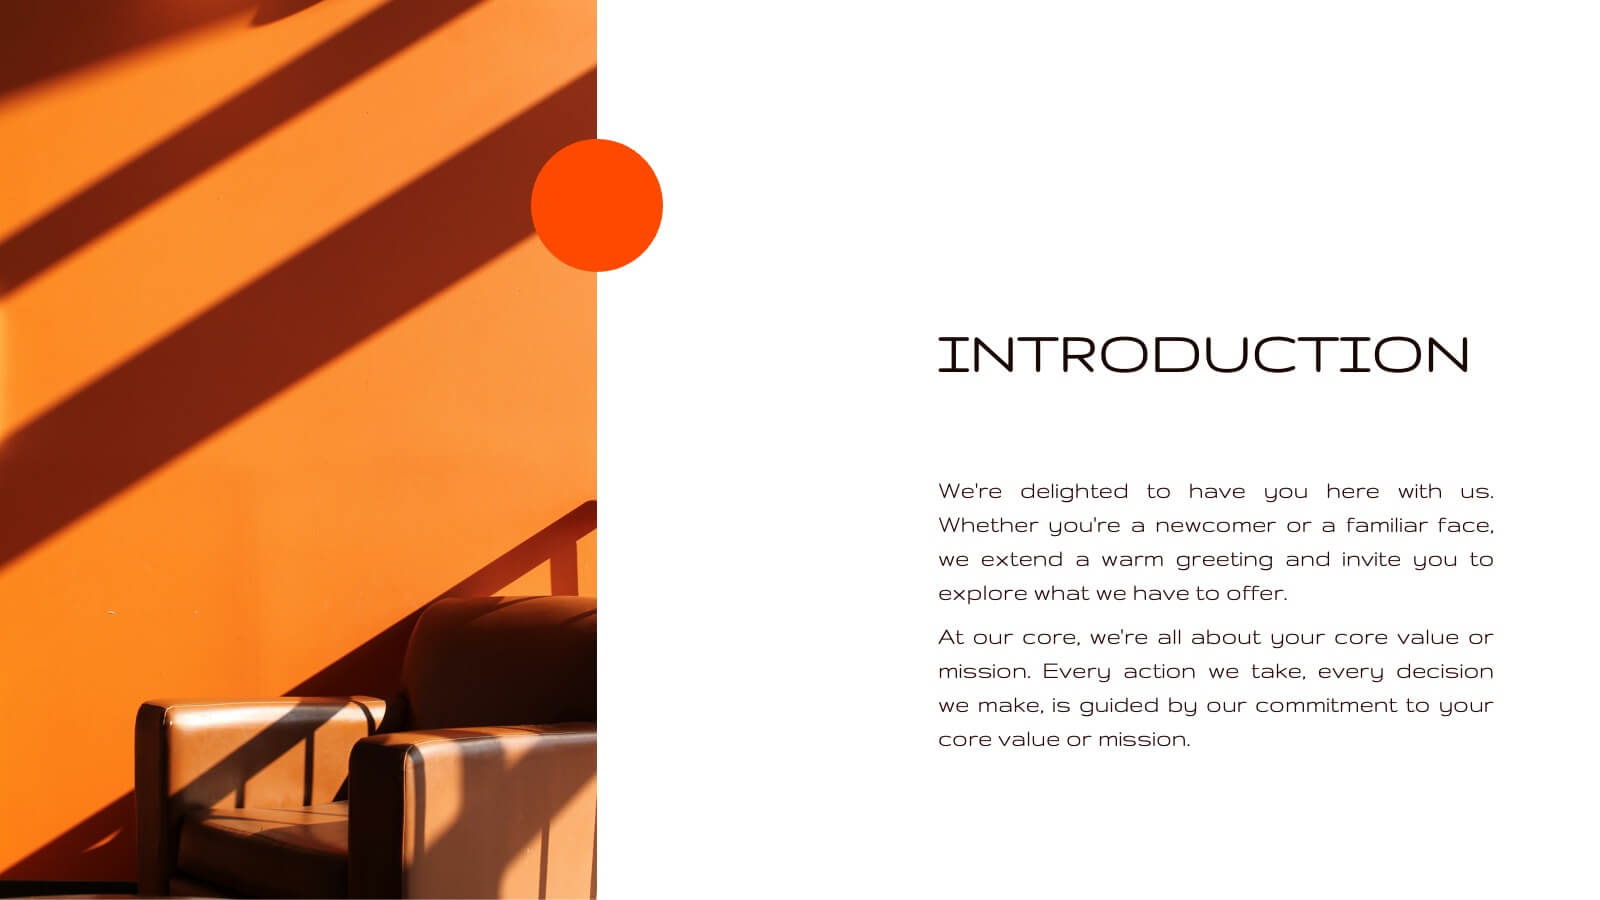
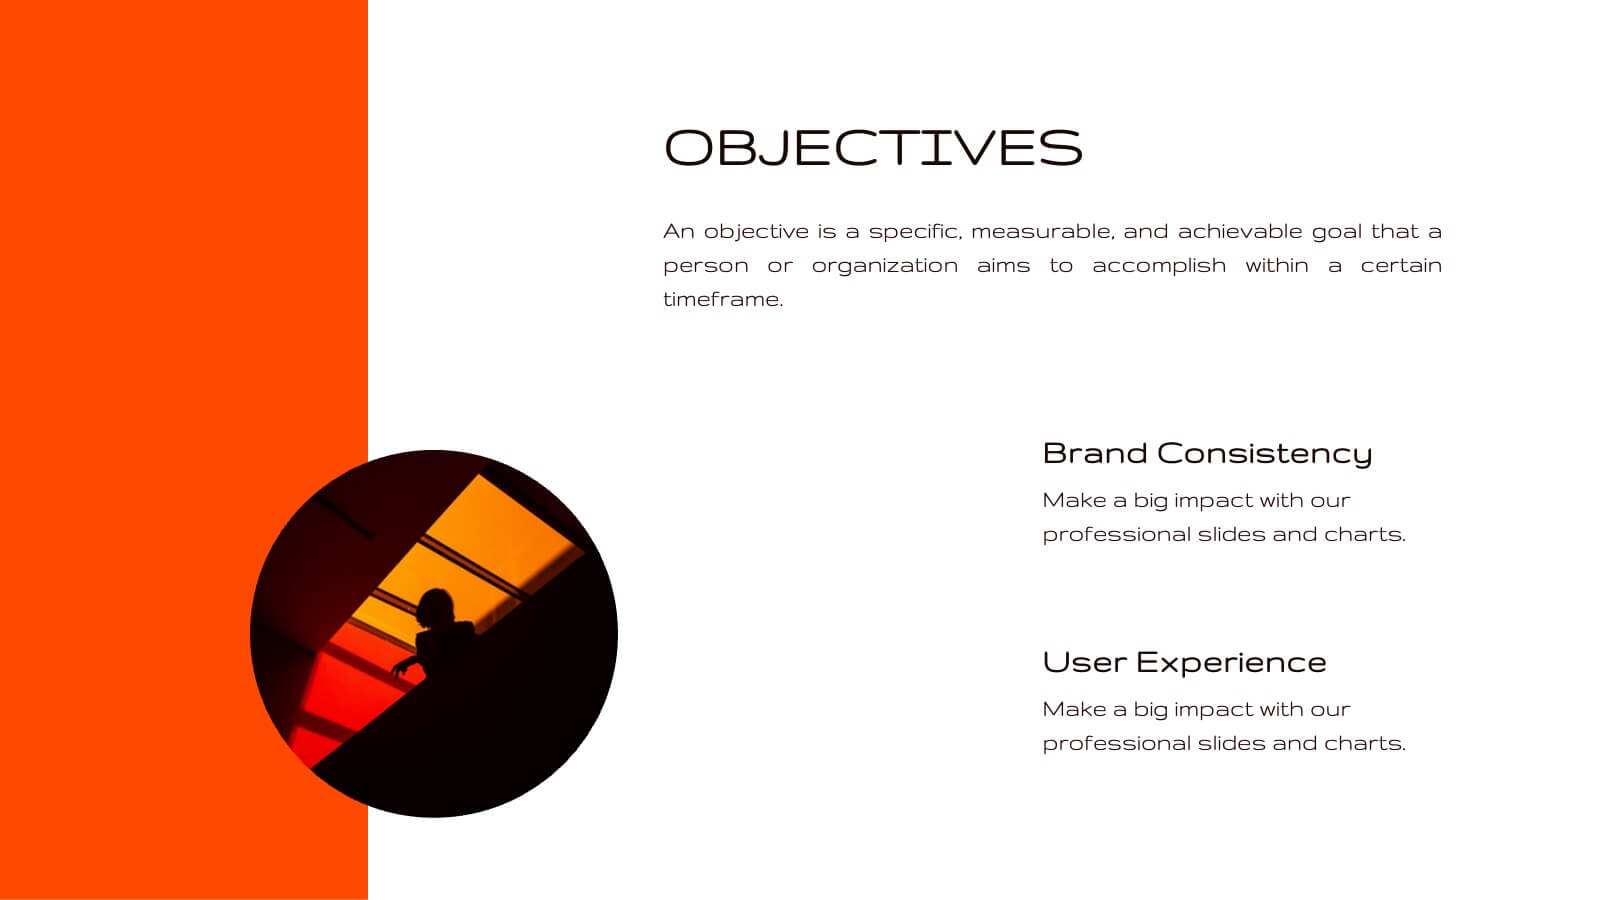
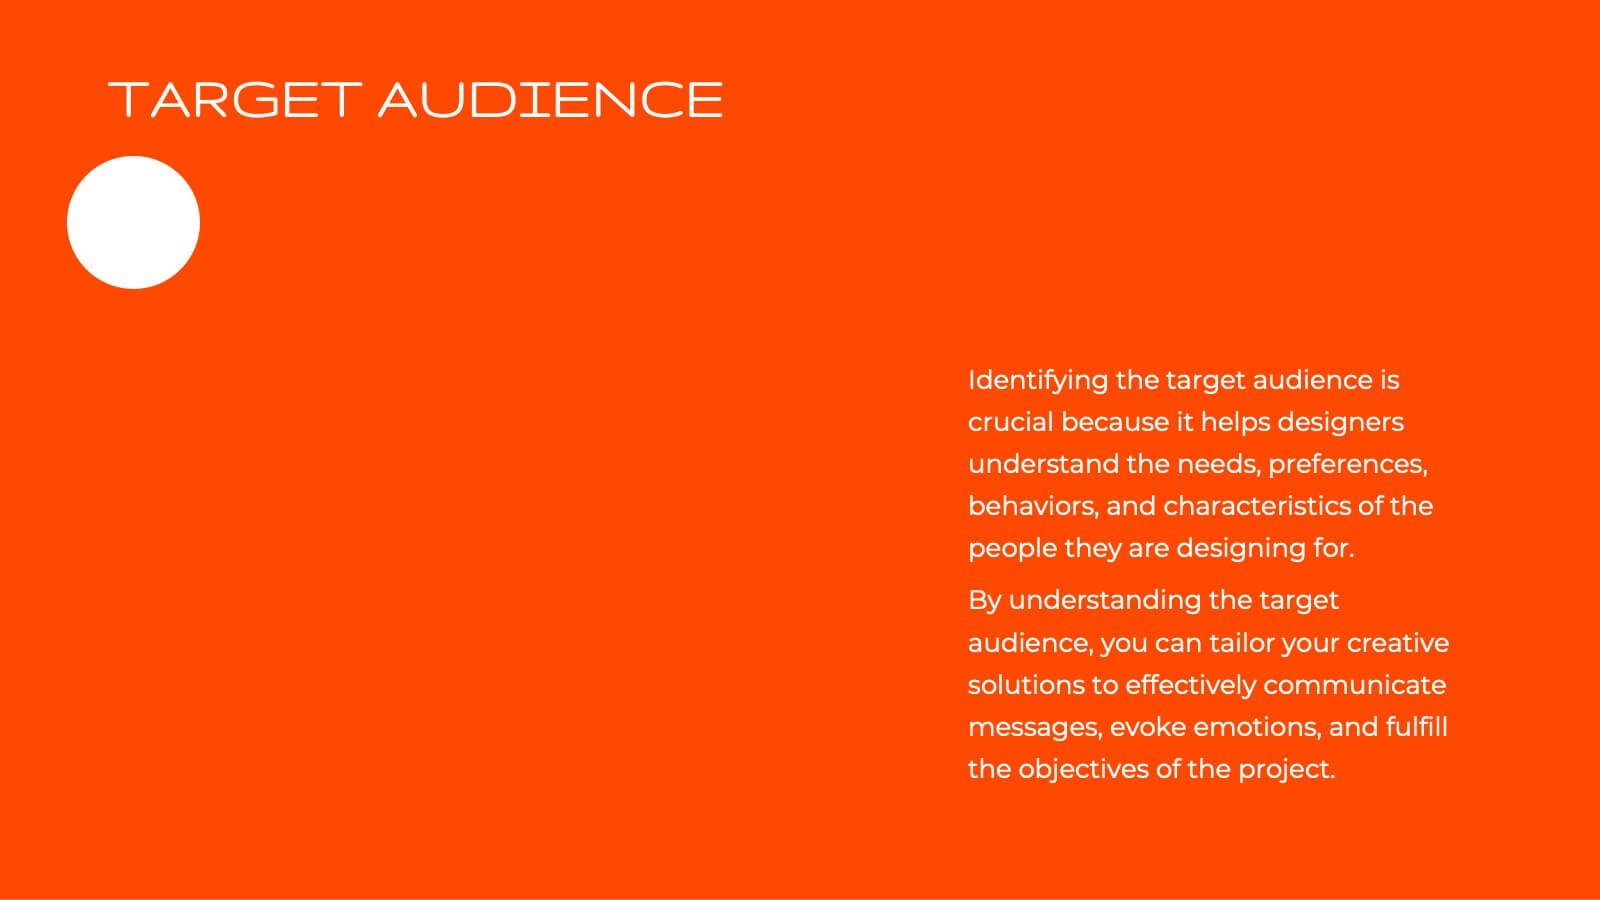
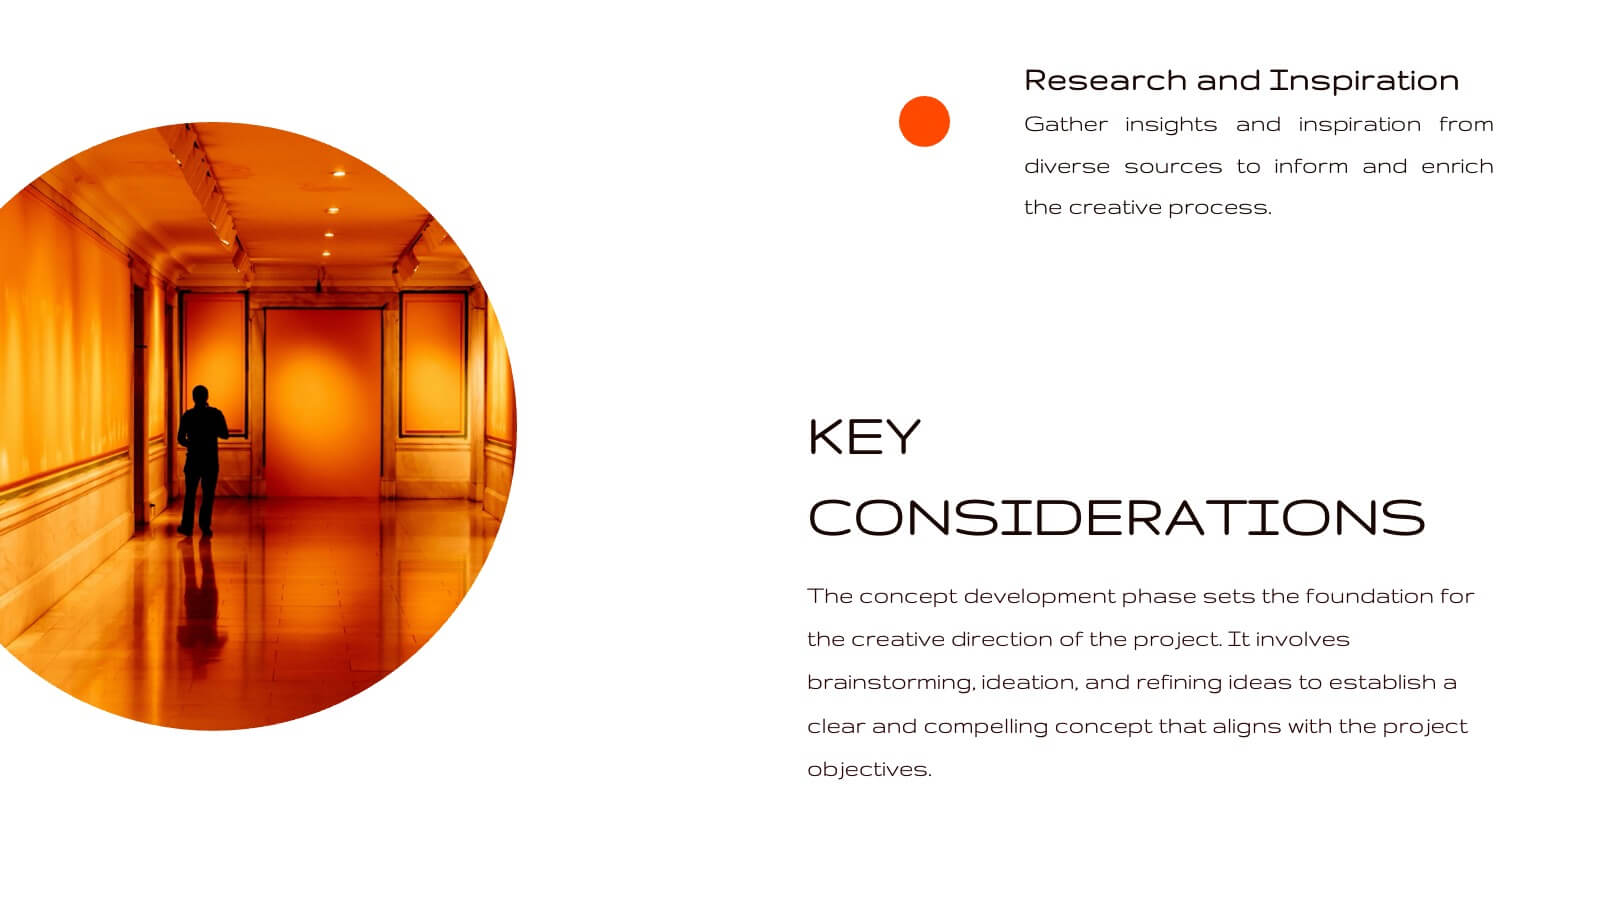
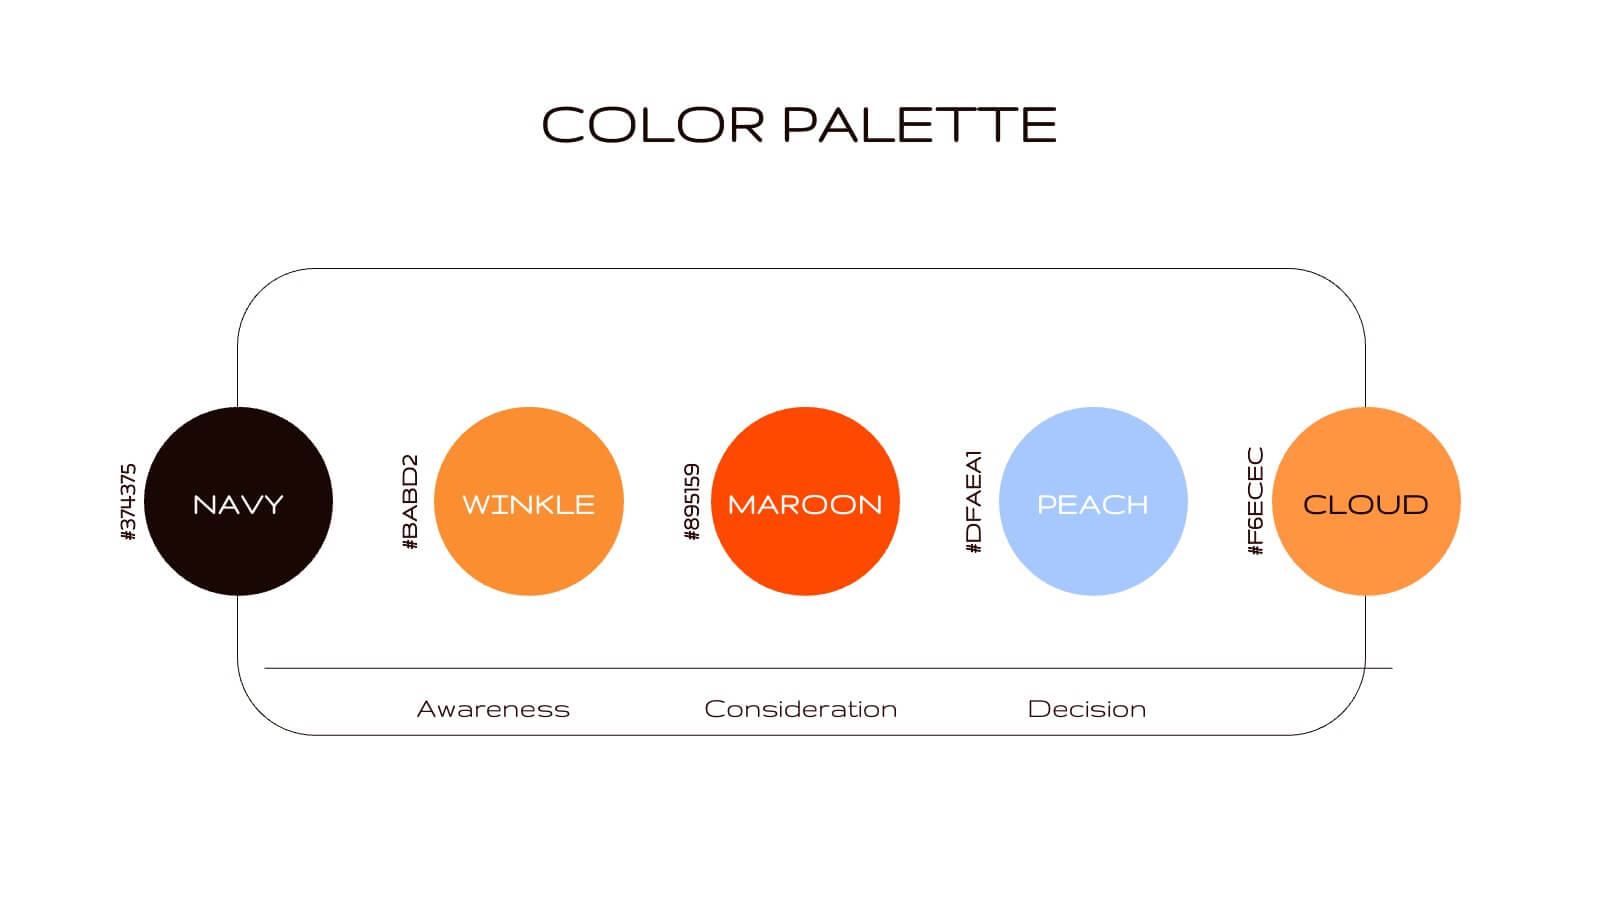
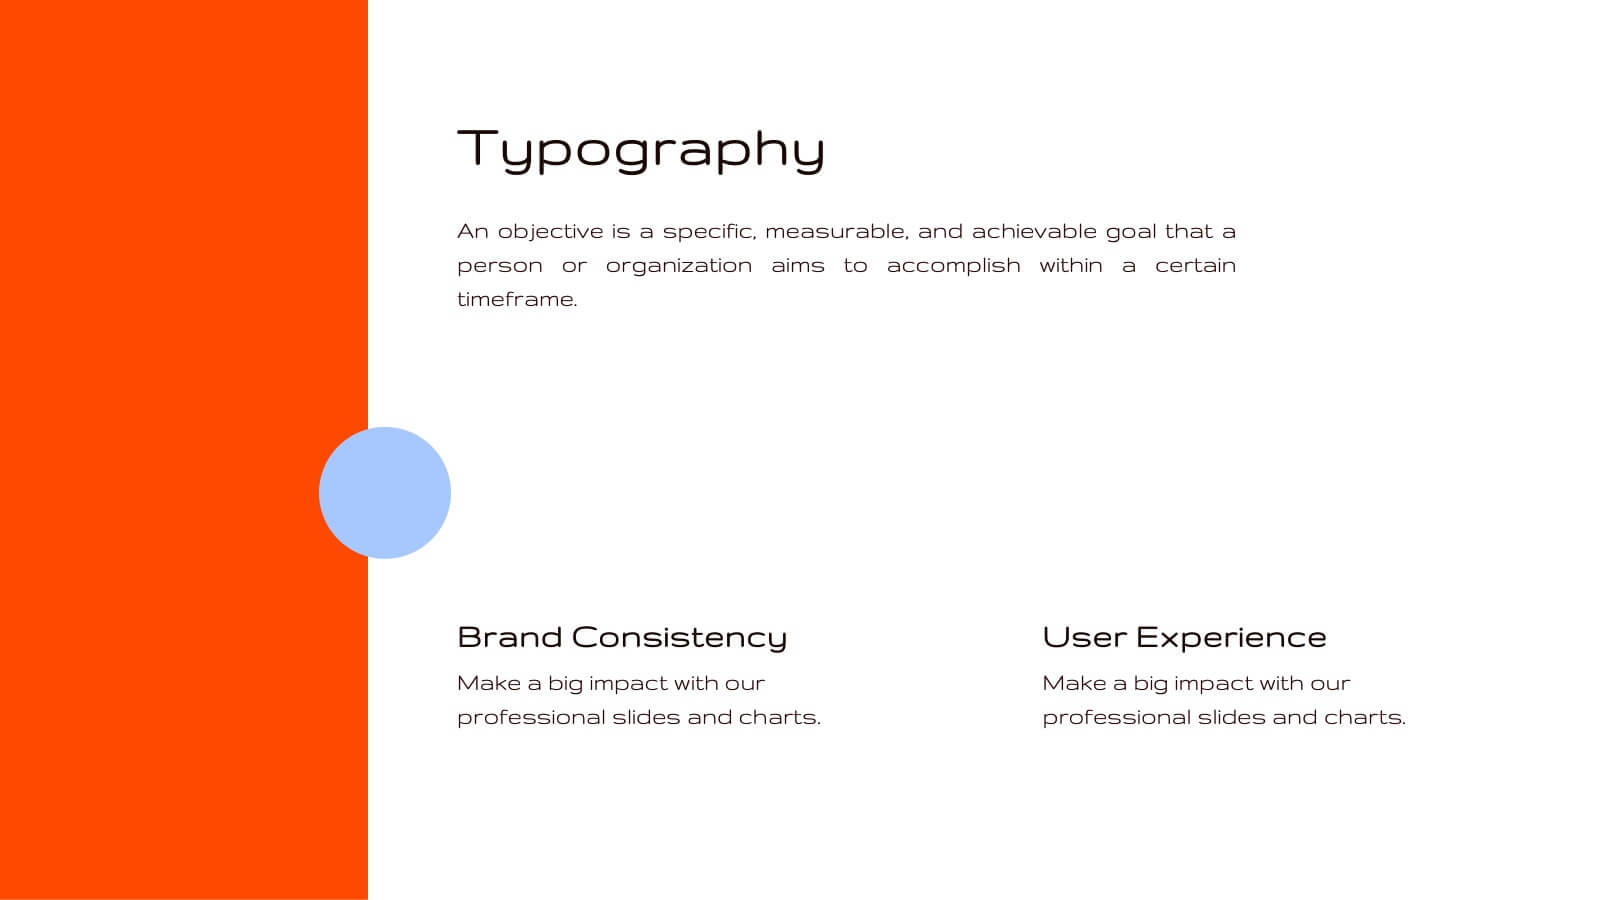
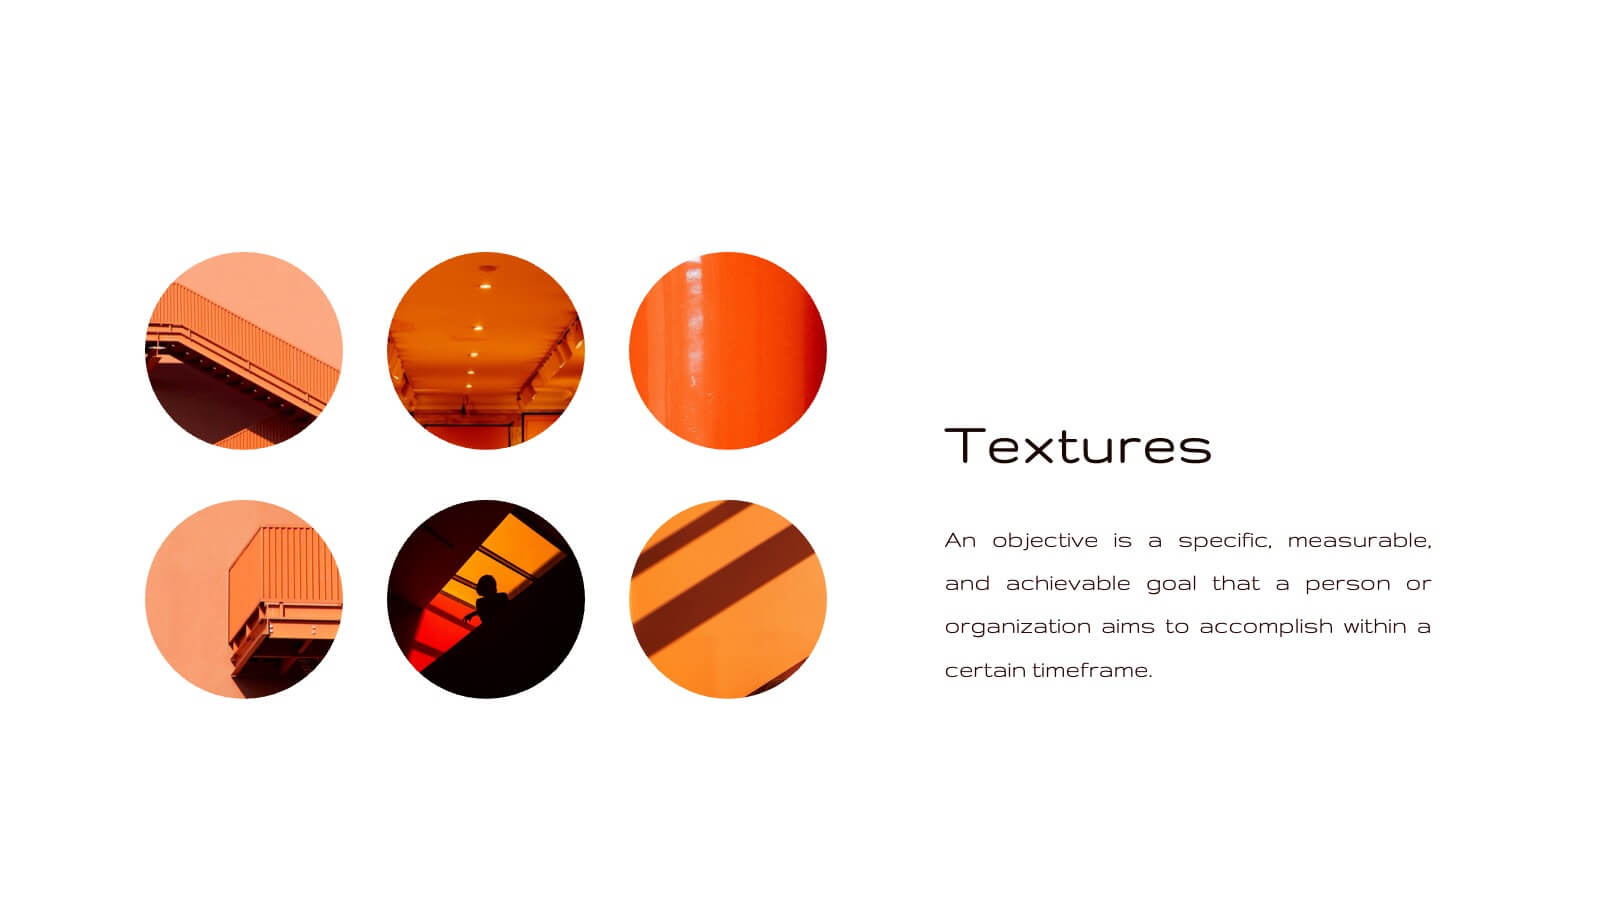
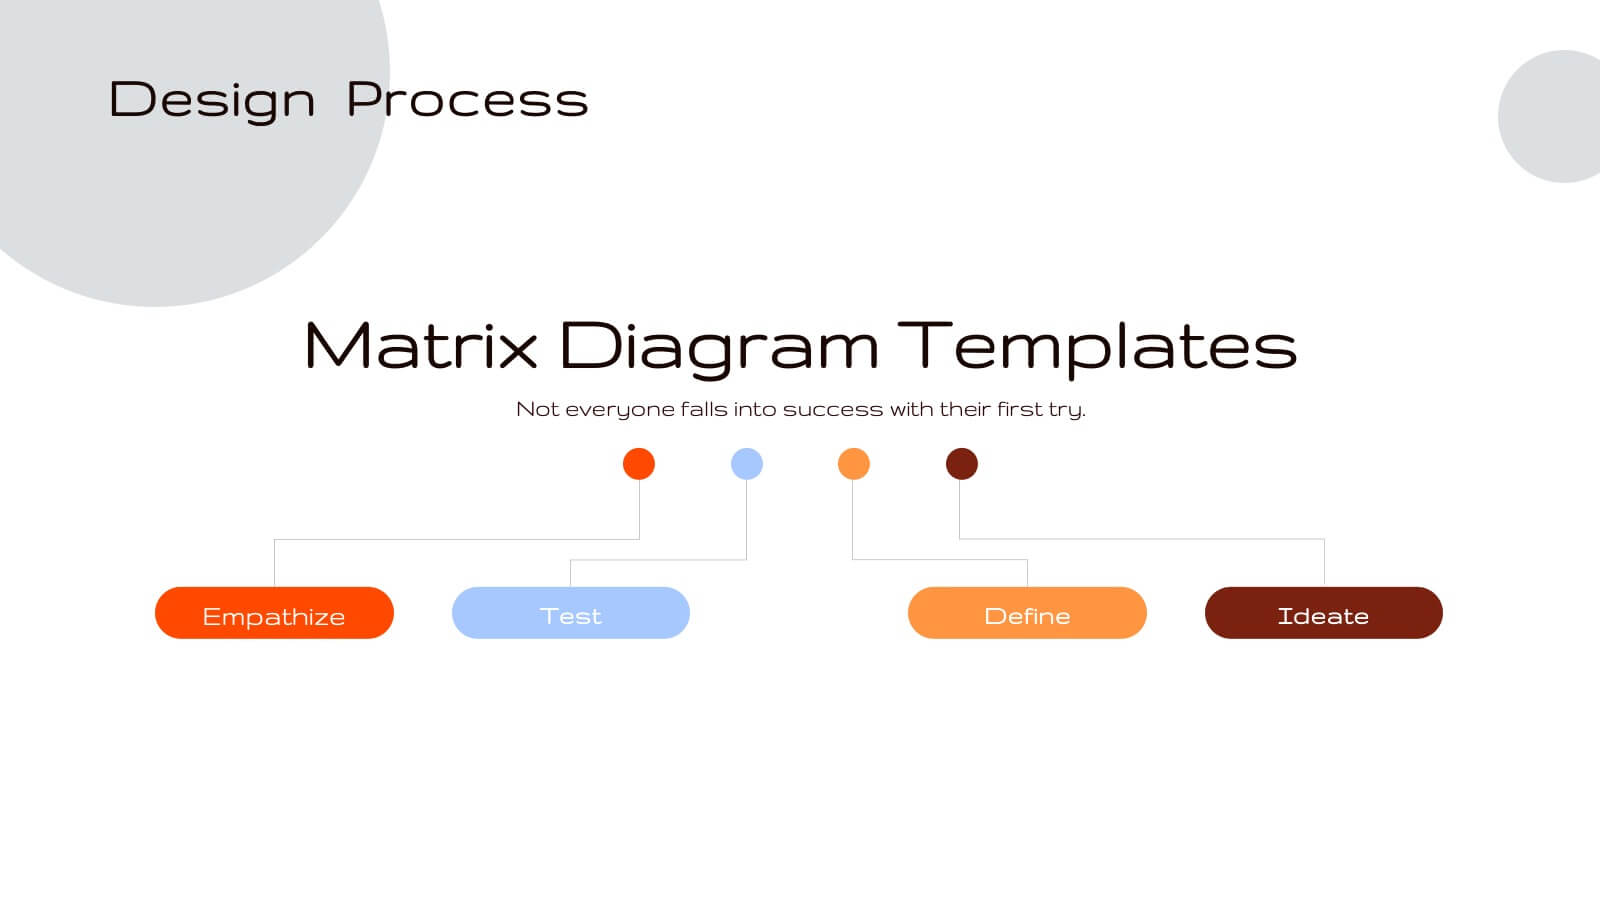
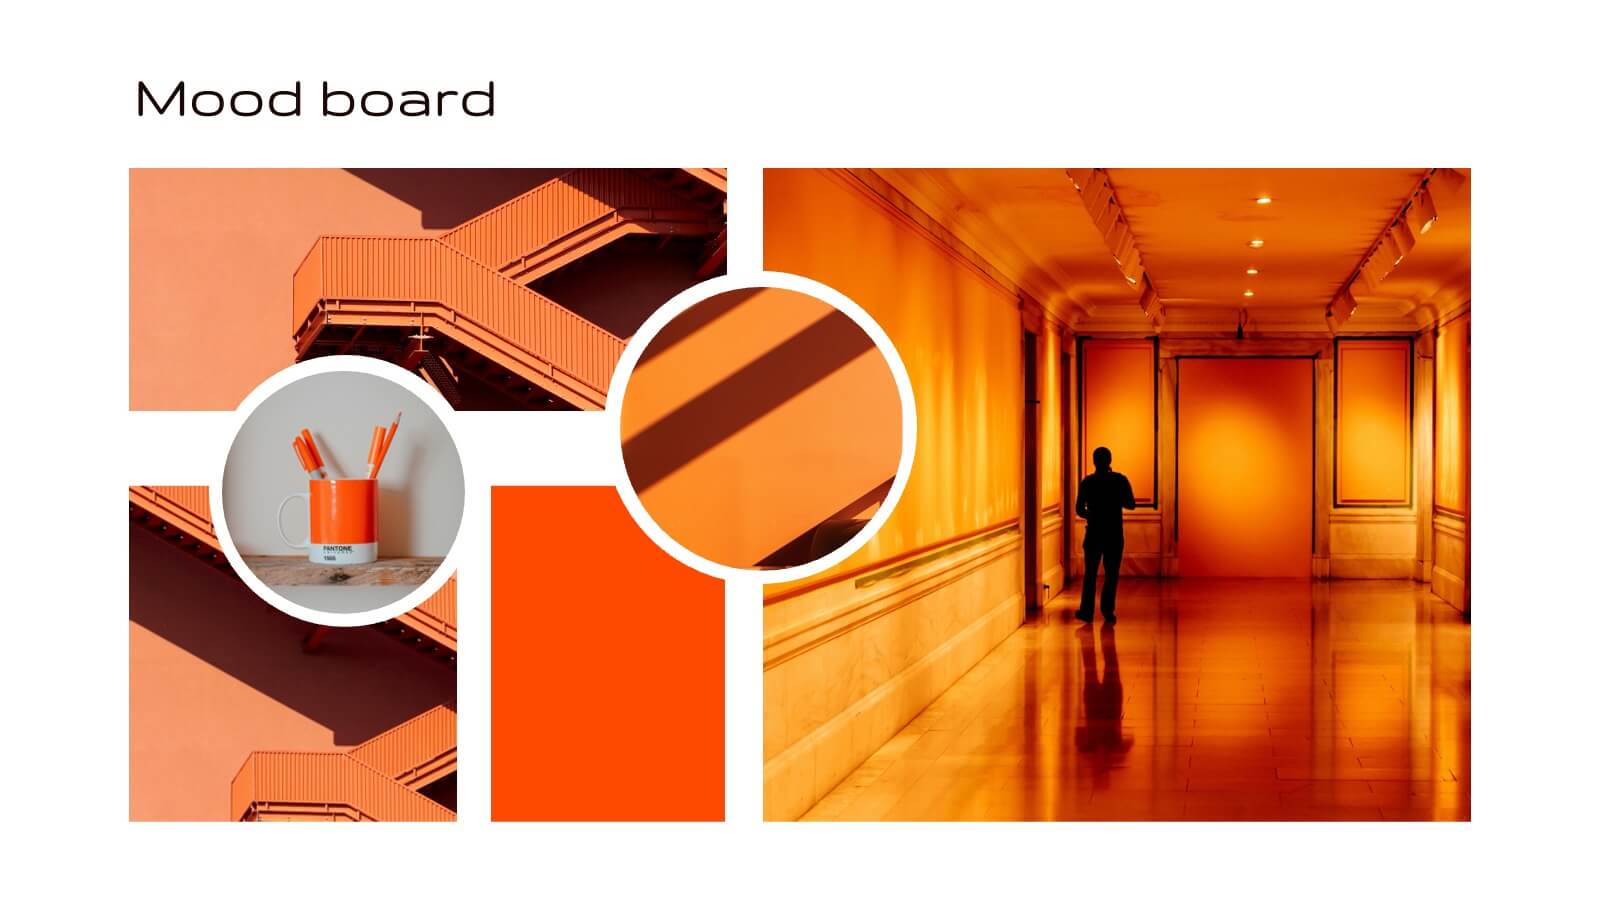
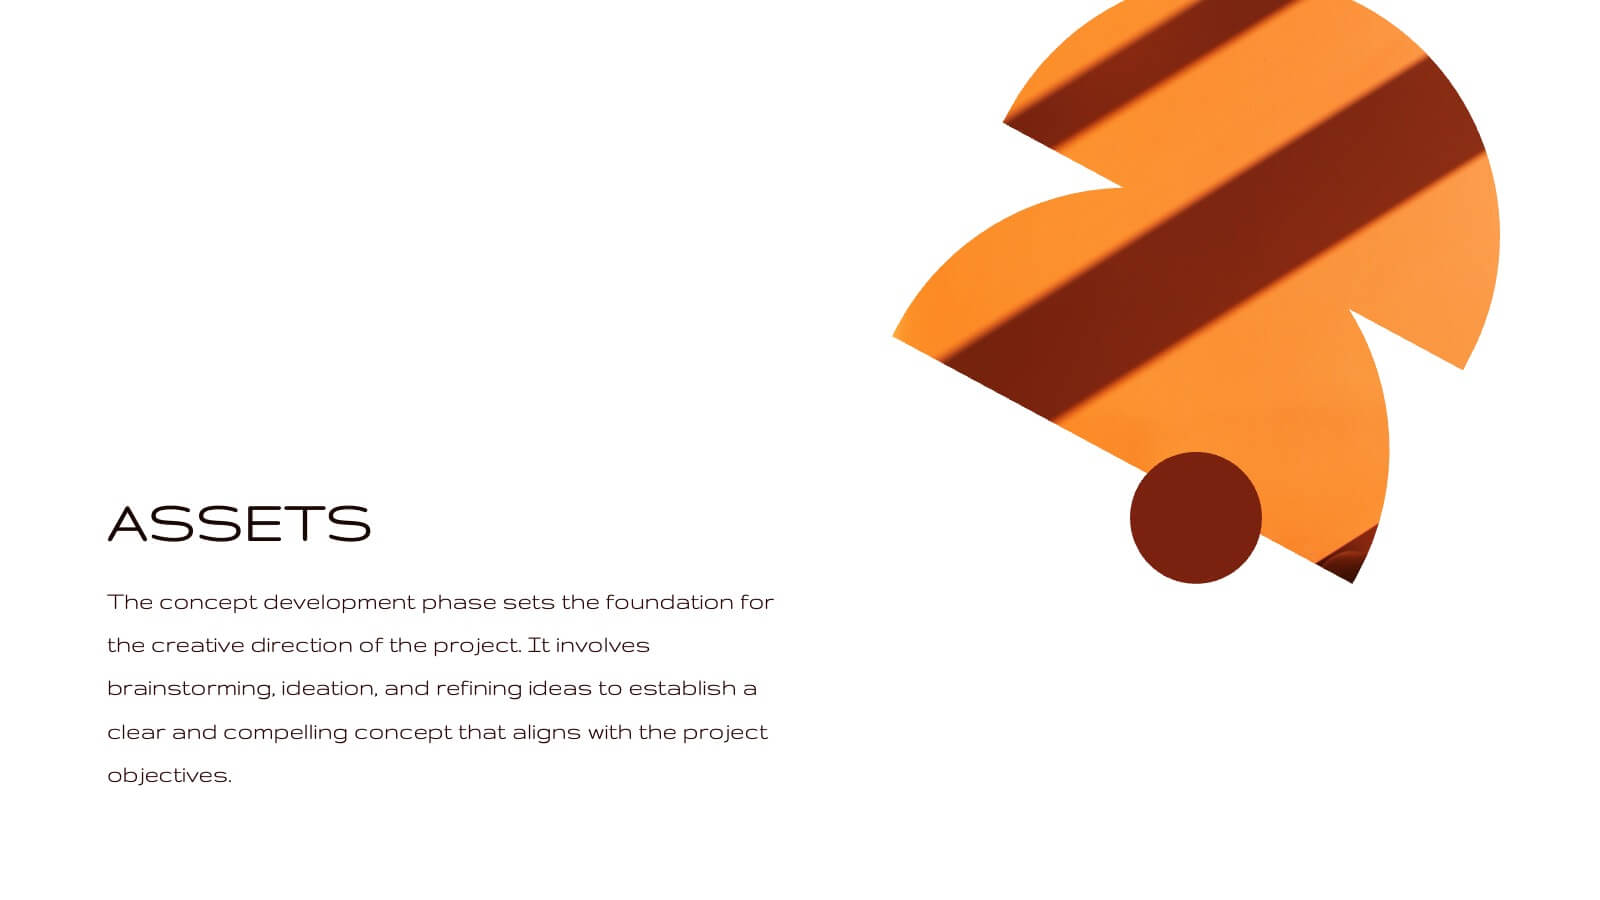
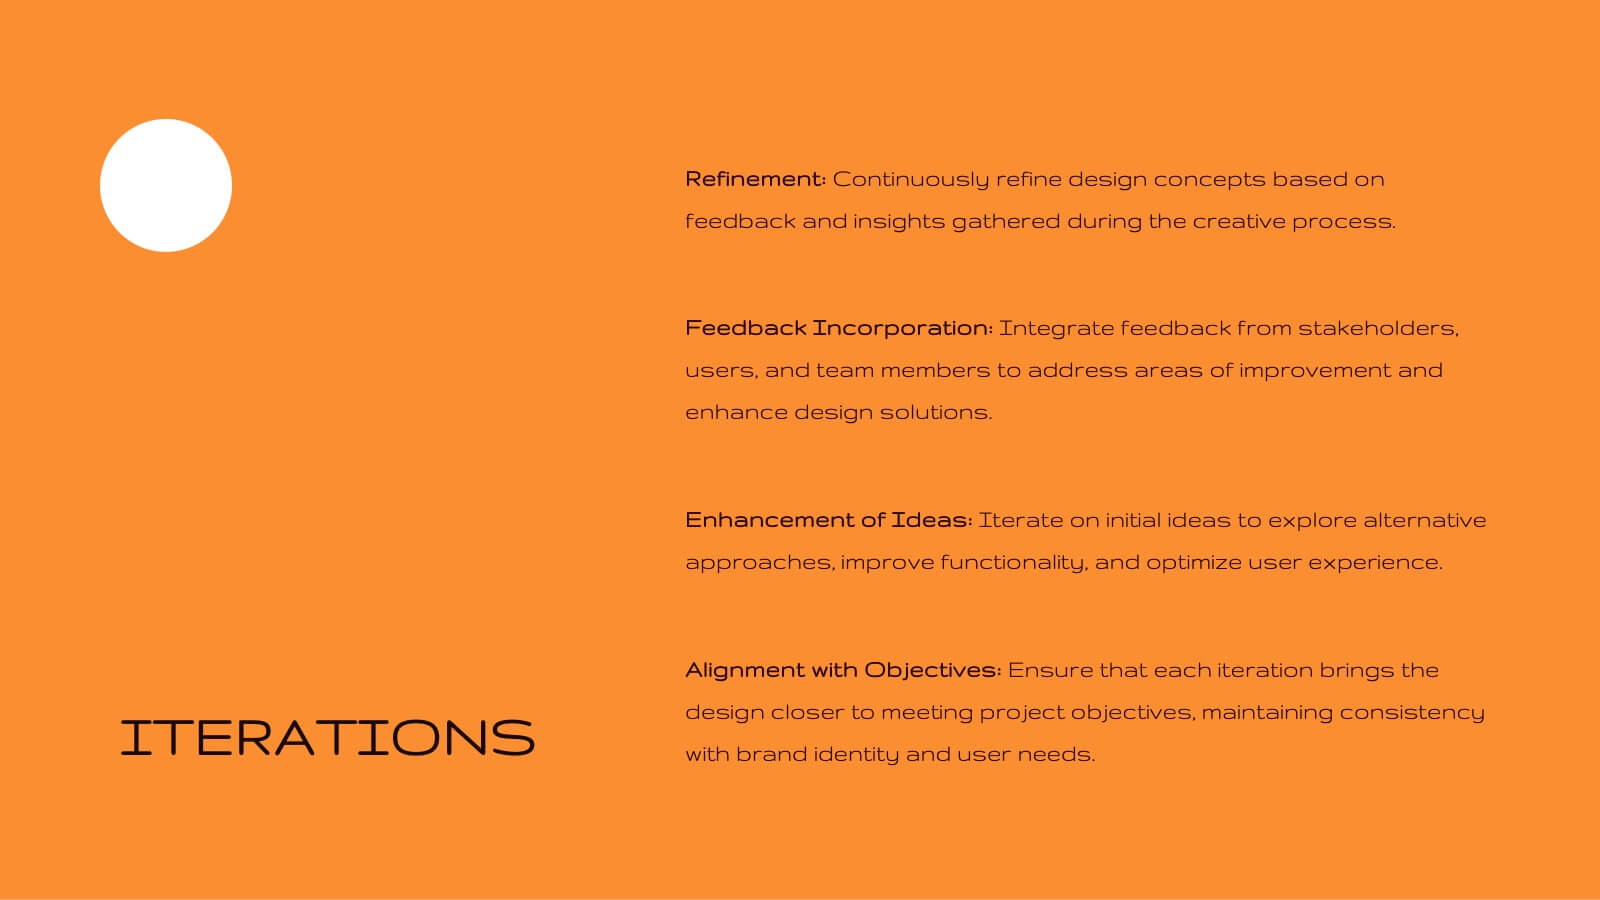
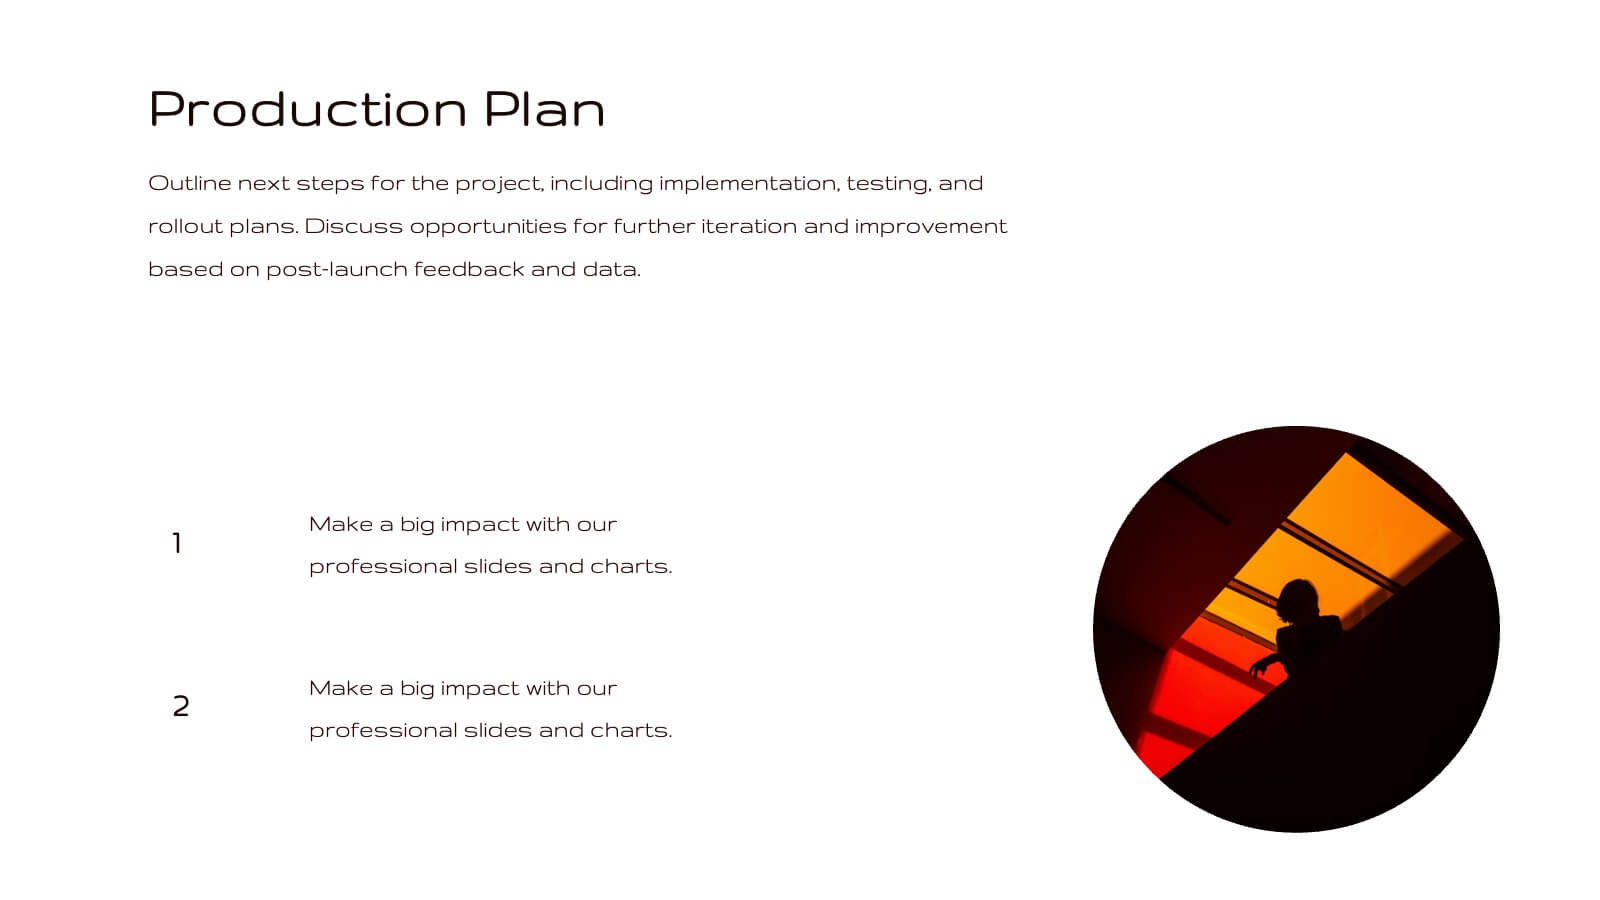
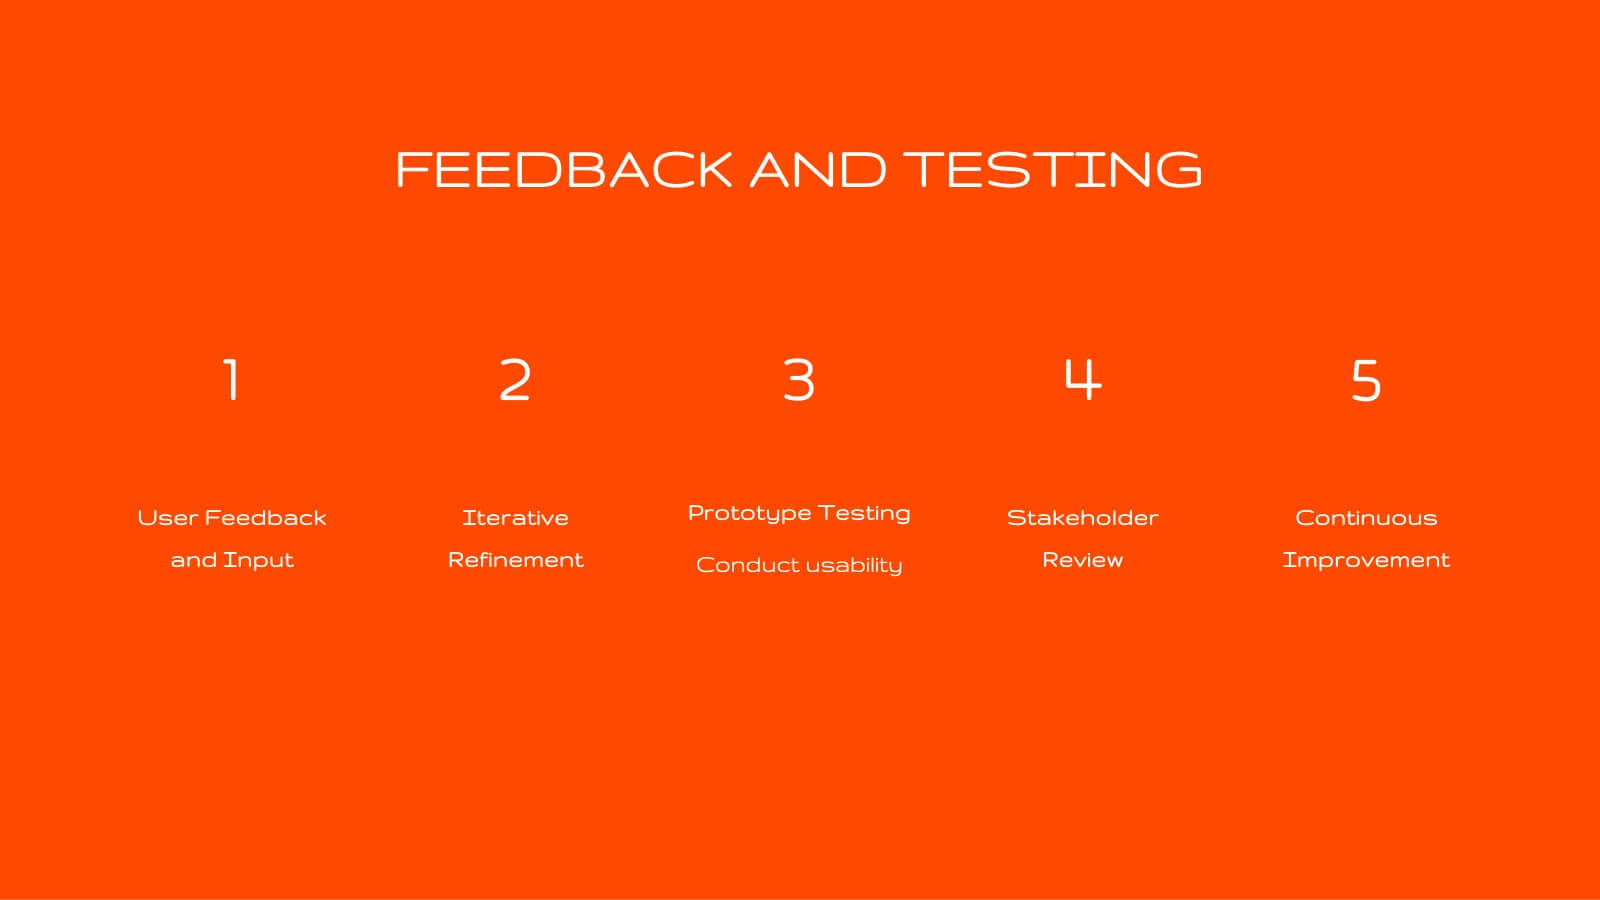
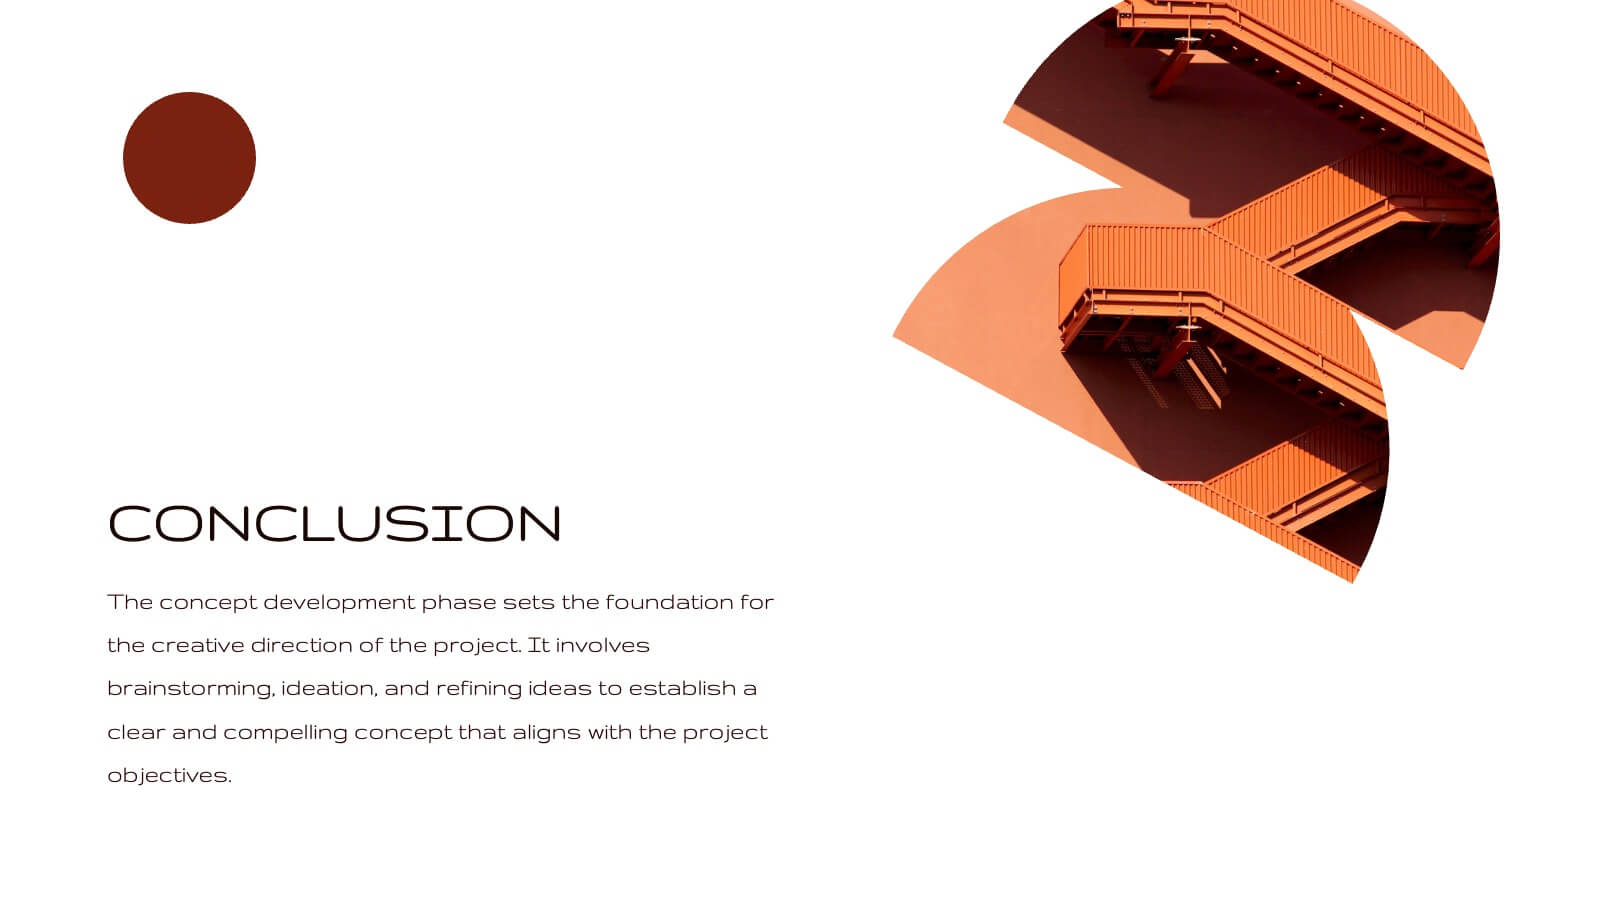
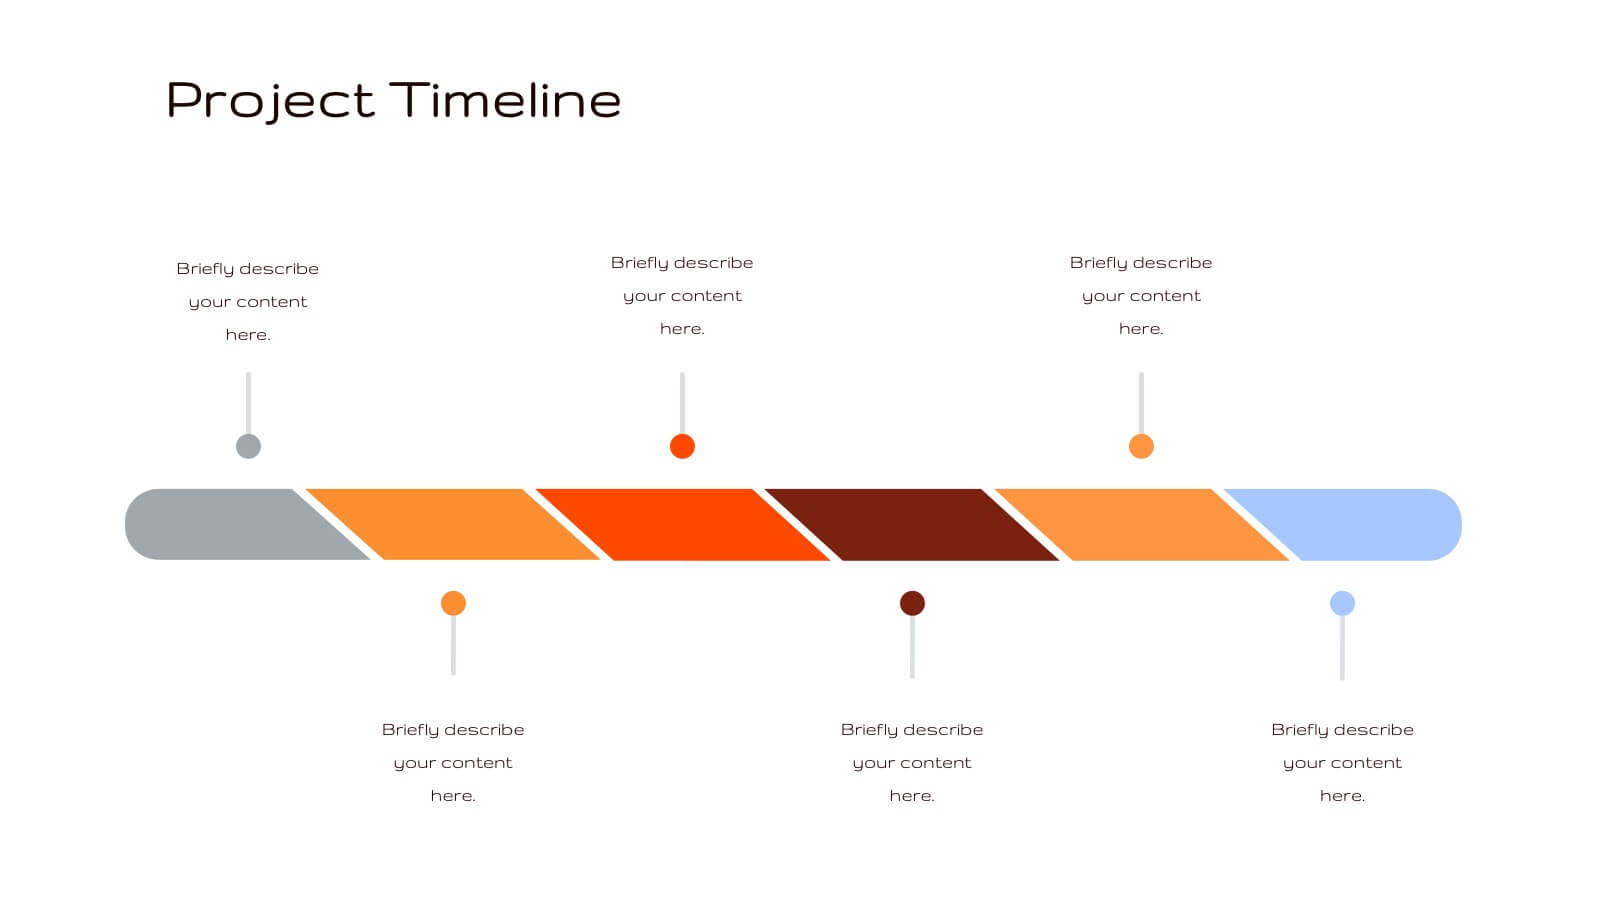
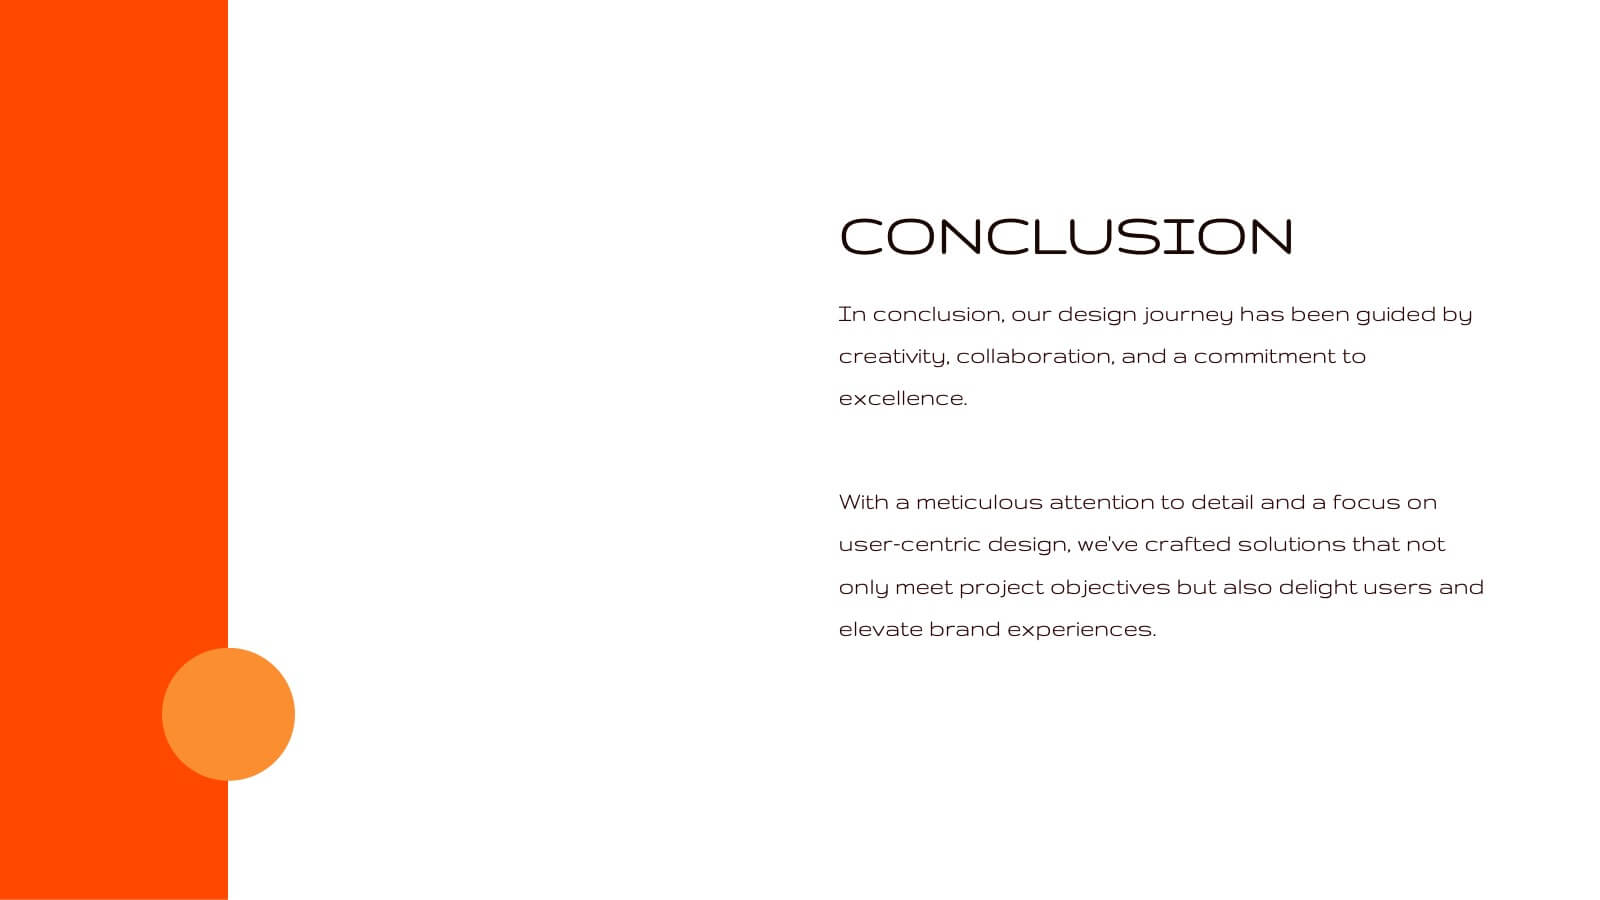
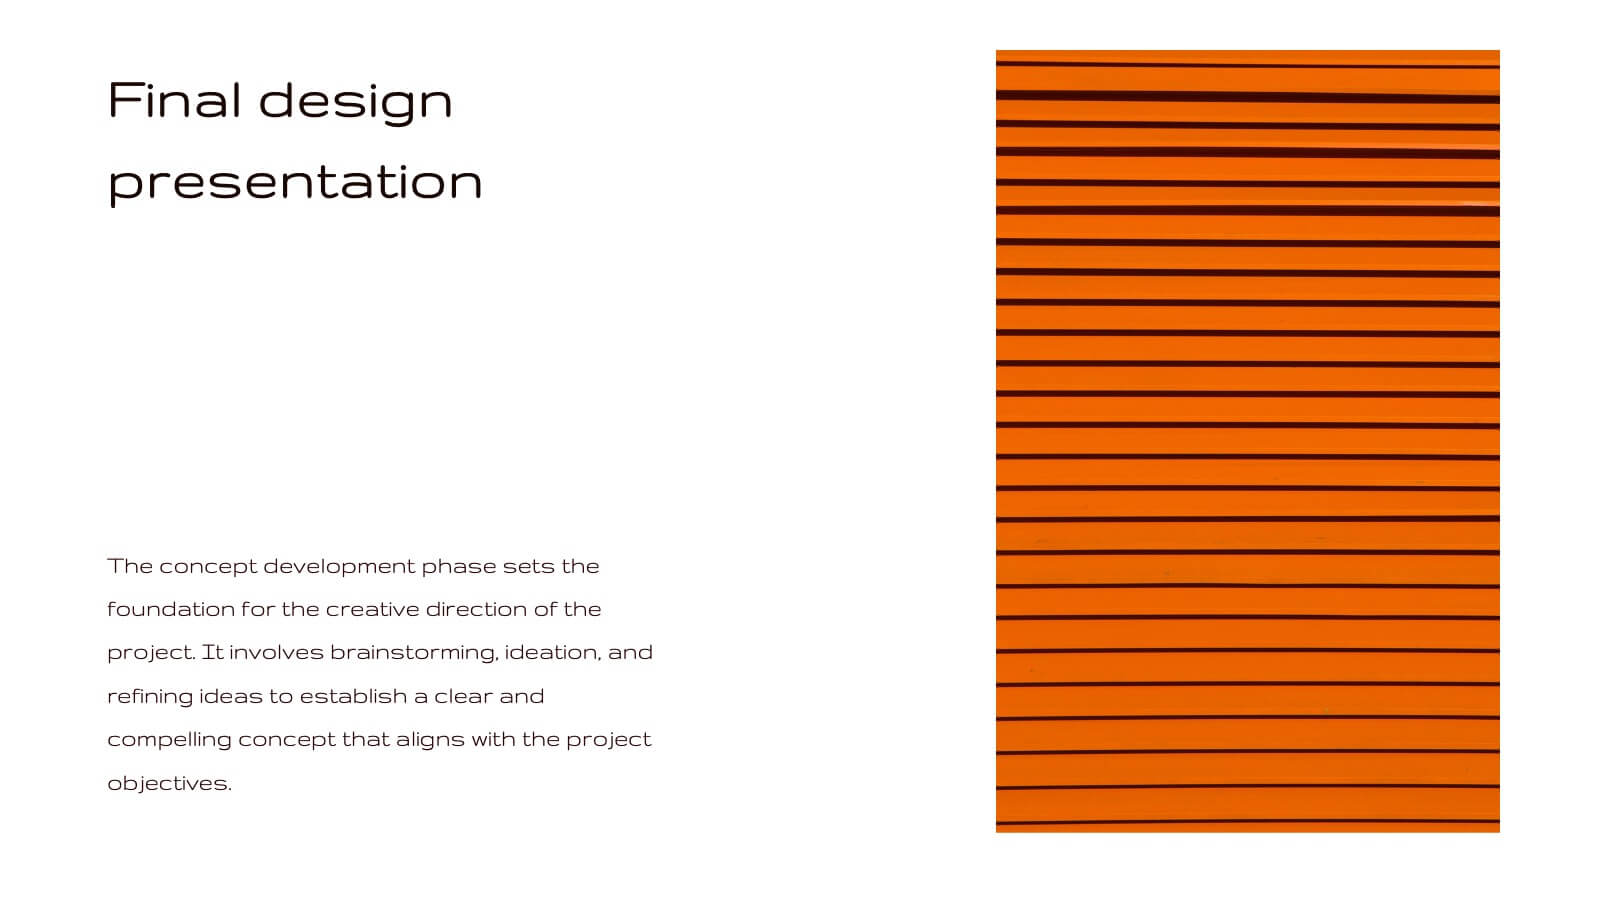
Radiance Creative Design Report Presentation
Bring your design ideas to life with this vibrant, engaging presentation template. Ideal for showcasing creative processes, concept development, and project timelines, it features a striking color palette and clean layout. This template is designed to captivate your audience and clearly communicate your design vision. Compatible with PowerPoint, Keynote, and Google Slides, it’s perfect for any platform.


4 diapositivas
Veterinary Services and Animal Care Presentation
Deliver professional insights with compassion using the Veterinary Services and Animal Care presentation. This slide features a clean, pet-centered illustration layout ideal for showcasing services such as treatment, grooming, preventive care, and boarding. Each section includes editable icons and placeholder text, making it easy to customize for veterinary clinics, pet hospitals, or animal wellness campaigns. Fully compatible with PowerPoint, Keynote, and Google Slides.


10 diapositivas
Logistics and Procurement Supply Chain
Streamline your supply chain narrative with this clean, visual timeline layout. Perfect for operations managers, logistics planners, or procurement leads, this slide breaks down each stage of the supply chain process with color-coded segments and intuitive icons. Fully editable in PowerPoint, Keynote, and Google Slides.


21 diapositivas
Sol Photography Portfolio Template Presentation
Showcase your creative work with this vibrant photography portfolio presentation template. It features sections for introductions, project descriptions, and accolades, making it perfect for photographers looking to display their style and collaborations. Compatible with PowerPoint, Google Slides, and Keynote, this template is designed to impress viewers with its dynamic layout and bright color scheme.


5 diapositivas
Business KPI Performance Presentation
Bring your business results to life with a clear, modern layout designed to showcase key metrics and performance goals. Perfect for tracking growth, progress, and success indicators, this visual design helps make data easy to understand and engaging. Fully editable in PowerPoint, Keynote, and Google Slides.


4 diapositivas
Business Partnership Development Presentation
Showcase key elements of collaboration with the Business Partnership Development Presentation. This quadrant-style layout is perfect for outlining strategies, stakeholders, or phases of a partnership. Ideal for business proposals, joint ventures, and strategic planning decks. Fully editable in PowerPoint, Keynote, and Google Slides.