


Características


¿Tienes alguna pregunta?
Recomendar


6 diapositivas
Social Media Metrics Dashboard Presentation
Bring your analytics to life with a bold, visual dashboard that makes social performance easy to understand at a glance. This presentation helps you showcase engagement, growth, and platform insights with clean charts and organized data sections. Fully editable and compatible with PowerPoint, Keynote, and Google Slides.


6 diapositivas
Stock Market Trends and Charts Presentation
Turn financial data into a story that’s easy to follow with this clean, professional layout designed to highlight market growth, patterns, and investment insights. Ideal for analysts and educators, it combines charts with sleek visuals. Fully compatible with PowerPoint, Keynote, and Google Slides for effortless customization.


4 diapositivas
E-Learning Module Structure Presentation
Turn your lesson flow into a visual journey your audience can actually follow. This presentation template maps out the structure of an e-learning module with step-by-step clarity—ideal for course creators, instructional designers, or trainers. Easily customize each stage. Fully editable in PowerPoint, Keynote, and Google Slides for flexible use.


5 diapositivas
Annual Achievements and Highlights Presentation
Celebrate your progress with the Annual Achievements and Highlights Presentation. This timeline-style layout guides viewers along a visual path of milestones year by year. Each pin represents a key accomplishment, backed by icons and editable text for context. Perfect for end-of-year reviews or company retrospectives. Compatible with PowerPoint, Google Slides, and Canva.


28 diapositivas
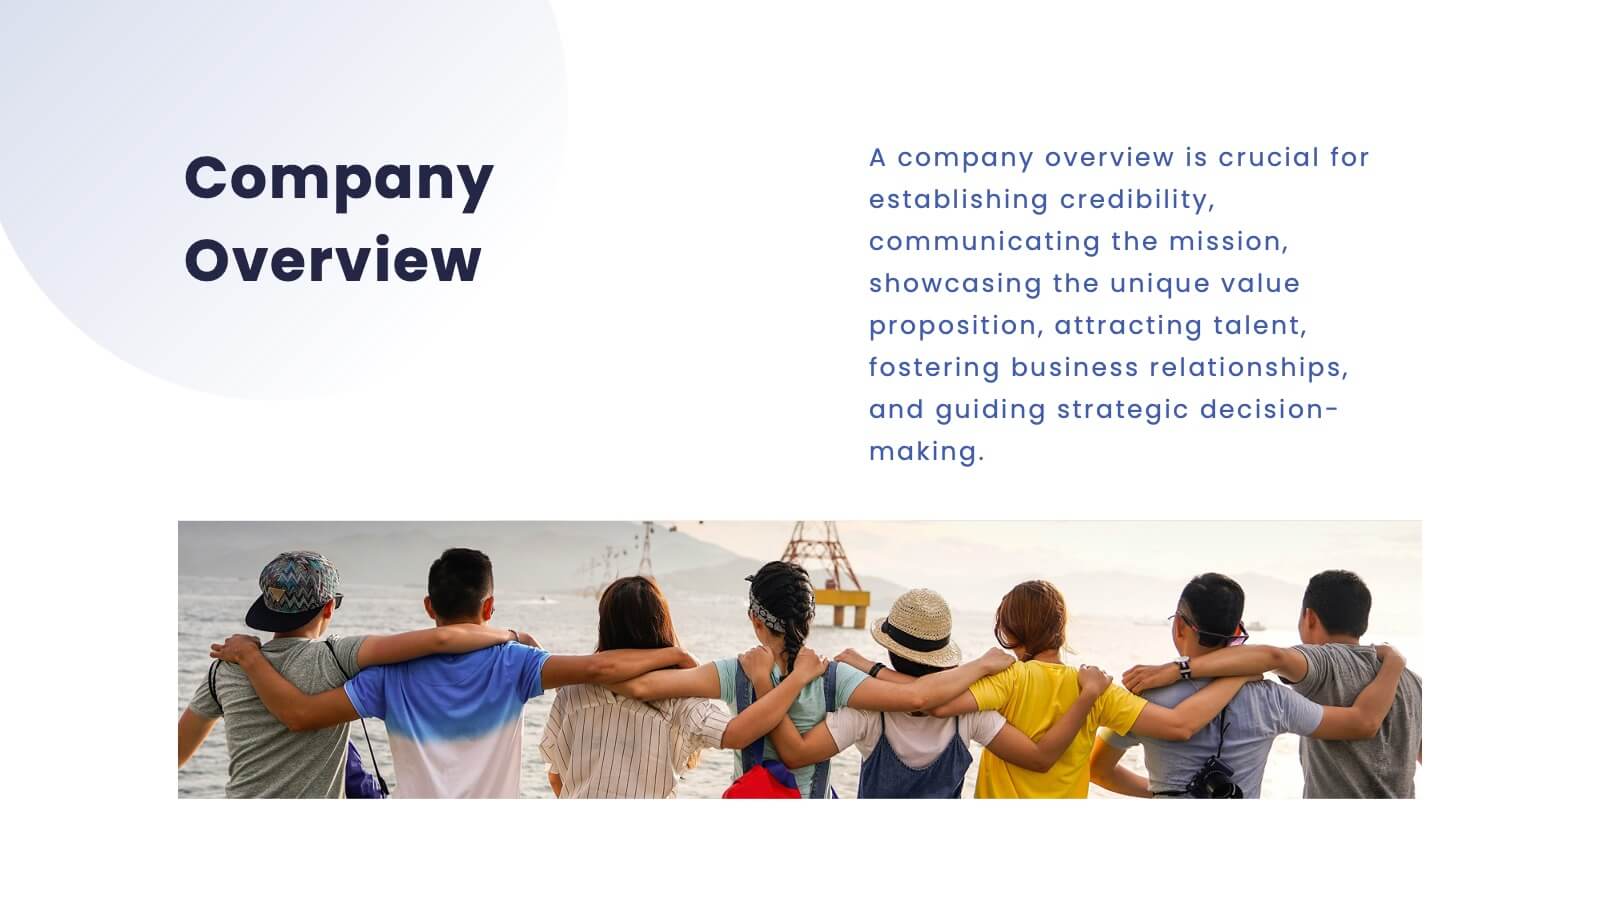
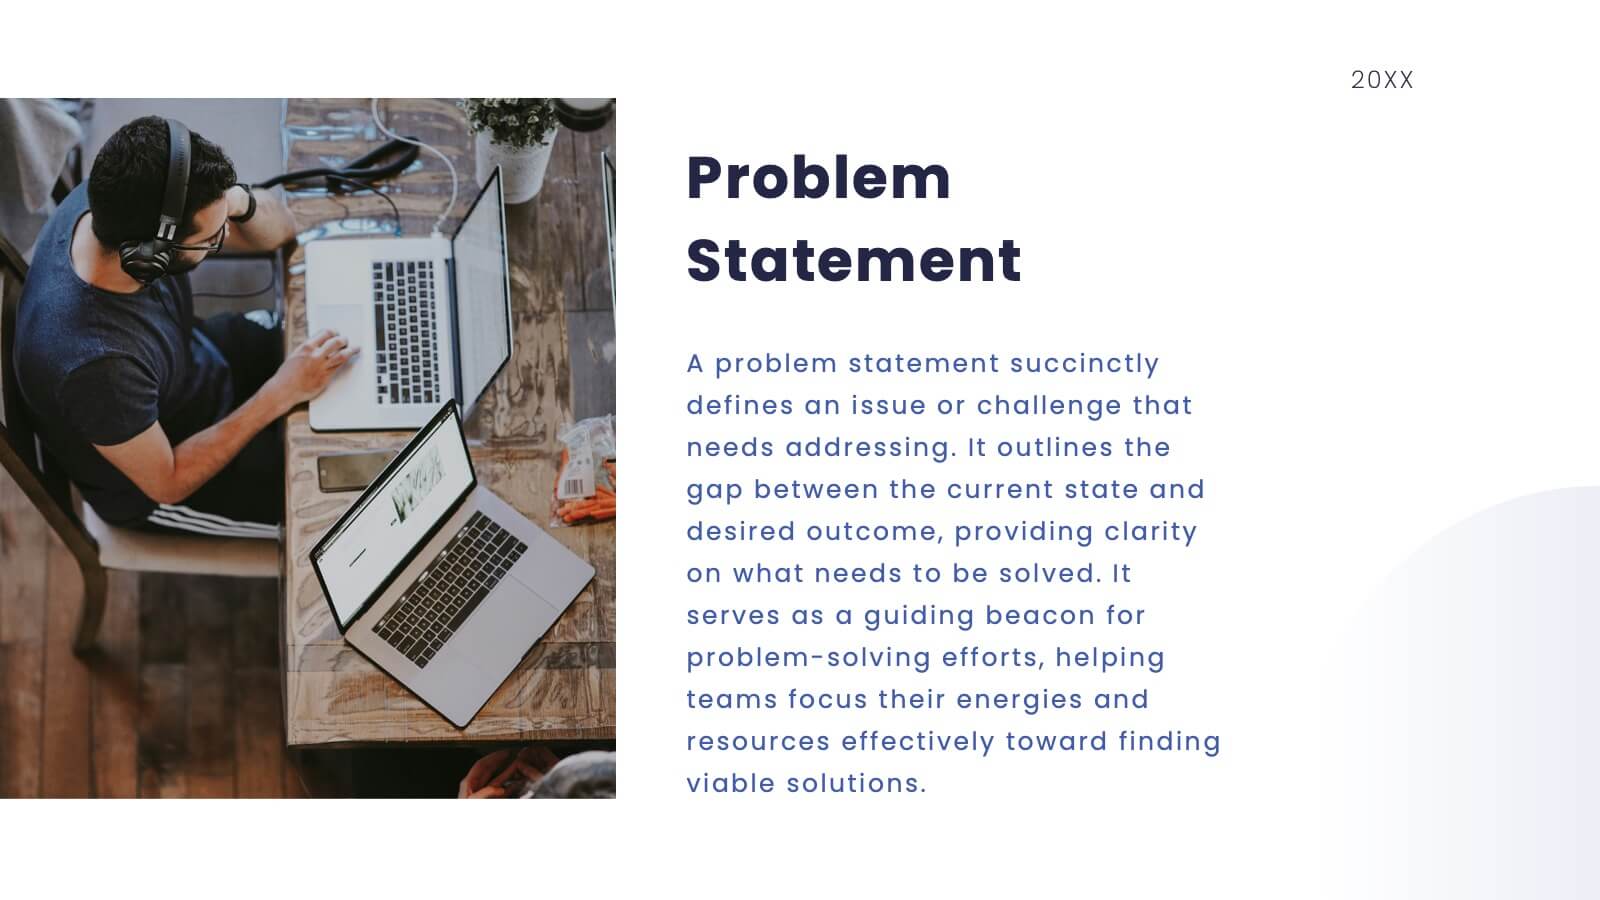
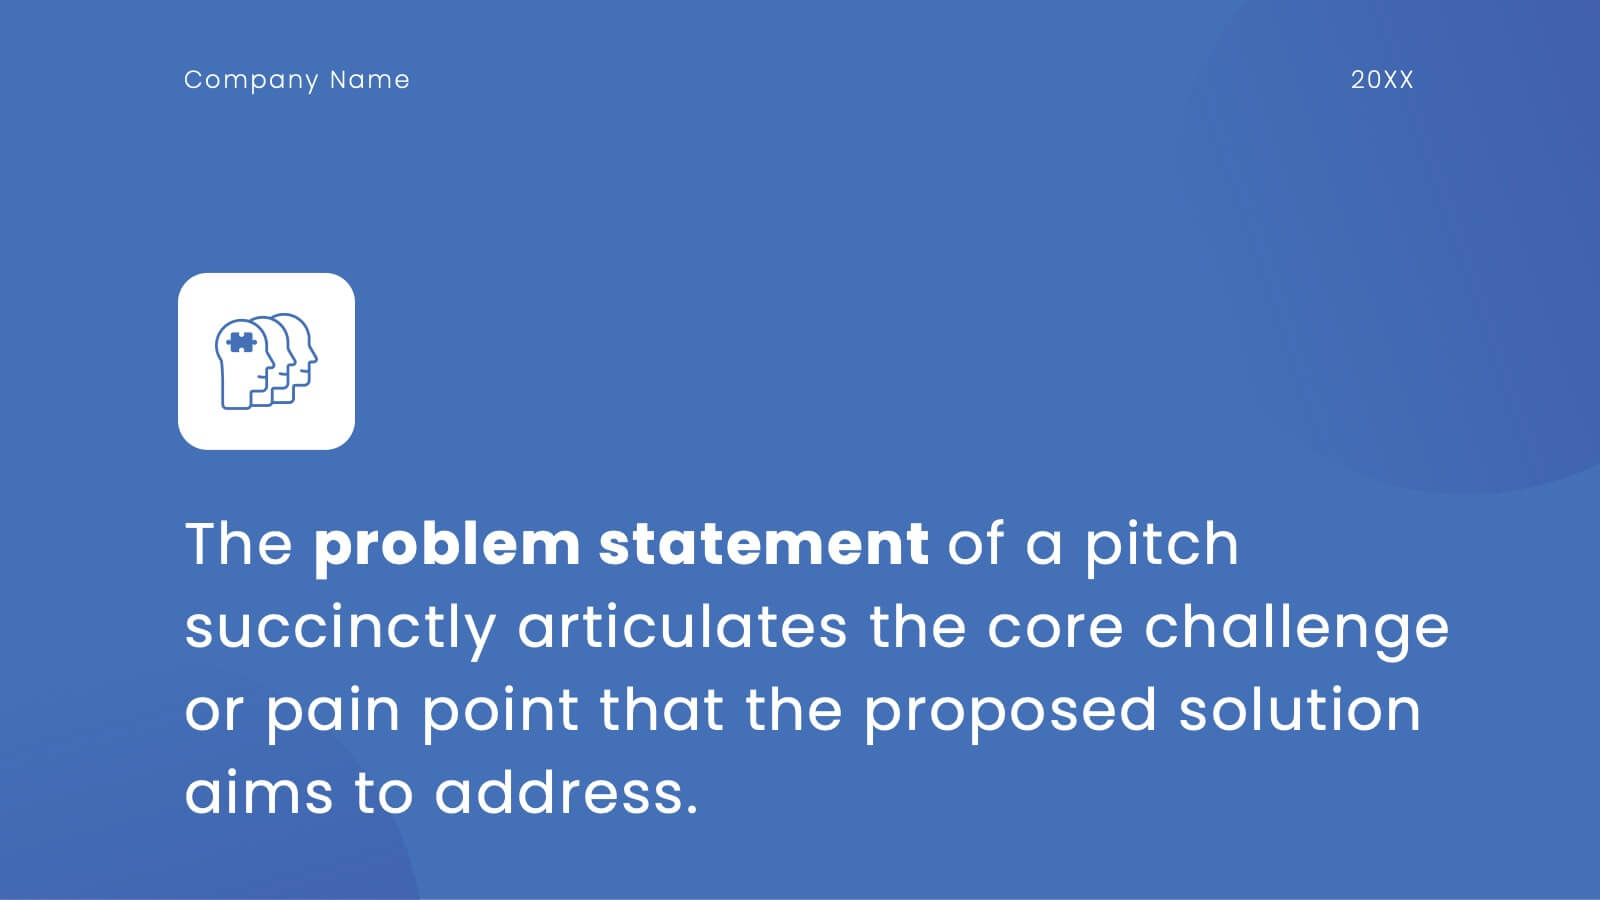
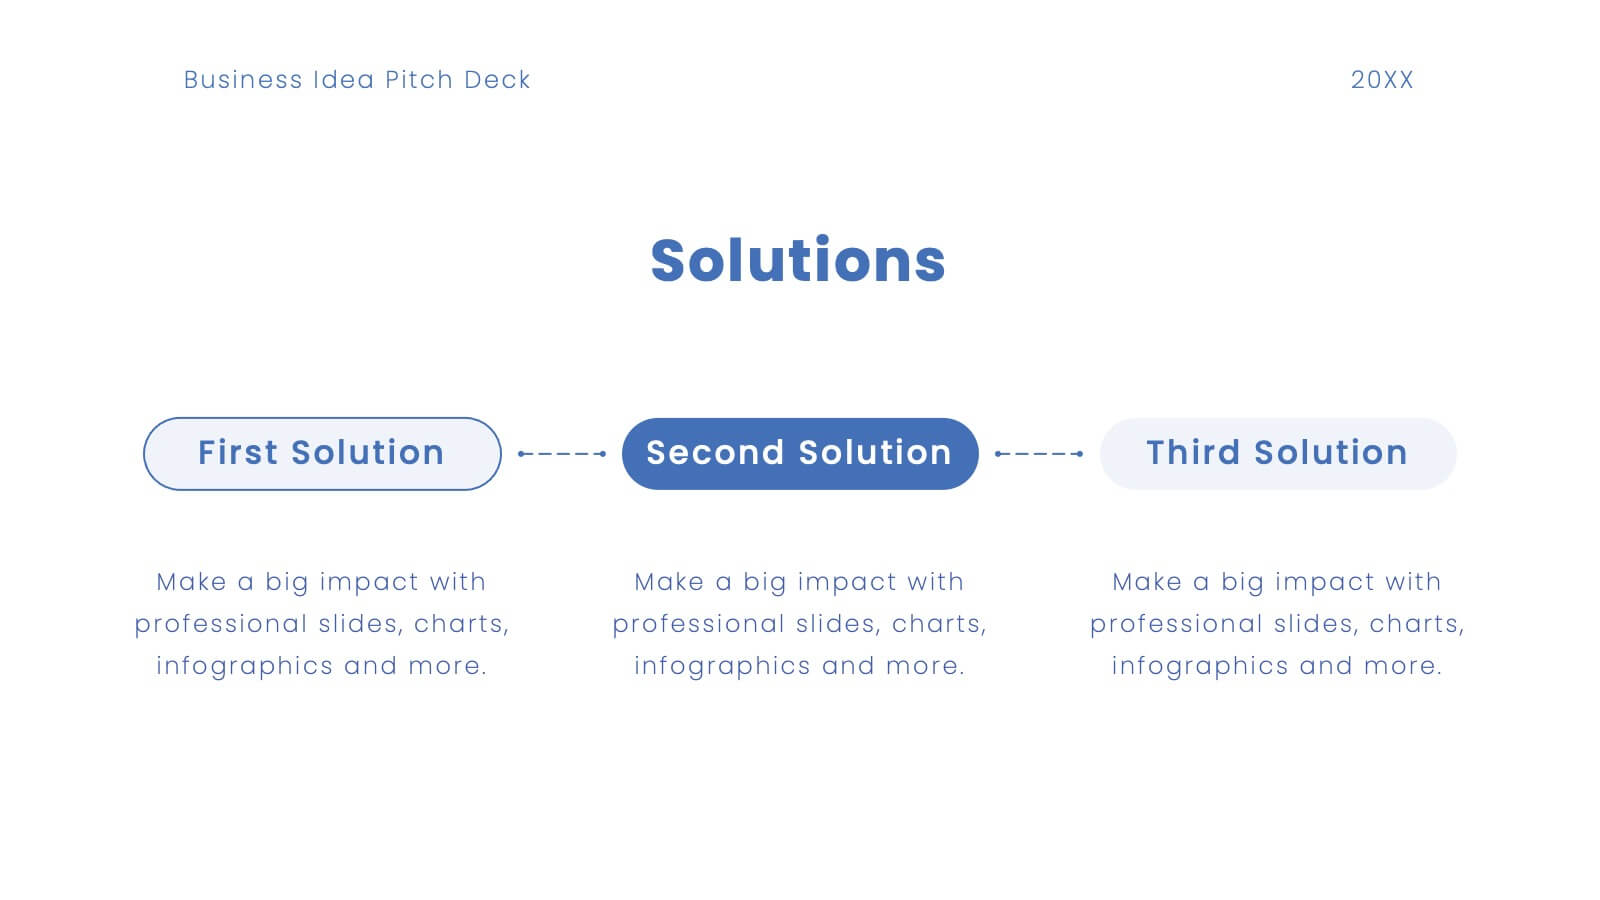
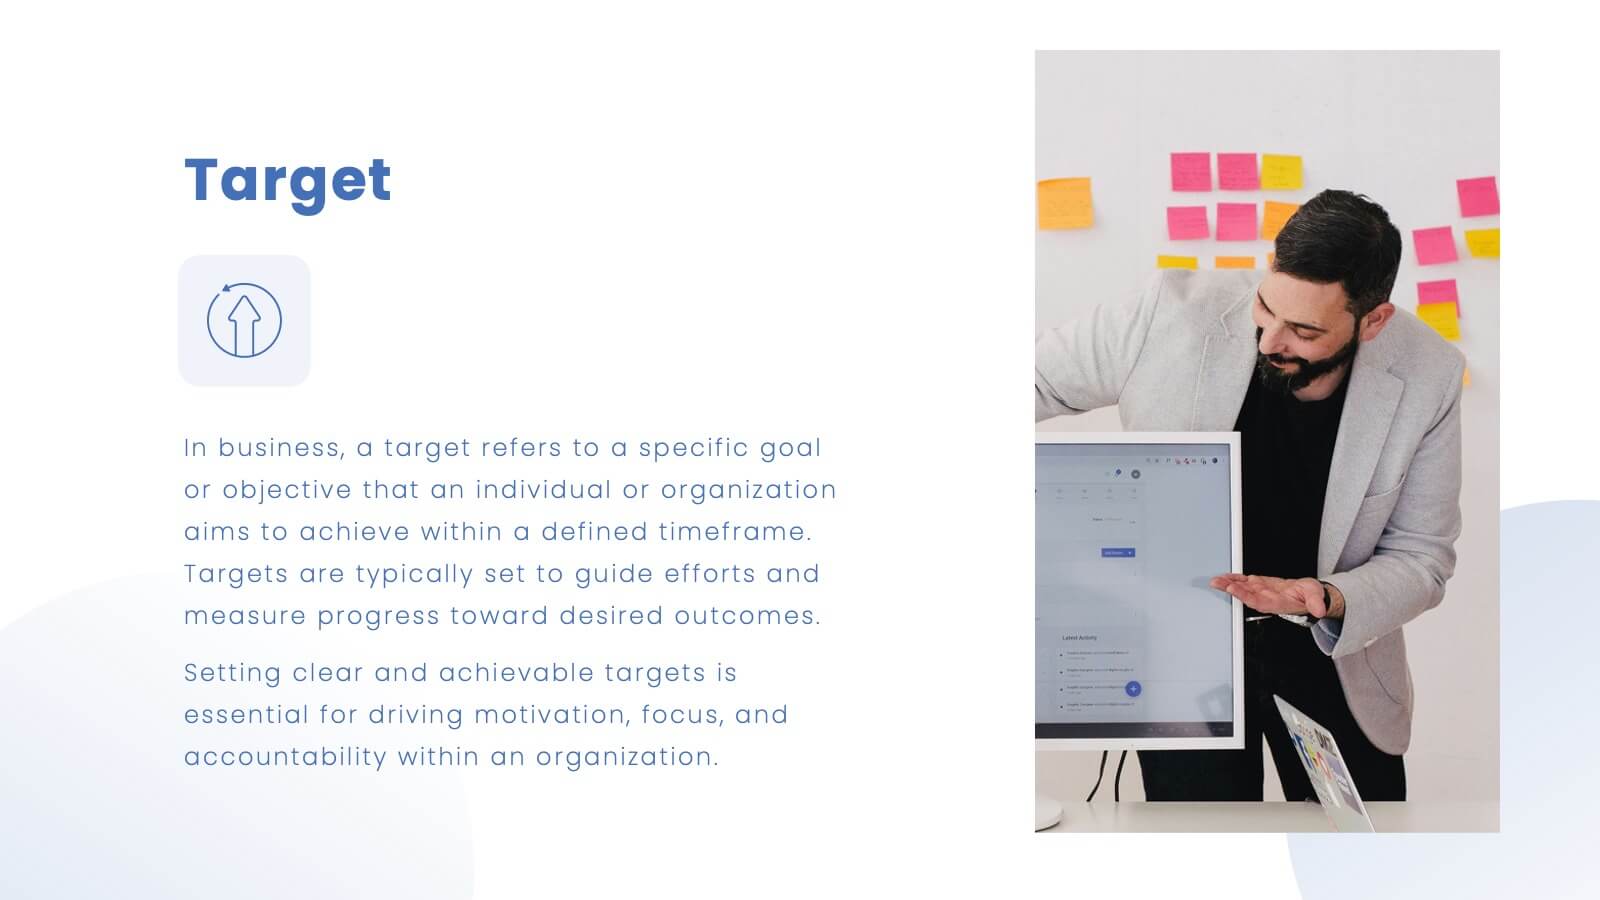
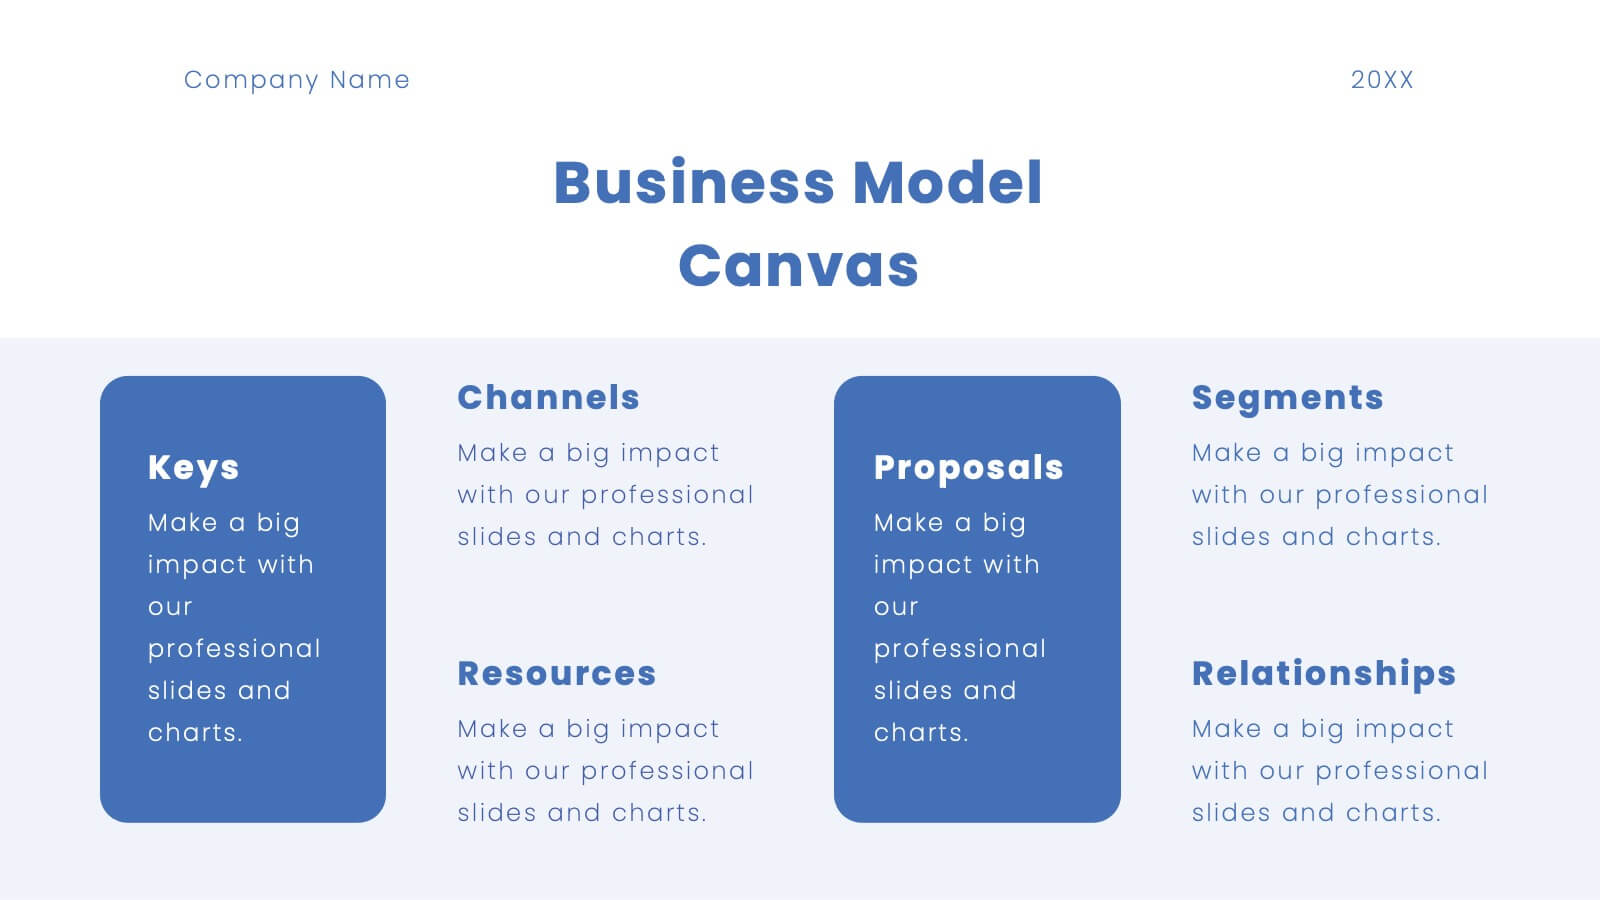
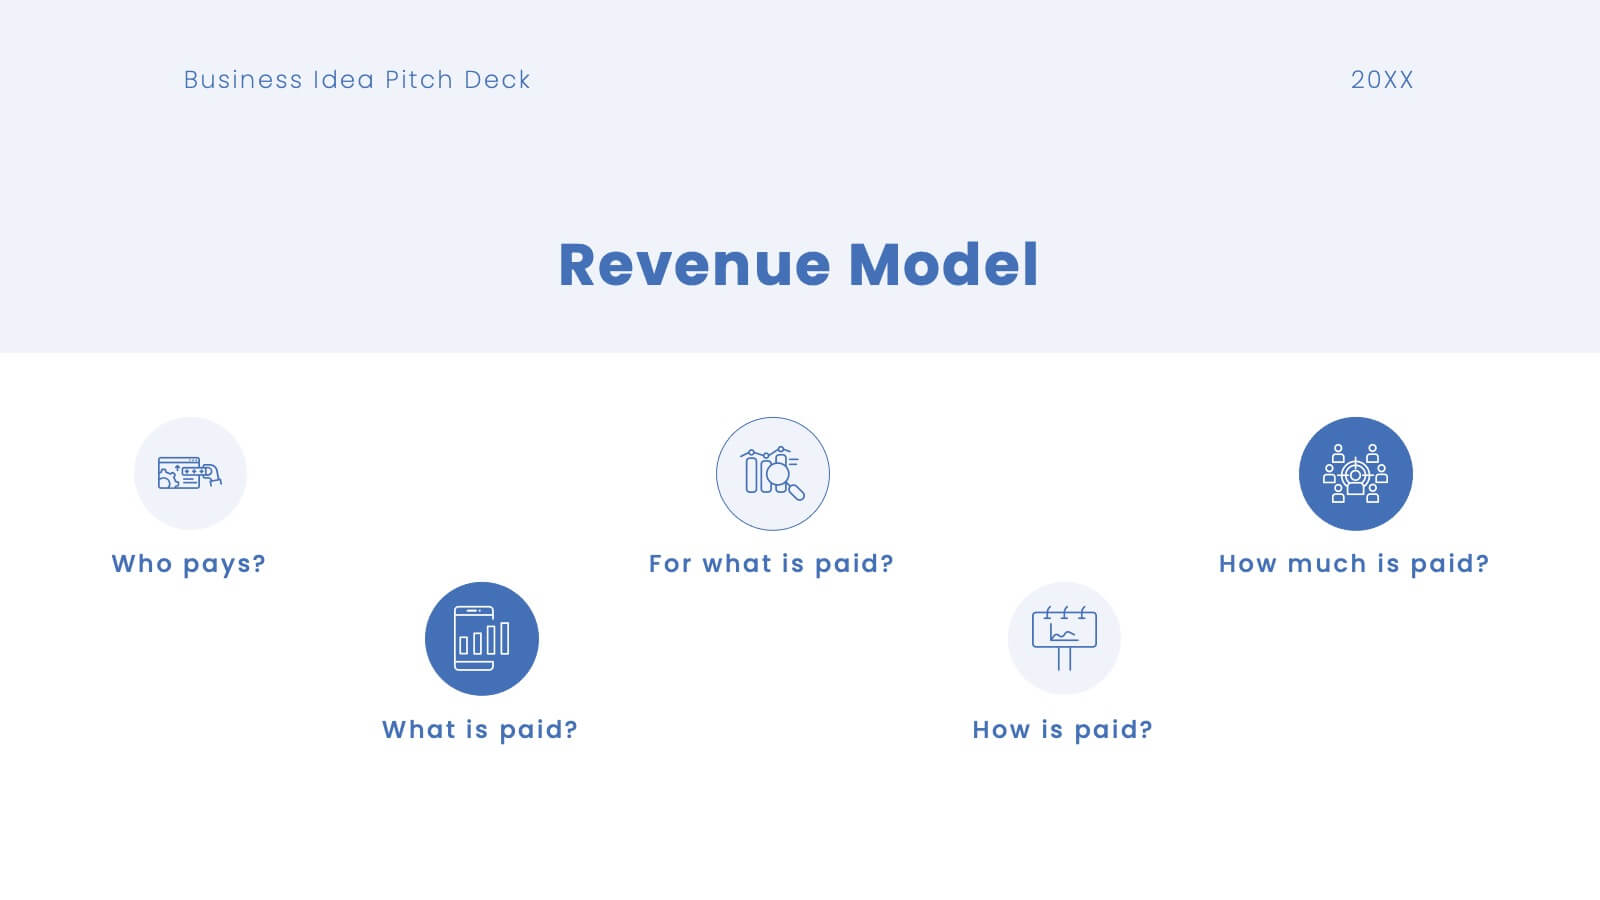
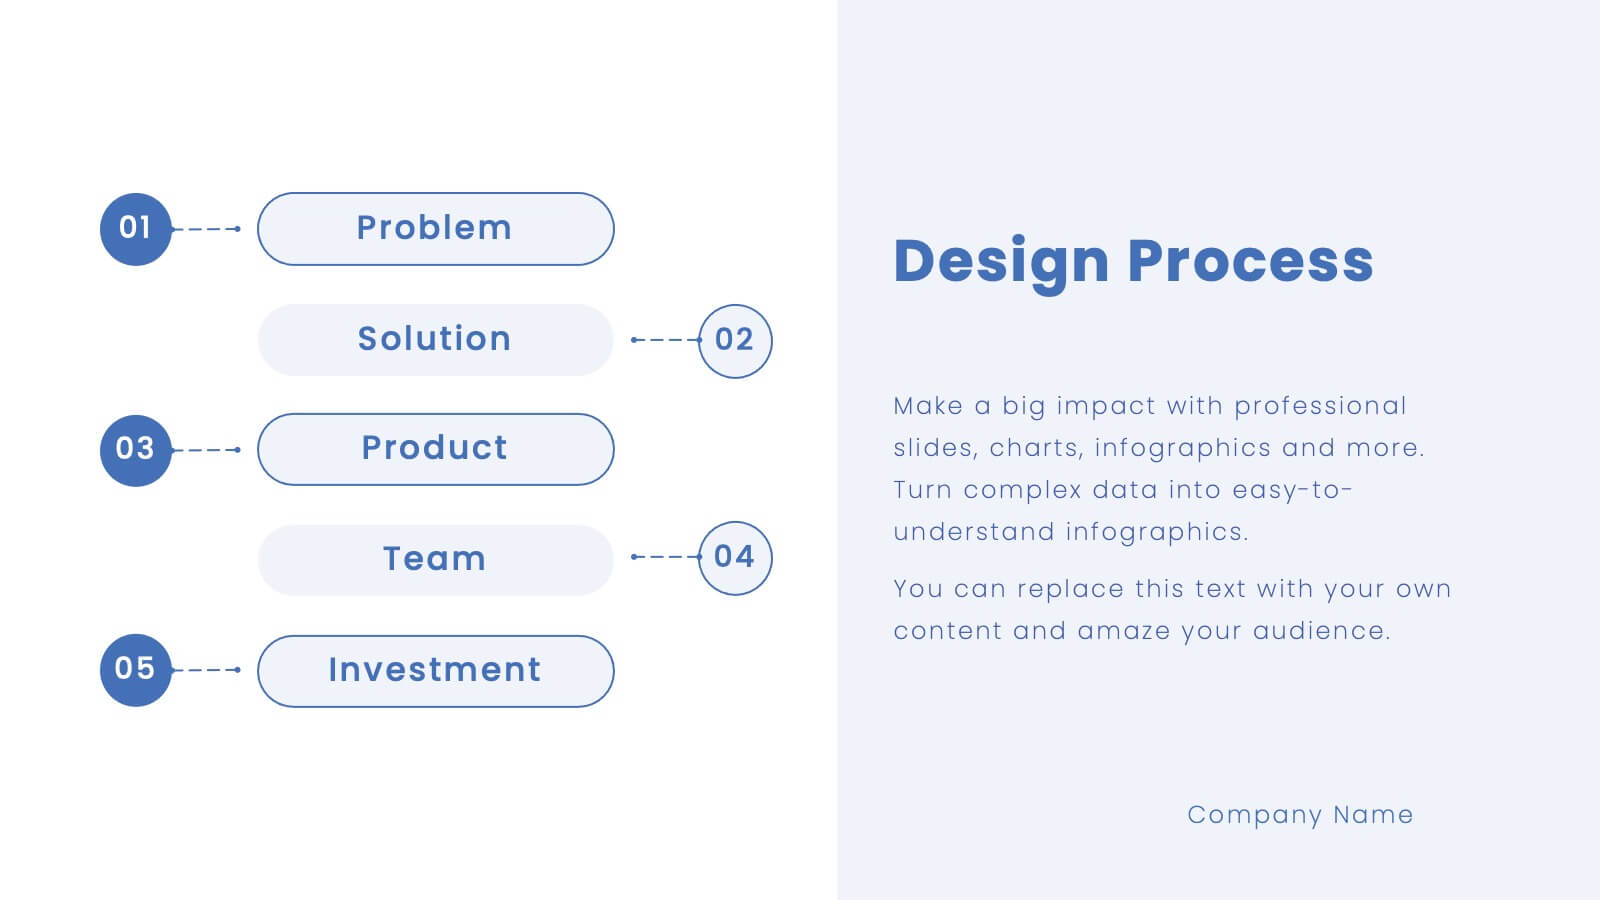
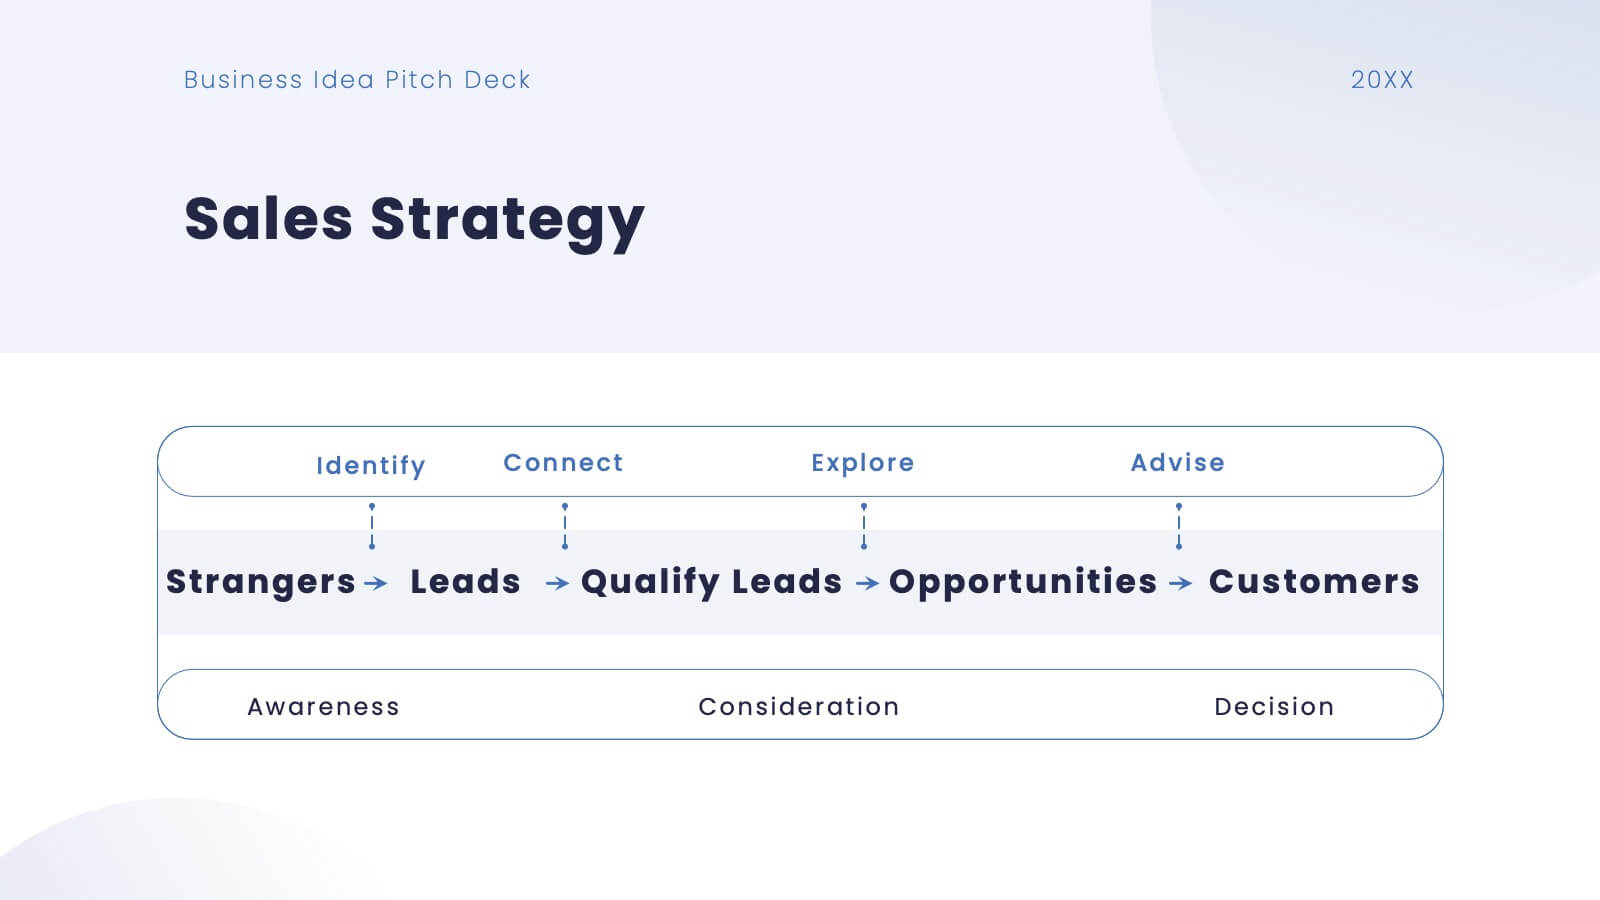
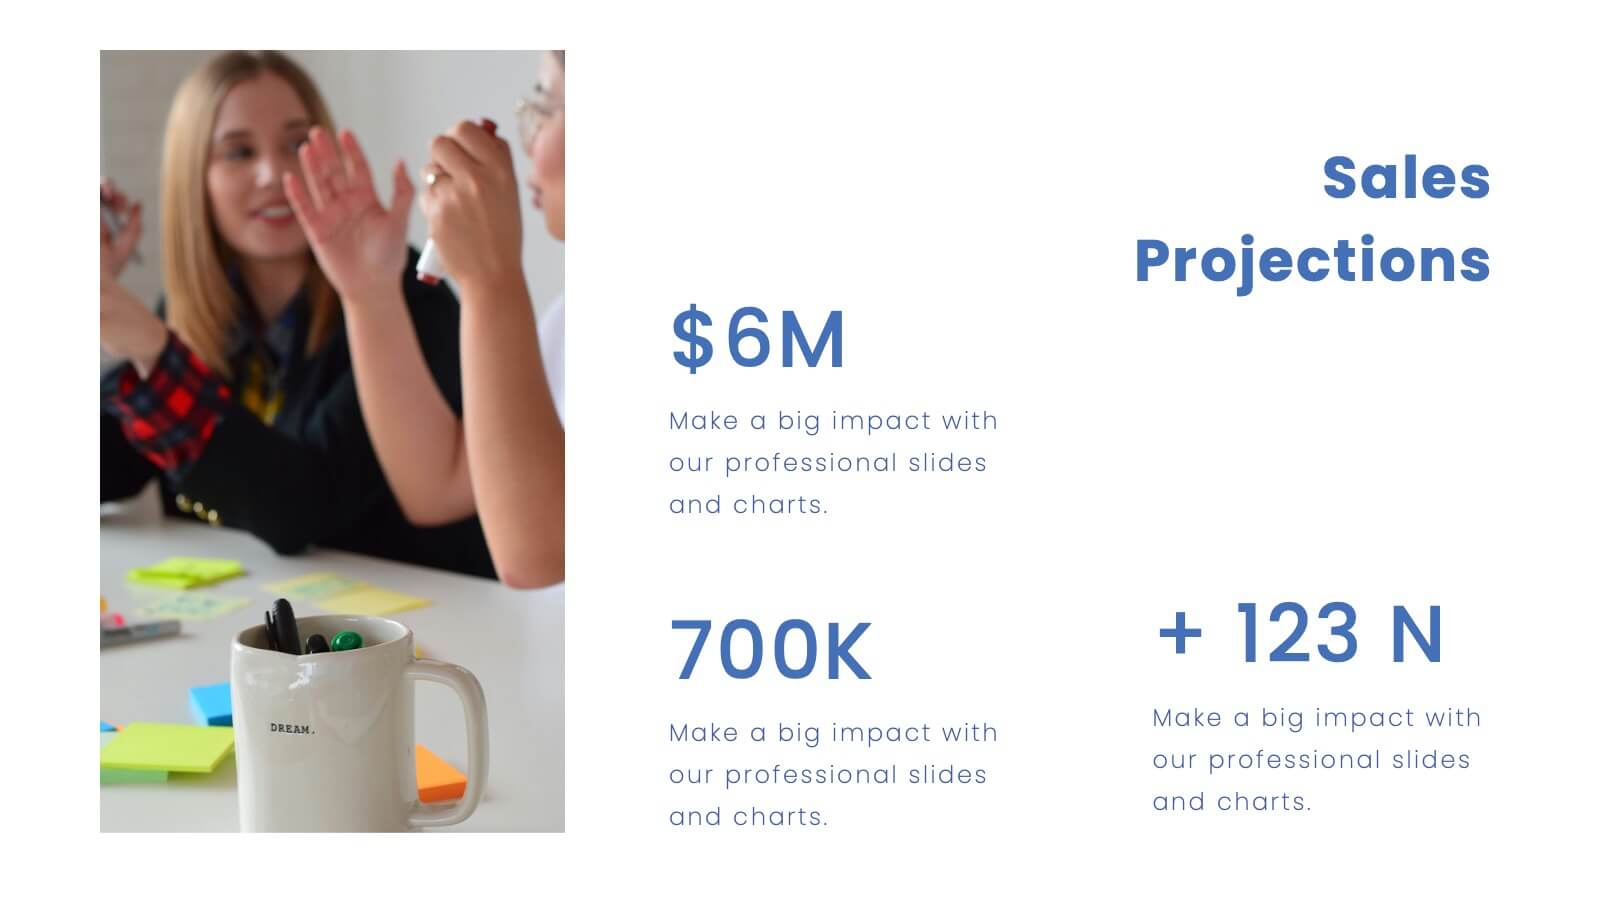
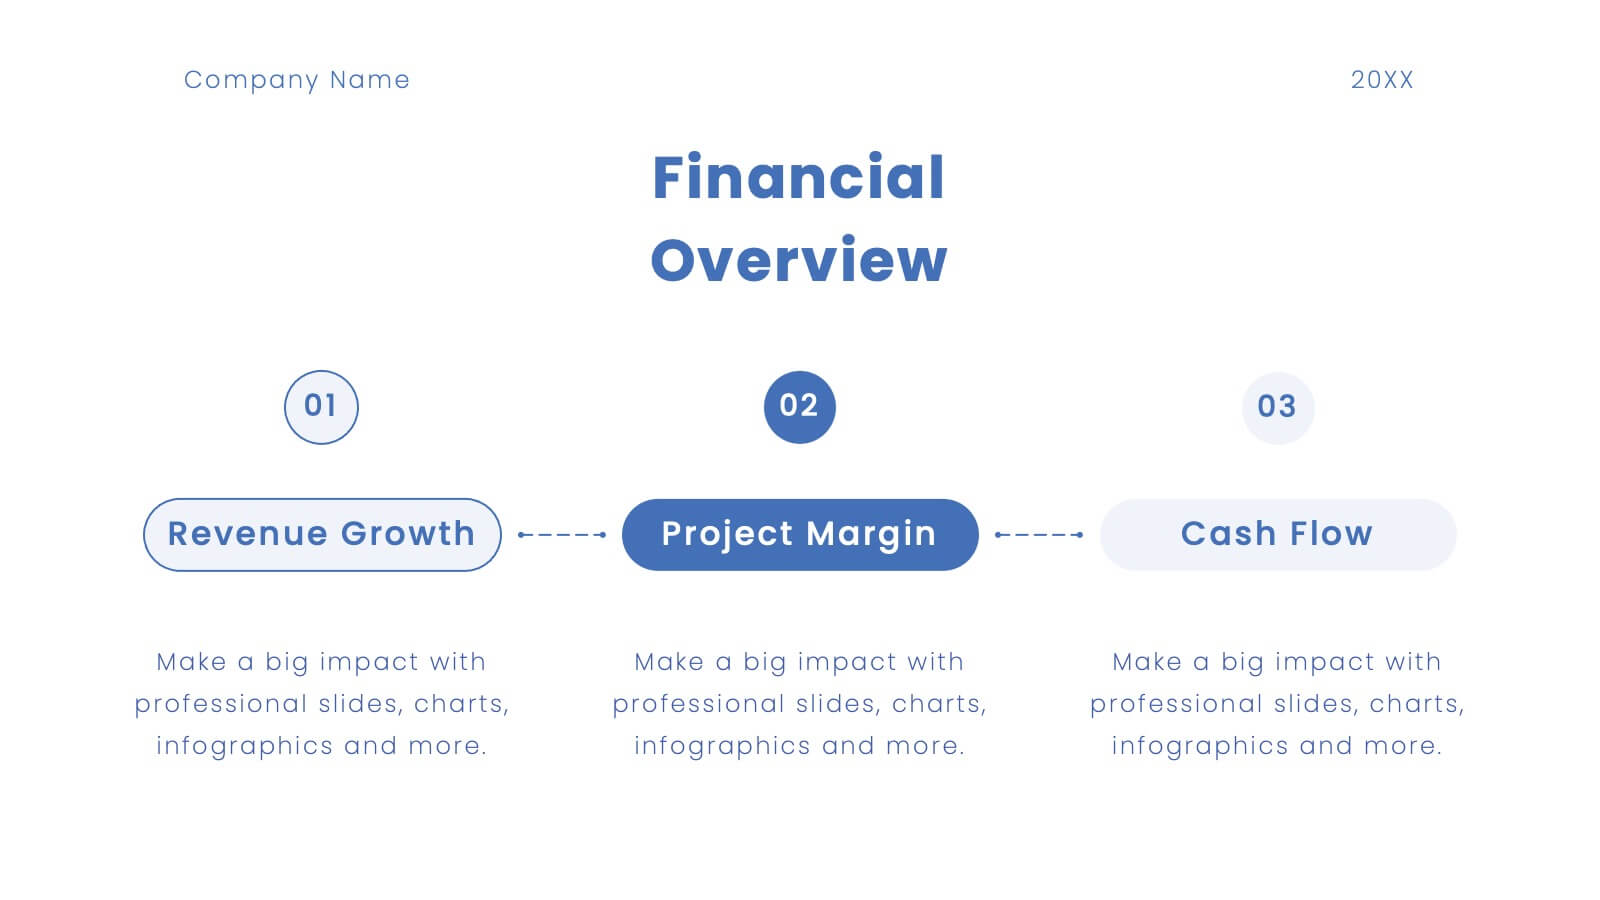
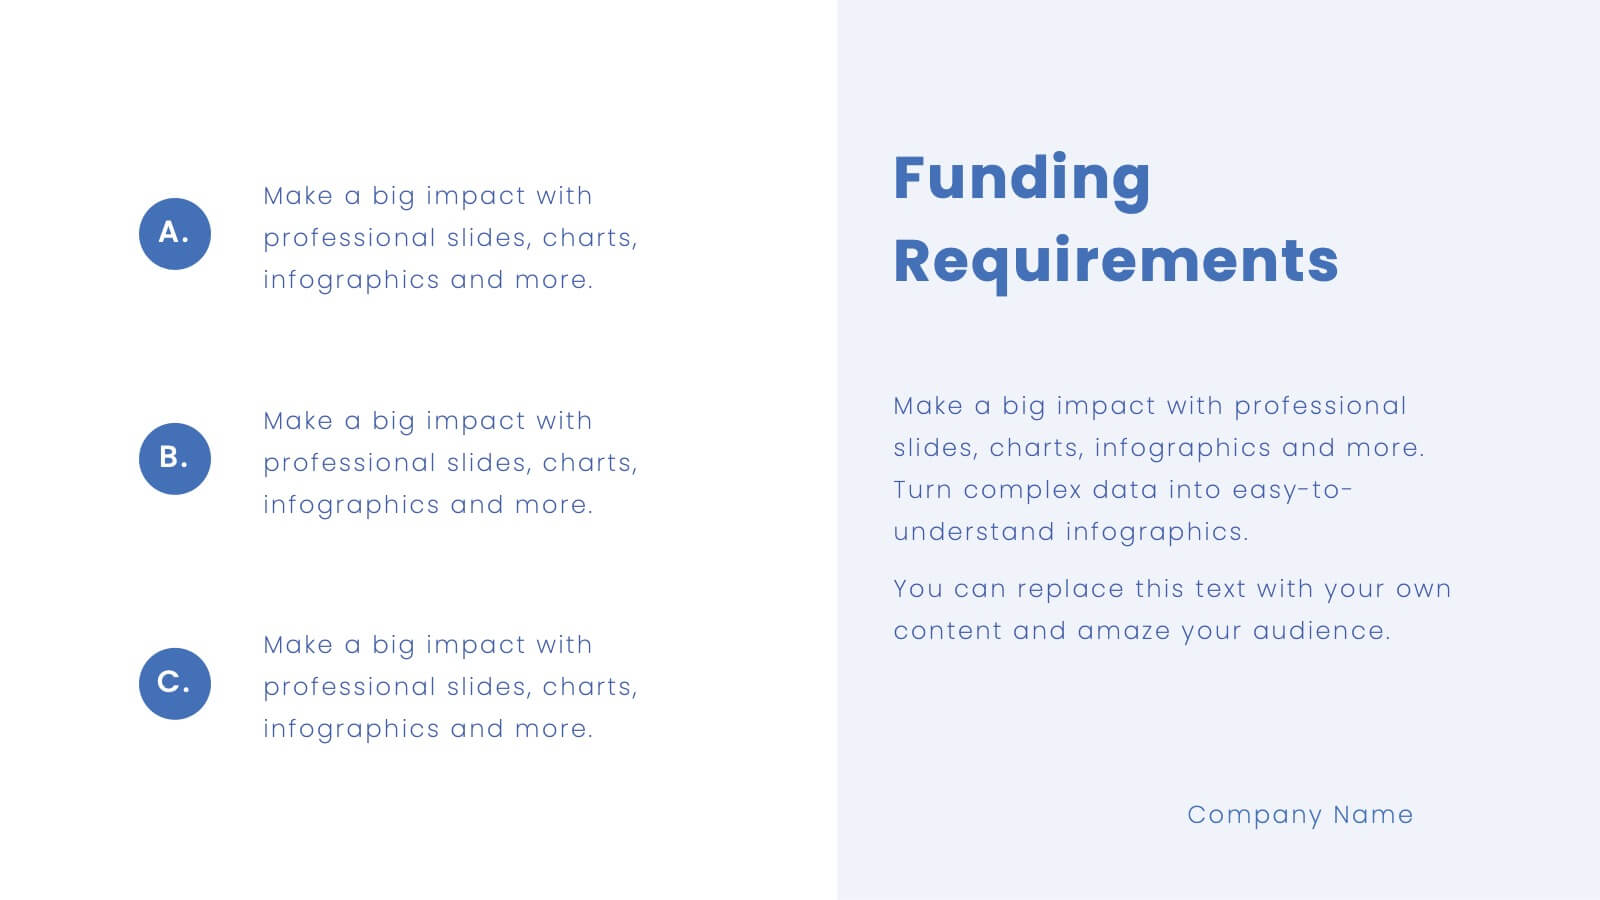
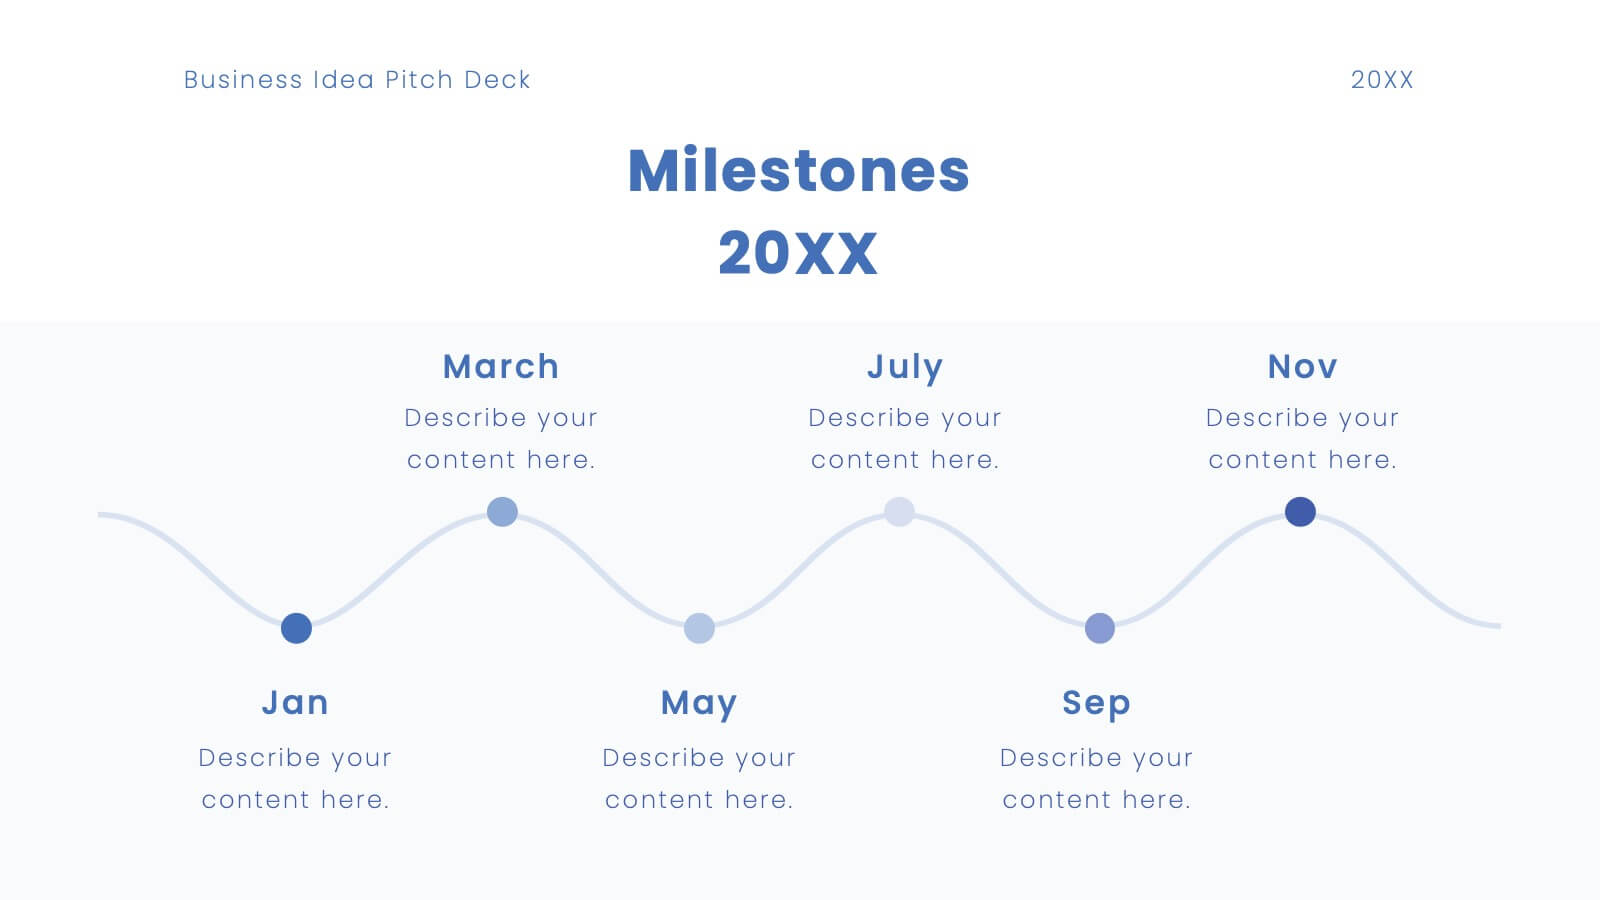
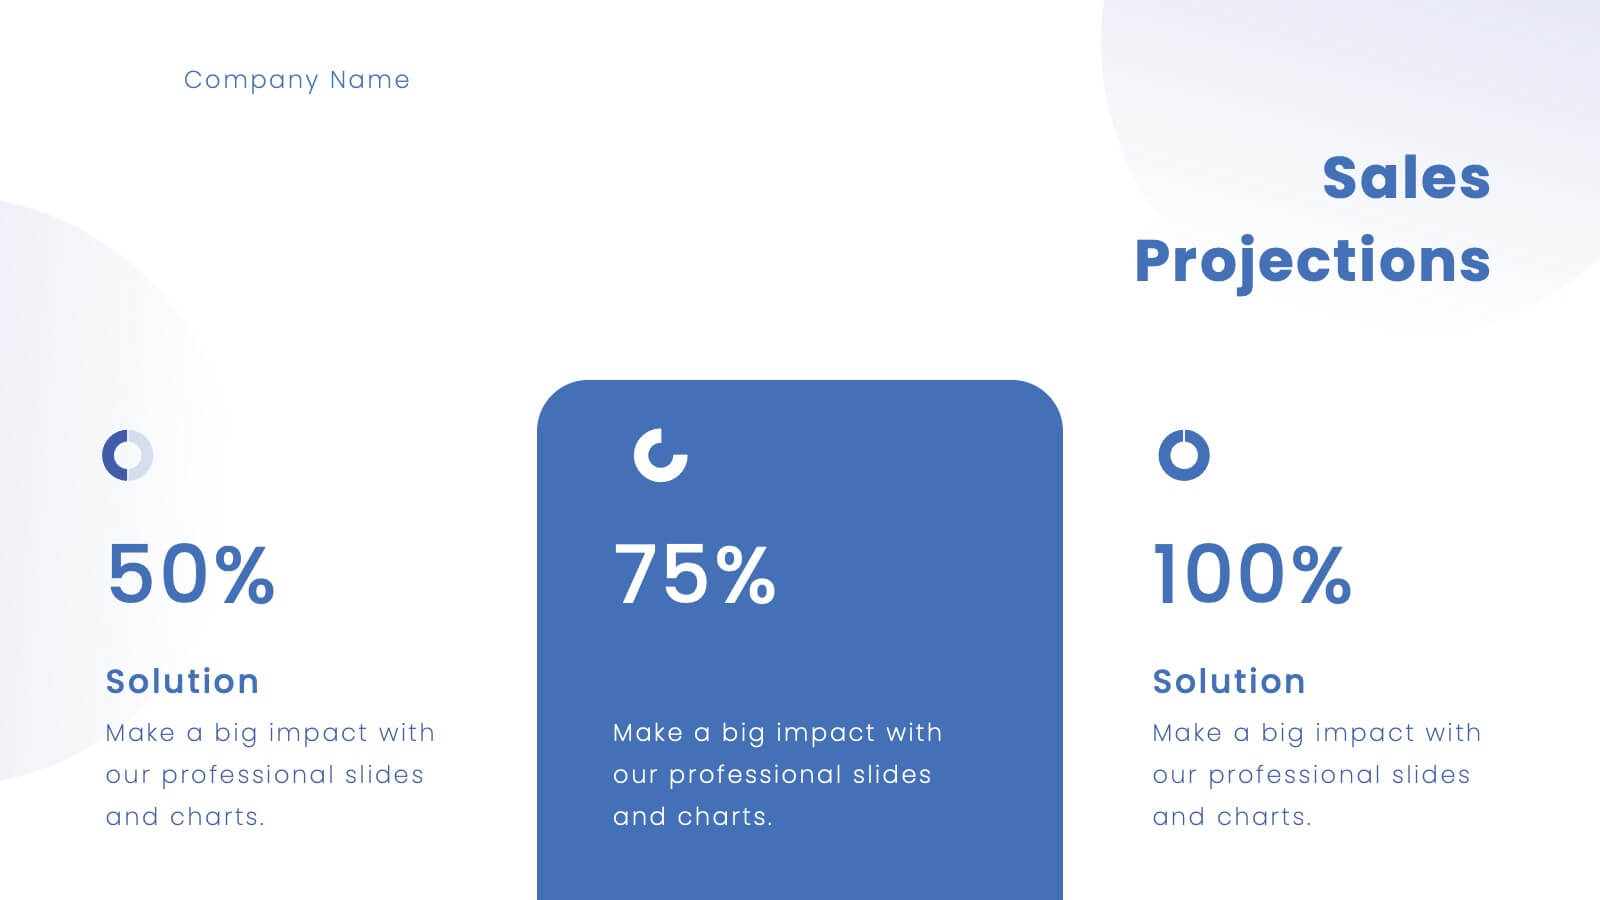
Platinum Business Idea Pitch Deck Presentation
Present your business idea with this sleek and professional pitch deck template! It includes everything from market opportunities to financial projections and sales strategies, providing a comprehensive structure for your pitch. Fully customizable and compatible with PowerPoint, Keynote, and Google Slides, this template is ideal for impressing investors and stakeholders.


6 diapositivas
Leadership and Business Teamwork Presentation
Drive results through synergy with this dynamic Leadership and Business Teamwork presentation slide. Designed with a six-part segmented pie chart, this layout helps visualize collaborative frameworks, team roles, or leadership models in an engaging way. Ideal for team workshops, leadership development, or strategic planning meetings. Easy to personalize in PowerPoint, Keynote, or Google Slides.
21 diapositivas
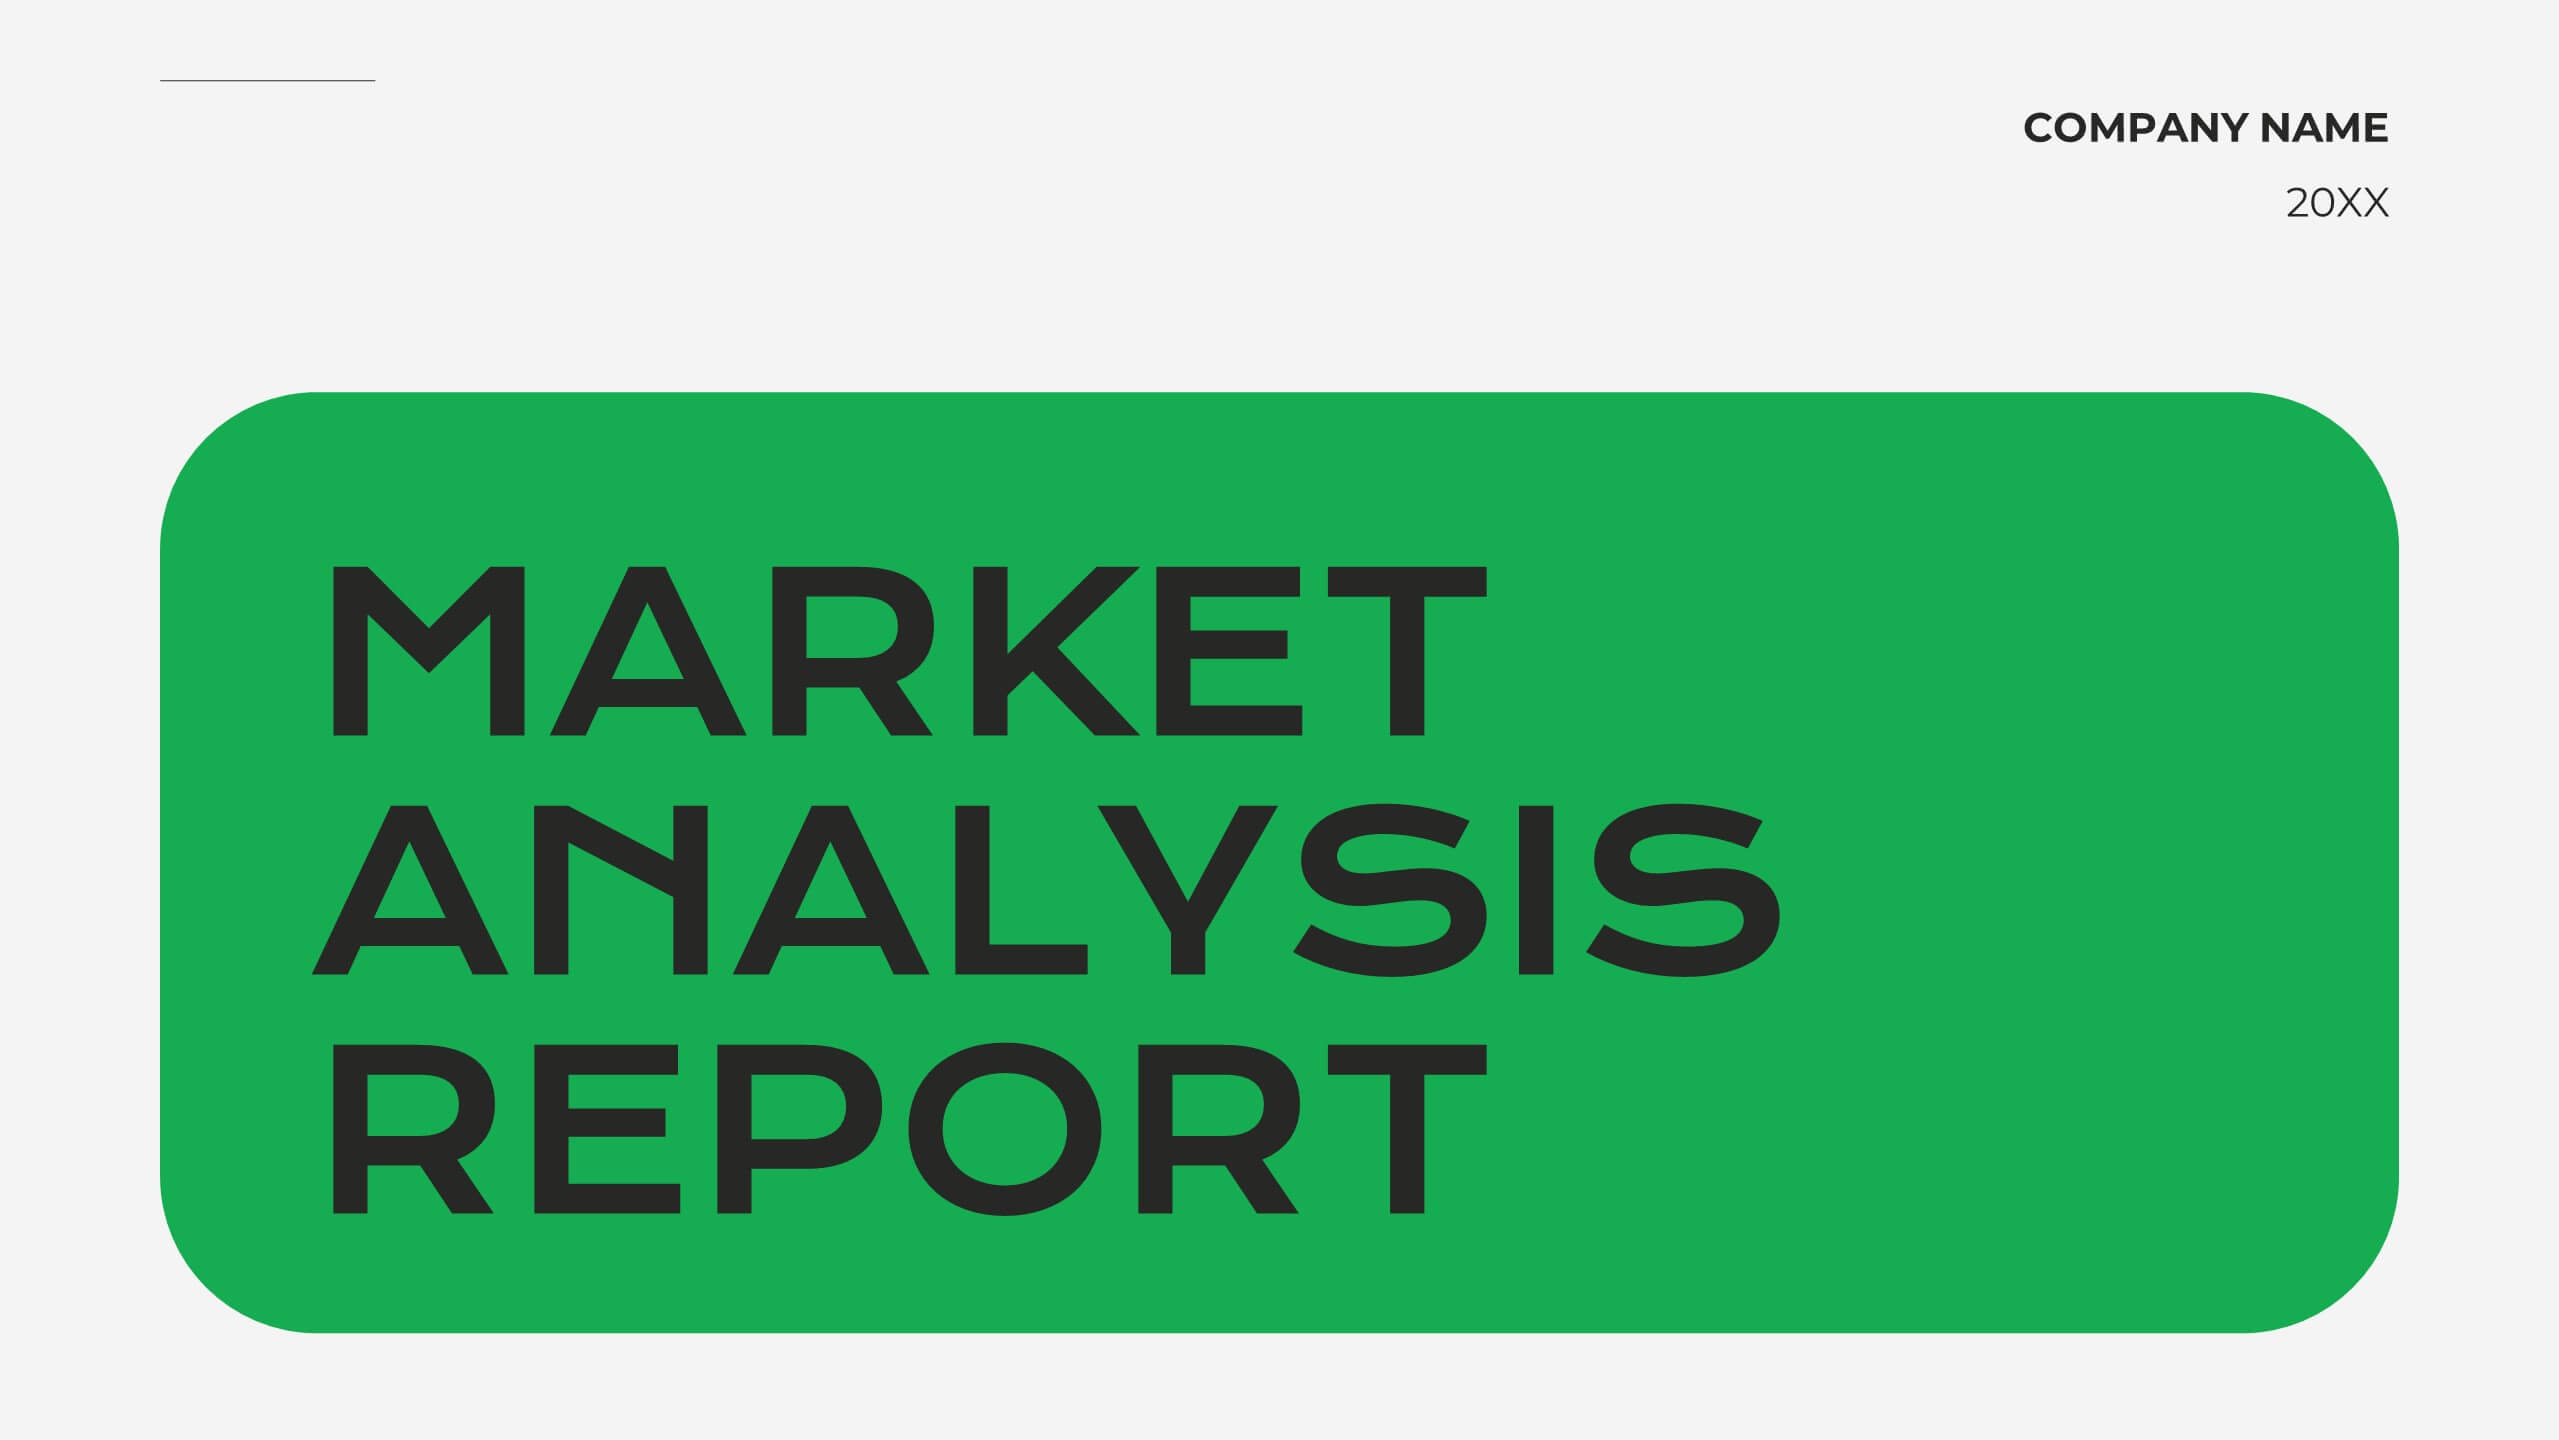
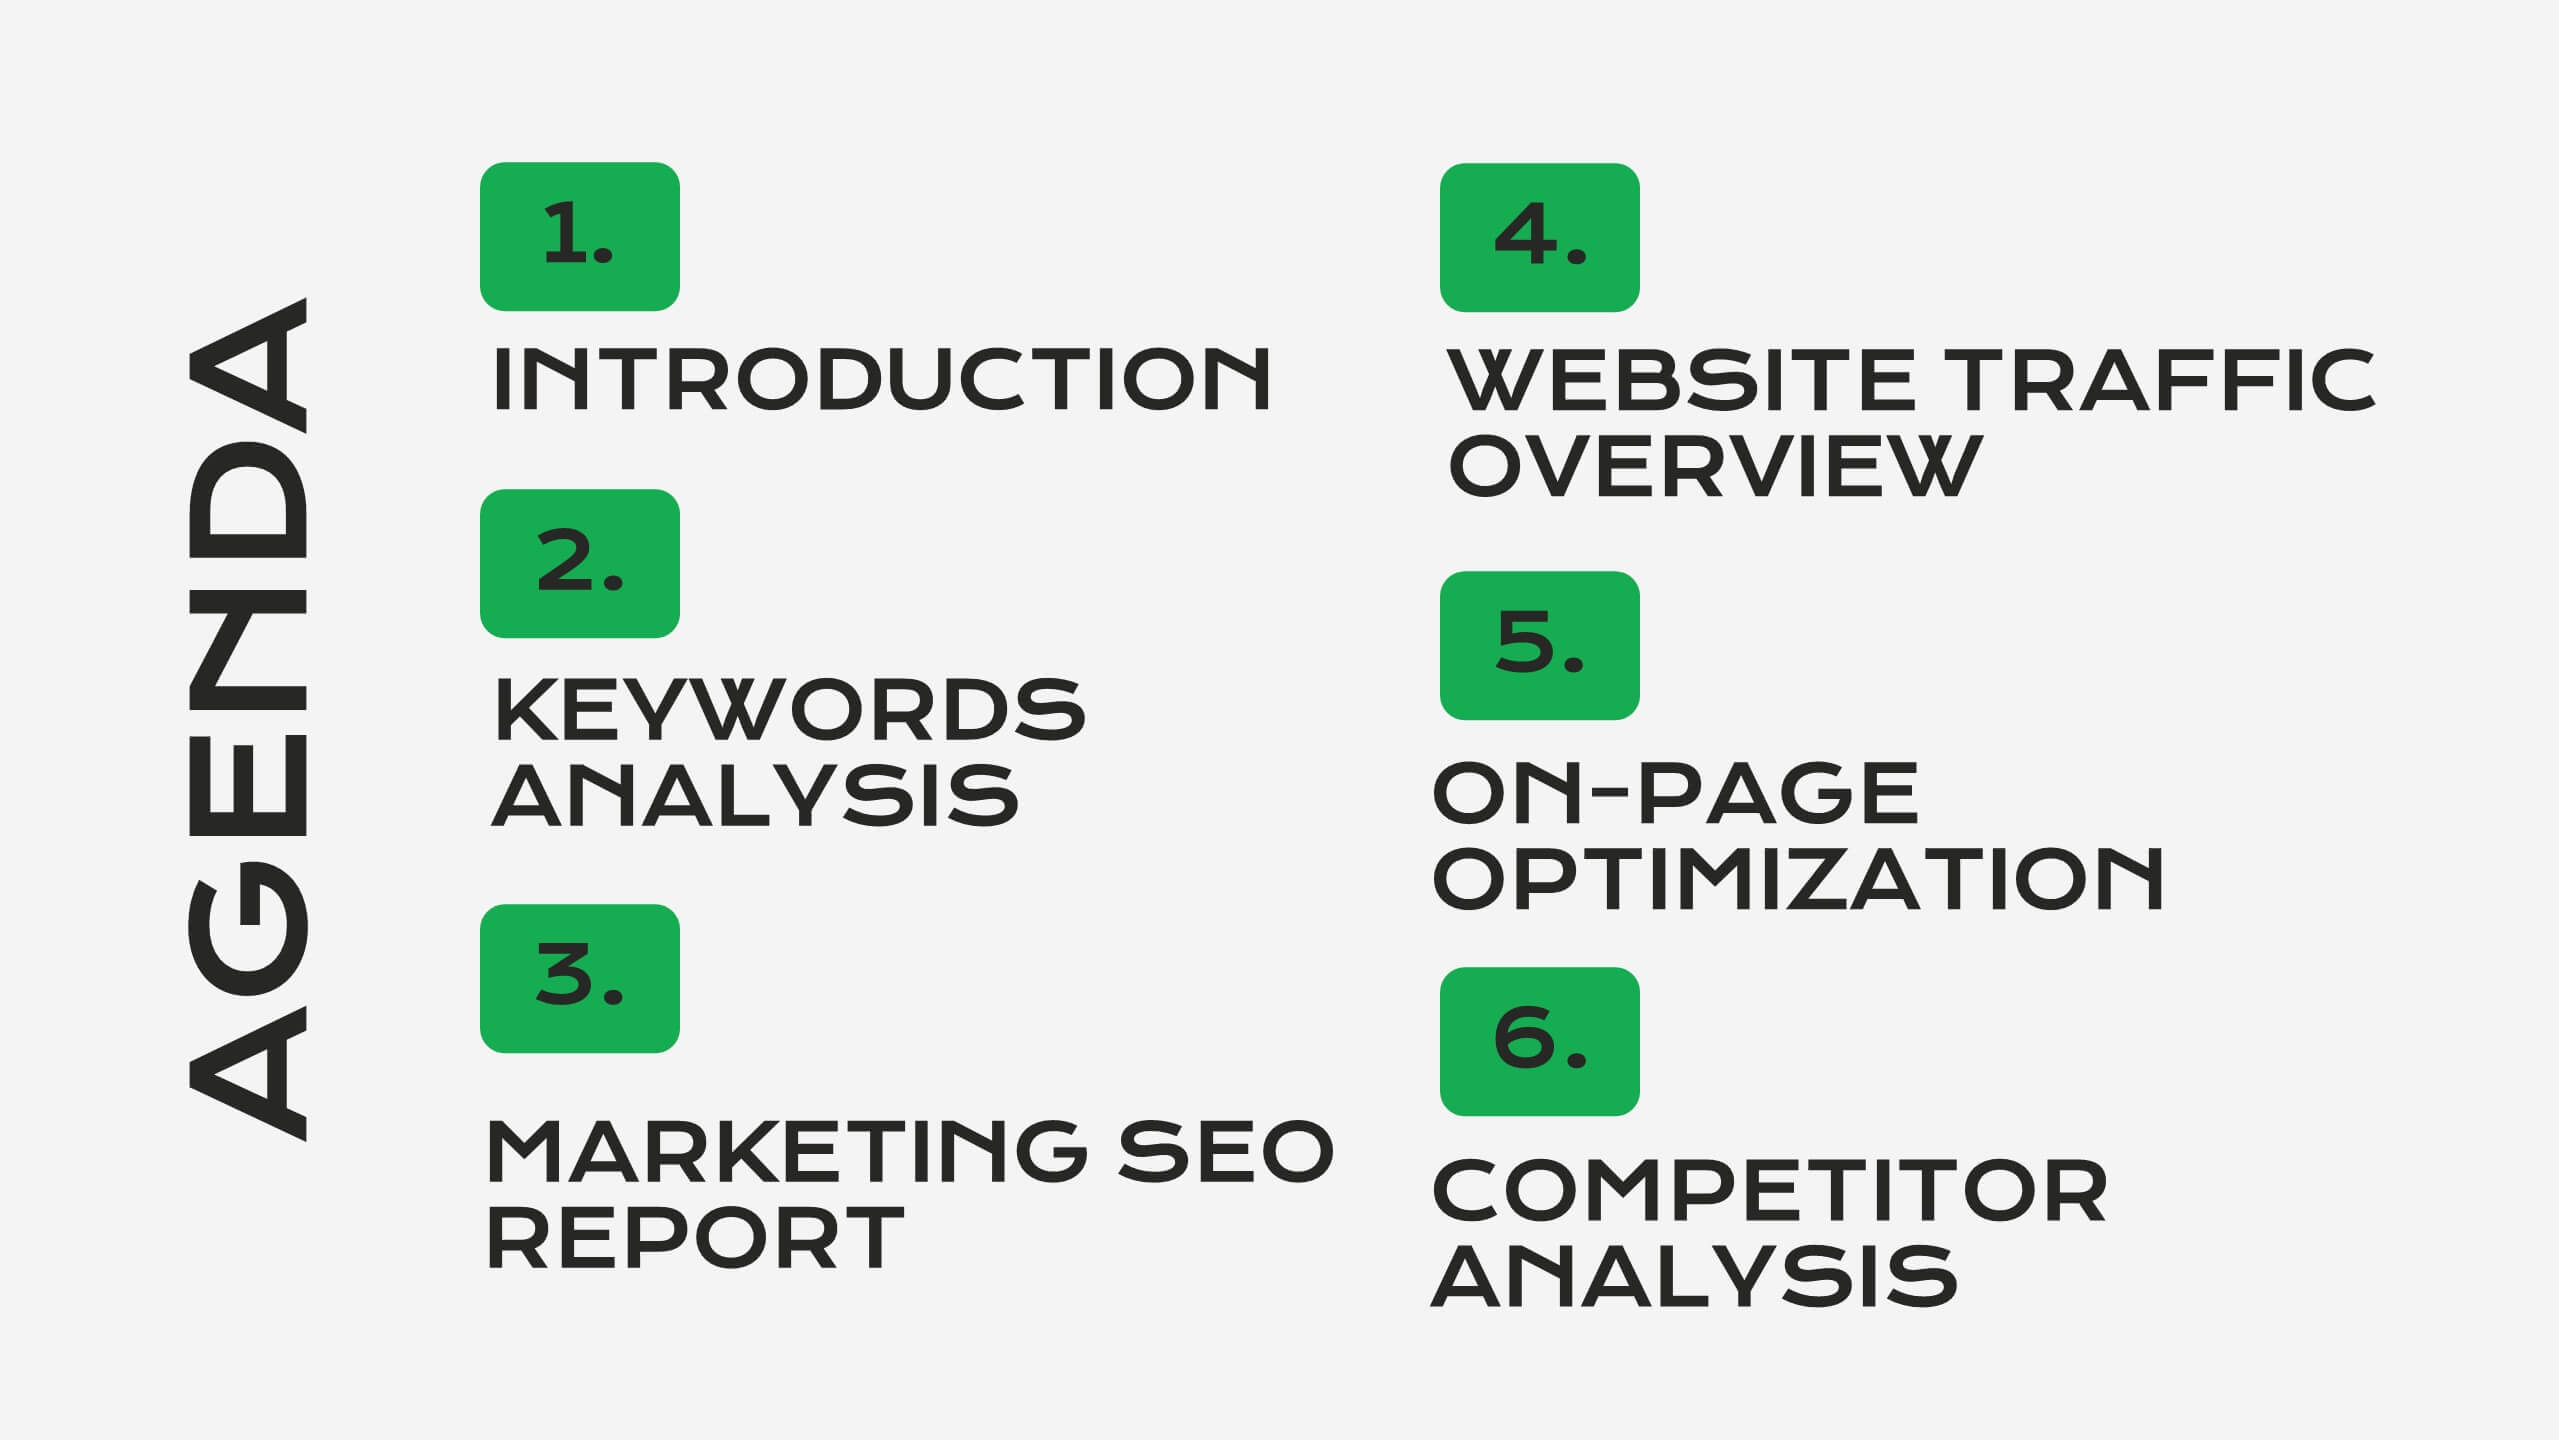
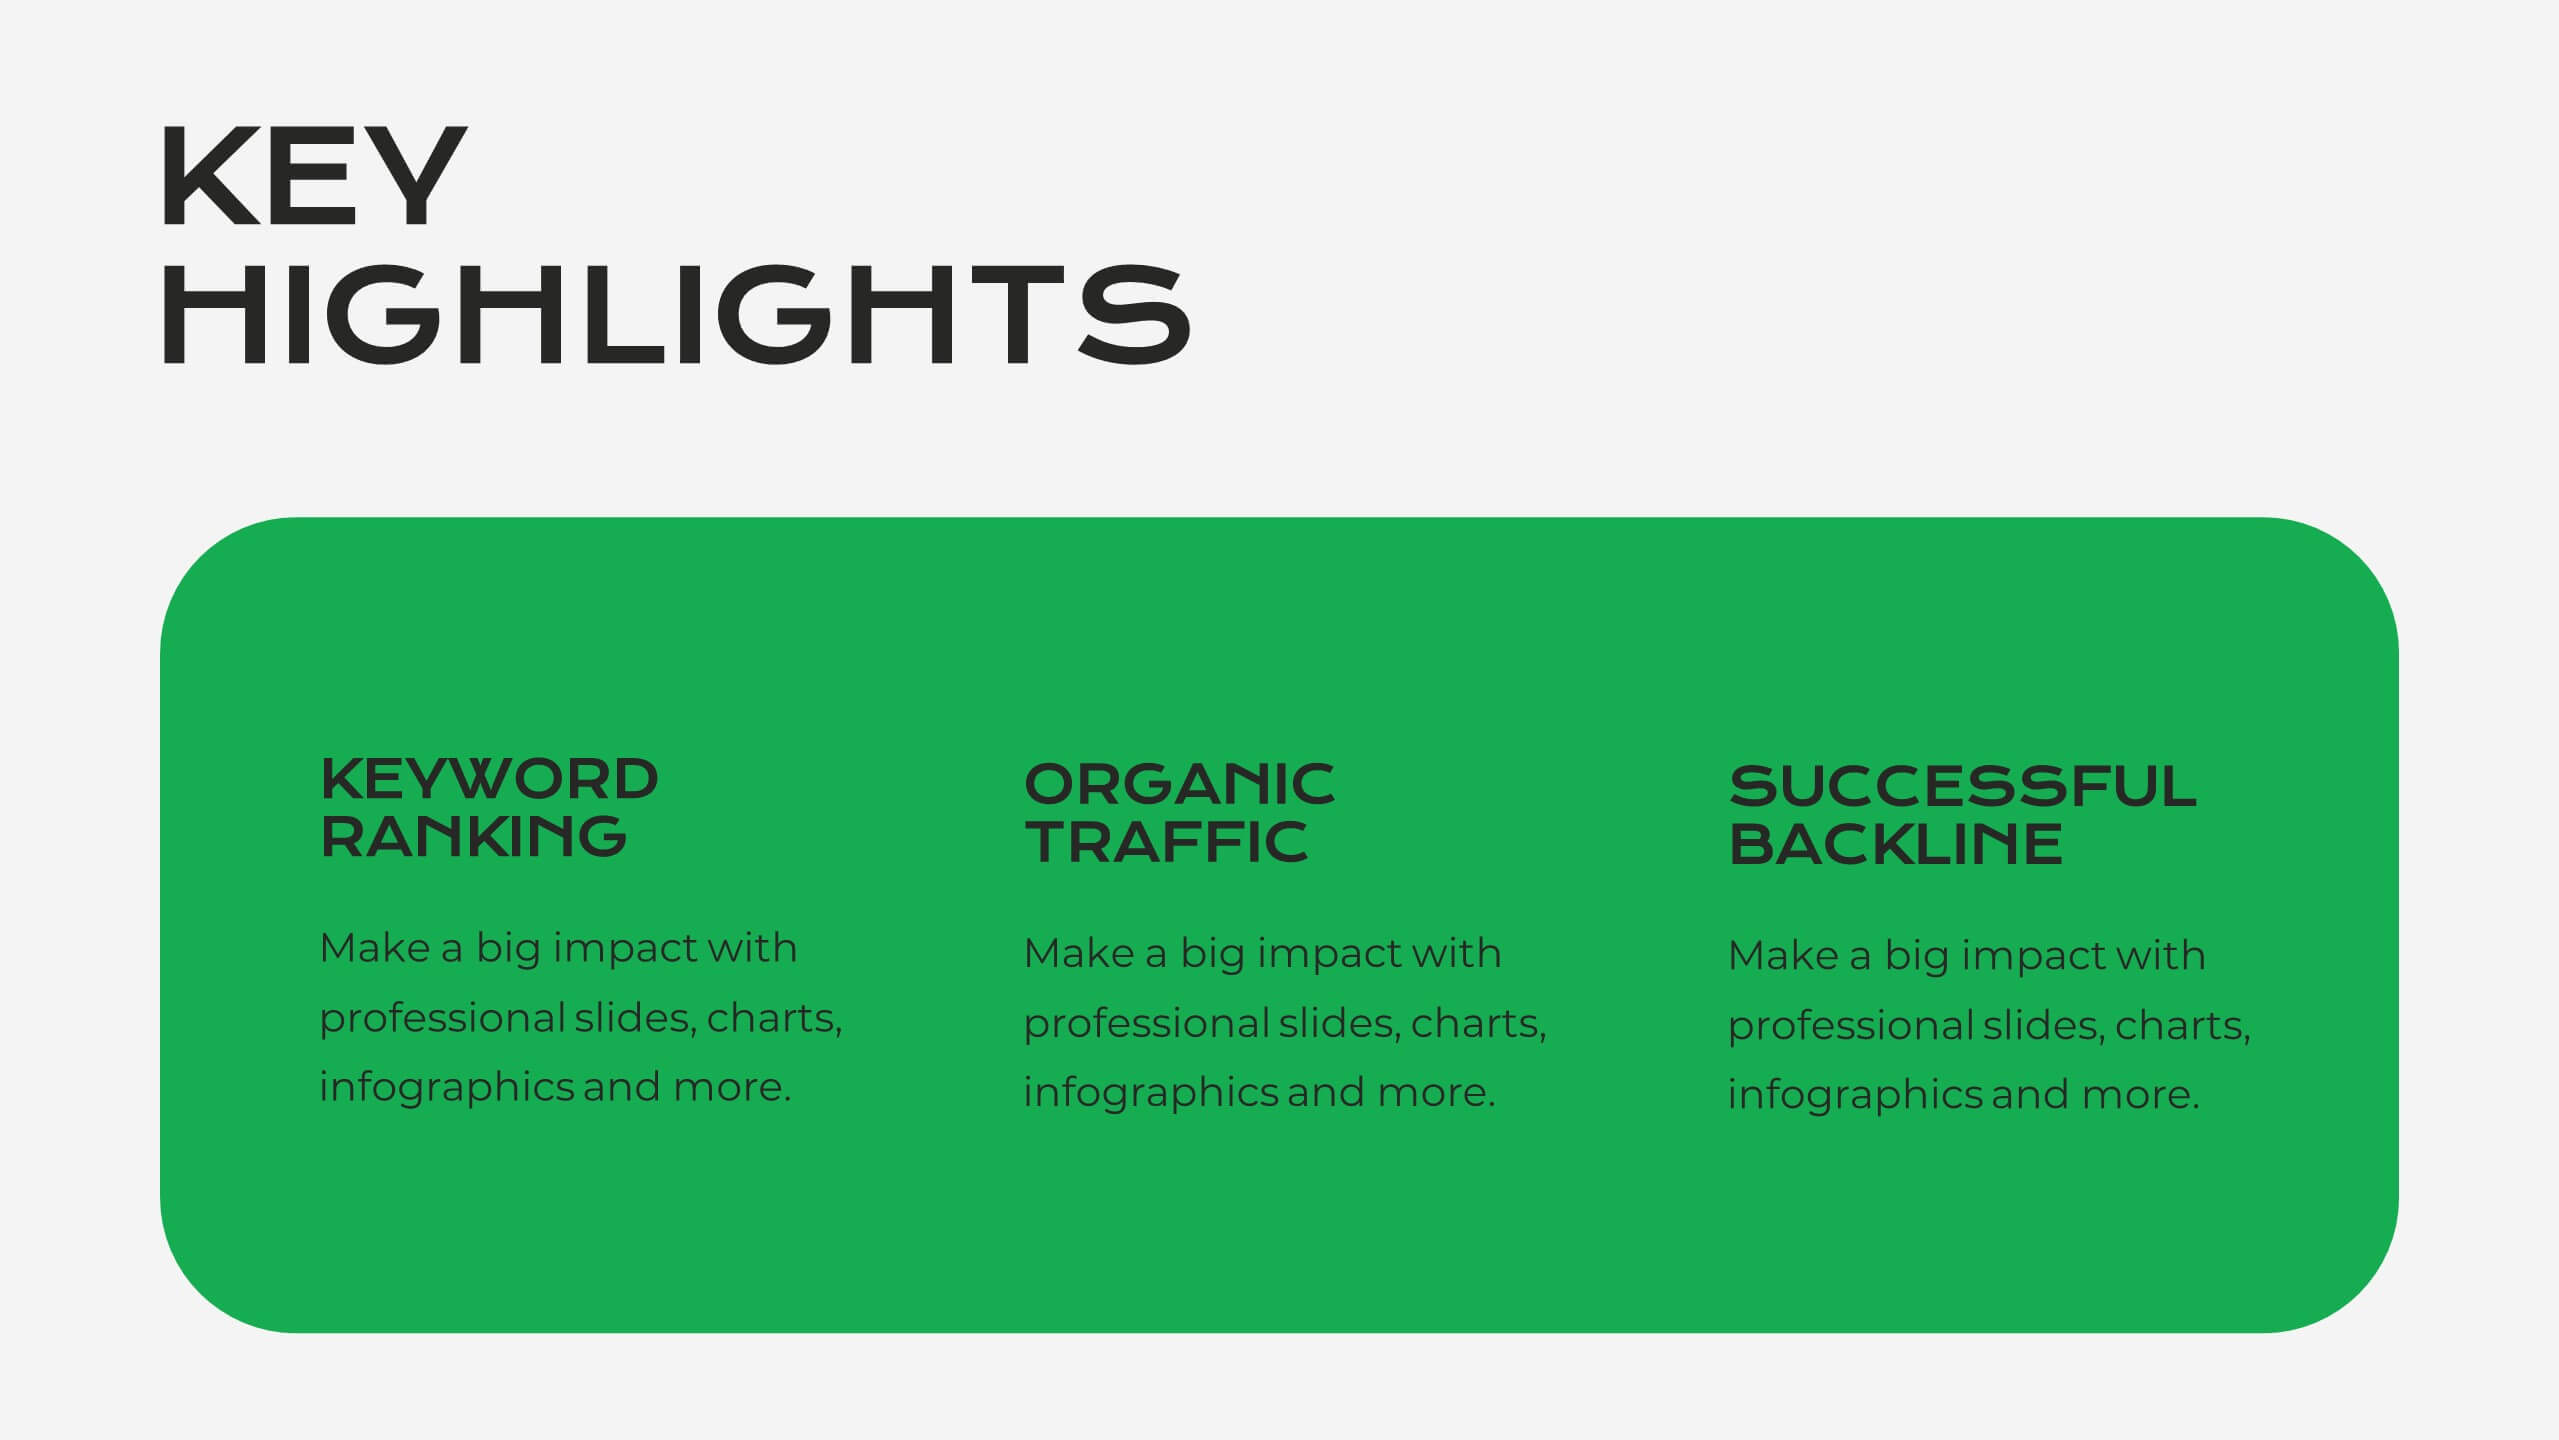
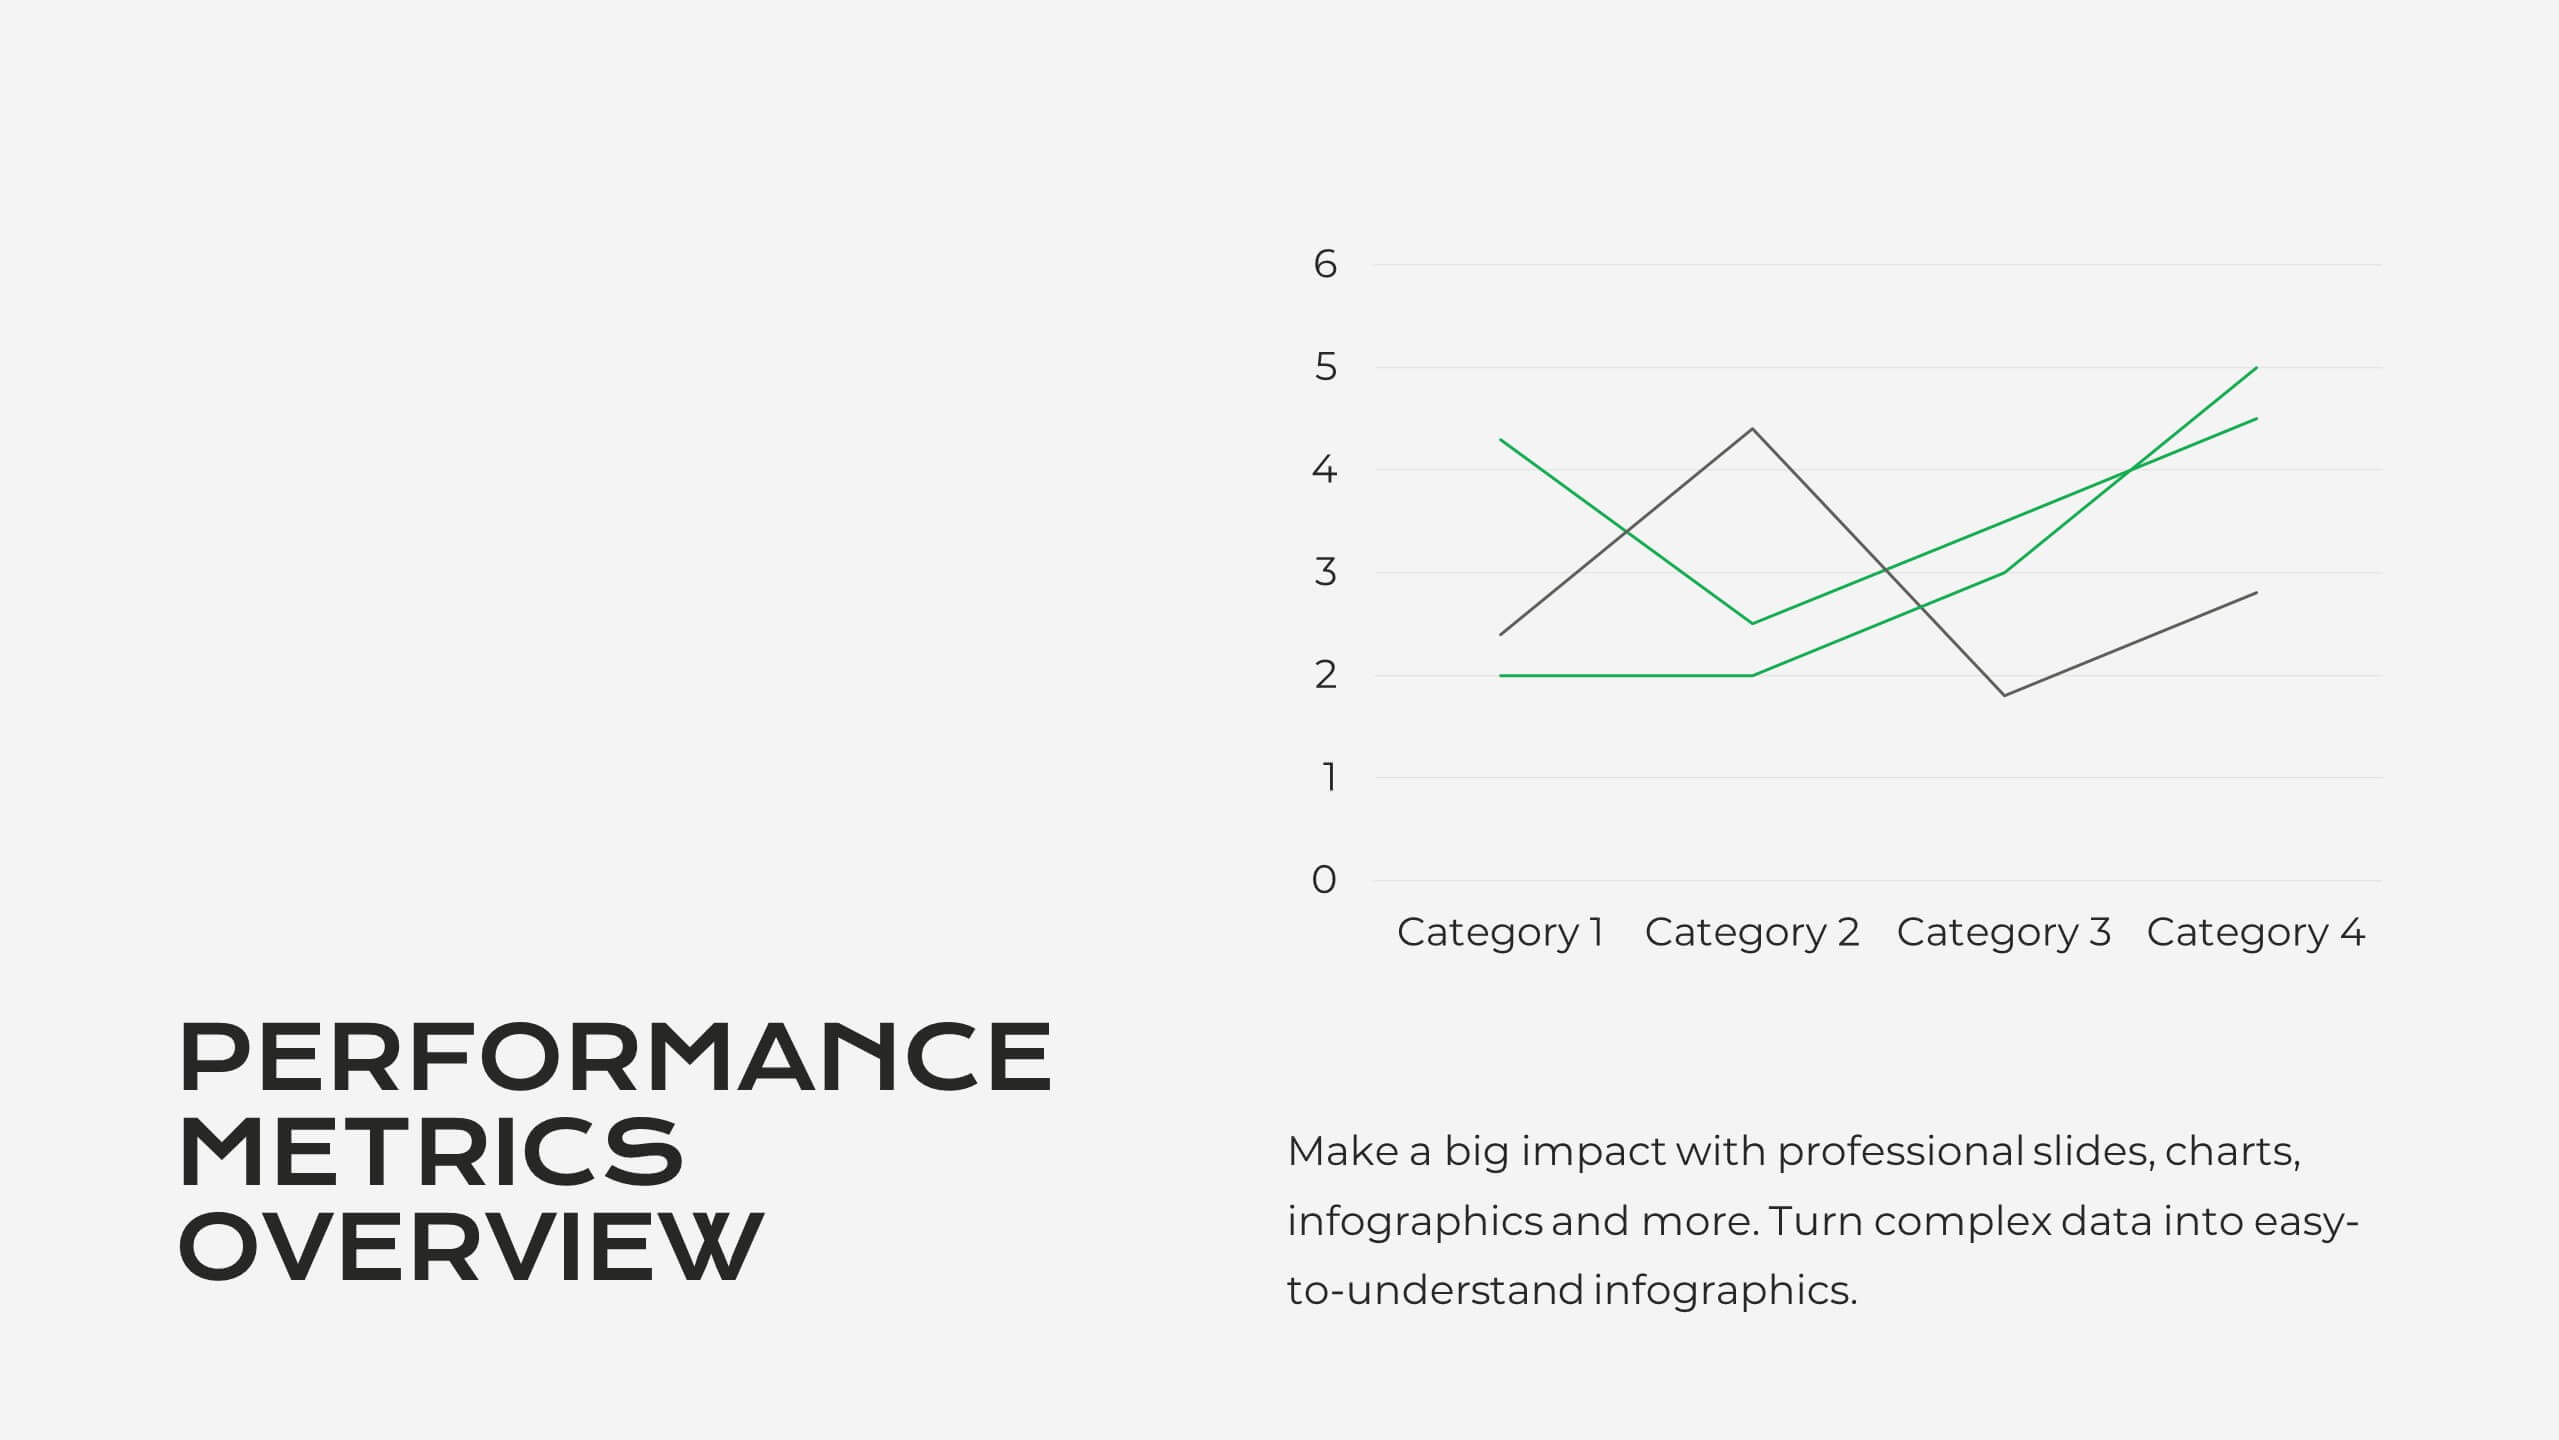
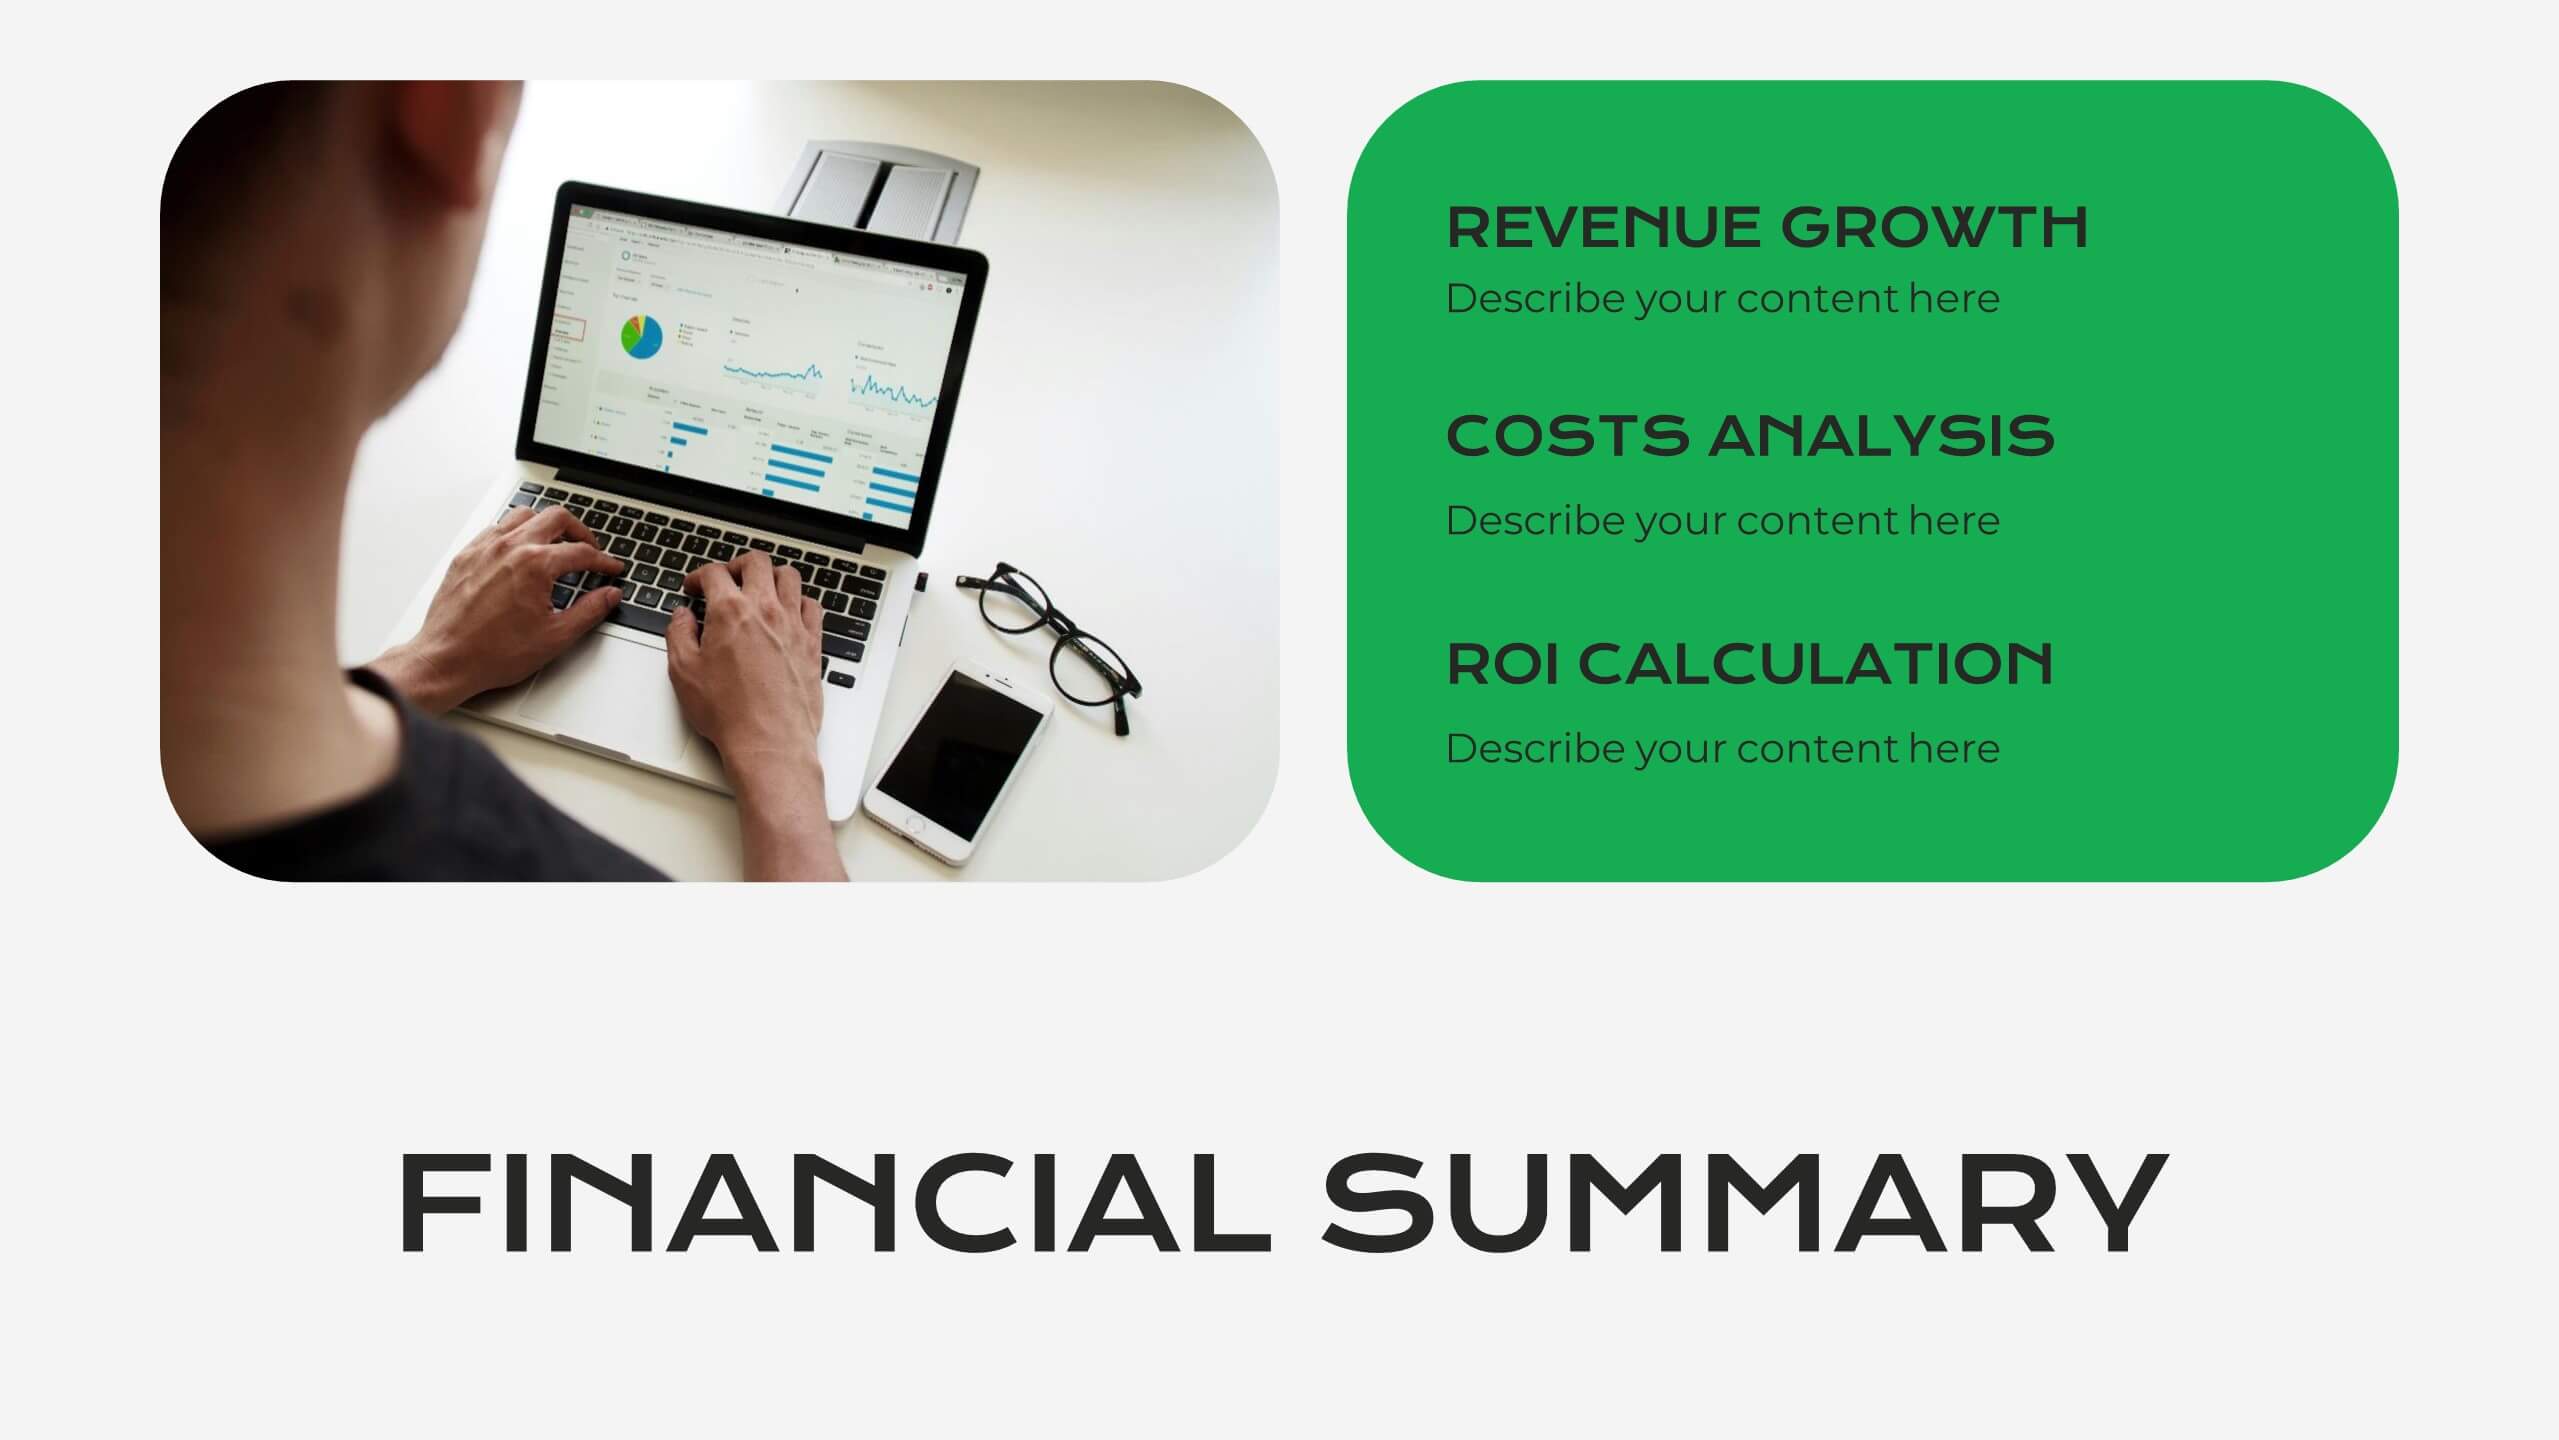
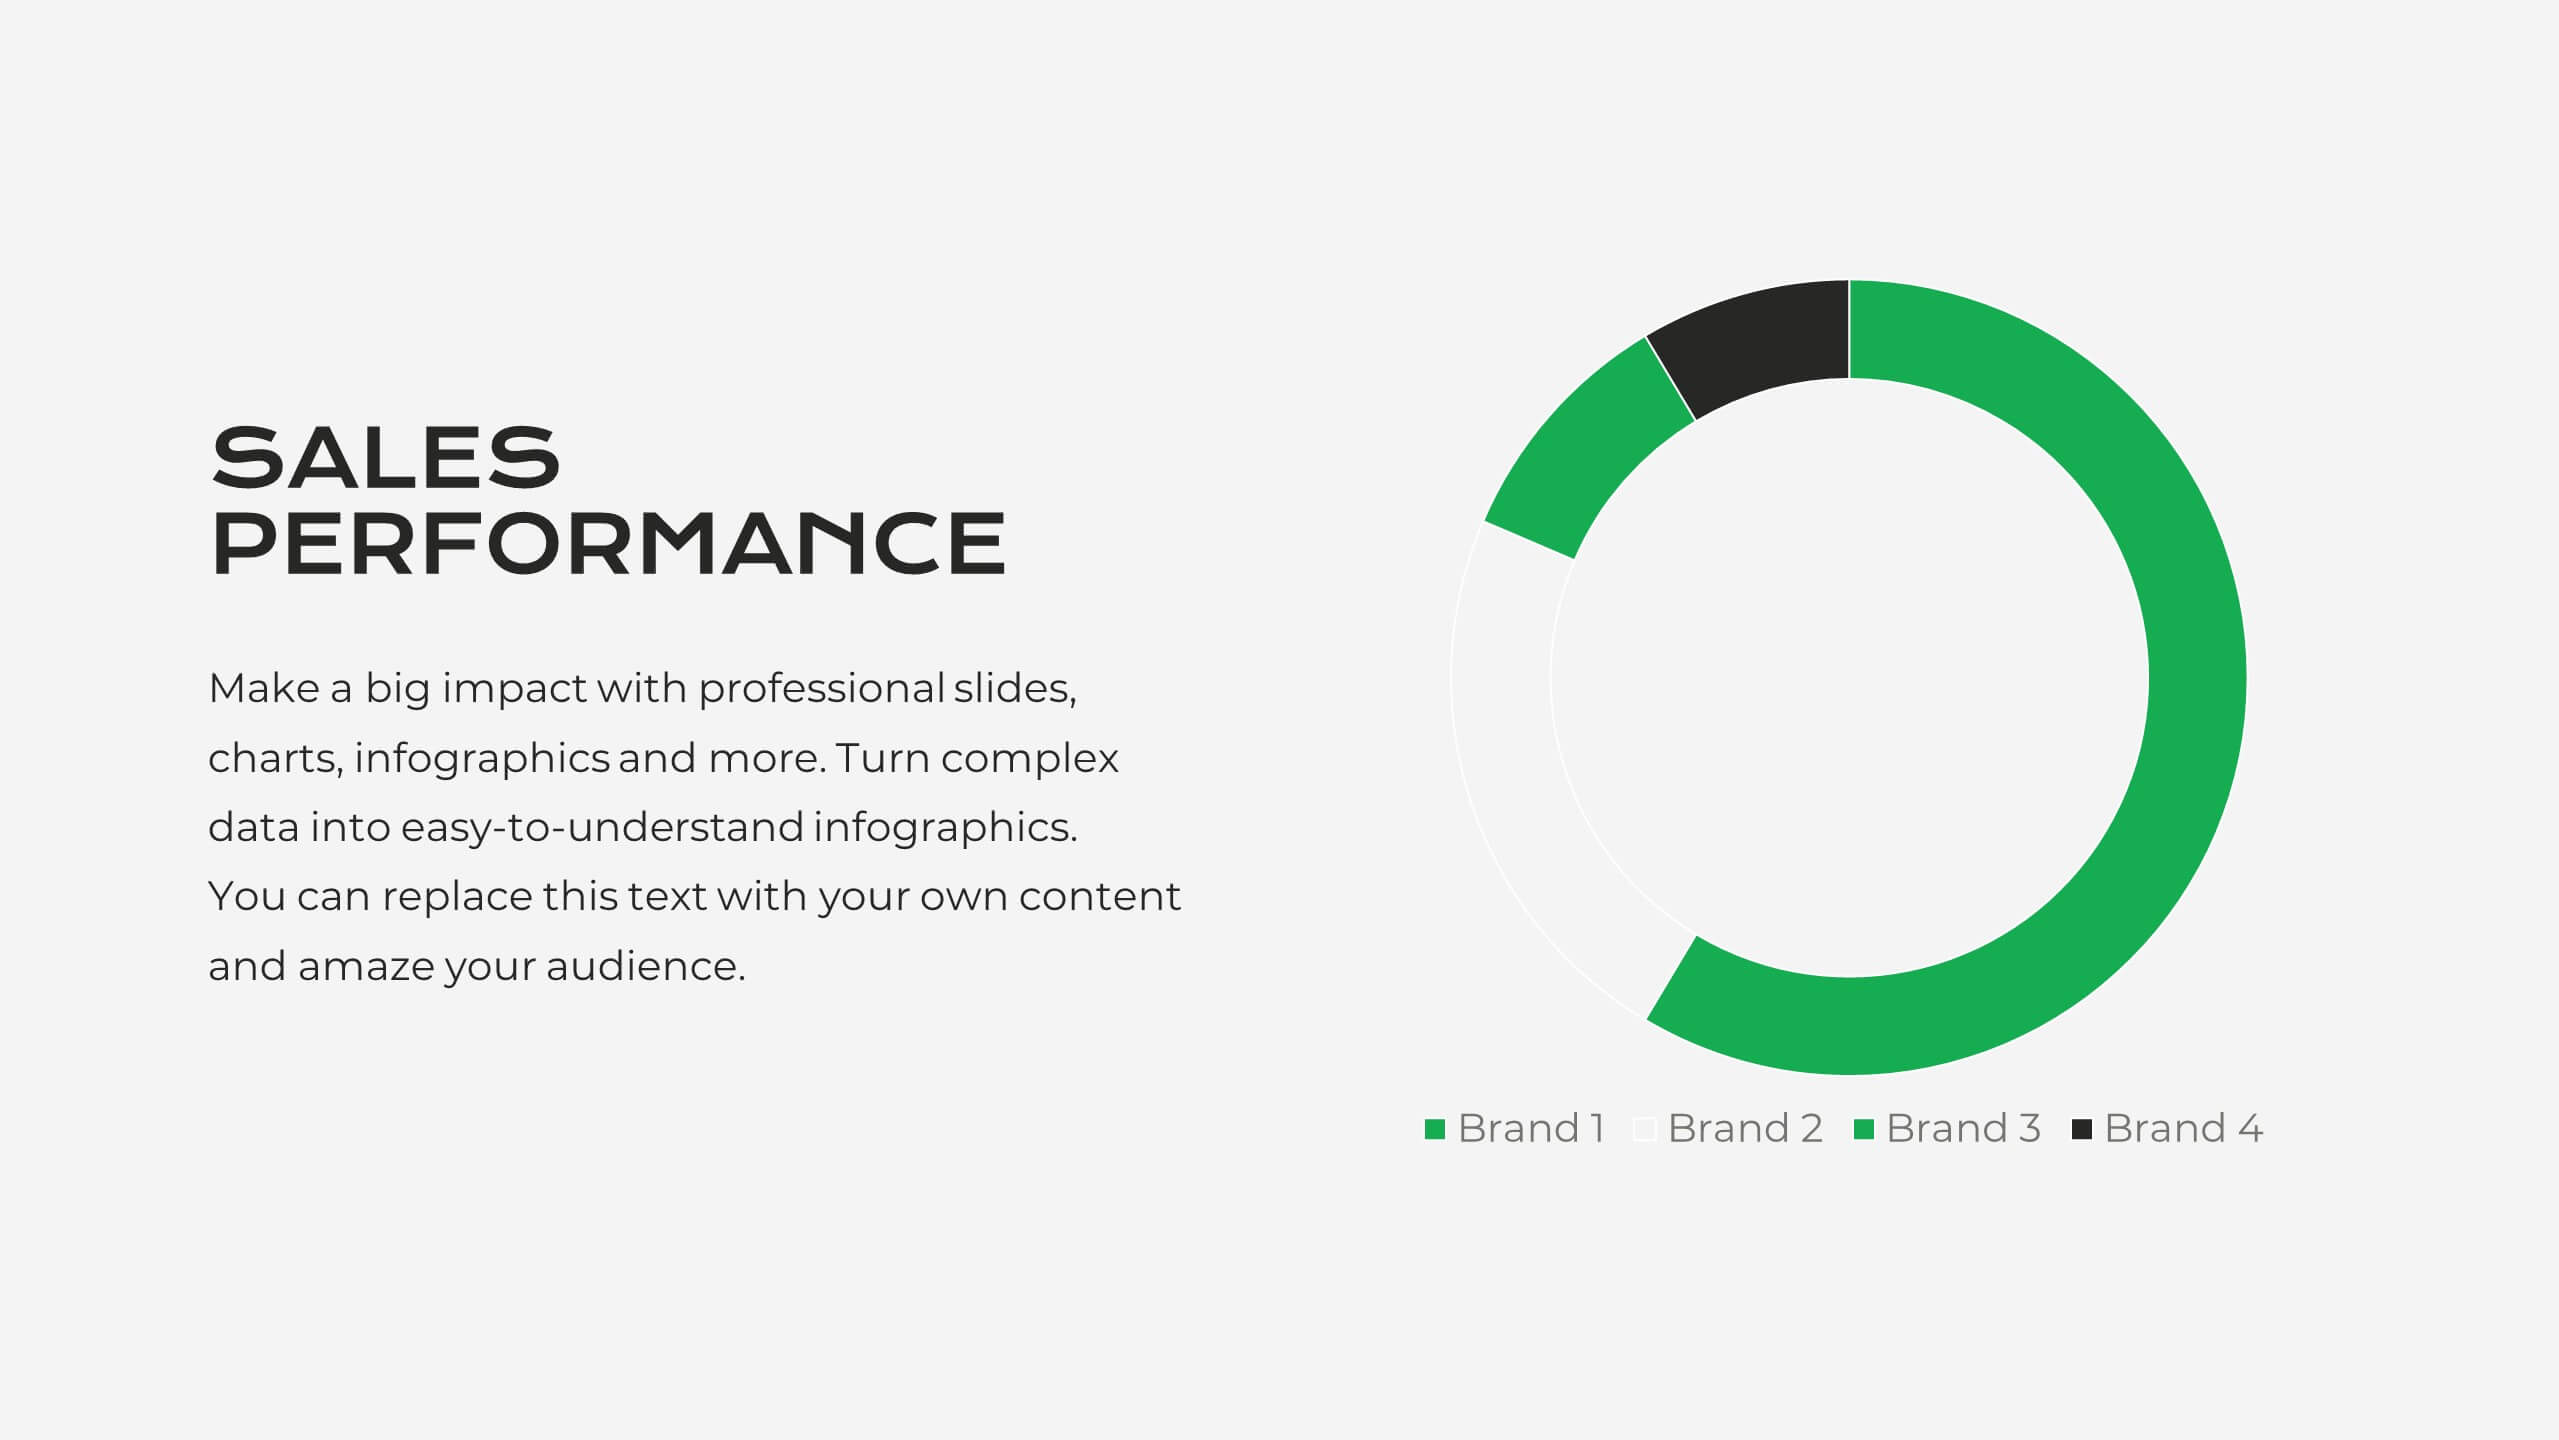
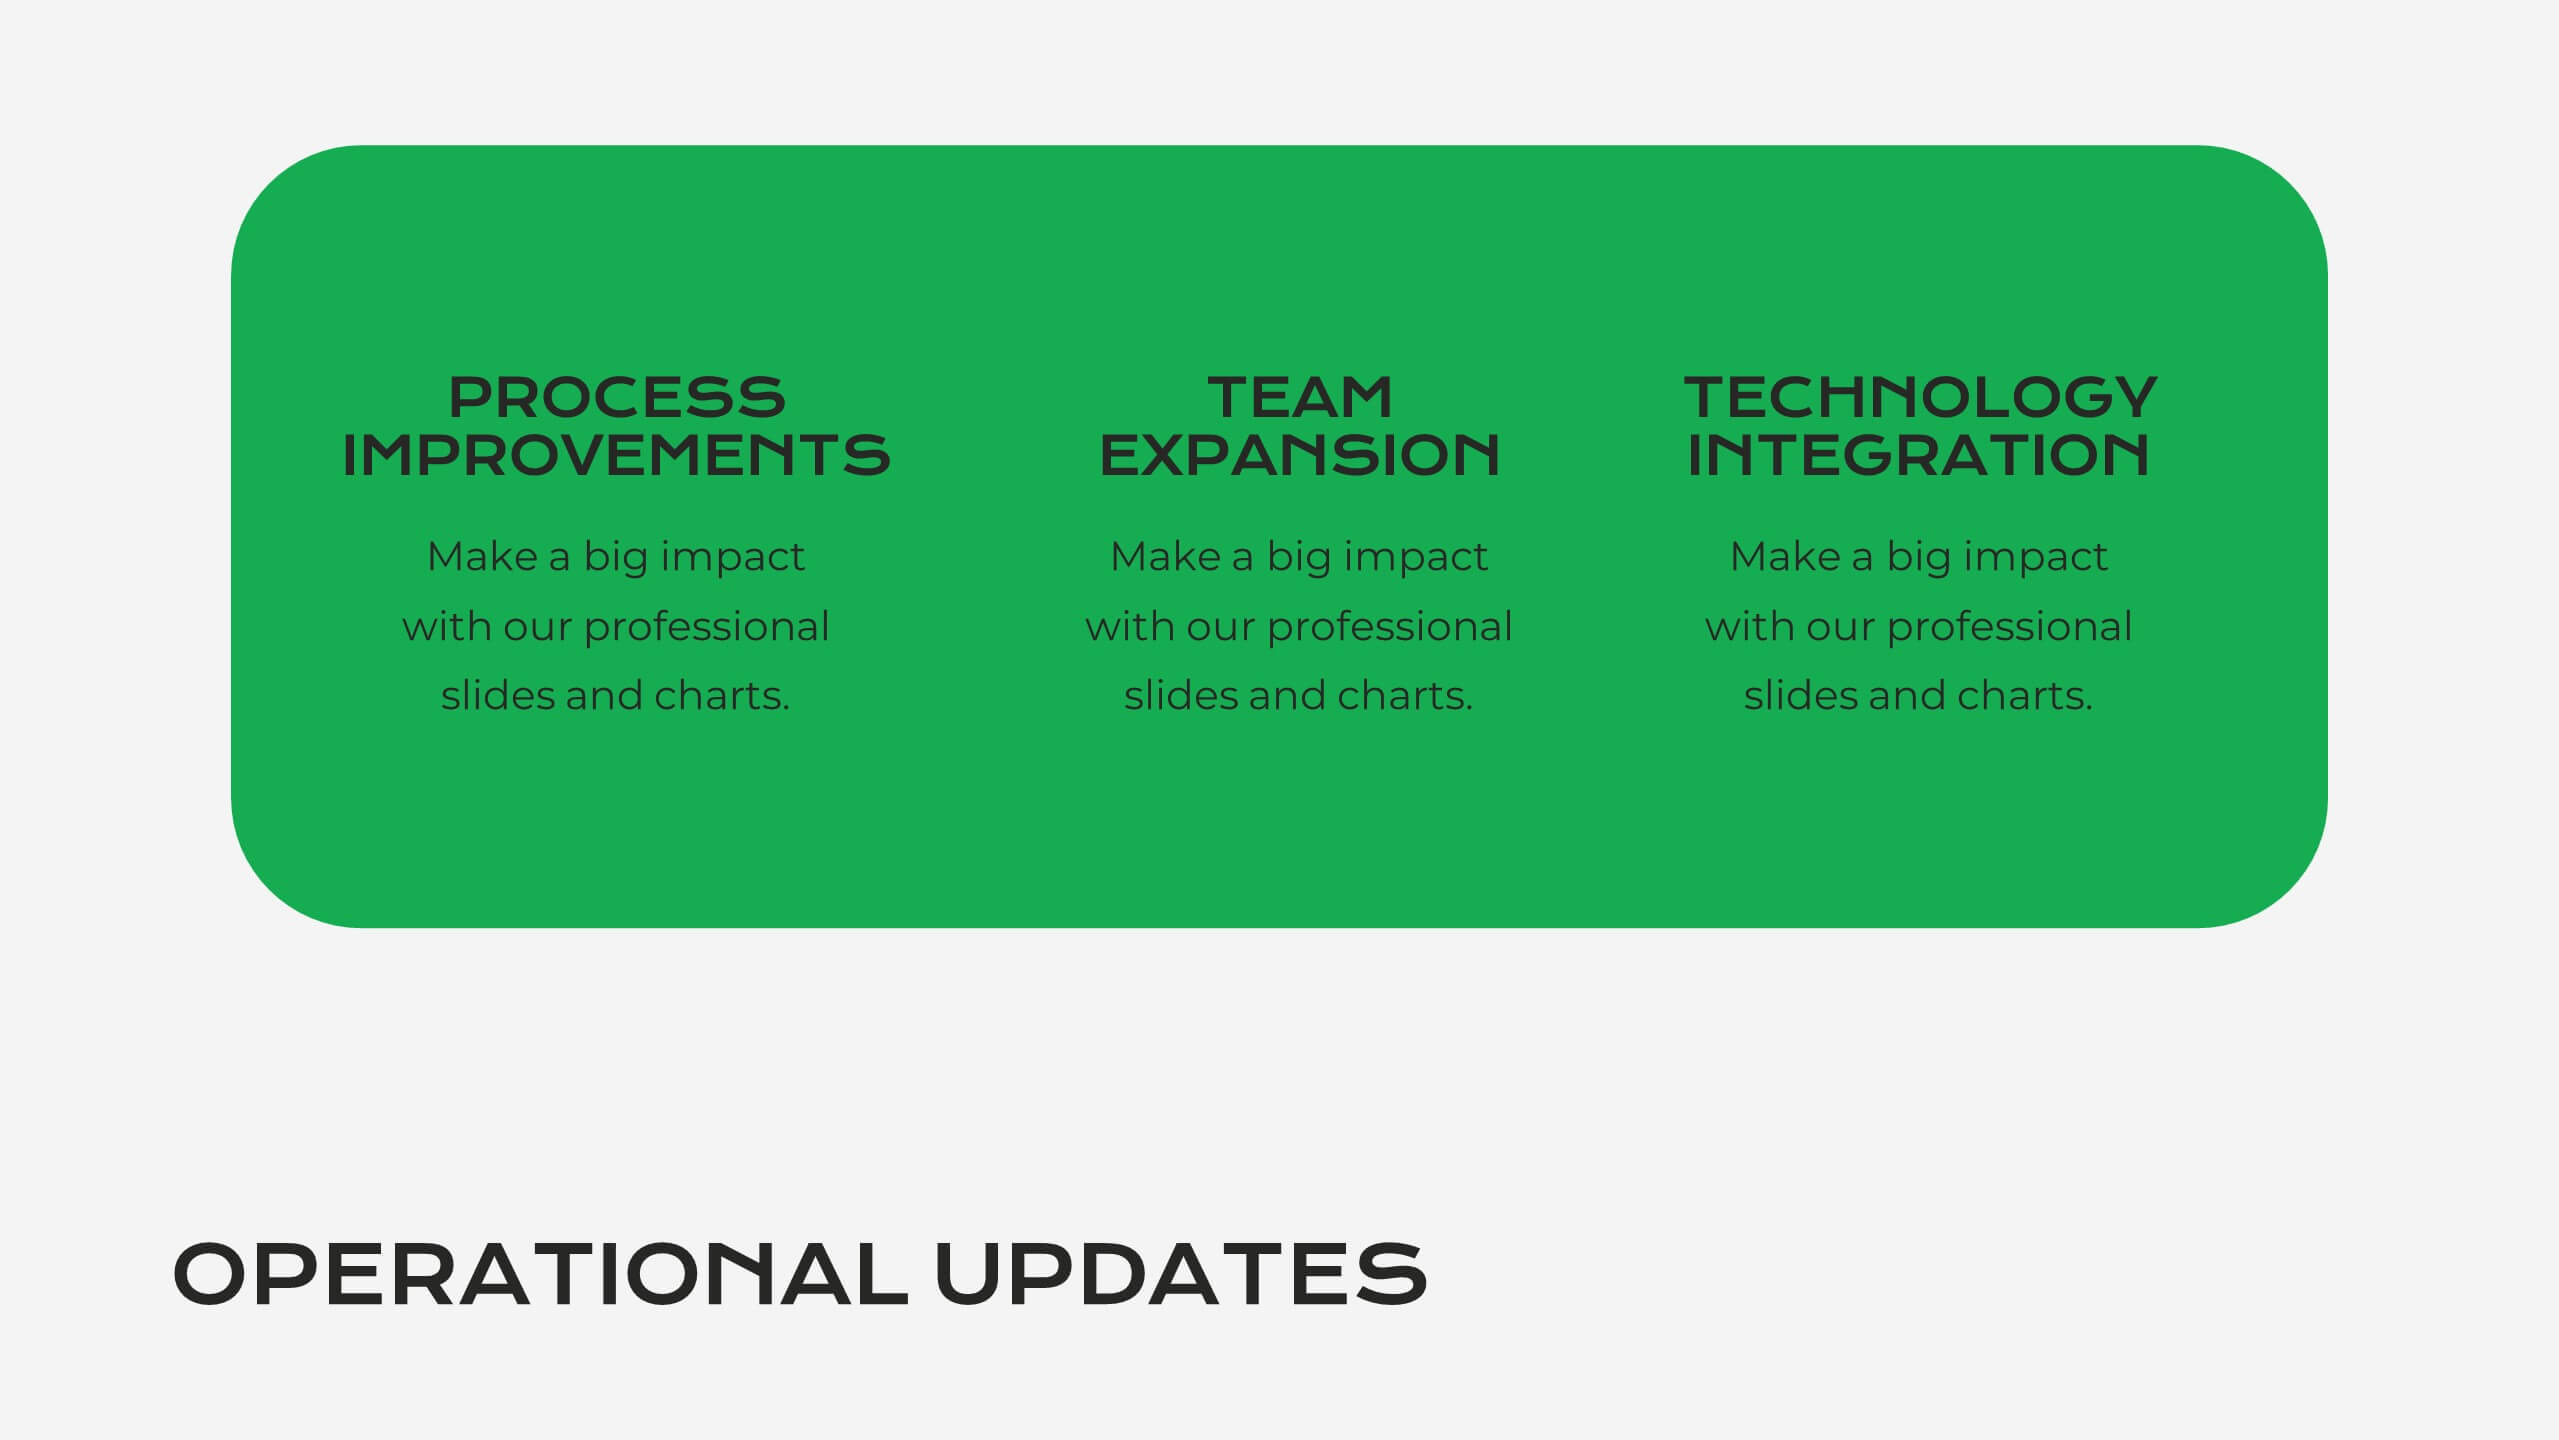
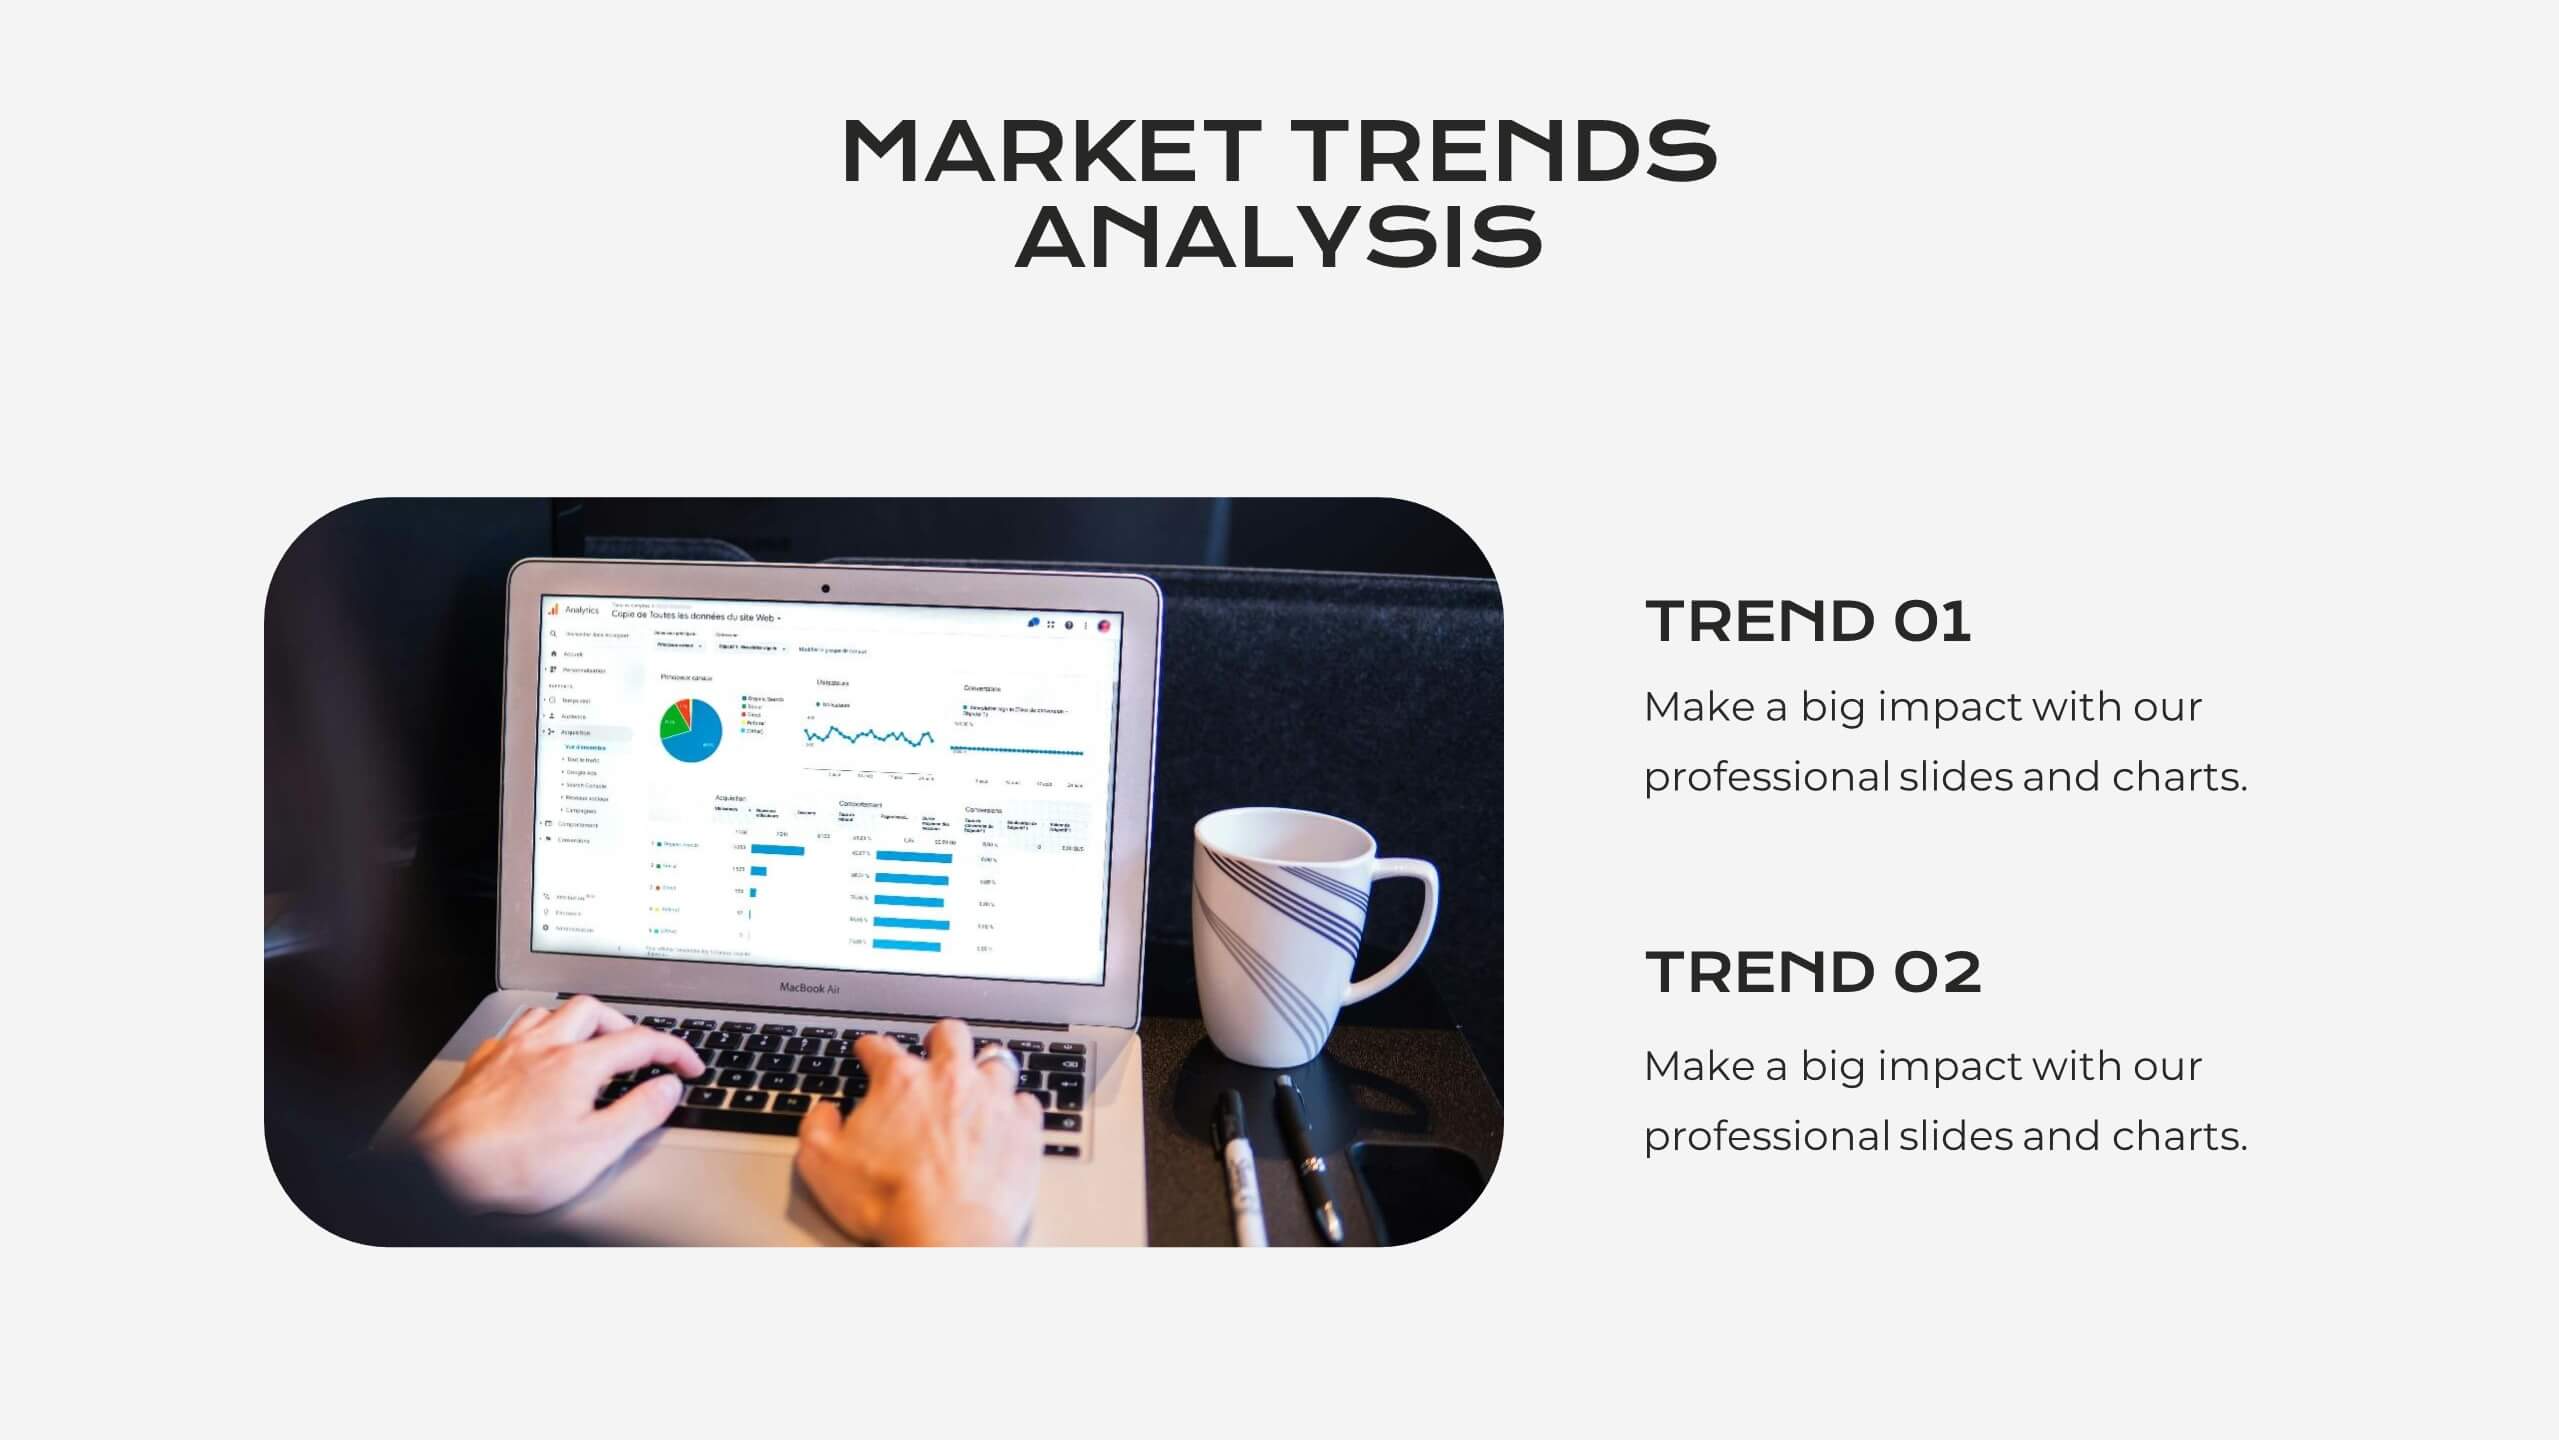
Serene Market Analysis Report Presentation
This modern and clean Market Analysis Report template is designed to help you present key data and insights with clarity and impact. Ideal for business professionals and analysts, it includes slides for key highlights, performance metrics, financial summaries, competitor insights, and strategic initiatives. The template's sleek layout ensures that your data is easy to understand and visually appealing, making it perfect for internal reports or client presentations. Customize it effortlessly in PowerPoint, Keynote, or Google Slides, and impress your audience with a polished and professional report.


6 diapositivas
Team Leadership and Management
Foster stronger collaboration with this team-focused circular diagram. Designed to showcase six key areas of team leadership, this template is perfect for outlining communication, goal-setting, delegation, performance, feedback, and development strategies. Ideal for managers, trainers, and HR professionals. Fully customizable in PowerPoint, Keynote, and Google Slides.


30 diapositivas
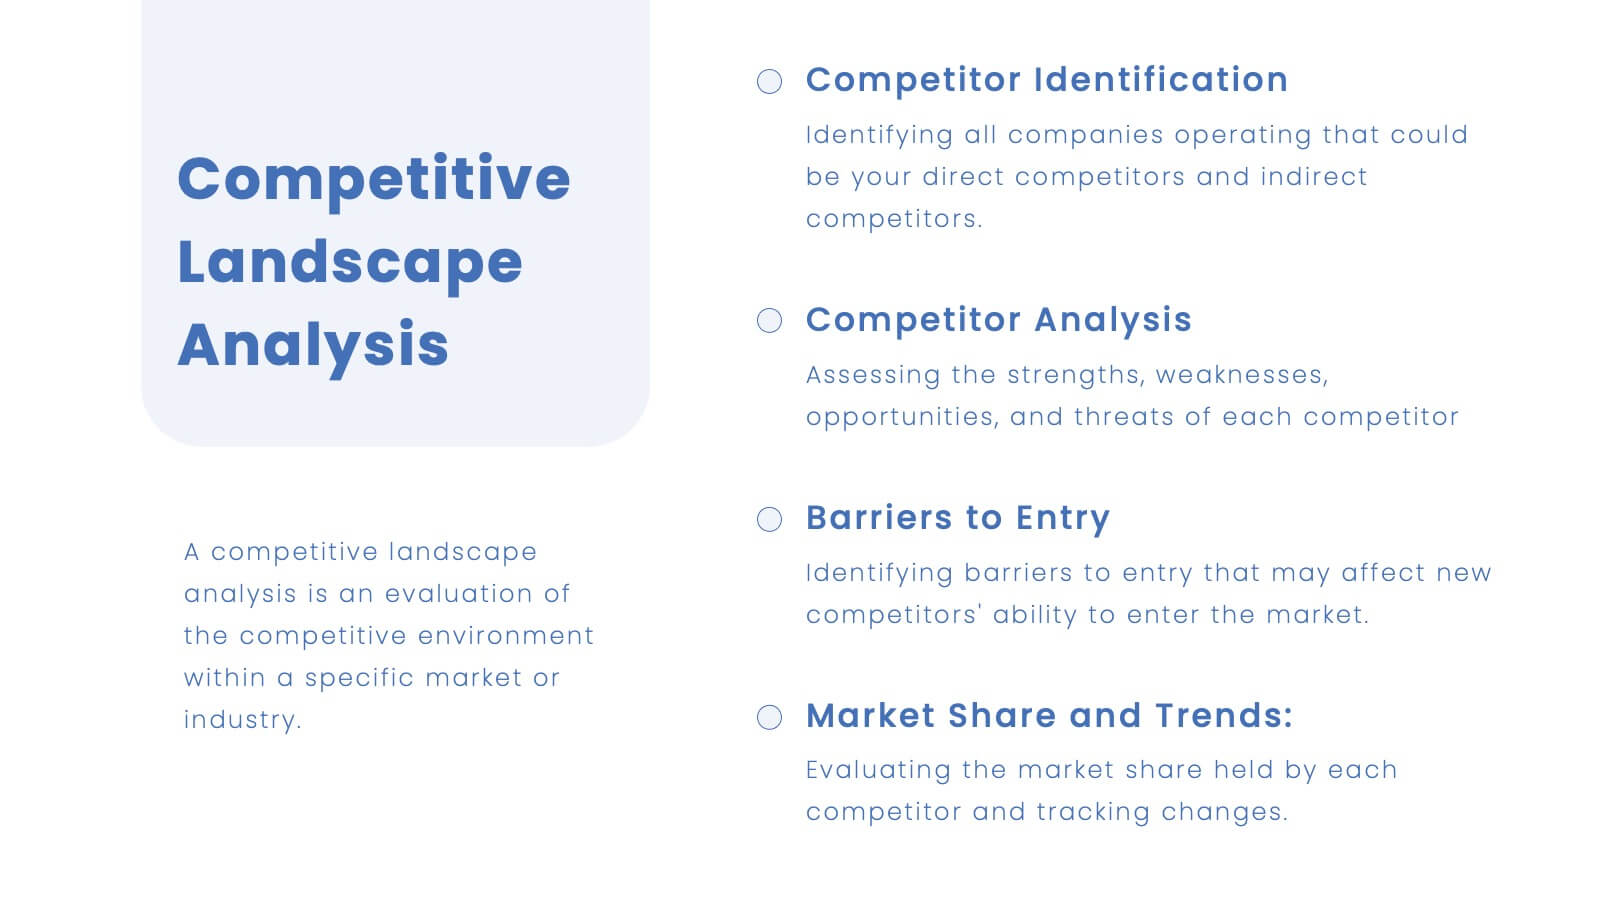
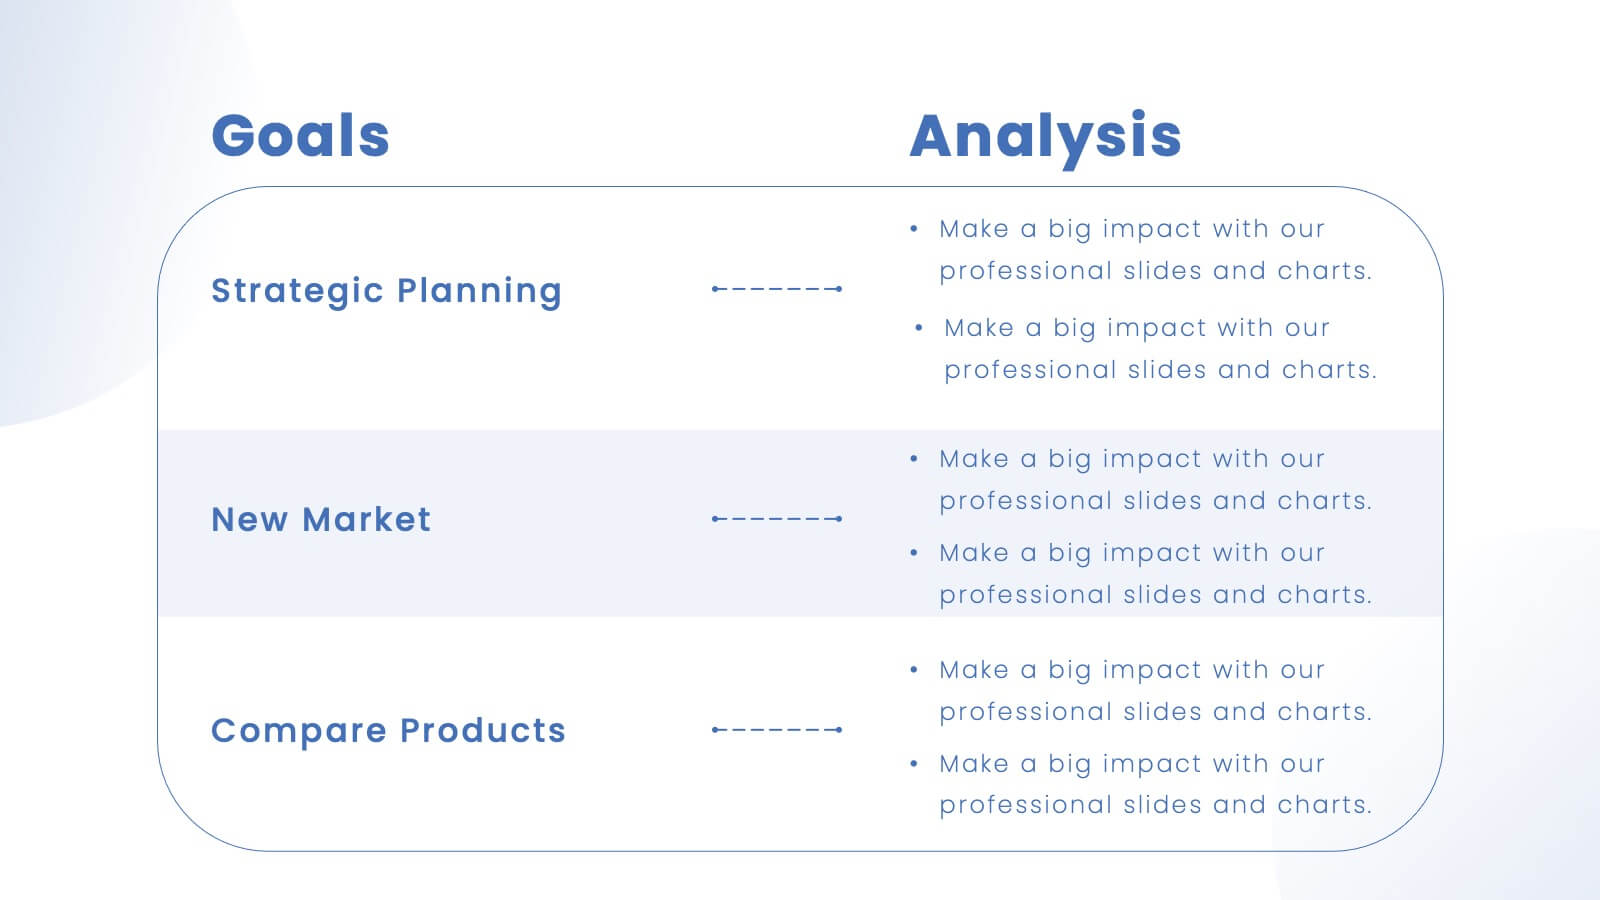
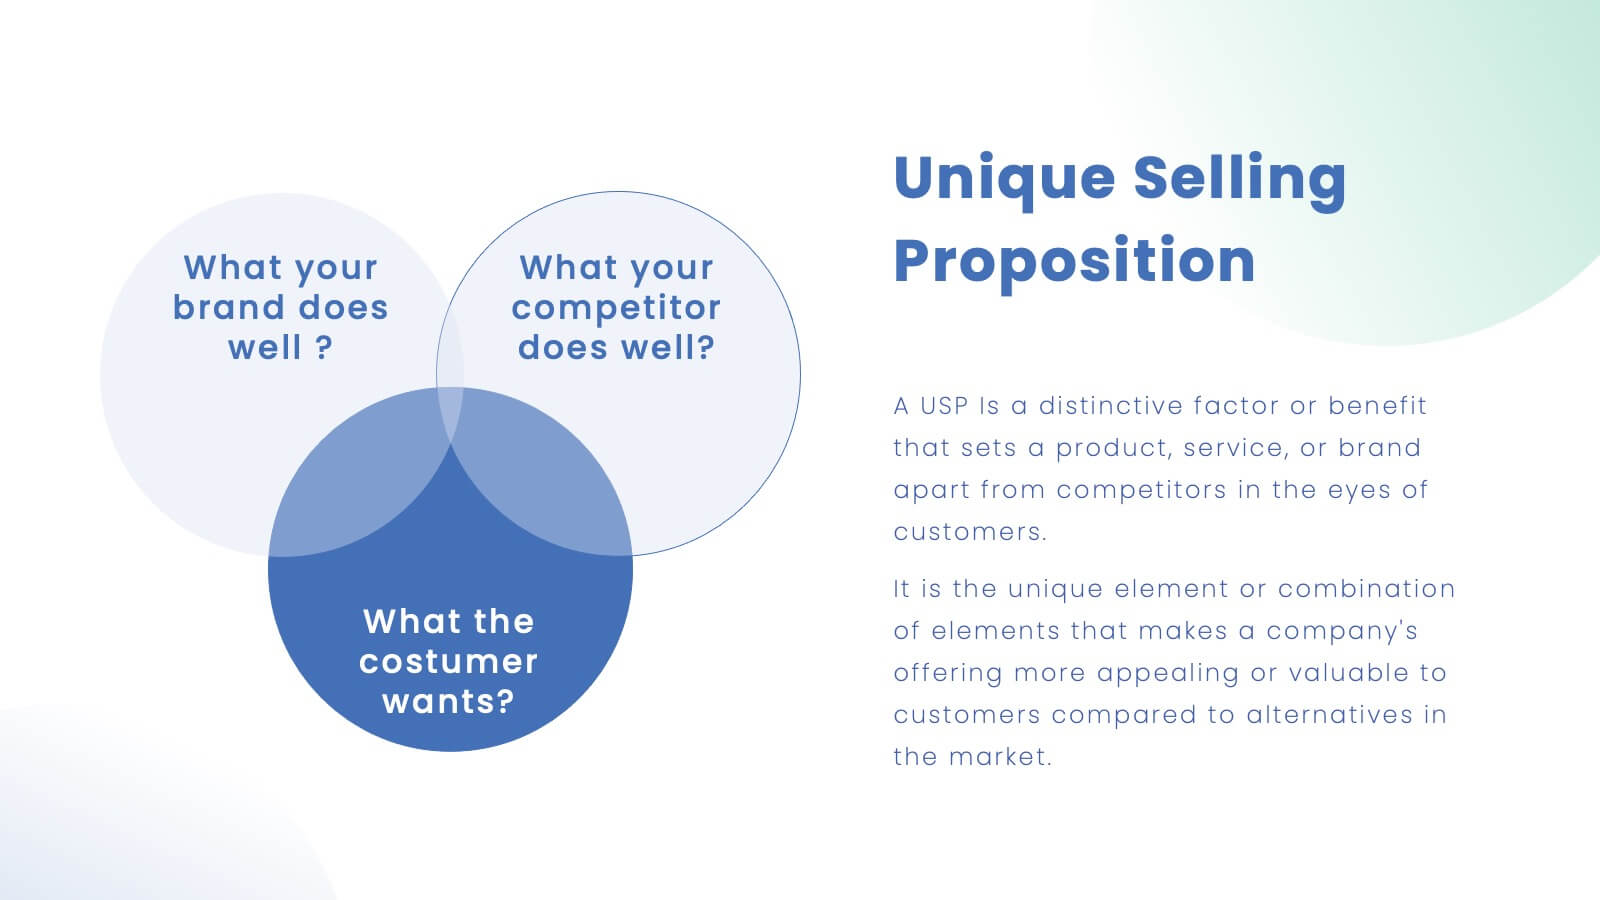
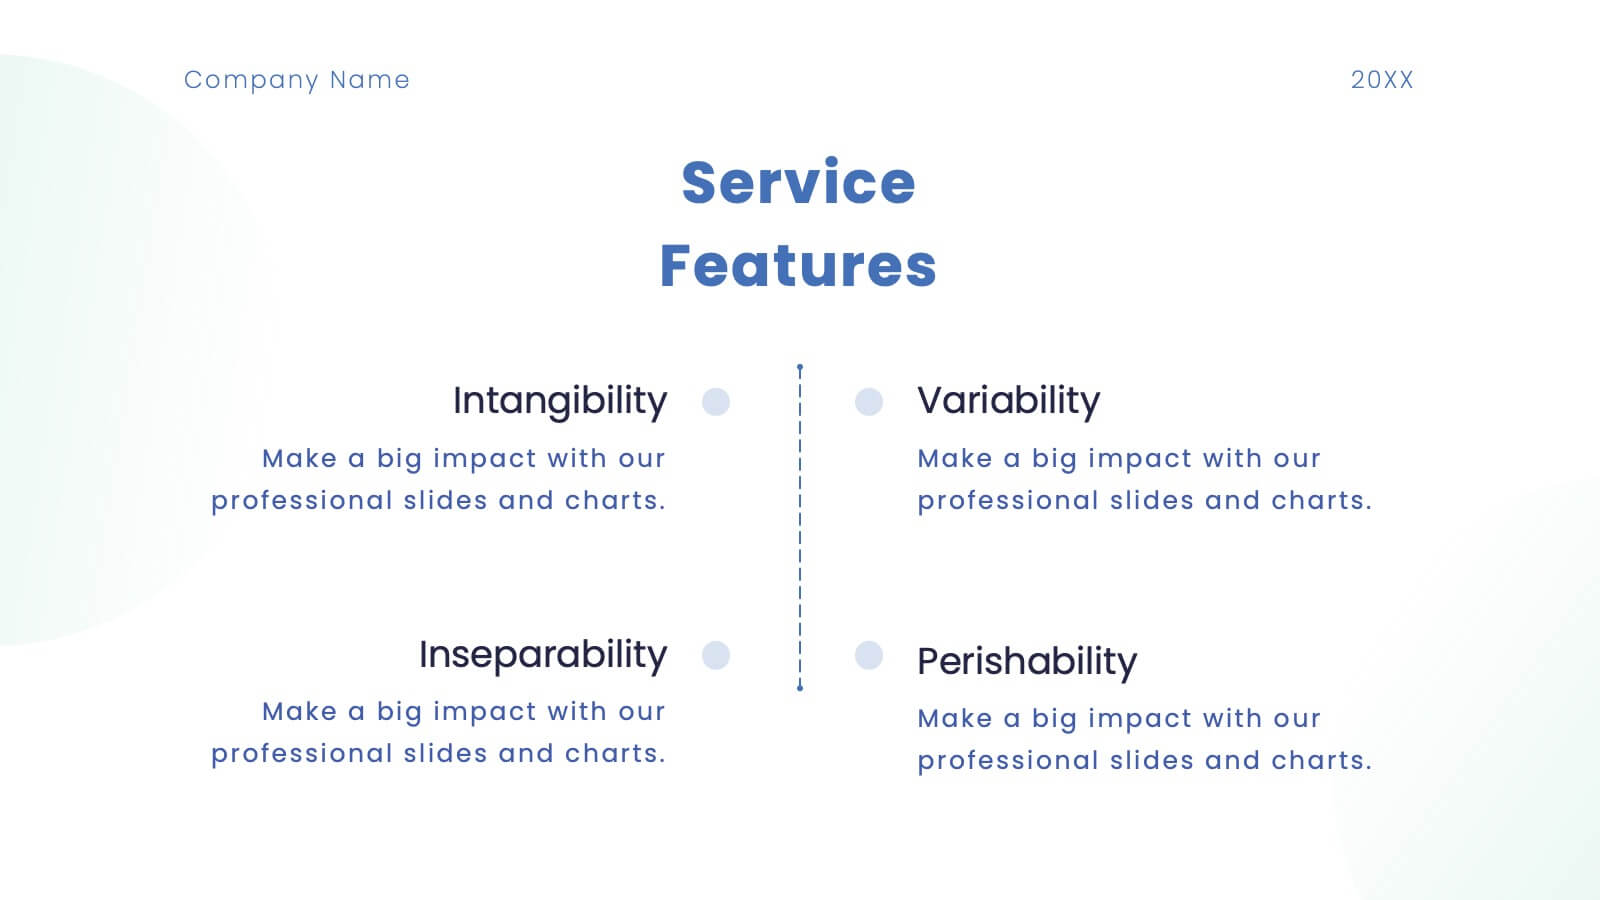
Quintara Rebranding Project Plan Presentation
Revamp your brand with confidence using this dynamic rebranding project plan presentation. Covering key aspects like brand positioning, market analysis, visual identity, and unique selling propositions, this template helps you craft a compelling brand strategy. Fully customizable and compatible with PowerPoint, Keynote, and Google Slides for a seamless, professional presentation experience.


22 diapositivas
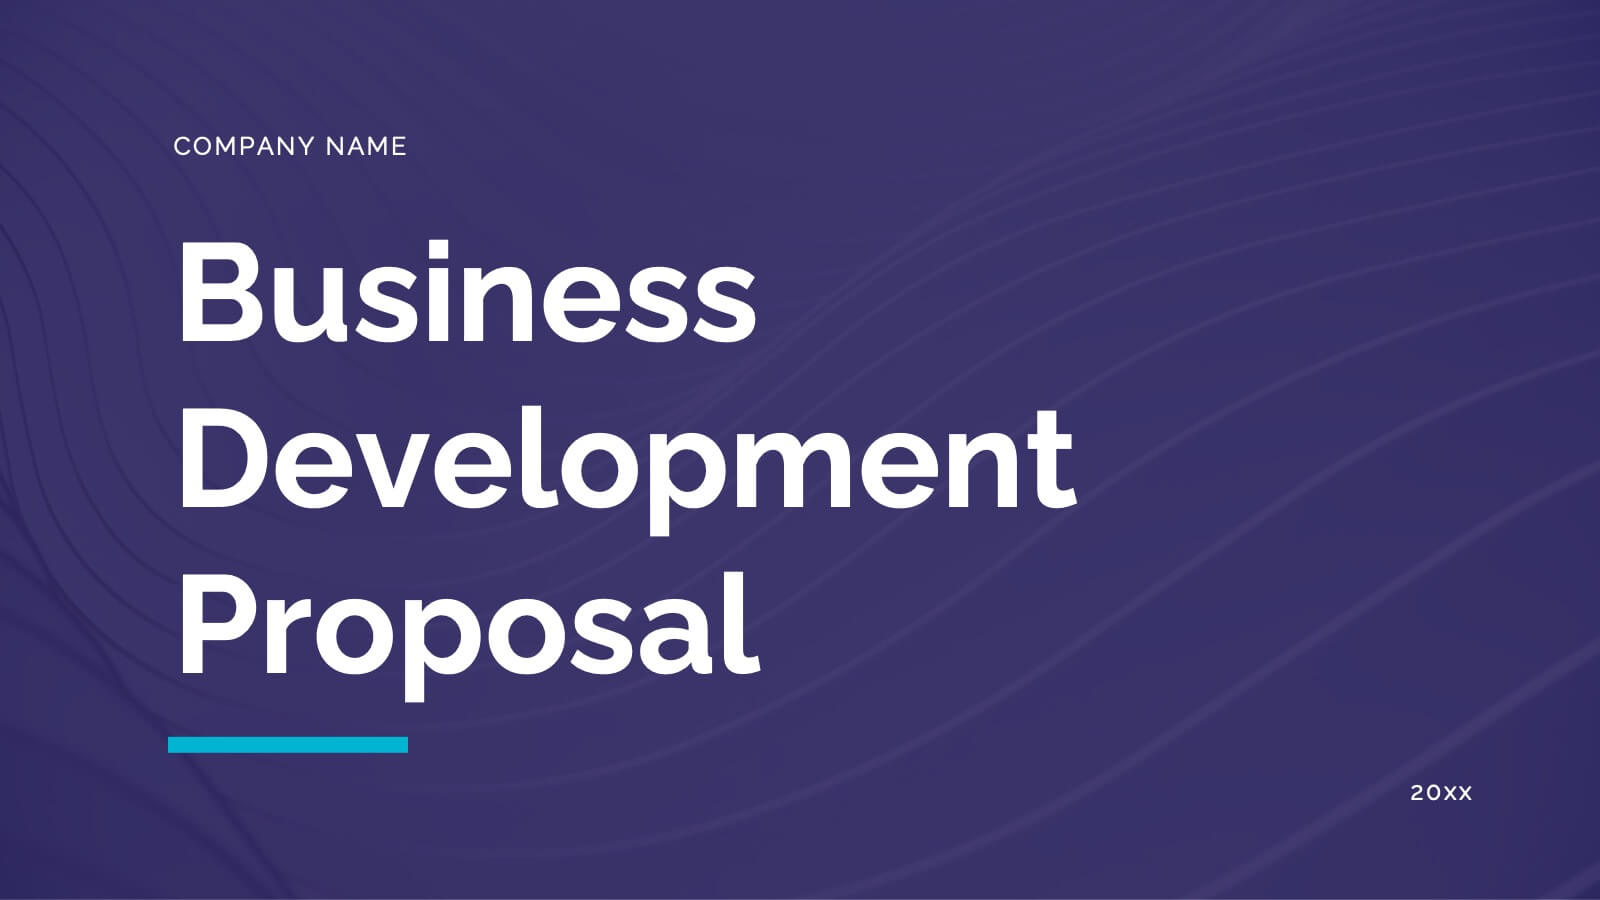
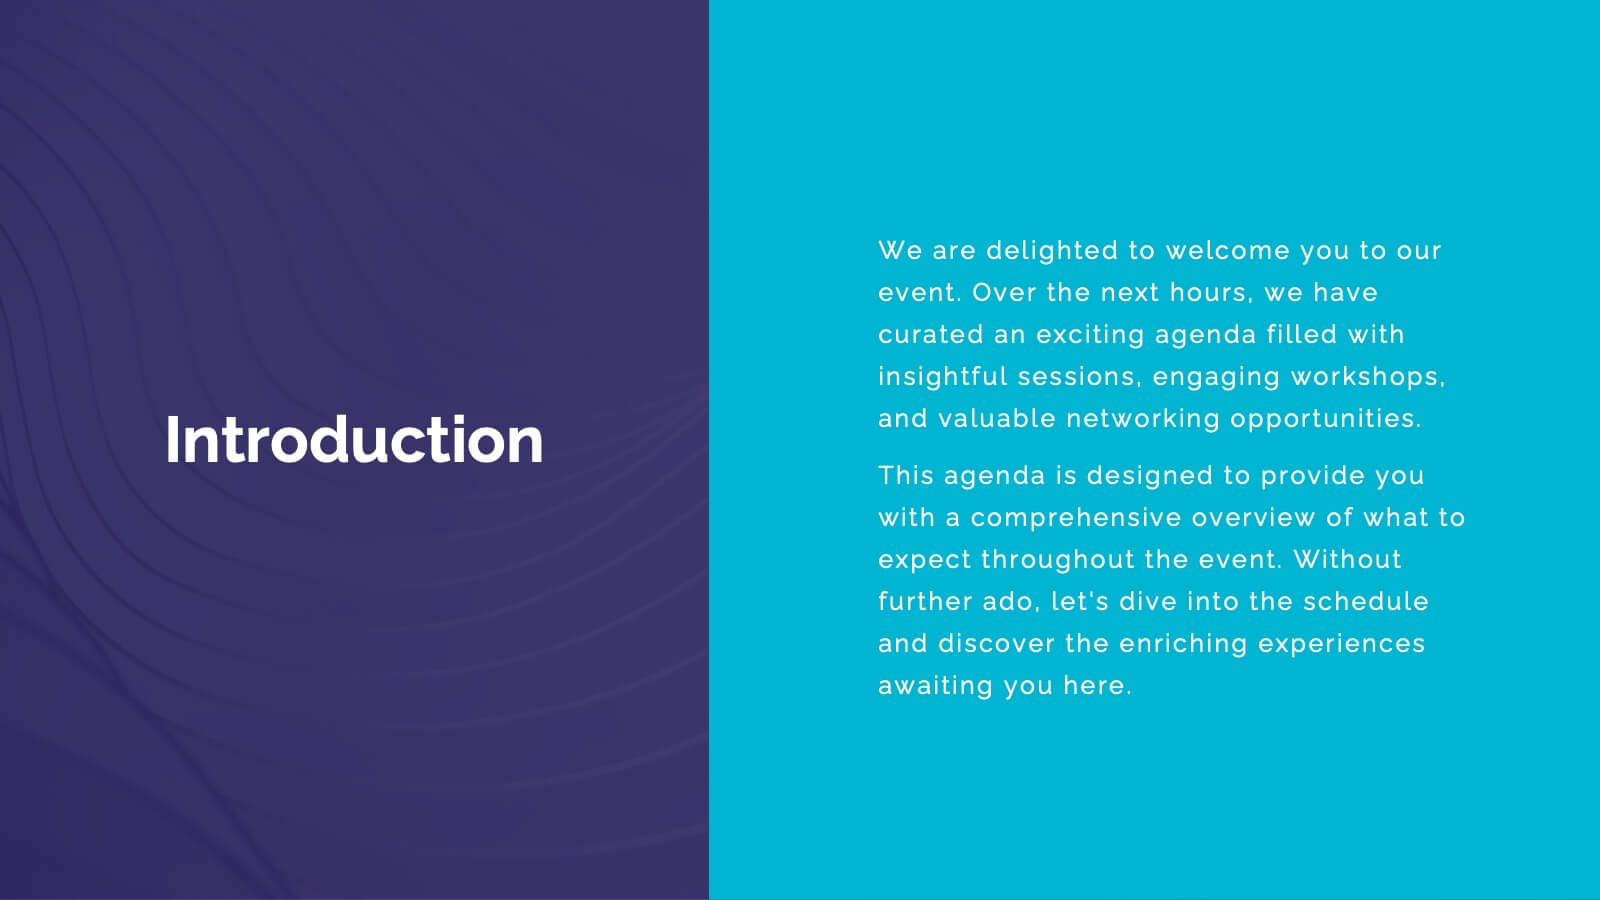
Nimbus Business Development Proposal Presentation
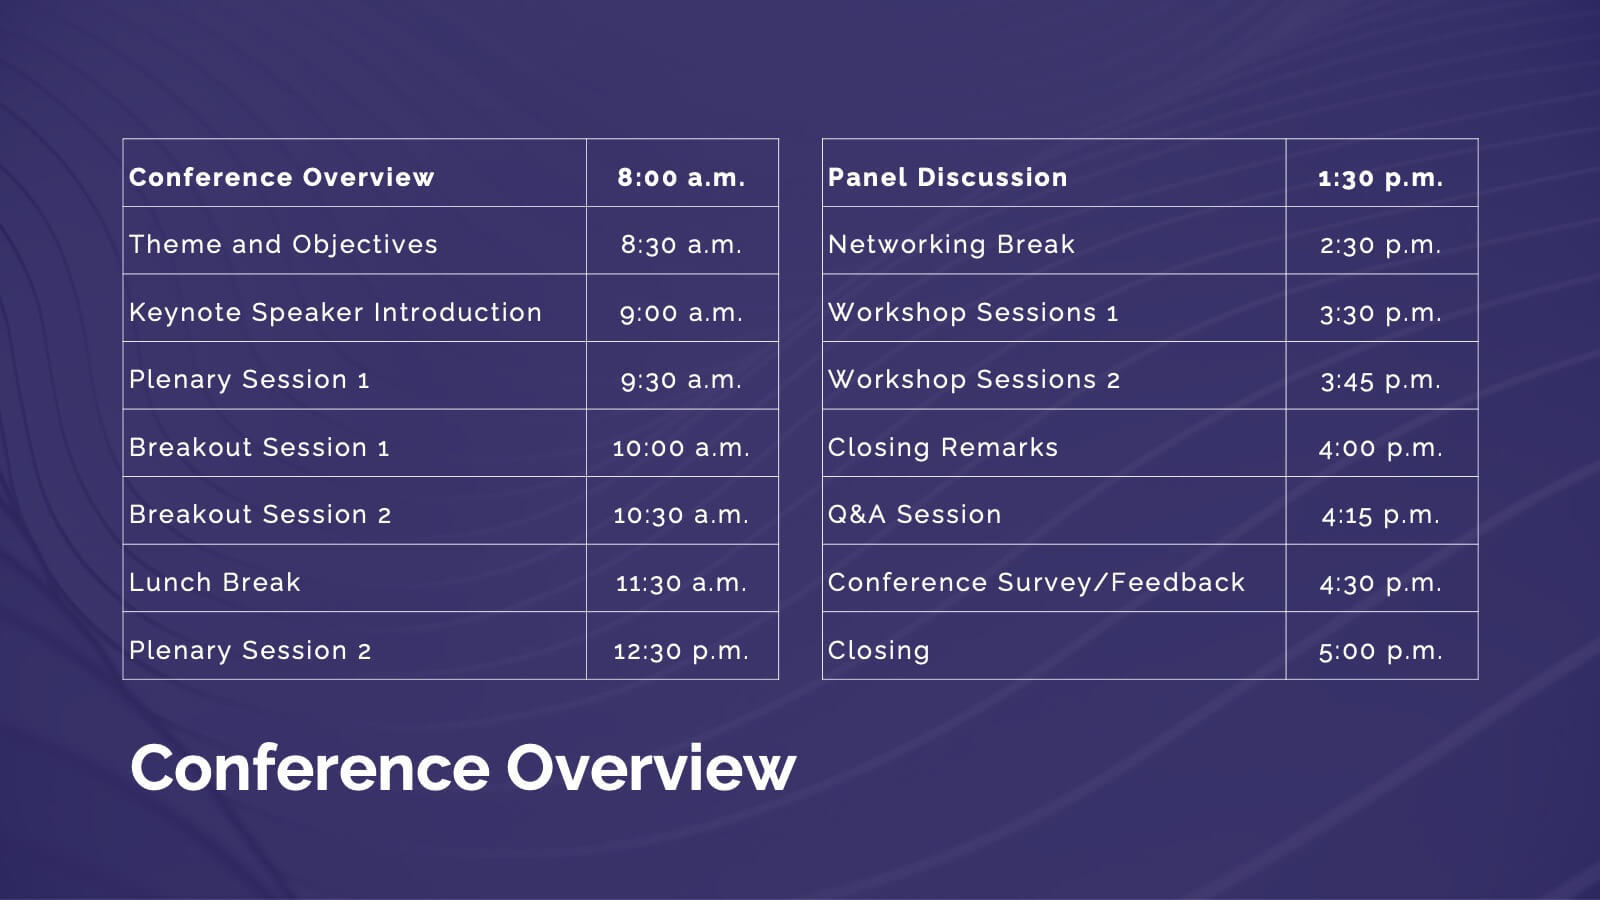
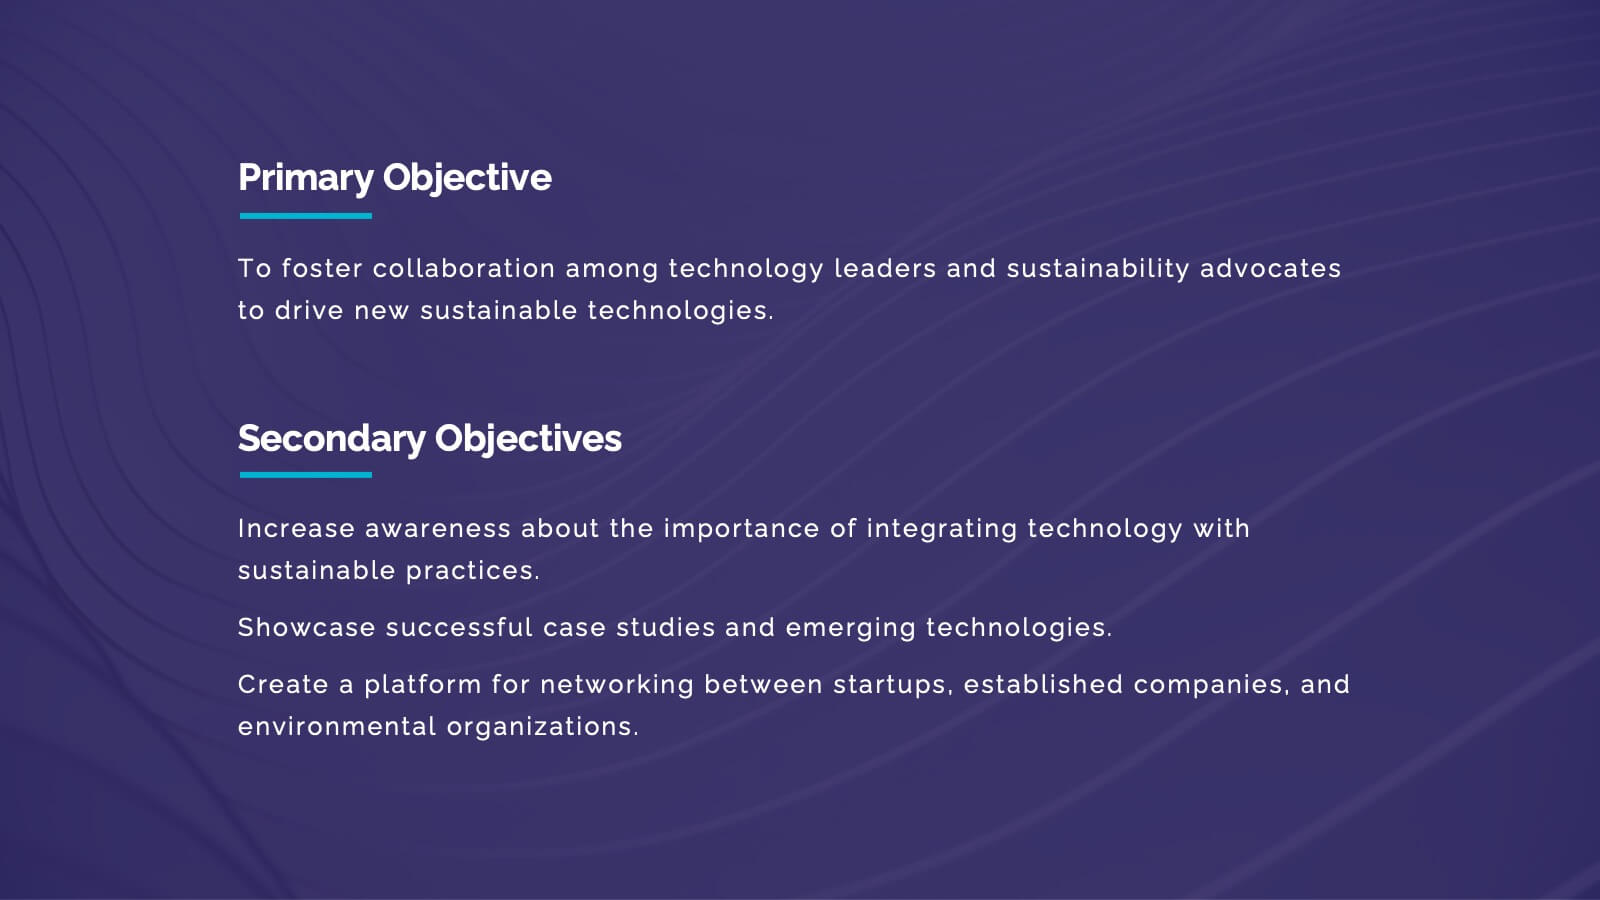
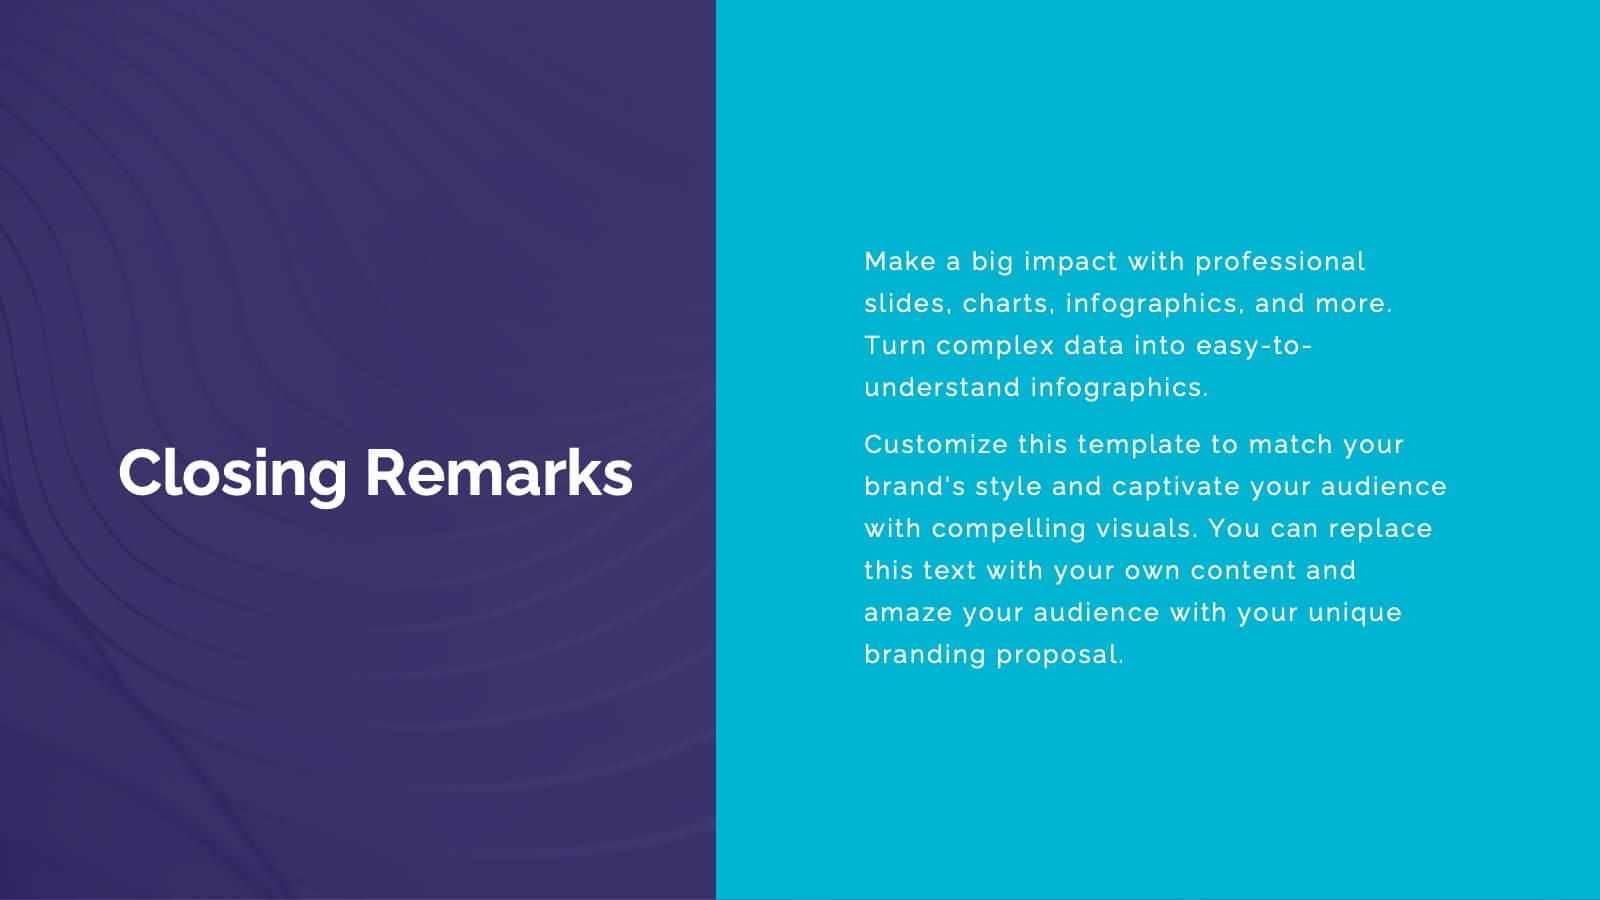
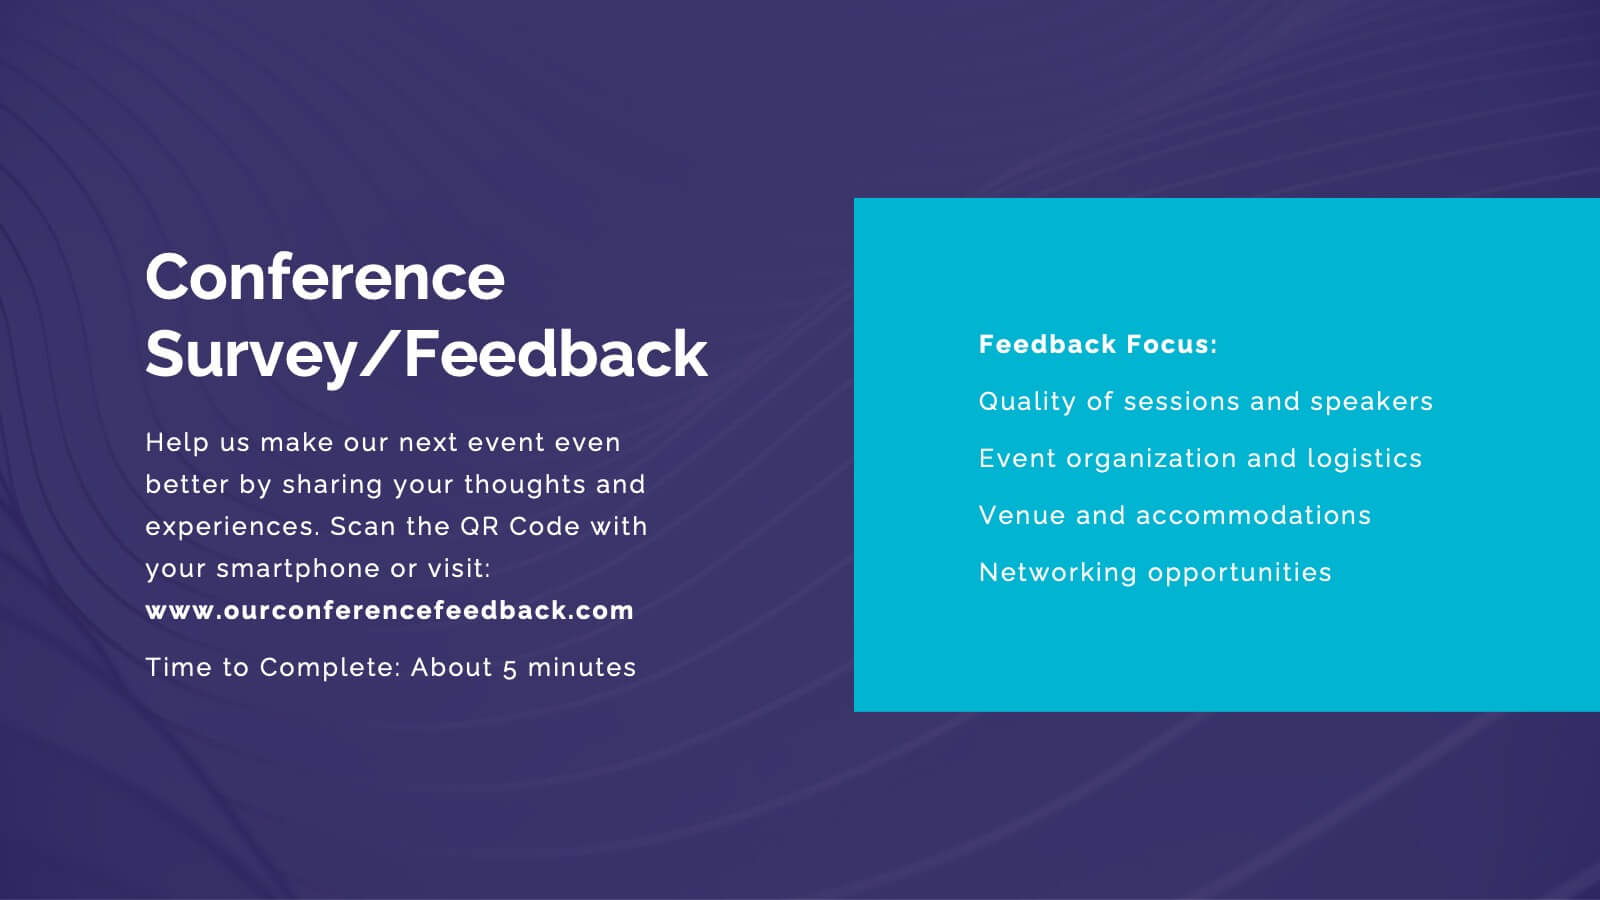
Boost your business presentations with this vibrant, professional template designed for business development proposals. Perfect for detailing conference overviews, themes, objectives, and keynotes, it features a clean and engaging layout. Highlight critical sessions and networking opportunities to captivate your audience. Compatible with PowerPoint, Keynote, and Google Slides, it ensures seamless presentations on any platform.


8 diapositivas
Winning Strategies for Professional Success Presentation
Showcase your top performers, strategic milestones, or ranked insights with this podium-style template. Featuring vibrant visuals and structured layout, it’s ideal for performance reviews, leadership presentations, and competitive analysis. Fully editable in PowerPoint, Keynote, and Google Slides—perfect for professional success stories, rankings, and progress highlights.


3 diapositivas
Agricultural Business Plan Presentation
Showcase your farming strategies with this agricultural business plan template, featuring plant growth visuals and clean, modern layouts. Ideal for agribusiness proposals, sustainability reports, and agricultural project planning. Fully editable in Canva, PowerPoint, and Google Slides, allowing you to customize text, icons, and colors to match your brand identity.


5 diapositivas
Corporate Office Life Illustration Scene Presentation
Bring your workplace concepts to life with this modern office scene illustration. Featuring a top-down view of diverse team members in a meeting, this slide is perfect for showcasing collaboration, brainstorming, or teamwork insights. Fully customizable and compatible with PowerPoint, Keynote, and Google Slides for seamless editing.


26 diapositivas
Corporate Social Responsibility (CSR) Presentation
Make a difference with our Corporate Social Responsibility (CSR) presentation template, perfect for PowerPoint, Keynote, and Google Slides. This template is designed for leaders and organizations committed to ethical practices, environmental stewardship, and community engagement. Our CSR template empowers you to showcase your company's commitment to social responsibility. It provides a structured format to present your sustainability efforts, ethical initiatives, and community projects. It helps you to communicate the value of CSR to stakeholders and illustrates how responsible business practices contribute to overall success. With customizable visuals, you can highlight your CSR achievements and goals, fostering transparency and trust. This template is SEO-optimized, ensuring that your message of commitment to social responsibility reaches a broad audience. Use this template to promote your CSR strategy and demonstrate how your organization is playing a pivotal role in building a sustainable and equitable future.


23 diapositivas
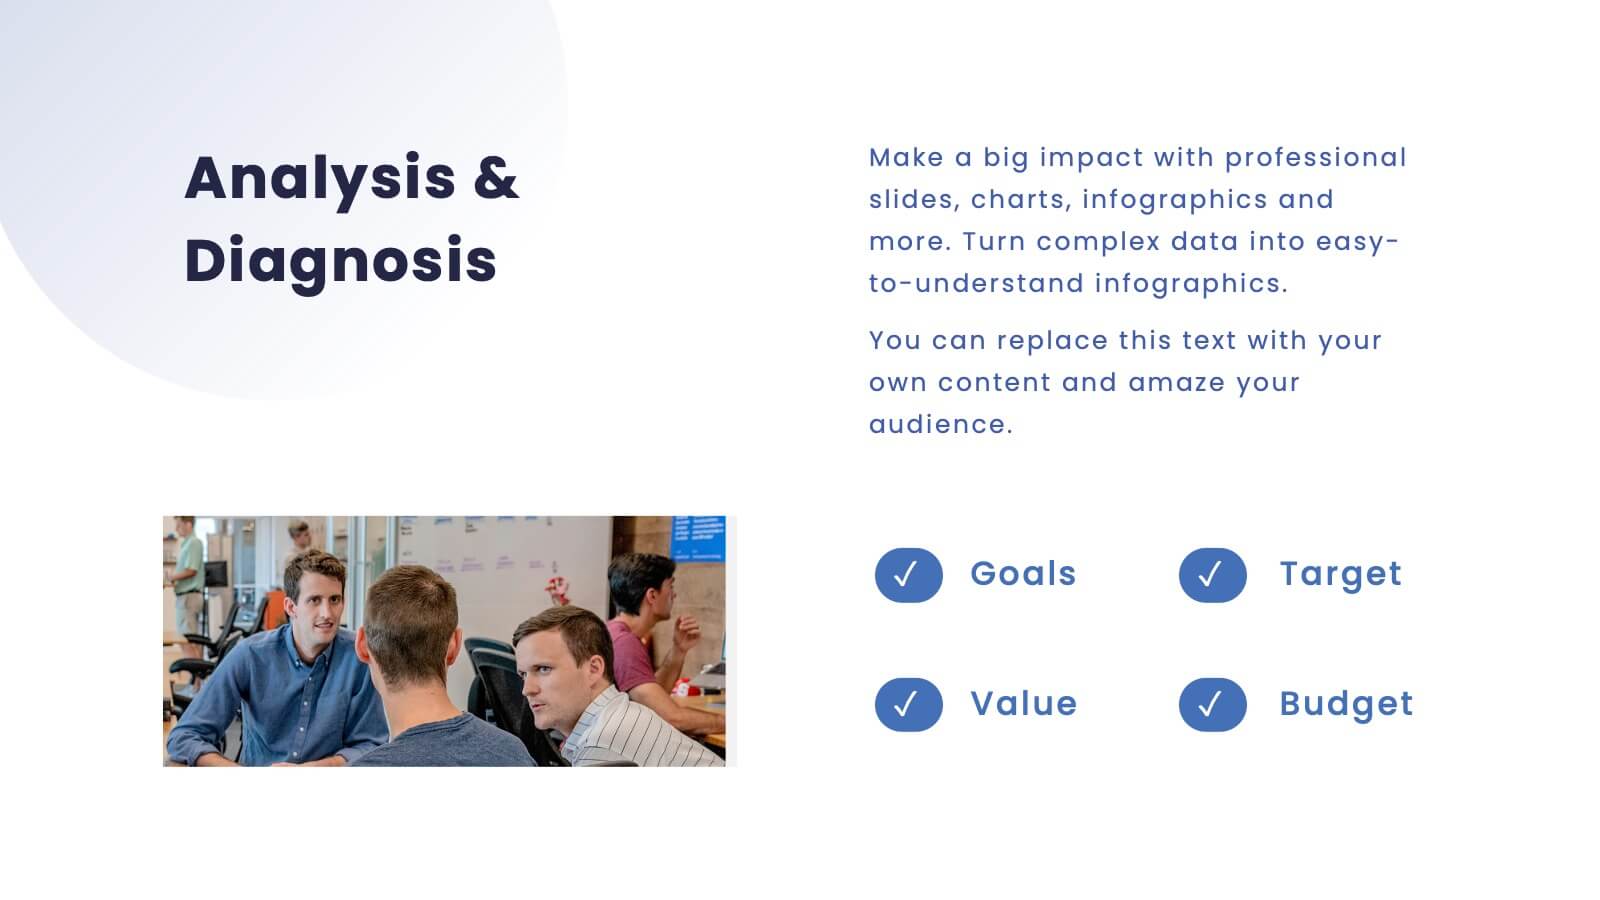
Orbit Marketing Strategy Plan Presentation
Elevate your marketing strategy presentations with this vibrant and dynamic template! Perfect for analyzing market trends, identifying target audiences, and outlining strategic objectives. Ideal for marketing professionals aiming to captivate their audience and drive results. Compatible with PowerPoint, Keynote, and Google Slides, this template ensures your strategy is clear, compelling, and effective.


5 diapositivas
Business Activity Rotation Cycle Presentation
Showcase continuous workflows with the Business Activity Rotation Cycle Presentation. Ideal for operations, planning, and strategy meetings, this template visualizes multi-phase cycles with clean, editable layouts. Use it to outline repeated business functions, processes, or initiatives. Compatible with PowerPoint, Keynote, and Google Slides—perfect for consultants, teams, and business professionals.


4 diapositivas
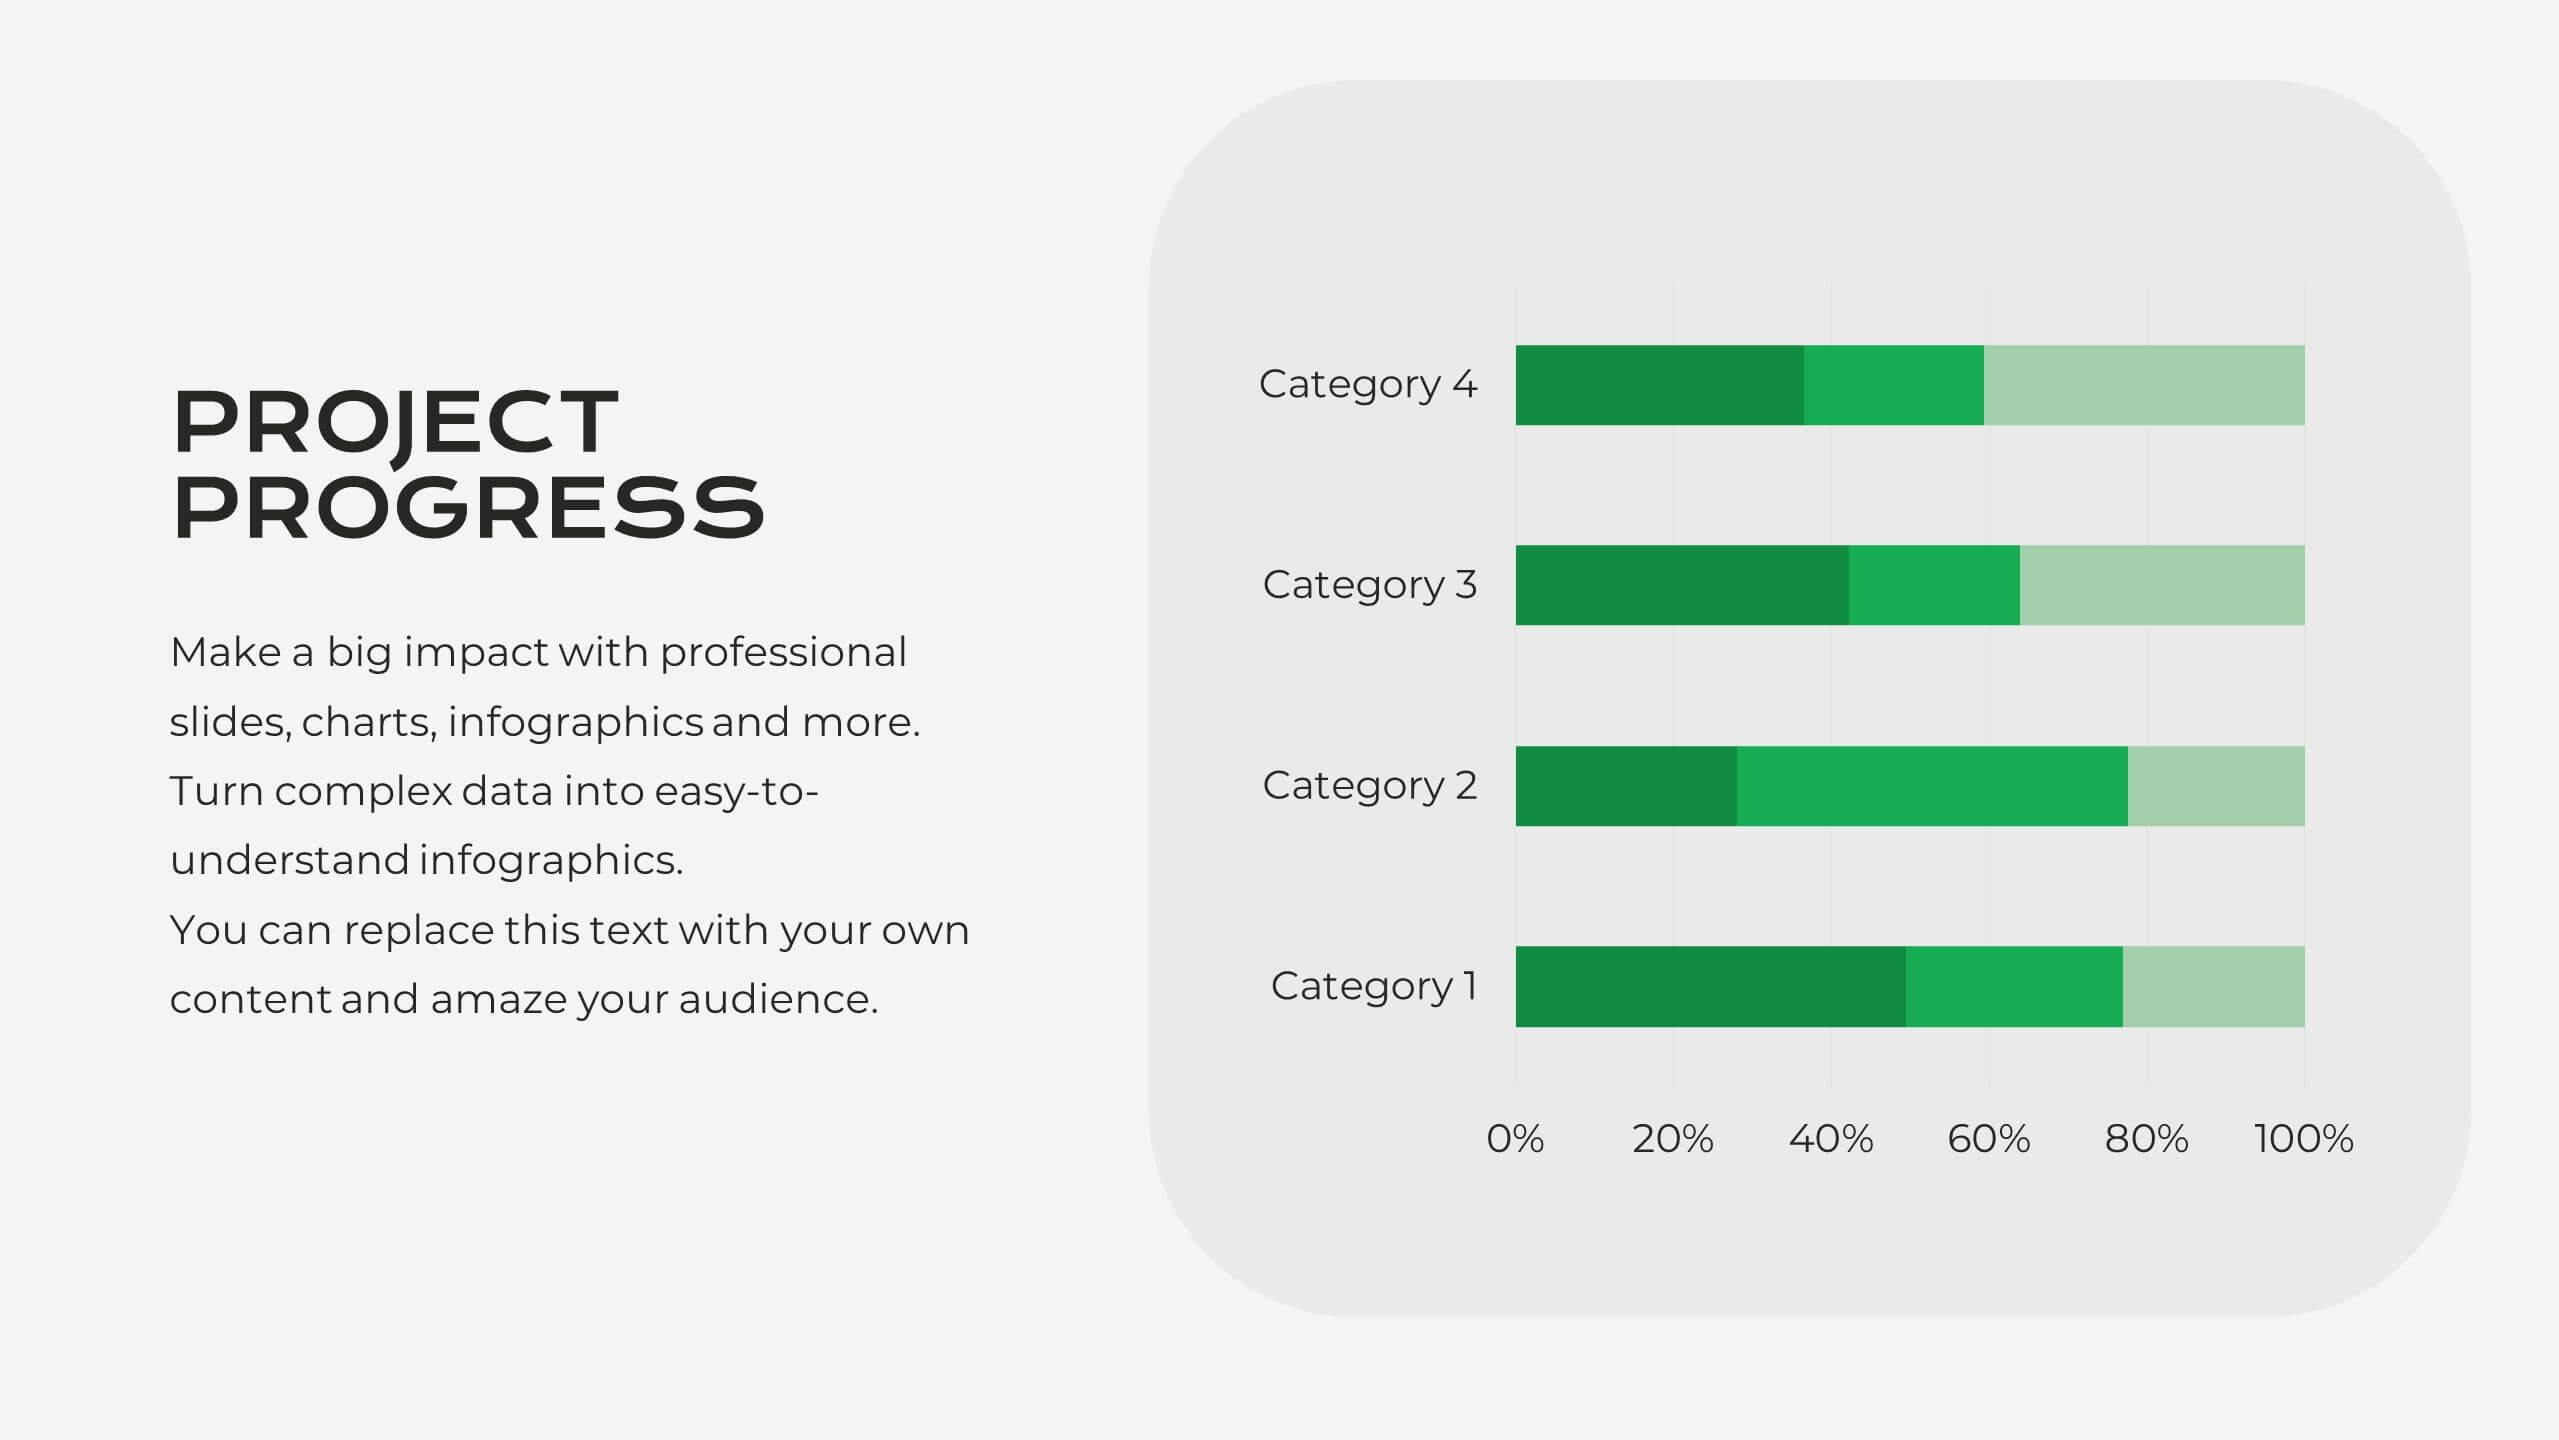
Harvey Ball Chart Business Analysis
Simplify your data-driven storytelling with this Harvey Ball chart slide—perfect for consultants, analysts, and strategy teams. Visualize percentage-based insights across four categories using clean, easy-to-read circular progress visuals. Fully editable in PowerPoint, Keynote, and Google Slides to match your branding and message.