


Características


¿Tienes alguna pregunta?
Recomendar


5 diapositivas
Client Success Story Presentation
Celebrate achievements and highlight results with a vibrant, storytelling layout that turns client wins into memorable visuals. Perfect for showcasing success milestones, project outcomes, and impact metrics, this presentation helps build trust and credibility. Fully compatible with PowerPoint, Keynote, and Google Slides for easy editing and smooth professional delivery.


20 diapositivas
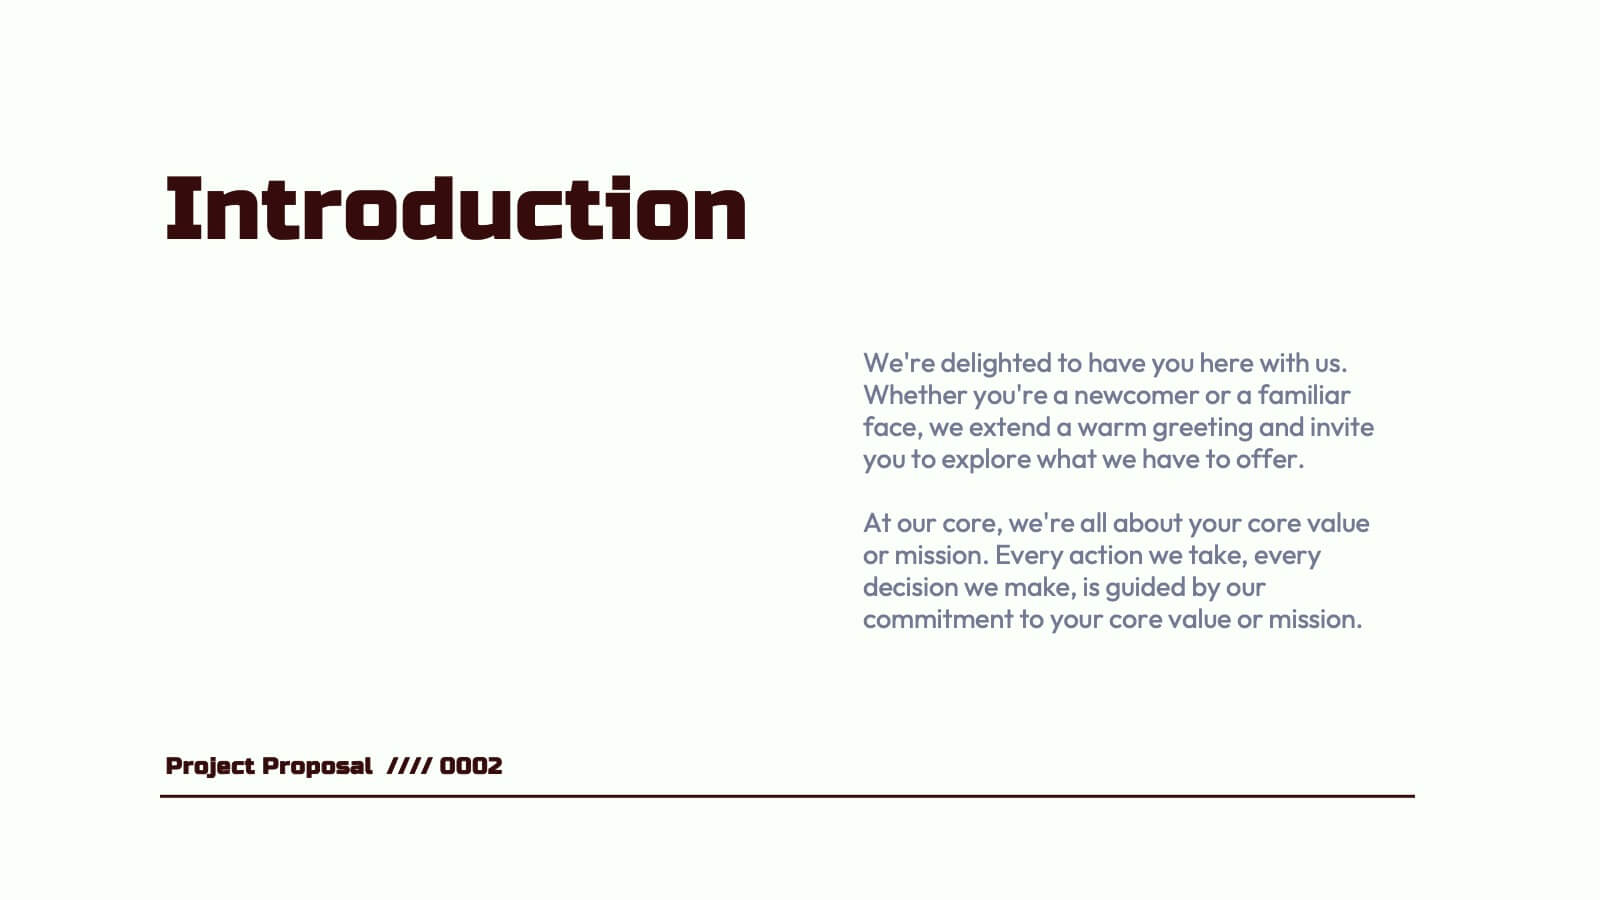
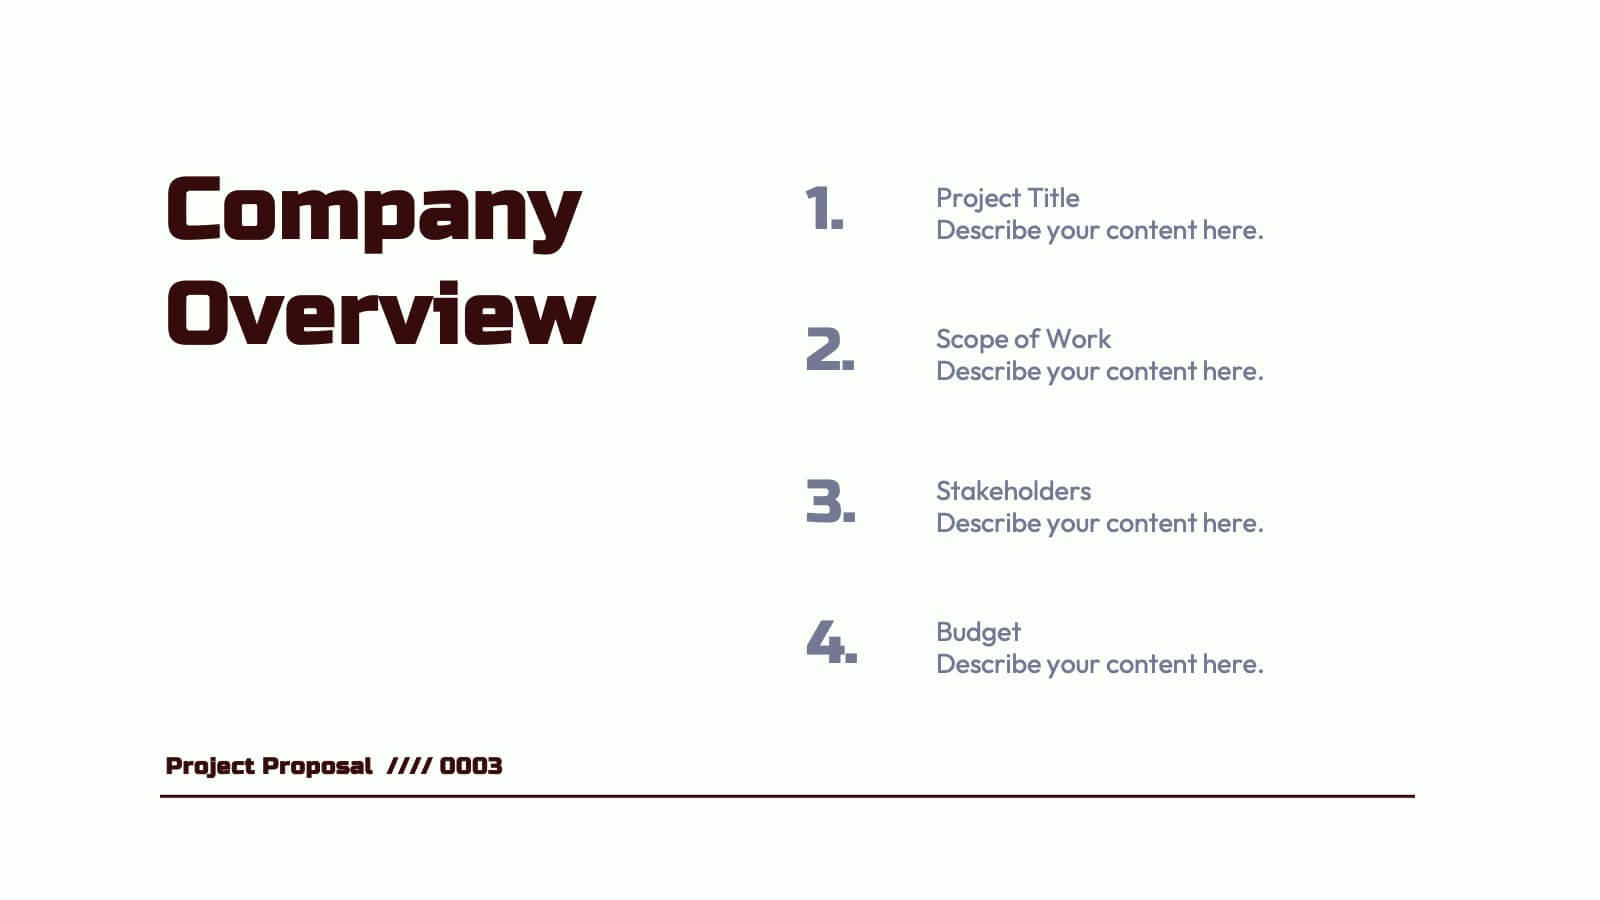
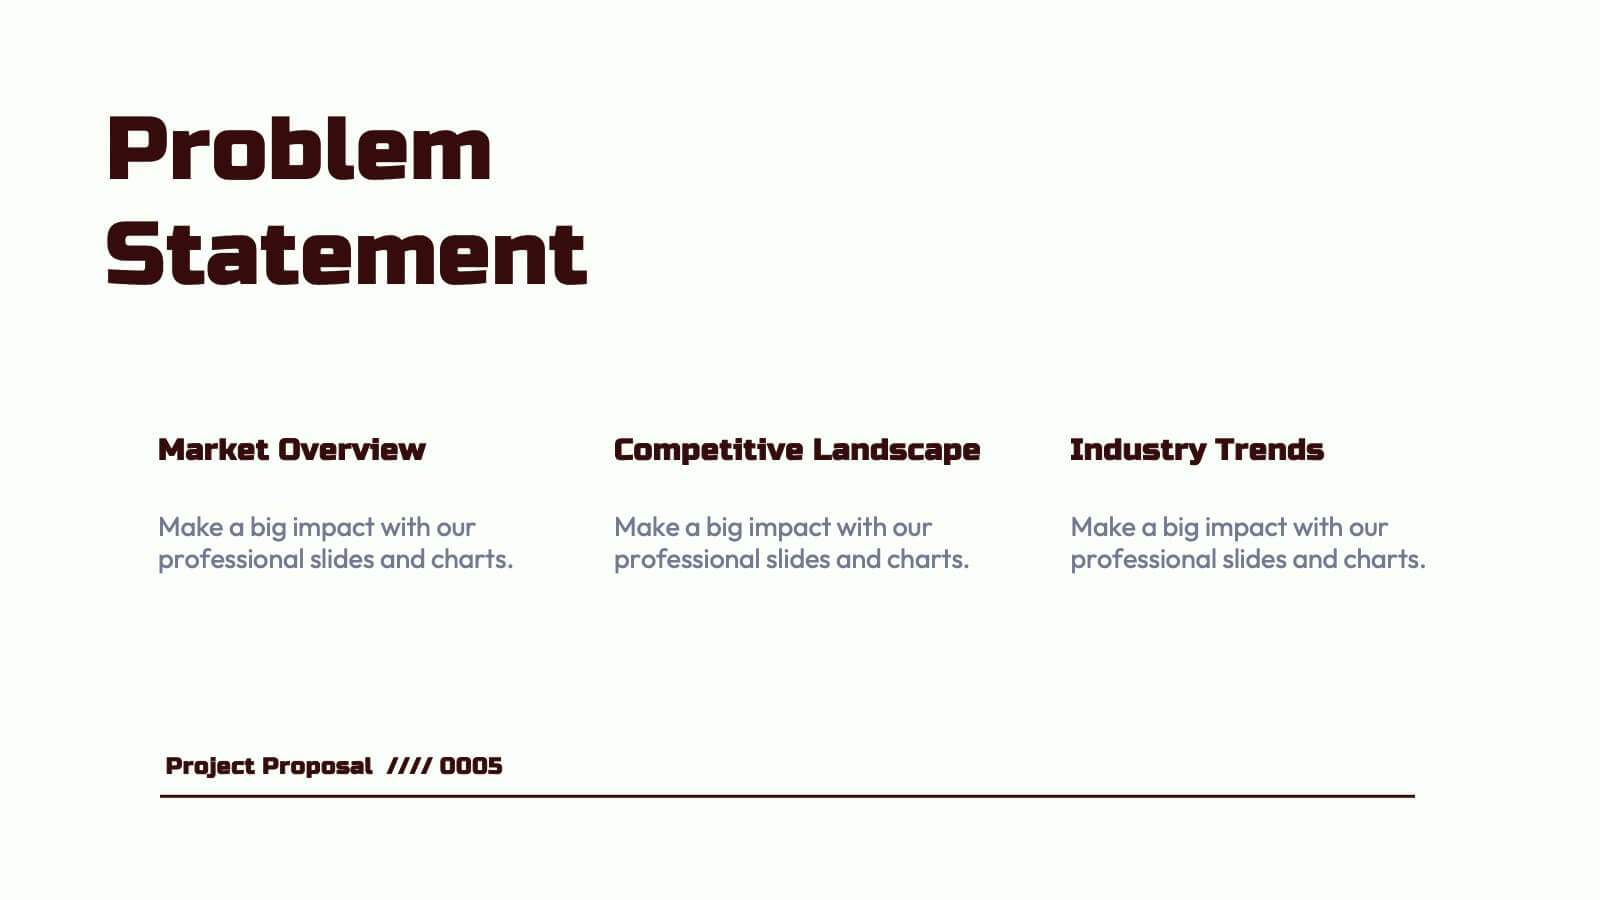
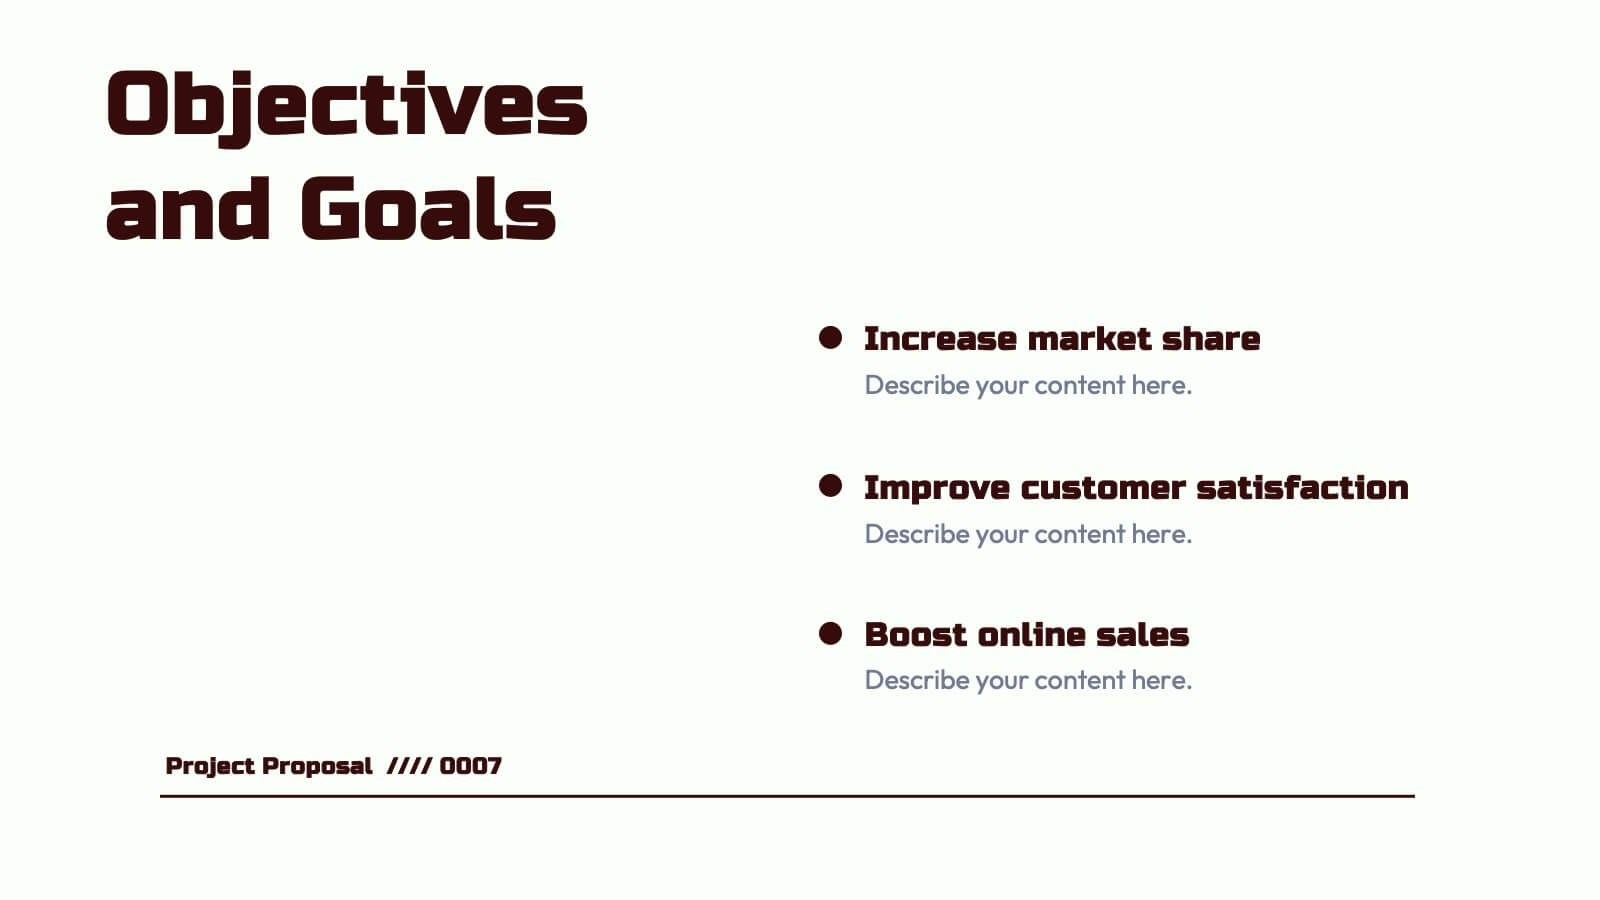
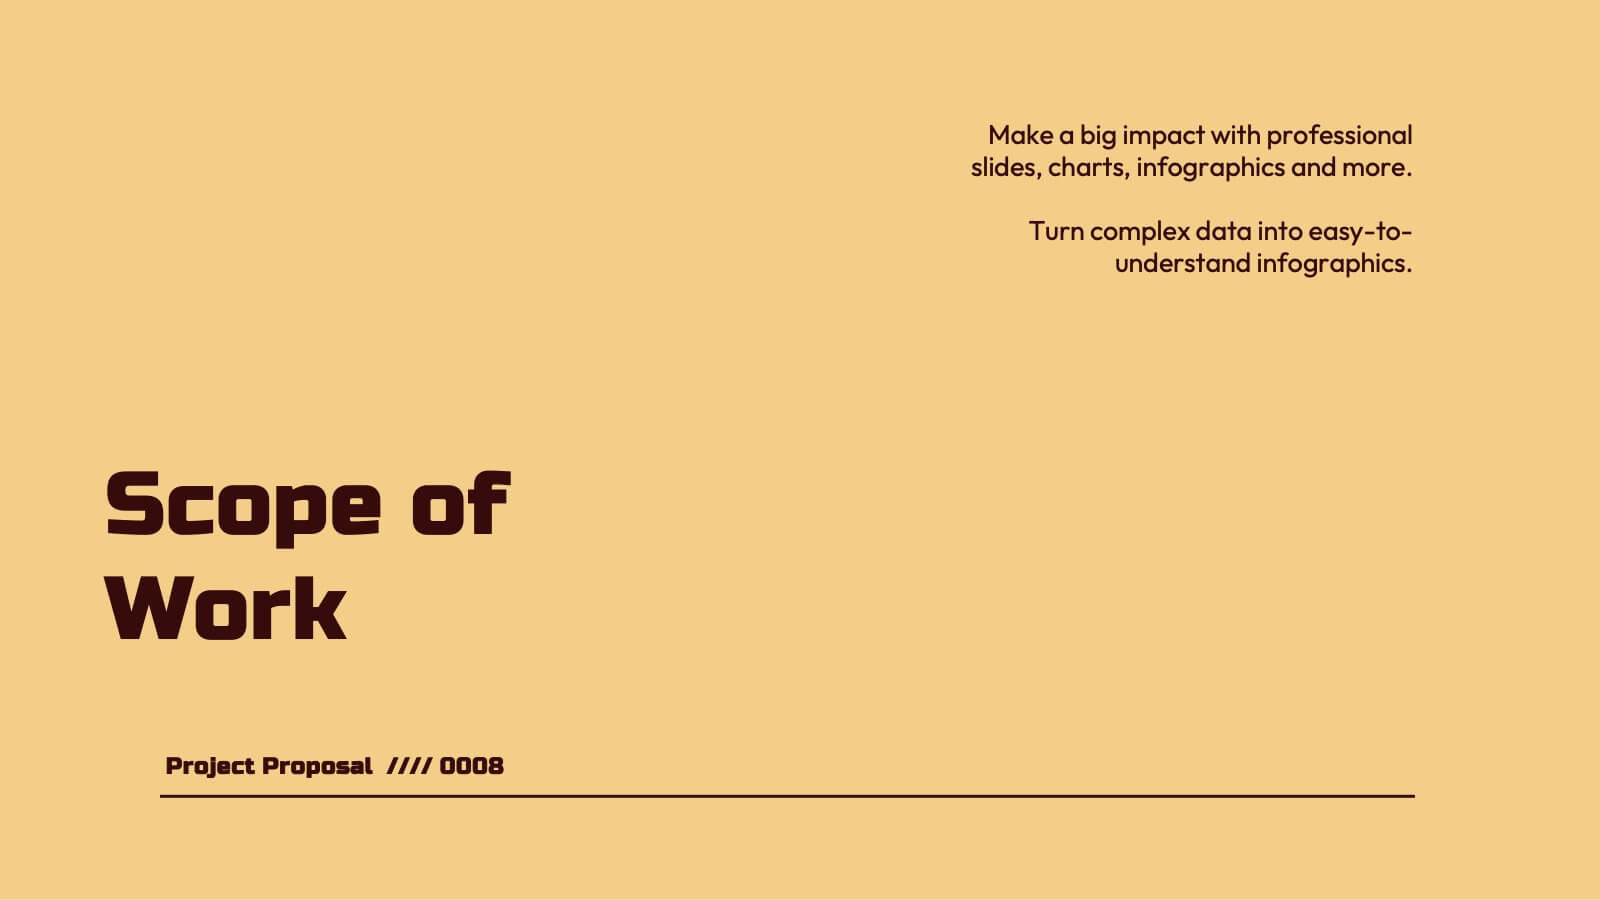
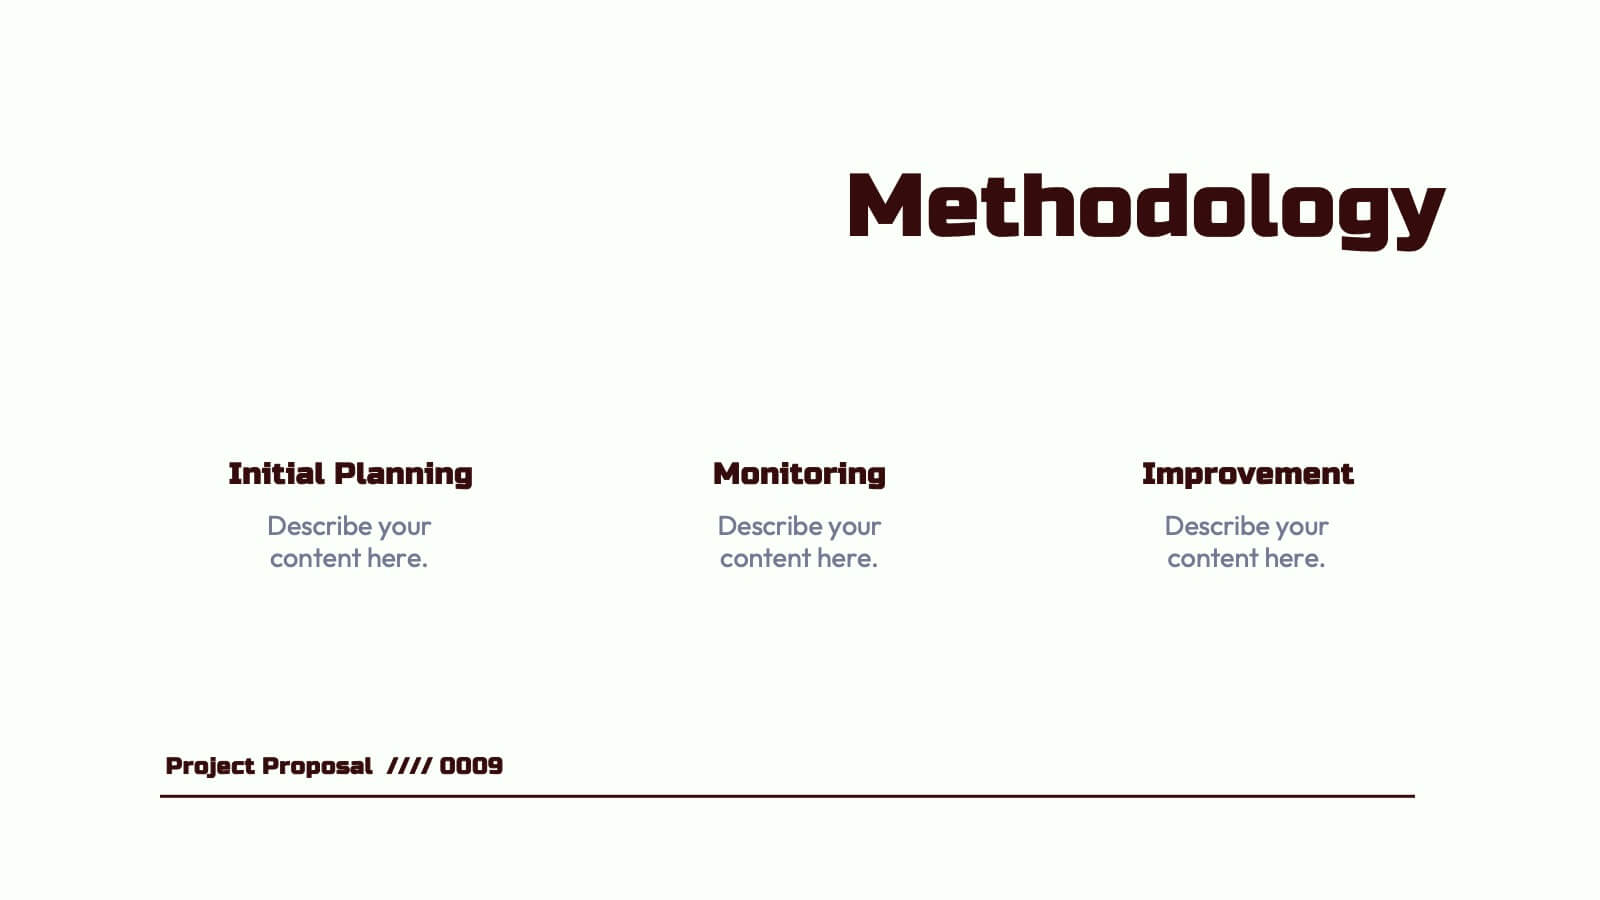
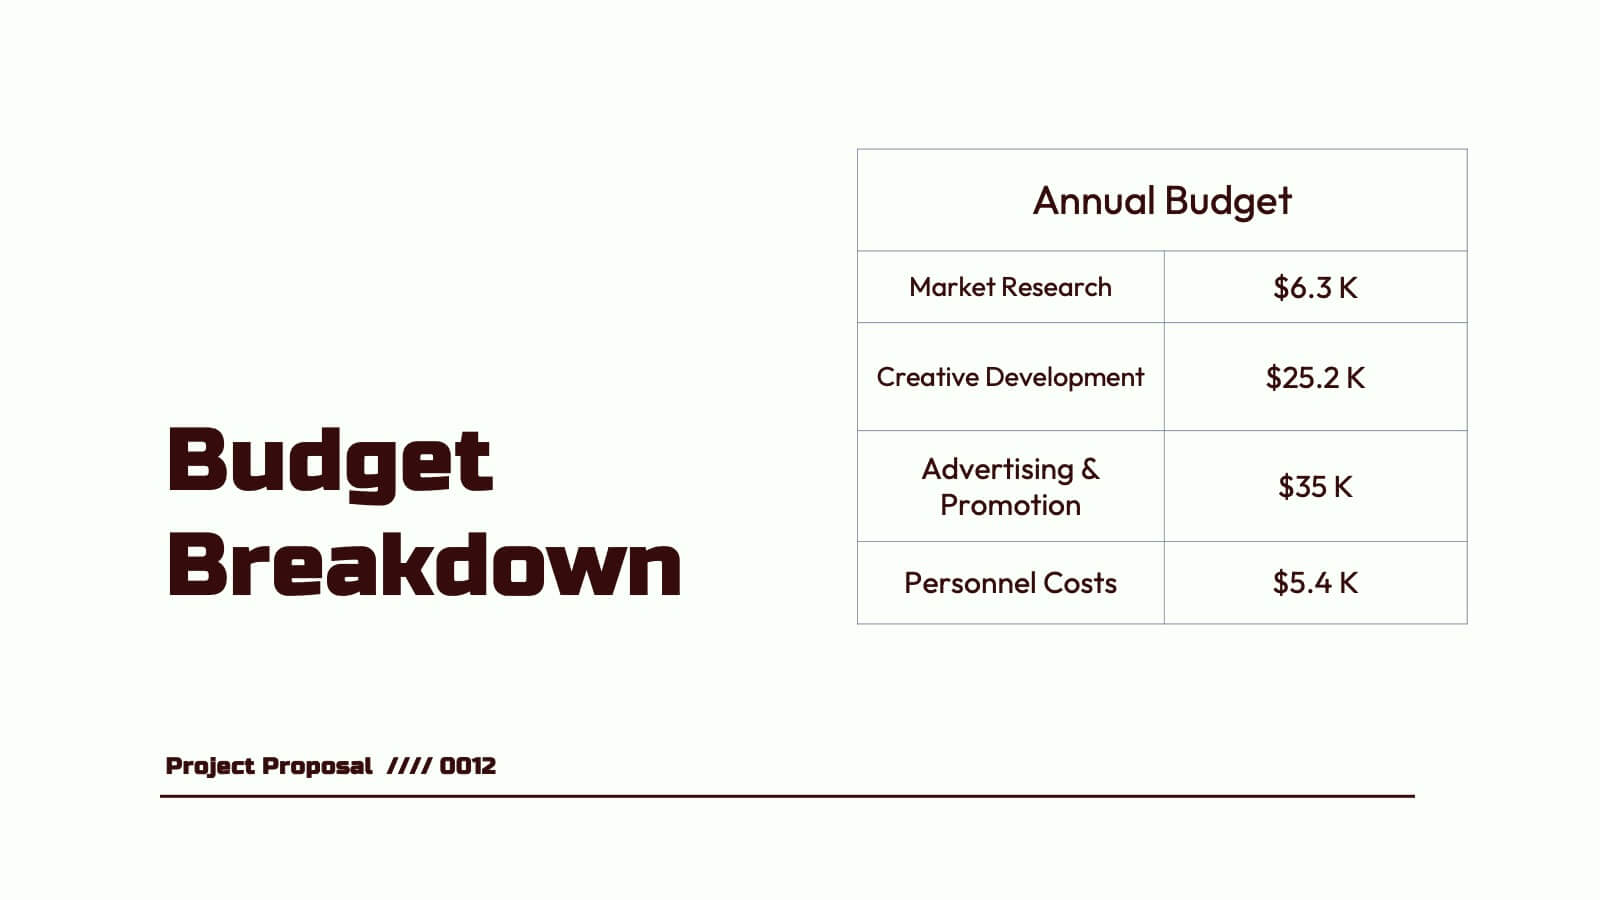
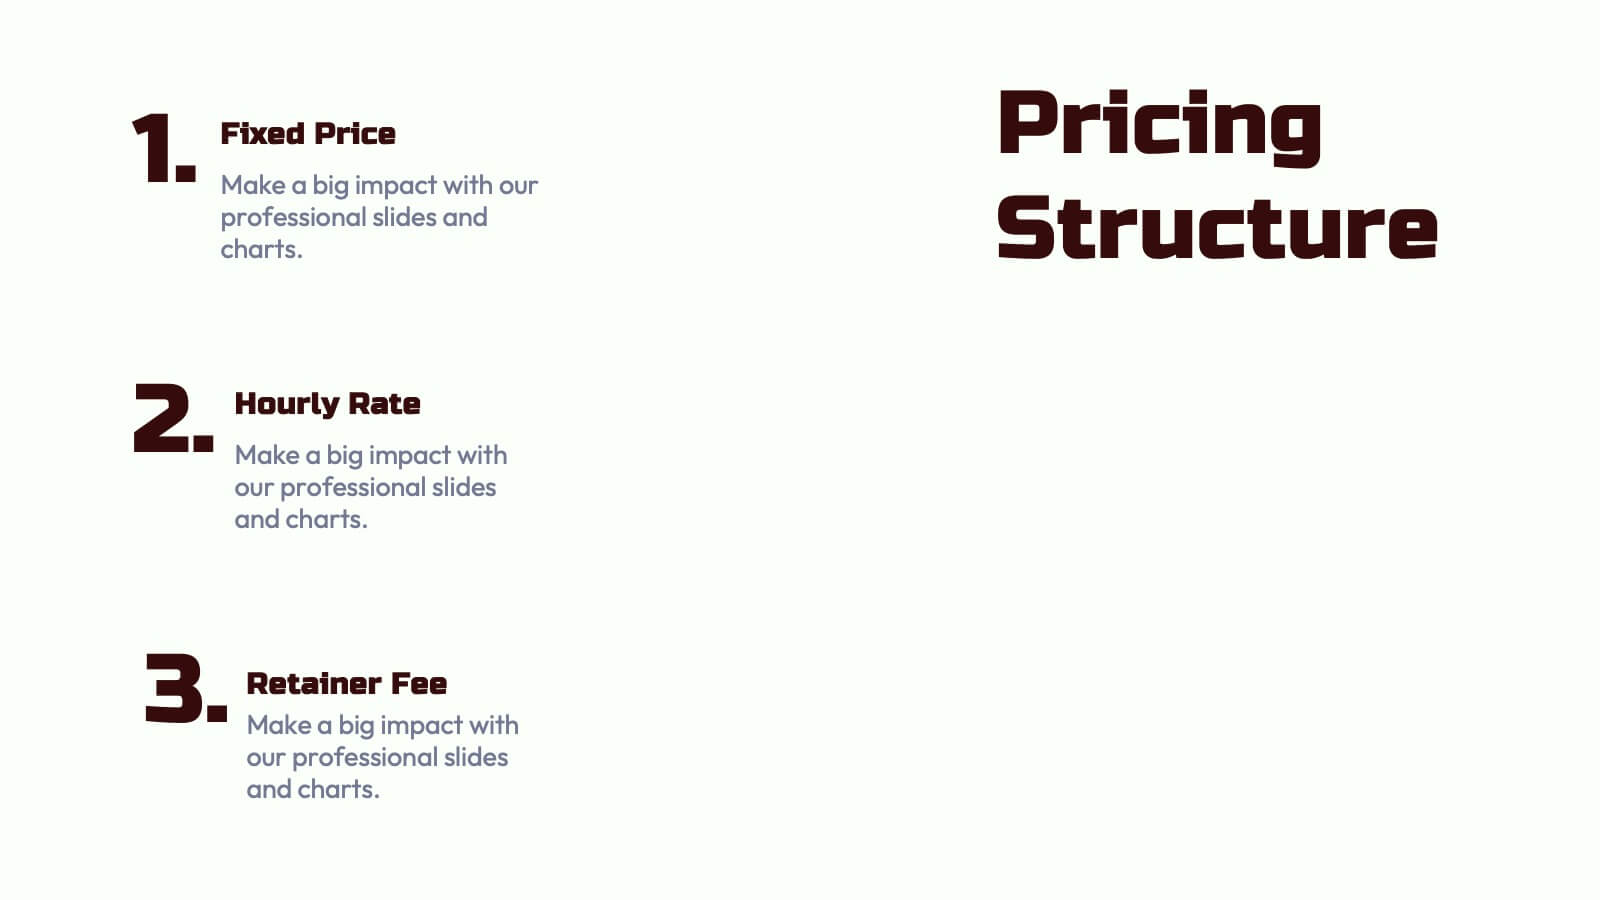
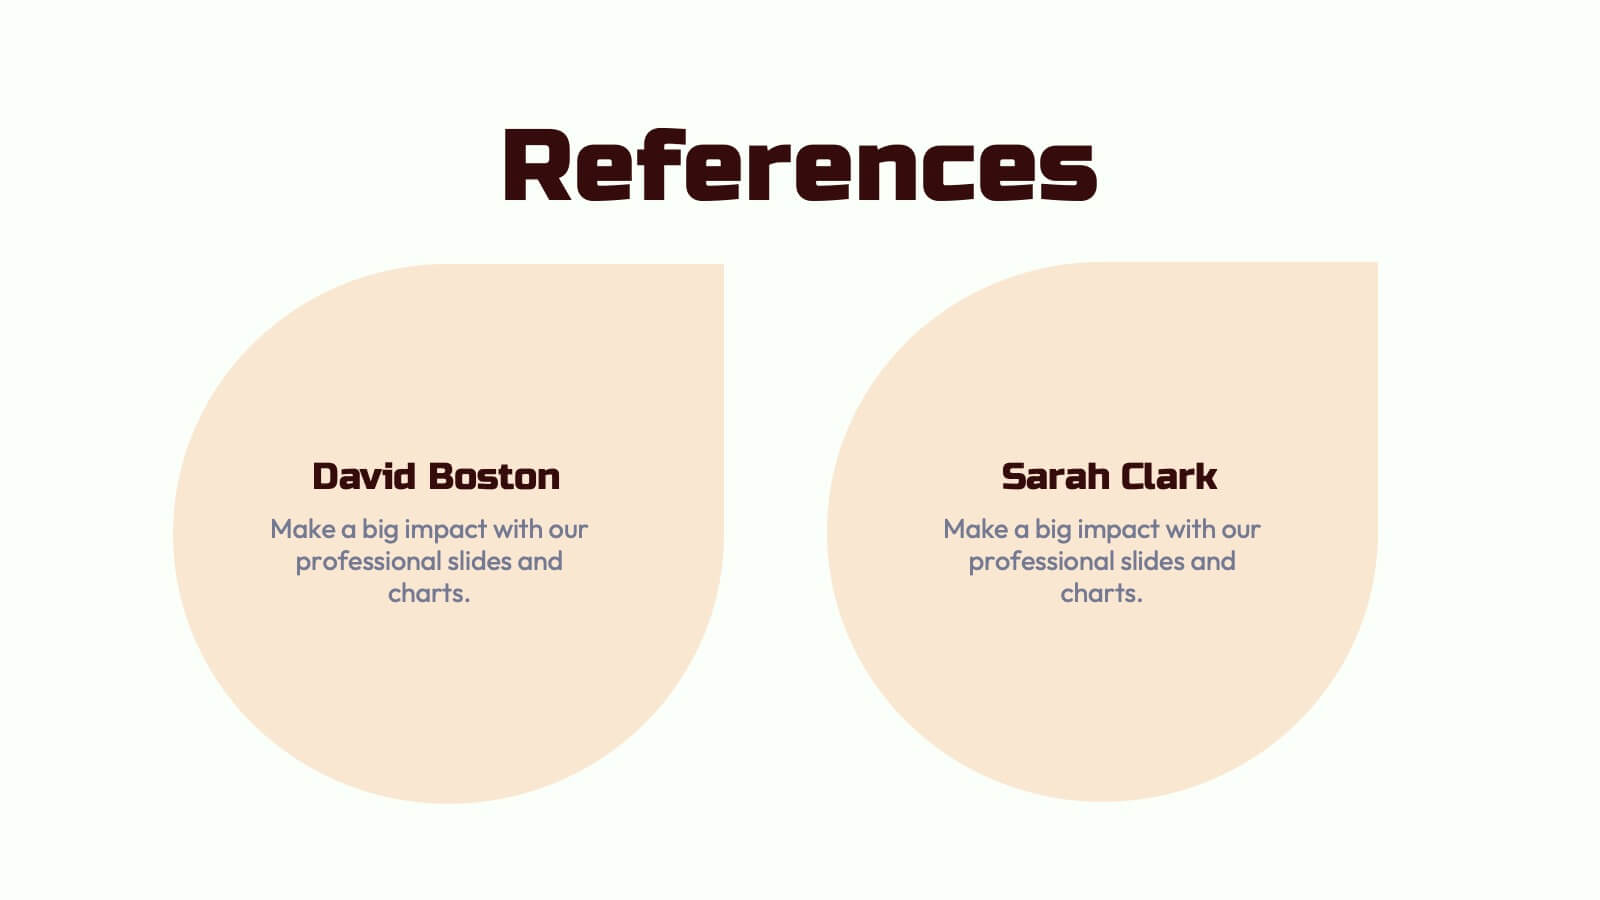
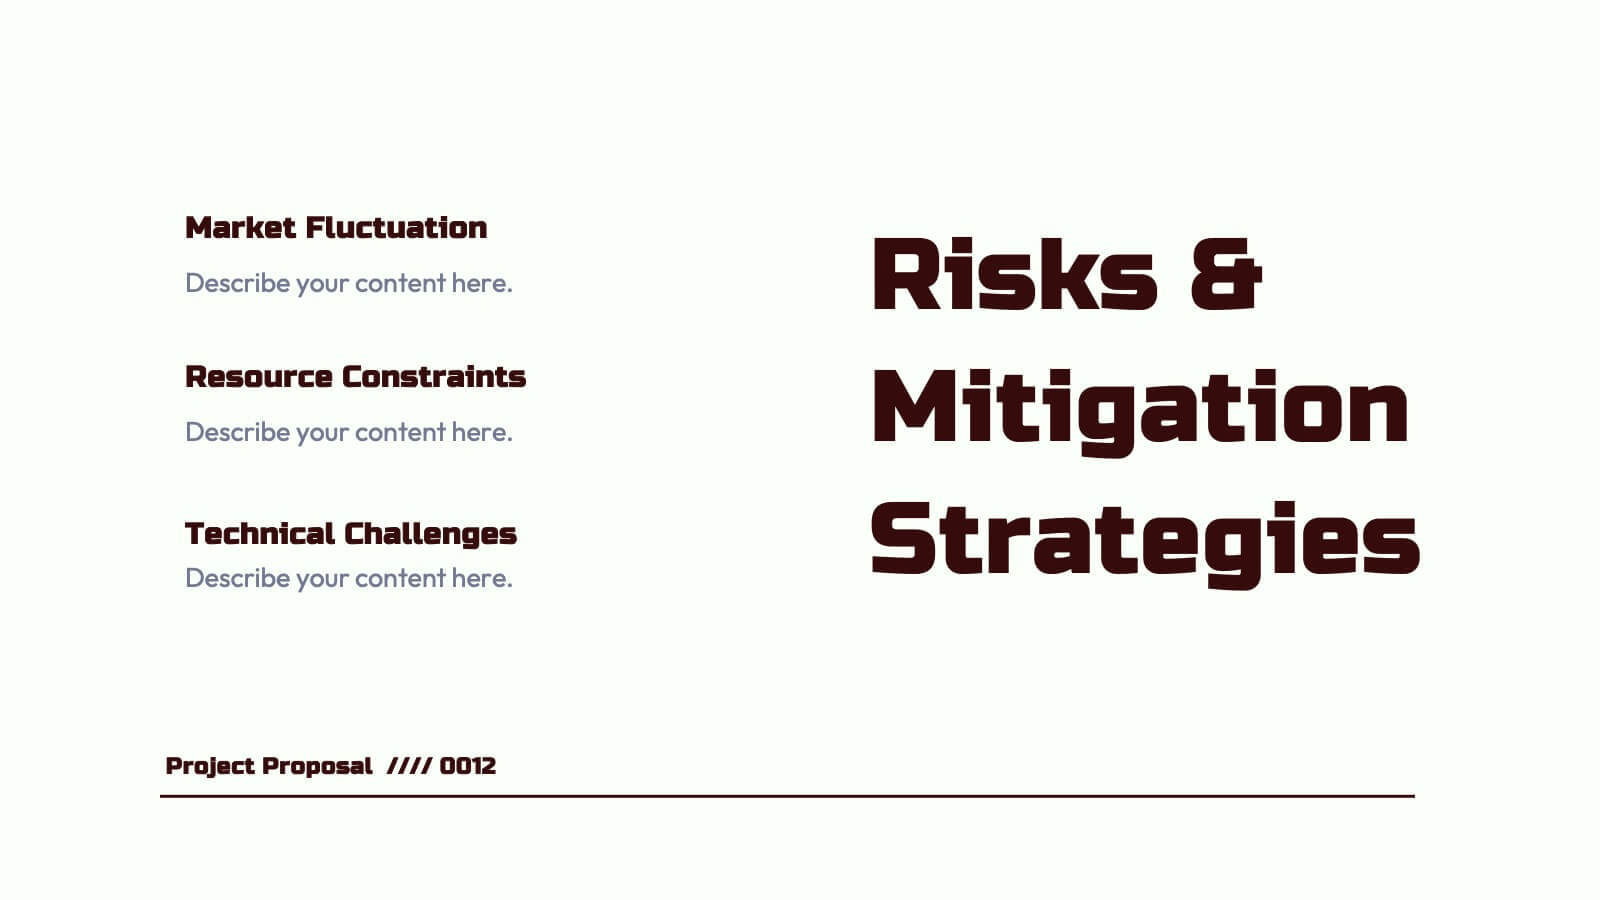
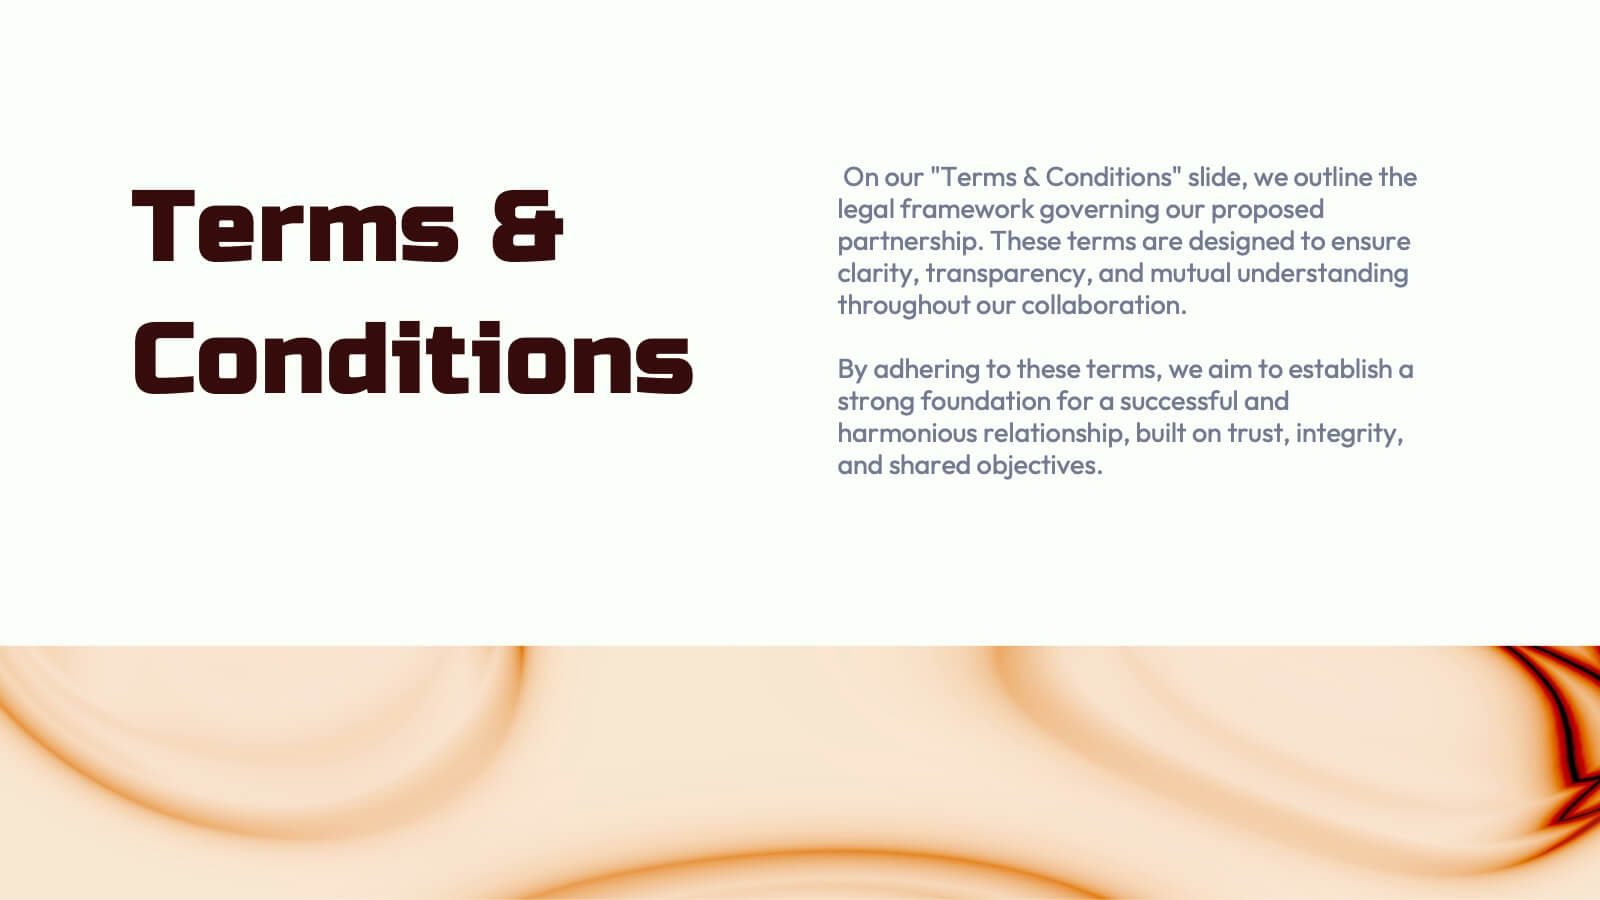
Onyx Project Proposal Presentation
This sleek, modern project proposal template is designed for clarity and impact. Featuring sections like objectives, scope of work, pricing structure, and client testimonials, it’s ideal for presenting detailed proposals to stakeholders. Perfectly compatible with PowerPoint, Keynote, and Google Slides, it ensures a professional presentation that impresses every time!


21 diapositivas
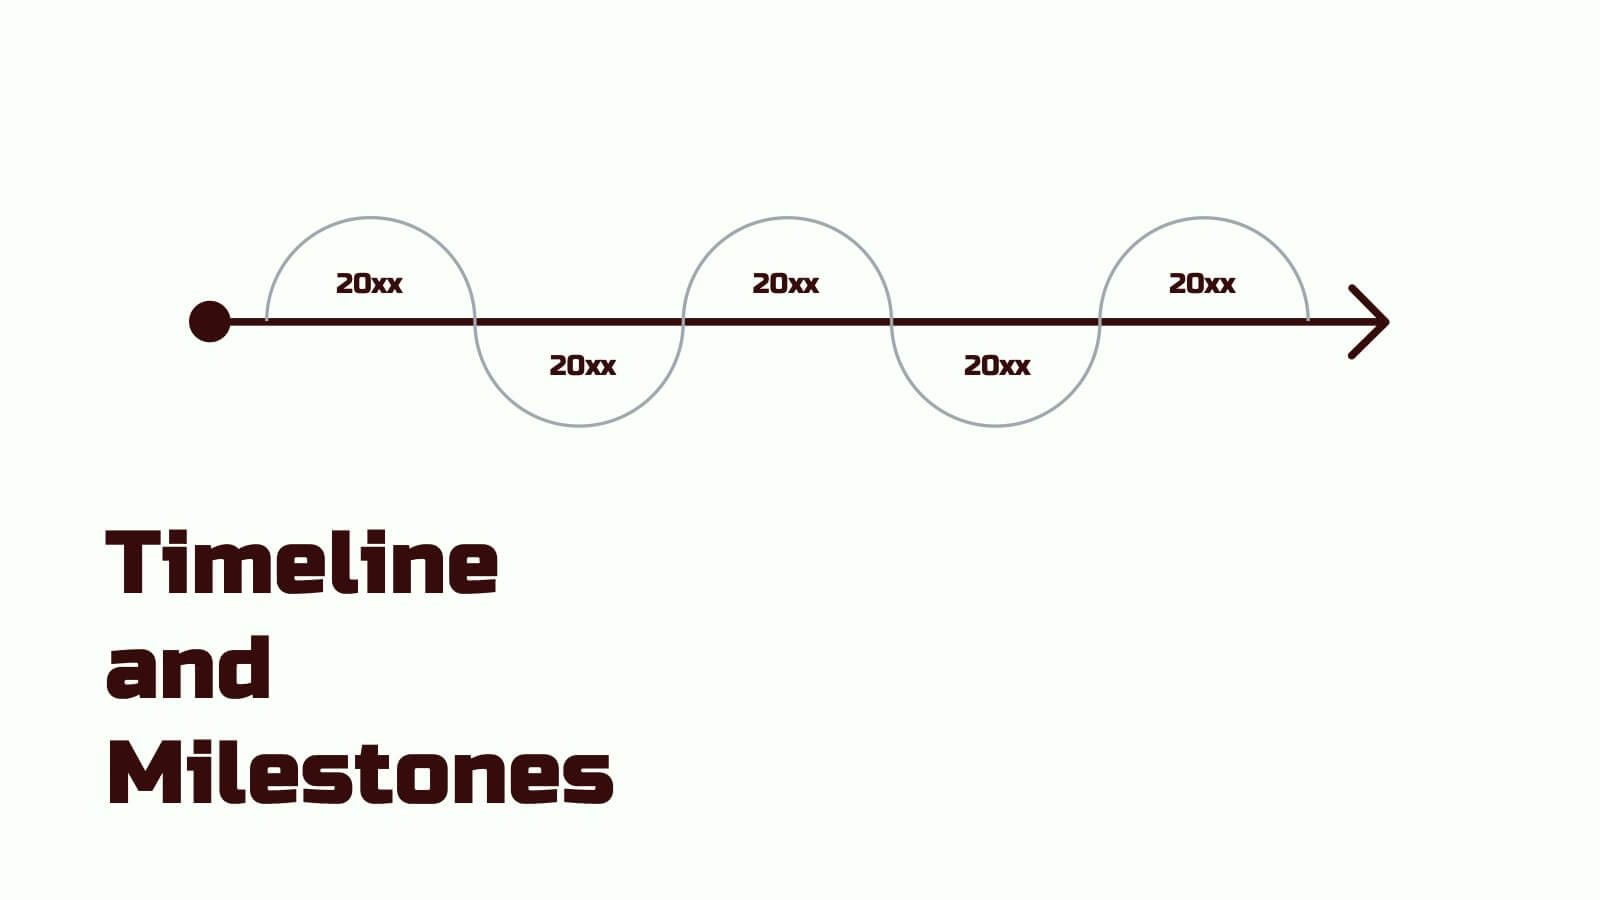
Nucleus Project Timeline Presentation
Plan with precision using this clean and modern Project Timeline Presentation Template. Highlight key phases, milestones, and deliverables with visually organized sections such as Project Overview, Objectives, Budget Breakdown, Resource Allocation, and Risk Management. Perfect for presenting timelines, evaluation criteria, and next steps to stakeholders. Fully customizable and compatible with PowerPoint, Keynote, and Google Slides.


26 diapositivas
Professional Etiquette Presentation
Navigate the nuances of professional decorum through this tapestry of visuals that articulate the essence of workplace conduct. Against a palette of serene blues, each slide is a chapter in the unwritten manual of corporate finesse. Behold the tableau of contents, a compass that guides through topics from networking nuances to meeting mastery. Profile snapshots reveal the faces behind the expertise, their demeanors a blend of affability and authority. Charts ascend like ladders, each bar a rung towards proficiency, while infographics spiral into knowledge funnels, distilling broad concepts into digestible insights. In the realm of comparison, dichotomies transform into dialogues, contrasting ideas merging into a unified vision of etiquette. Venn diagrams interlock circles of skills, control, and success, illustrating the symbiotic relationship of competencies. Contact slides extend a virtual handshake, inviting engagement and fostering connections. This presentation is an homage to the unspoken - the grace of gratitude, the elegance of silence, and the power of a well-timed gesture - as it crafts an environment where professionalism is not just practiced, but lived.


4 diapositivas
Funding and Investment Project Proposal Presentation
Unlock the potential of your next big venture with this vibrant and organized infographic presentation template! Perfect for outlining key stages from research to returns, this template makes complex investment strategies accessible and engaging. Tailor each segment to fit your project's unique needs. Compatible with PowerPoint, Keynote, and Google Slides, it's ideal for professionals looking to impress stakeholders and secure funding.


20 diapositivas
Nebula Project Proposal Presentation
Create a compelling project proposal with this structured, professional template! It includes sections for problem statements, proposed solutions, goals, timelines, and pricing. Perfect for organizing your ideas clearly and professionally, it's fully customizable and compatible with PowerPoint, Keynote, and Google Slides. This template makes it easy to present your proposals effectively and win clients.
5 diapositivas
Transportation Flow and Inventory Tracking Presentation
Track movement and stock like a pro with this clean shipping infographic layout. Featuring a cargo ship graphic and segmented titles, it's perfect for illustrating supply chain progress, delivery checkpoints, or inventory updates. Use it to present logistics insights with clarity. Fully compatible with PowerPoint, Keynote, and Google Slides.


4 diapositivas
Business Framework Strategies Presentation
Bring your ideas to life with a smooth, flowing sequence that makes complex strategies feel simple and intuitive. This presentation guides audiences through each stage of your business framework with clear visuals and focused messaging, helping you communicate structure, goals, and direction effortlessly. Fully compatible with PowerPoint, Keynote, and Google Slides.


20 diapositivas
Visionix Project Management Plan Presentation
Streamline your project planning with this clean and modern presentation template. Covering key aspects such as objectives, timeline, budget breakdown, and risk management, it helps you organize and communicate your project strategy effectively. Ideal for business teams and project managers. Compatible with PowerPoint, Keynote, and Google Slides for easy customization.


6 diapositivas
Business Sustainability Performance Report Presentation
Showcase your company’s sustainability efforts with this modern infinity-loop infographic. Perfect for environmental reports, CSR metrics, or circular economy overviews. Highlight key percentages and goals across three impact areas. Fully editable and compatible with PowerPoint, Keynote, and Google Slides—ideal for presenting performance results in a clear, engaging, and professional format.


6 diapositivas
Overcoming Market Challenges Strategy Presentation
Tackle industry obstacles with clarity using this dynamic teamwork-themed visual. Featuring illustrated characters passing puzzle pieces along a circular process, this design is perfect for illustrating phased strategies, collaborative efforts, or key milestones. Great for strategic planning or team alignment presentations. Fully editable in PowerPoint, Keynote, and Google Slides.


8 diapositivas
Business Strategy Planning Presentation
Strategize with Impact using this Business Strategy Planning Presentation template. This slide provides a visually compelling roadmap to outline key business strategies, objectives, and growth plans in an easy-to-follow format. Perfect for corporate meetings, executive briefings, and business planning sessions, this template ensures your business vision is communicated clearly and effectively. Fully editable and available for PowerPoint, Keynote, and Google Slides for seamless customization.


23 diapositivas
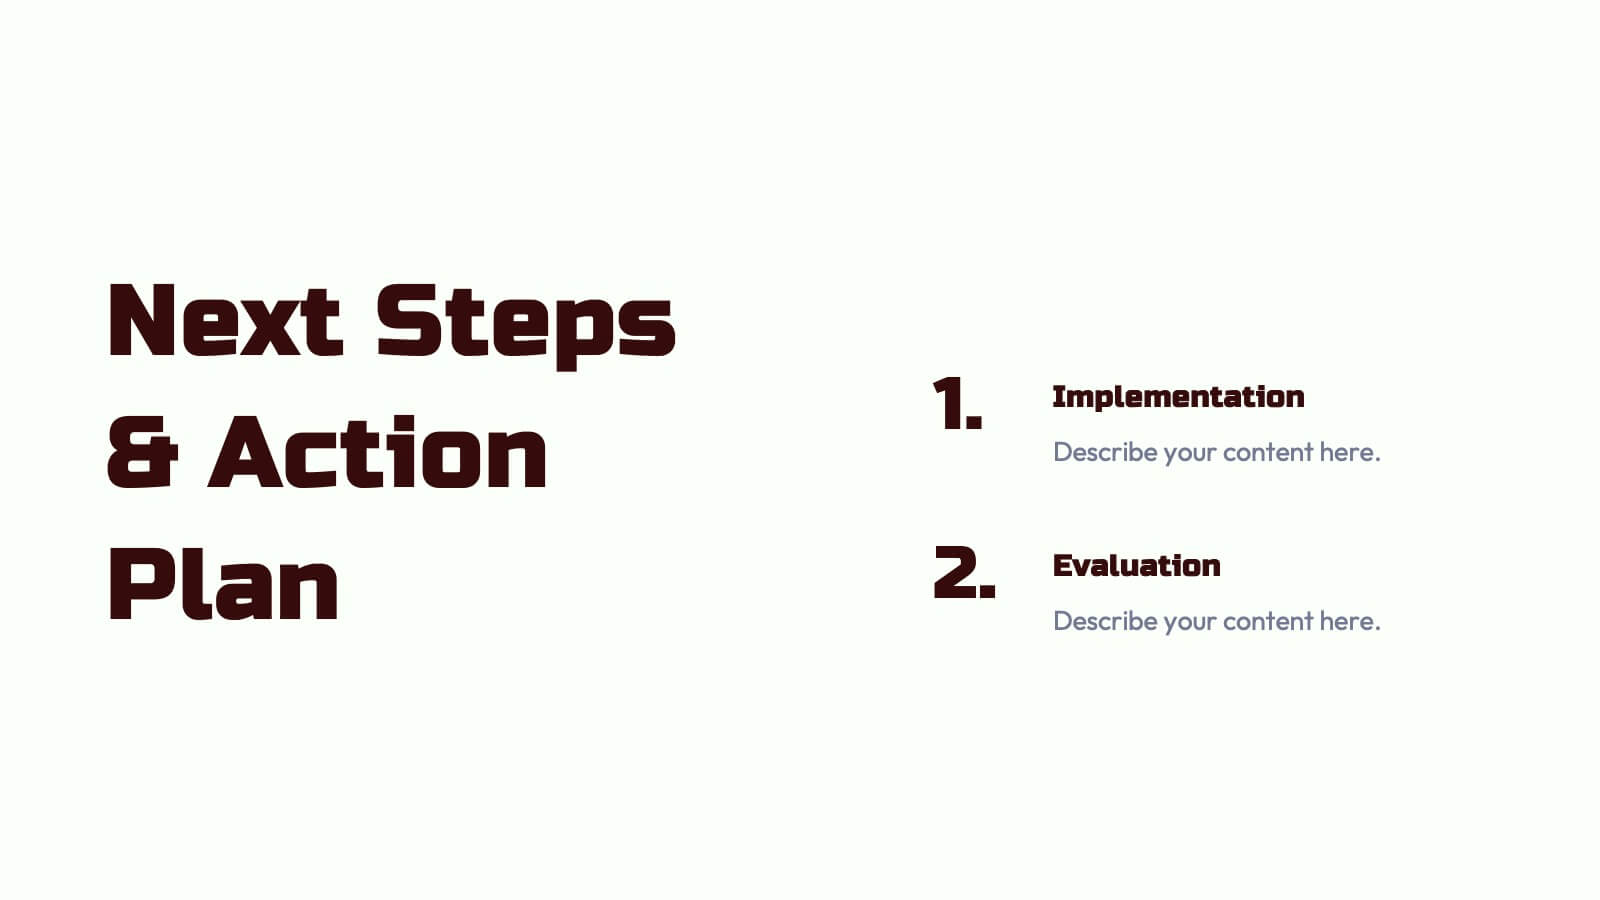
Volt Business Plan Presentation
The Business Plan Presentation Template offers 23 refined slides to convey goals, strategies, achievements, and action plans. Perfect for team updates, resource allocation, and collaboration opportunities. Designed for PowerPoint, Keynote, and Google Slides, its warm, professional layout ensures clarity while fostering effective communication for corporate or project presentations. Fully customizable.


4 diapositivas
Healthcare Access and Preventive Care Presentation
Bring your health strategy to life with this engaging heart-themed infographic slide. Perfect for illustrating patient access points, wellness checkpoints, or preventive initiatives, each segment is cleanly organized with icons and text. Ideal for medical presentations, this template works seamlessly in PowerPoint, Keynote, and Google Slides for total flexibility.


20 diapositivas
Starbound Sales Proposal Presentation
Close deals with confidence using this polished and professional sales proposal presentation! It covers everything from target market analysis and pricing strategies to sales objectives, performance metrics, and future opportunities, ensuring a complete pitch. Perfect for client meetings and business proposals, this template works seamlessly with PowerPoint, Keynote, and Google Slides.


5 diapositivas
5-Layer Circle Diagram Presentation
Bring complex ideas to life with a clean circular layout that reveals information in five clear, connected layers. This presentation helps you break down concepts, compare levels, or showcase structured processes in a visually intuitive way that keeps audiences focused. Fully compatible with PowerPoint, Keynote, and Google Slides.


8 diapositivas
Economic Impact on Stock Market Presentation
Illuminate your financial presentation with the "Economic Impact on Stock Market" template, ideal for displaying the interconnected influences of economic variables on market performance. These slides feature clear, visual representations through pie charts and percentage indicators, allowing for an engaging analysis of trends and impacts. This template is fully compatible with PowerPoint, Keynote, and Google Slides, ensuring versatility across different presentation platforms.