


Características


¿Tienes alguna pregunta?
Recomendar


7 diapositivas
Real Estate Infographic Presentation Template
Real estate is a form of property that can be used for residential, commercial or industrial purposes, and typically includes any resources on the land such as water or minerals. This template is especially useful for real estate agents and brokers who can use it to better understand the real estate industry. This template comes with Infographics that are a great way to explain complex ideas and trends in a simple, easy-to-understand way, and can help your clients better understand as well. This template displays data visually, which will allow your audience to grasp complex ideas quickly.


13 diapositivas
Simple Sales Proposal Presentation
This proposal template provides a streamlined approach for presenting sales strategies and solutions. Starting with a visually striking cover slide, it sets the scene for an engaging pitch. The template meticulously organizes content from the initial problem identification to the presentation of real numbers that underscore the proposal's validity. Each section, from the elucidation of the problem to the detailed solutions and real-world case studies, is laid out for maximum impact and understanding. Personable touches are incorporated through the 'Meet Our Team' segment, bolstering the proposal with credibility. The template culminates with a strong call to action, urging the audience to seize the collaborative opportunity, and is rounded off with a polite 'Thank You' to leave a lasting impression. This template is a boon for sales professionals seeking to communicate their value proposition with clarity and persuasiveness.


6 diapositivas
Strategic Planning with Hexagon Diagram Presentation
Visualize key components of your strategy with the Strategic Planning with Hexagon Diagram Presentation. Featuring a layered 3D hexagon structure, this template helps communicate processes, goals, or stages with clarity and depth. Fully customizable in PowerPoint, Keynote, or Google Slides—perfect for corporate planning, project managers, and consultants.


5 diapositivas
Workflow Management Diagram Presentation
Simplify your process visuals with a clean, modern layout designed to clarify every step. This presentation helps you map workflows, define responsibilities, and streamline communication across teams. Perfect for project planning and operations, it’s fully compatible with PowerPoint, Keynote, and Google Slides for effortless customization and professional presentation delivery.


5 diapositivas
Marketing Concepts Infographics
Marketing Concepts refer to the various strategies and philosophies that guide the marketing efforts of businesses and organizations. Our marketing concept infographics are visual representations of the different marketing concepts and strategies that businesses use to promote their products or services. These infographics can cover a wide range of marketing topics, including target audience, product positioning, branding, advertising, and video marketing. The purpose of these infographics is to provide a easy-to-understand overview of key marketing concepts that businesses can use to drive sales and increase brand awareness.


10 diapositivas
Business Relationship Management Presentation
Navigate the nuances of professional partnerships with the "Business Relationship Management" presentation templates. These layouts offer a structured approach to delineating the roles and interactions within business relationships, making them an essential tool for managers and team leaders. Designed to be compatible with PowerPoint, Keynote, and Google Slides, these templates provide a clear pathway for discussing and managing business relationships effectively.


4 diapositivas
Risk and Reality Iceberg Diagram Presentation
Reveal underlying threats with this Risk and Reality Iceberg Diagram presentation. Ideal for risk analysis, strategic planning, or operations mapping, this slide visualizes visible vs. hidden challenges in a business or project. Fully editable in Canva, PowerPoint, and Google Slides—perfect for impactful and professional presentations.


6 diapositivas
Iceberg Business Infographic
Delve beneath the surface with our Iceberg Business Infographic, perfect for Powerpoint, Google Slides, and Keynote. This infographic is designed to illustrate the underlying factors that impact an organization's success. The iceberg metaphor visually represents the concept that only a small part of a company's situation is visible above the surface, while much more is hidden below. The customizable segments can be used to detail various aspects of business operations, risks, and opportunities that are not immediately apparent. By employing this Iceberg Business infographic, you can effectively communicate the complexities of business strategies.


5 diapositivas
Quarterly Revenue and Sales Strategy Presentation
Present your financial focus with clarity using the Quarterly Revenue and Sales Strategy Presentation. This template features a modern donut chart in the center with five labeled segments, making it easy to highlight sales goals, performance metrics, or revenue streams. Ideal for quarterly reviews, growth plans, or stakeholder updates. Fully editable in Canva, PowerPoint, and Google Slides.


4 diapositivas
Effective Team Management Presentation
Present your management insights with clarity using this puzzle-style Effective Team Management template. Ideal for breaking down leadership functions, collaboration elements, or role responsibilities across four segments. The modular puzzle format adds a creative visual touch while staying professional. Fully editable in PowerPoint, Keynote, and Google Slides.


24 diapositivas
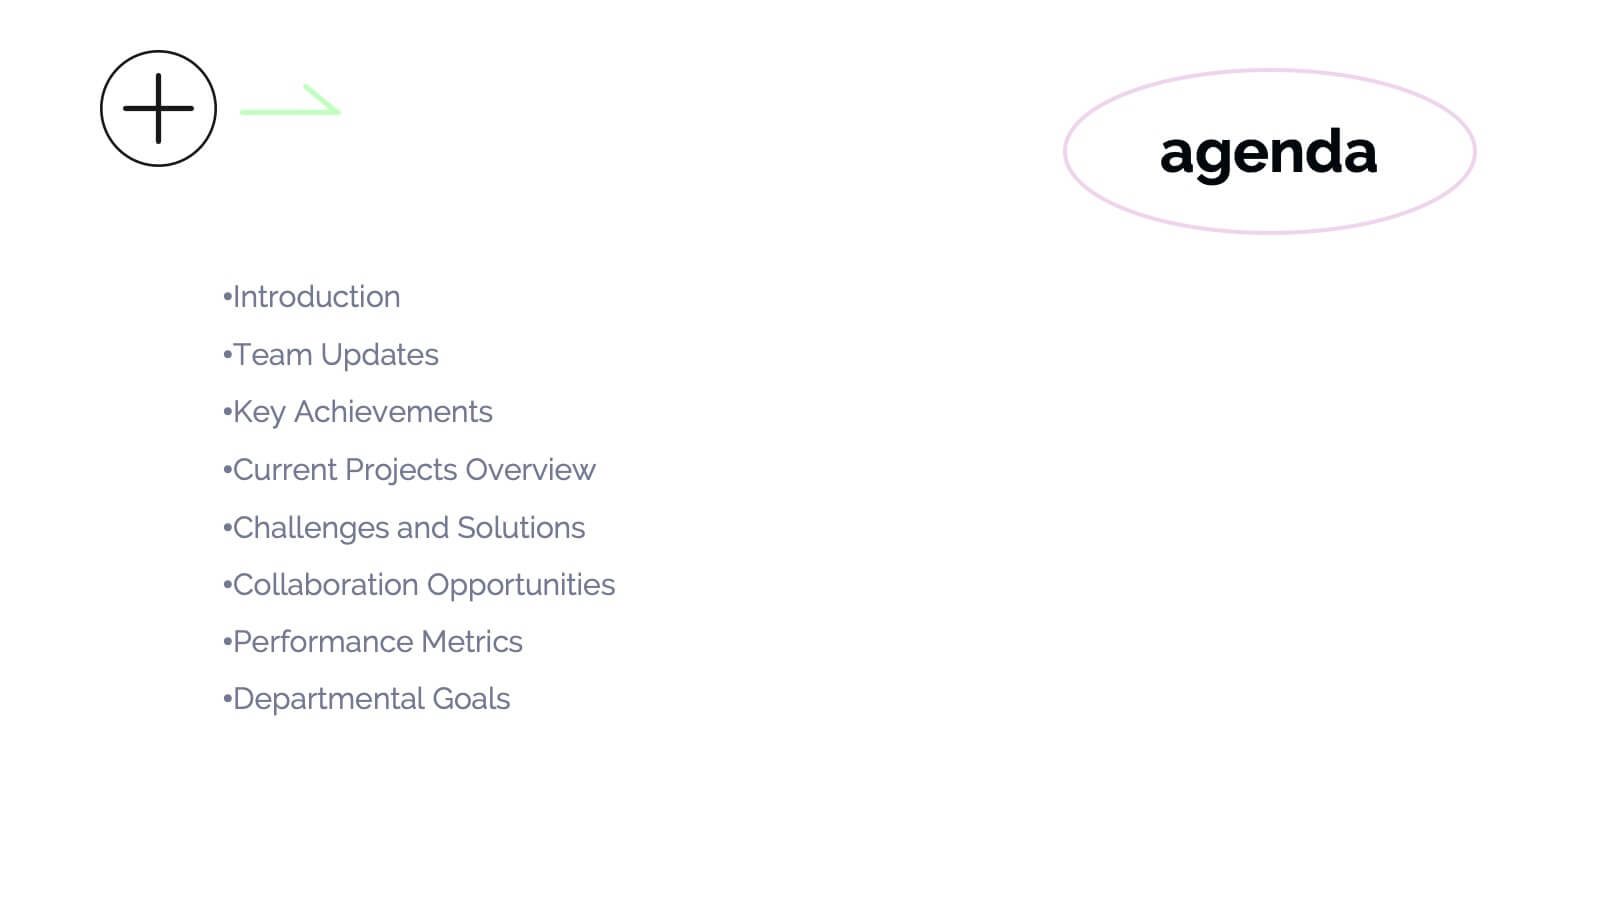
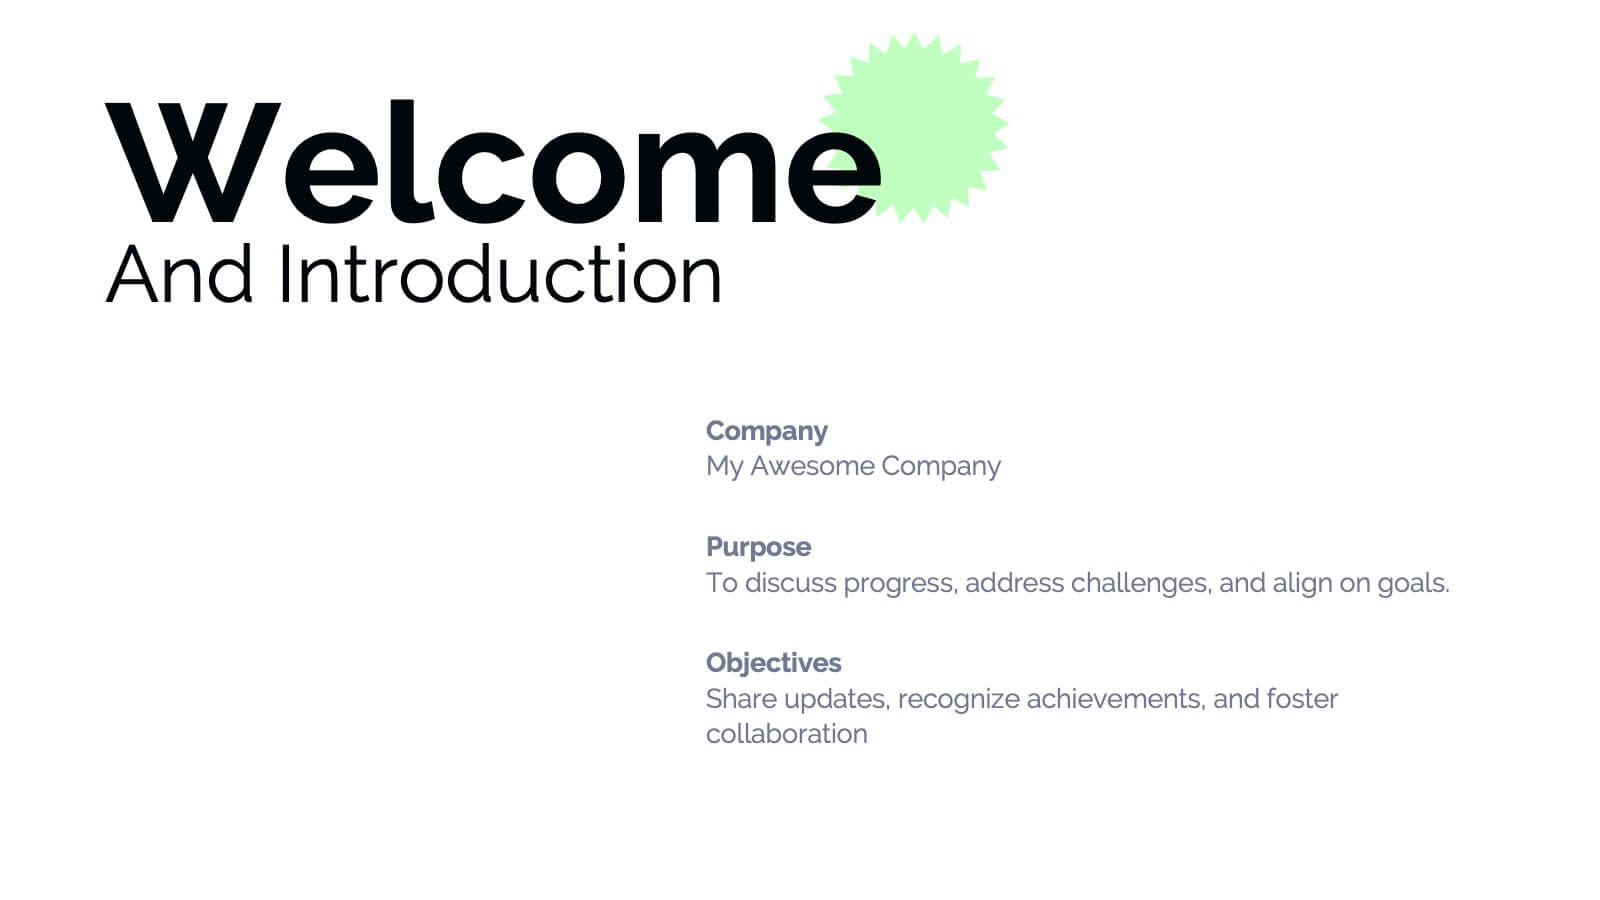
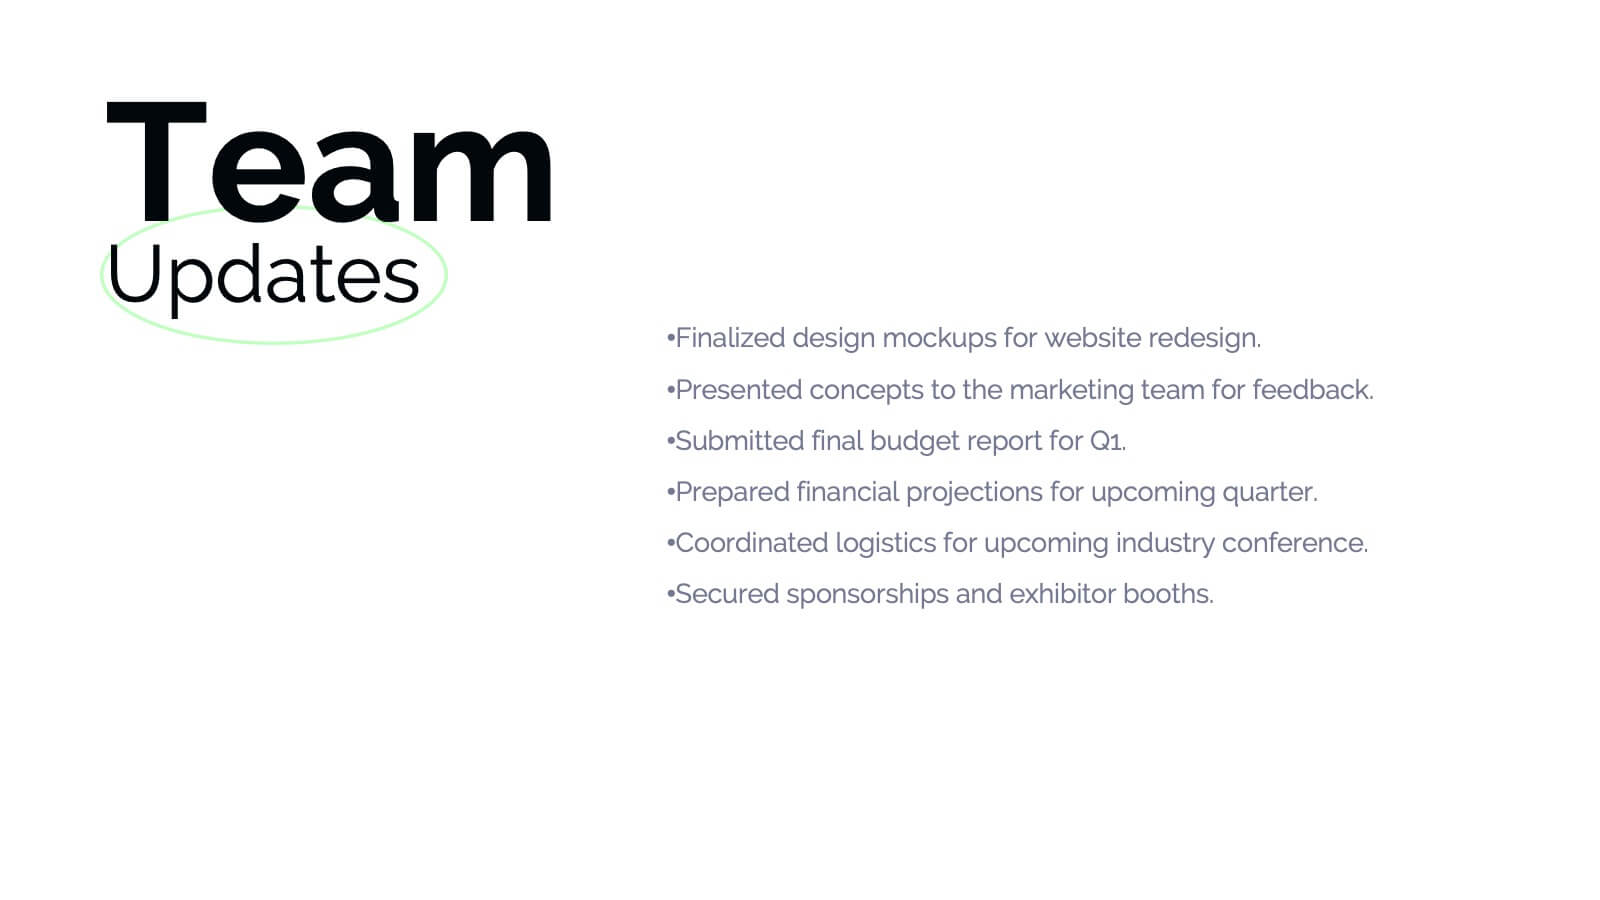
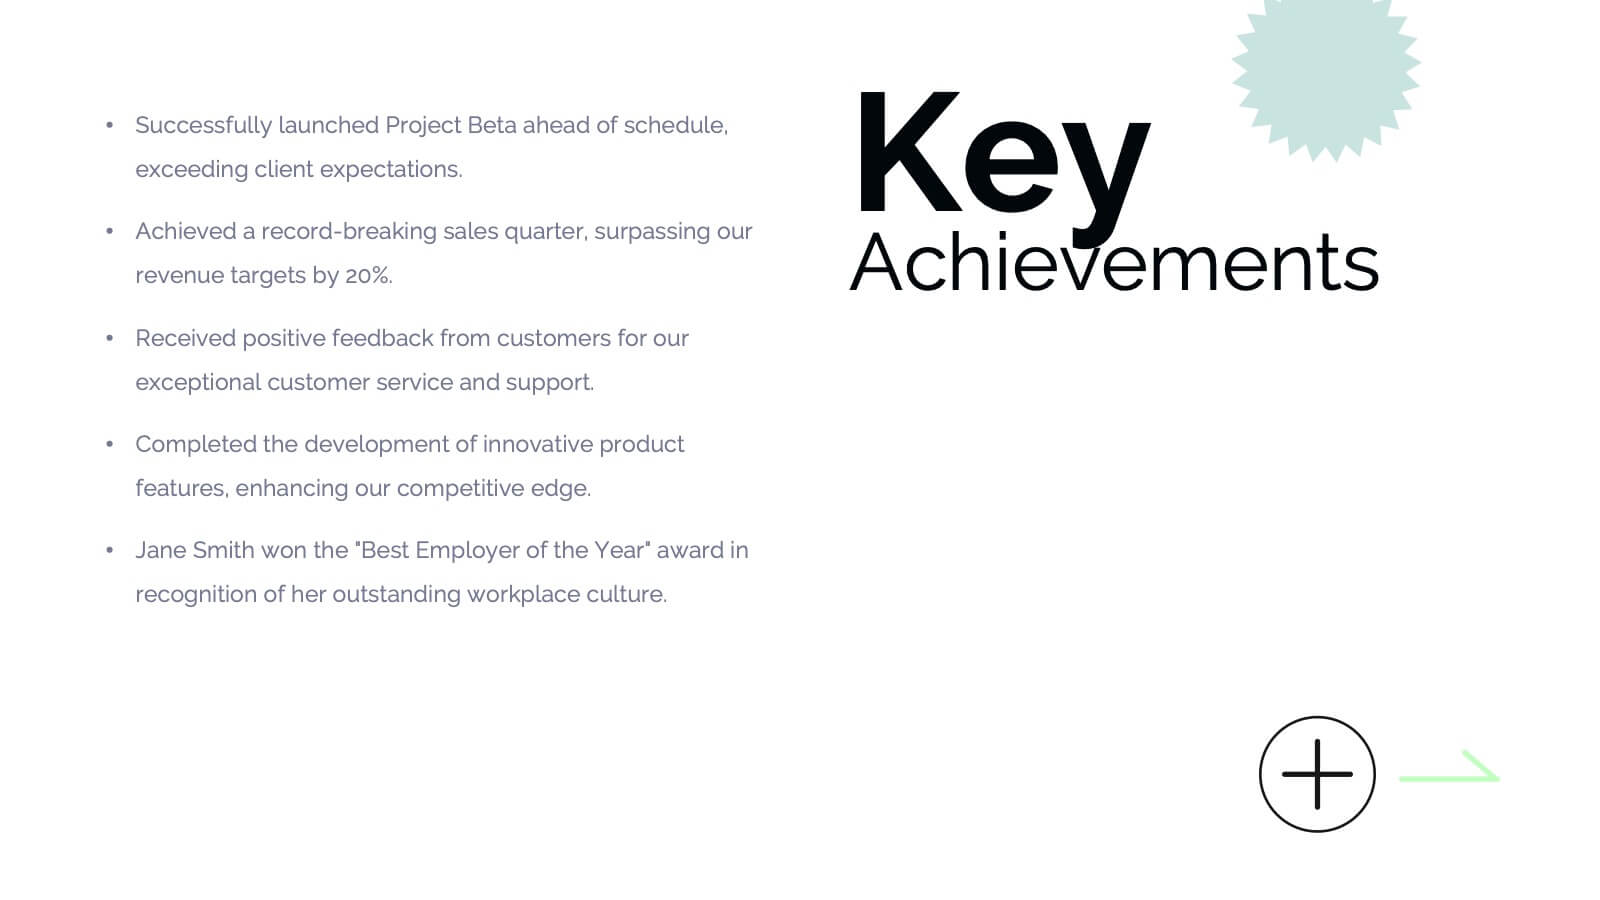
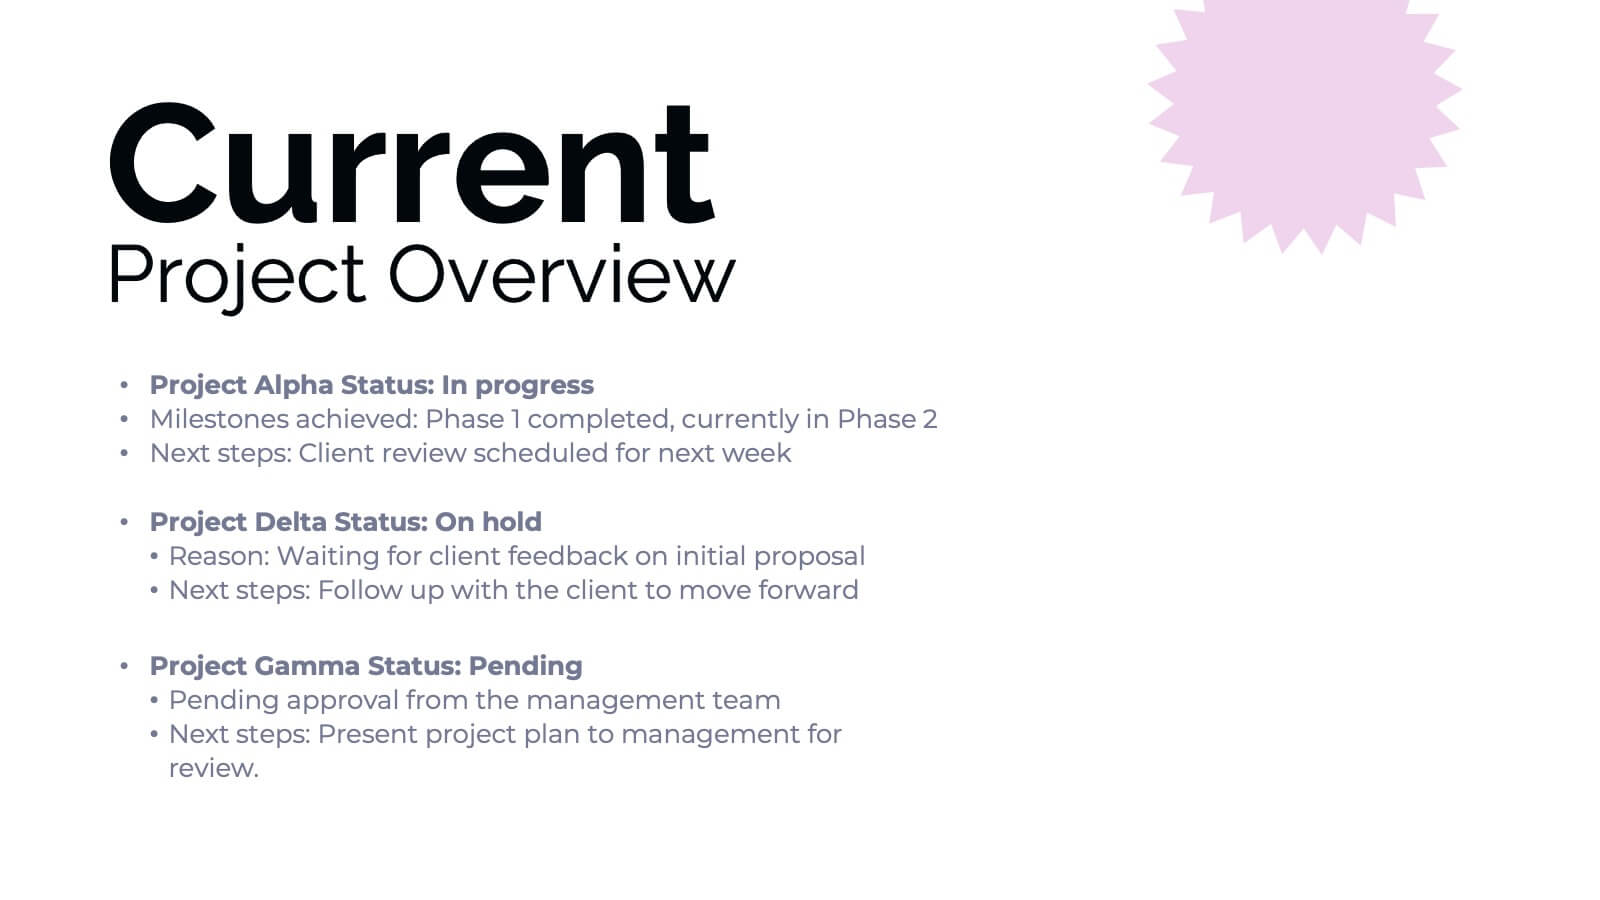
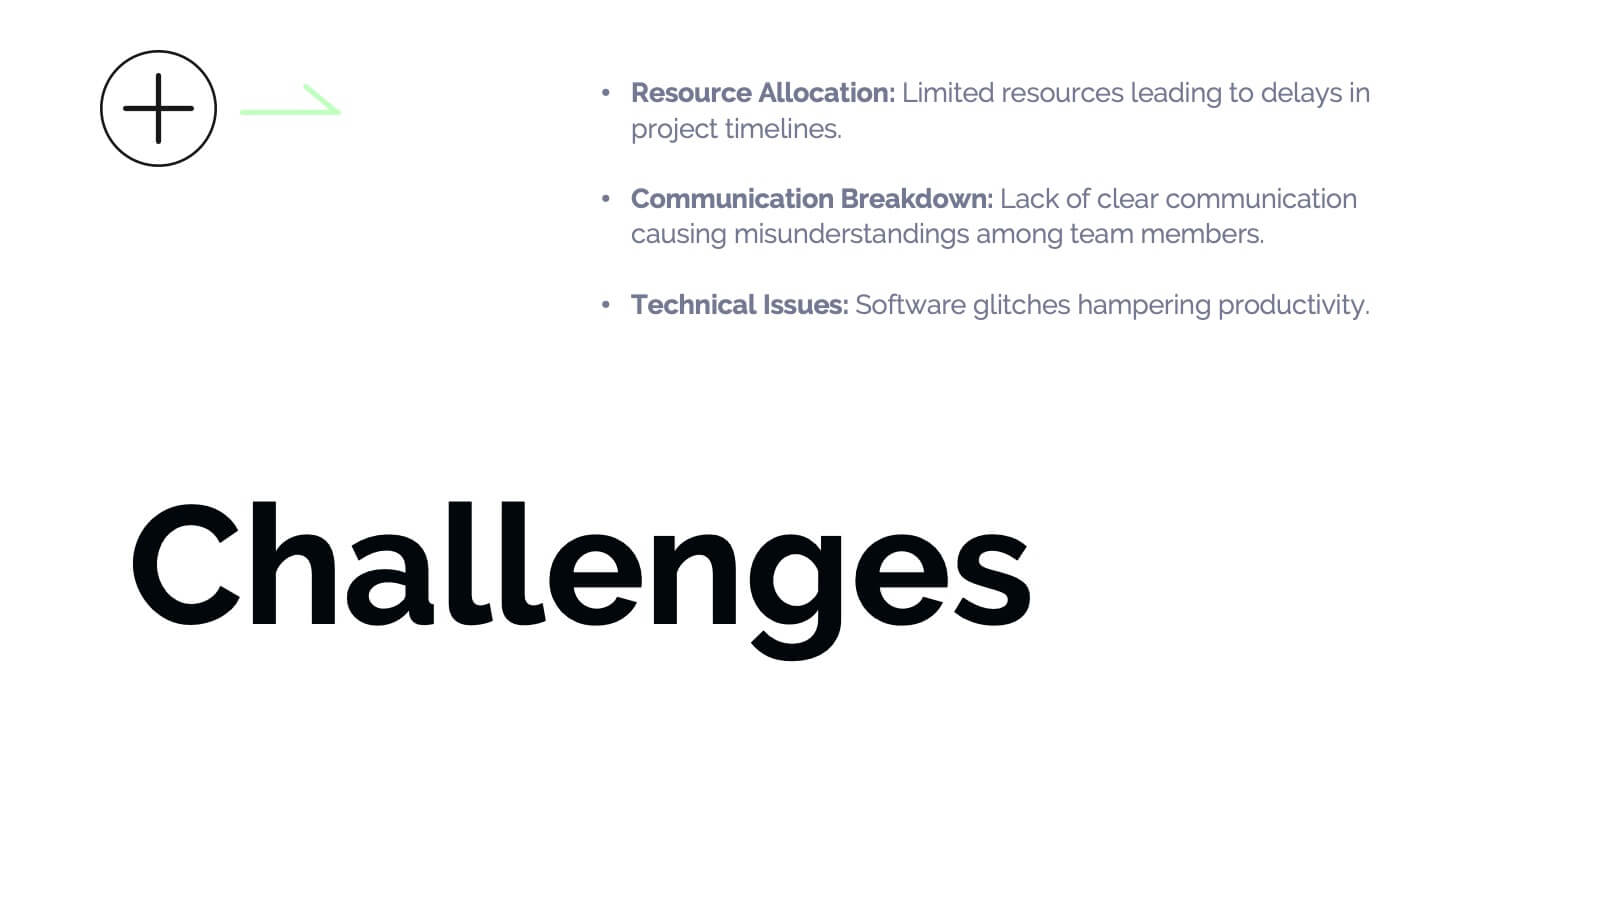
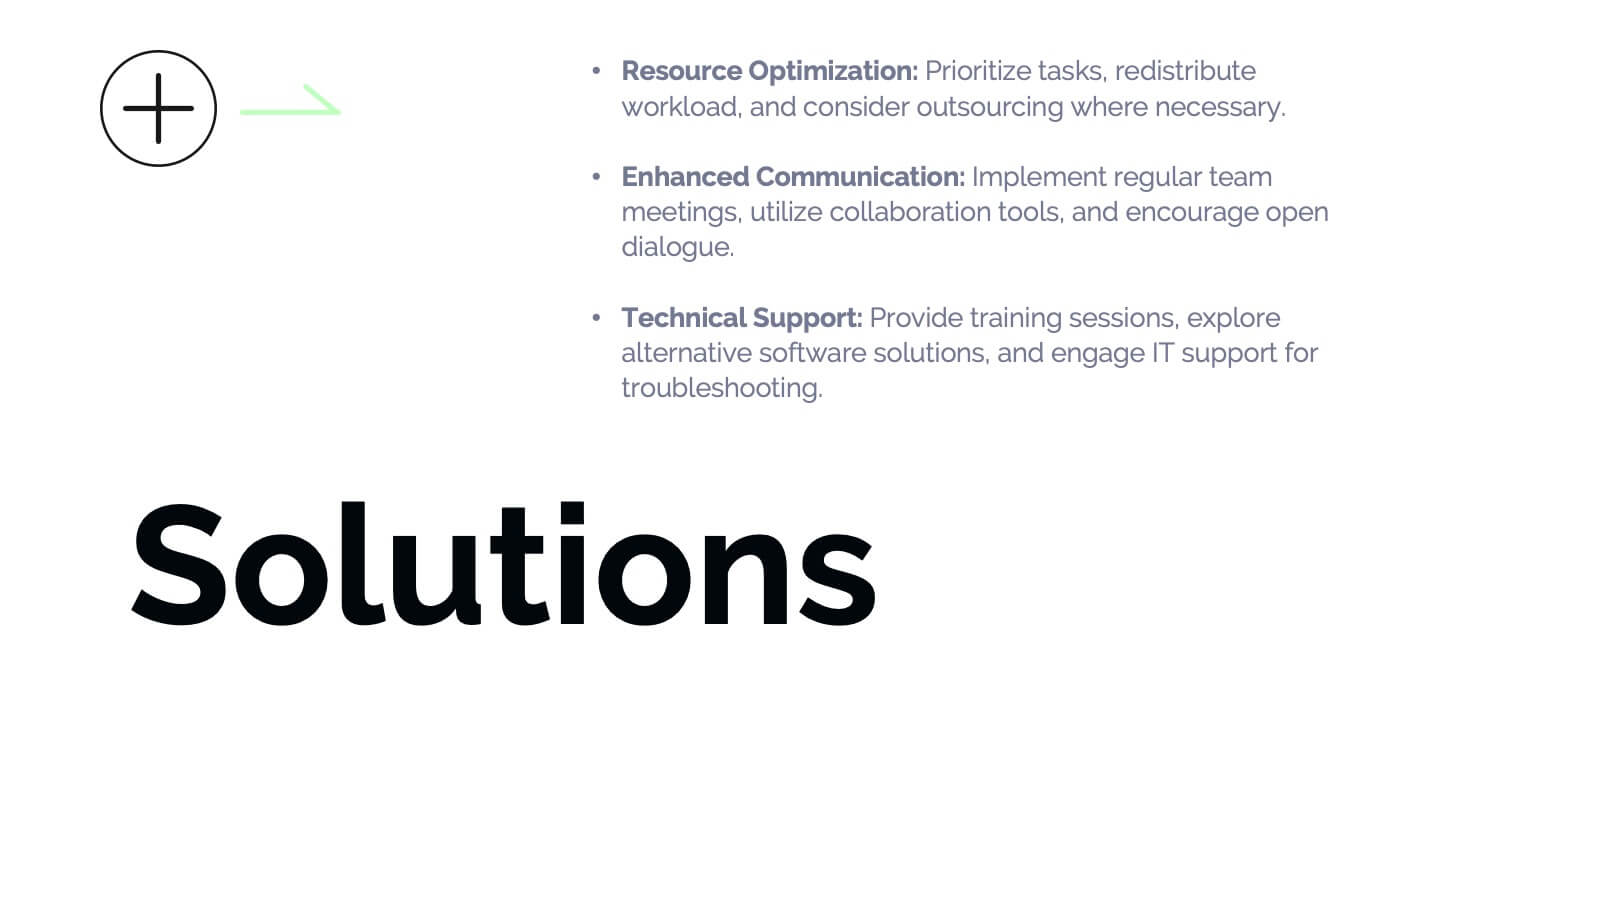
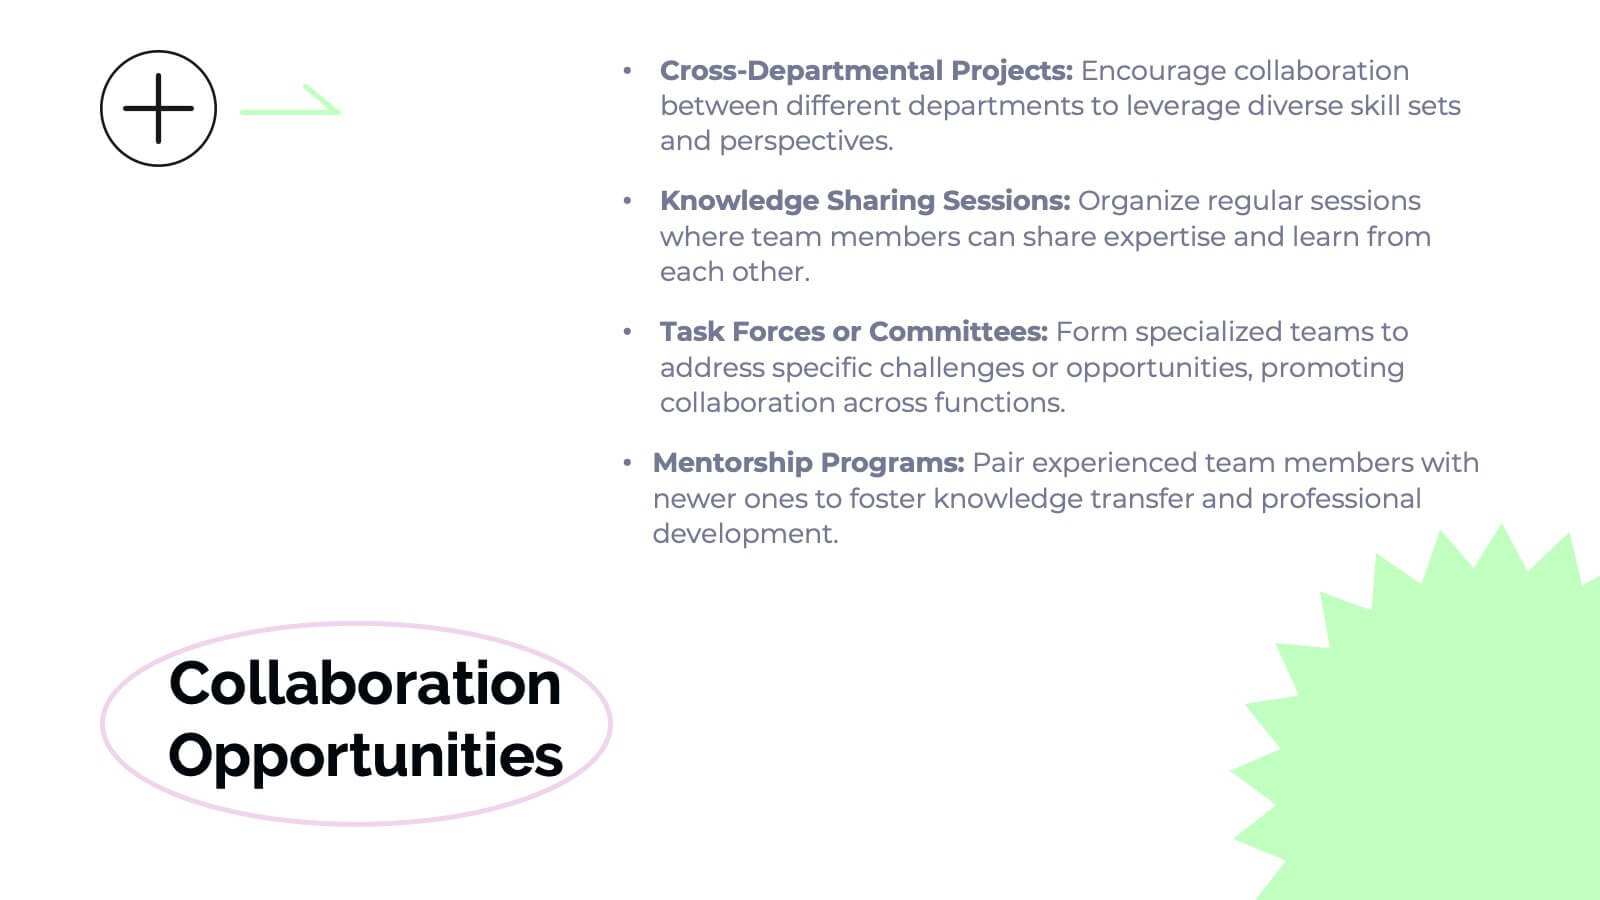
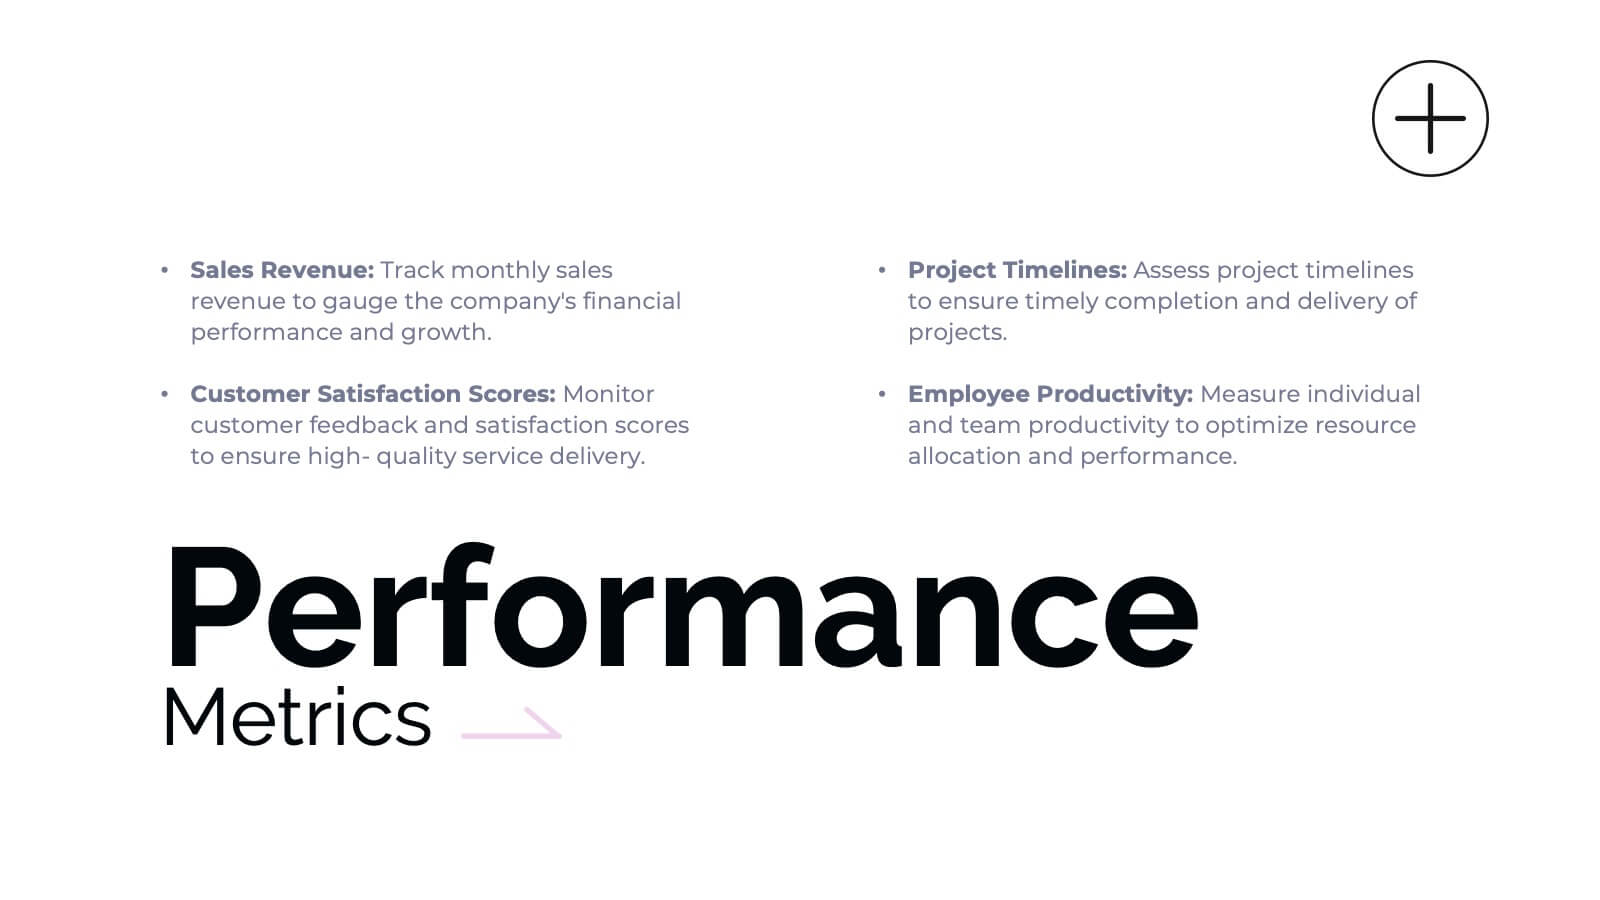
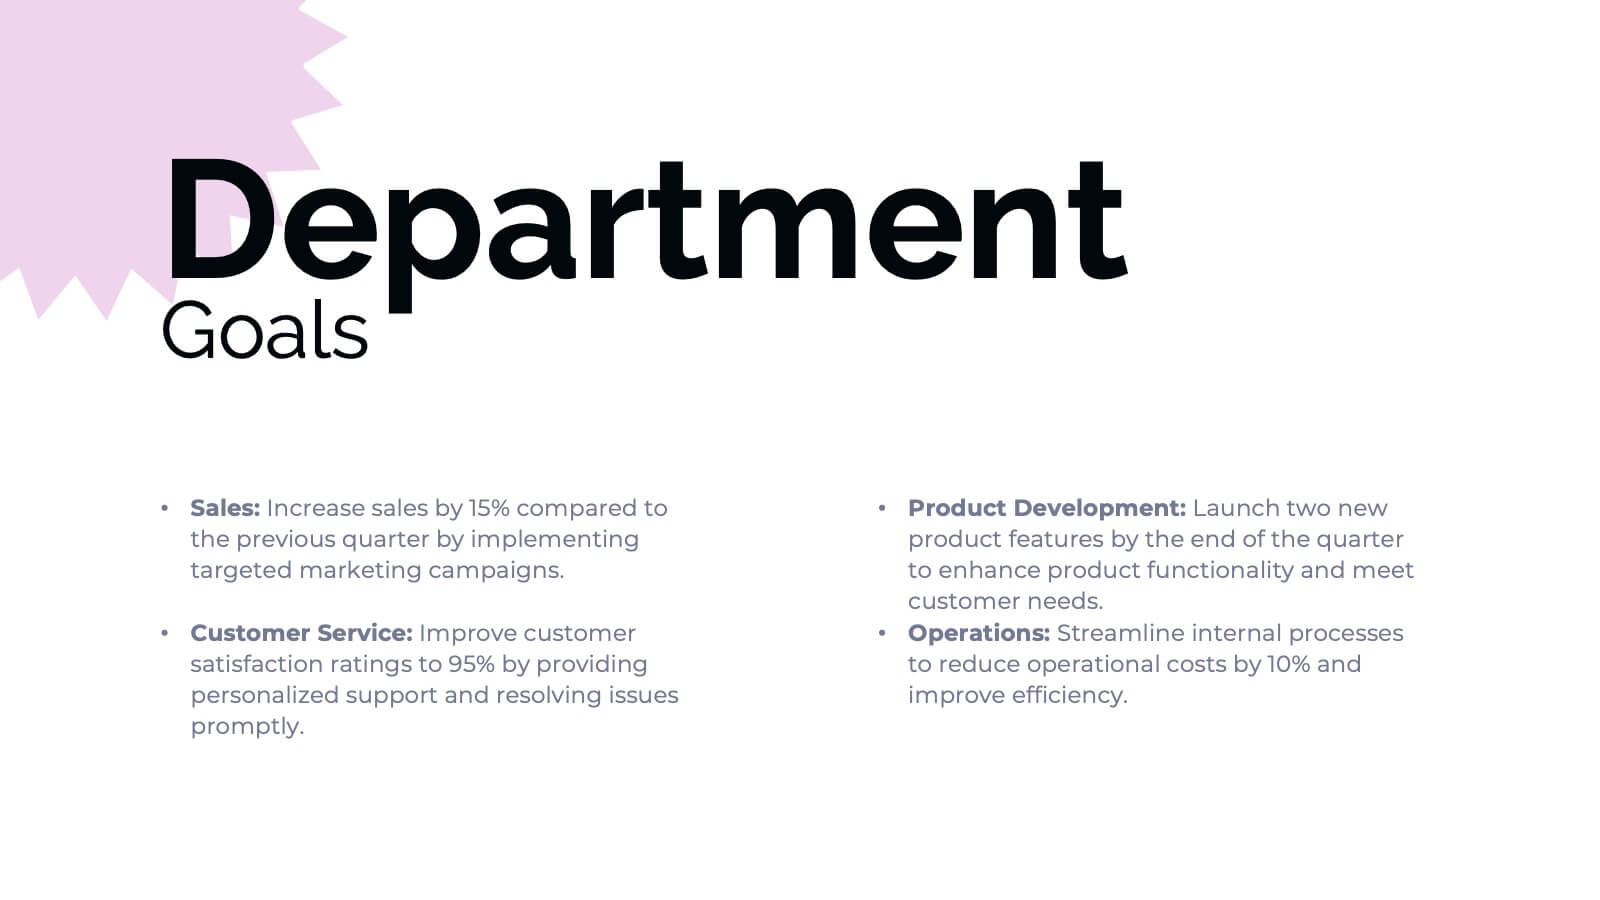
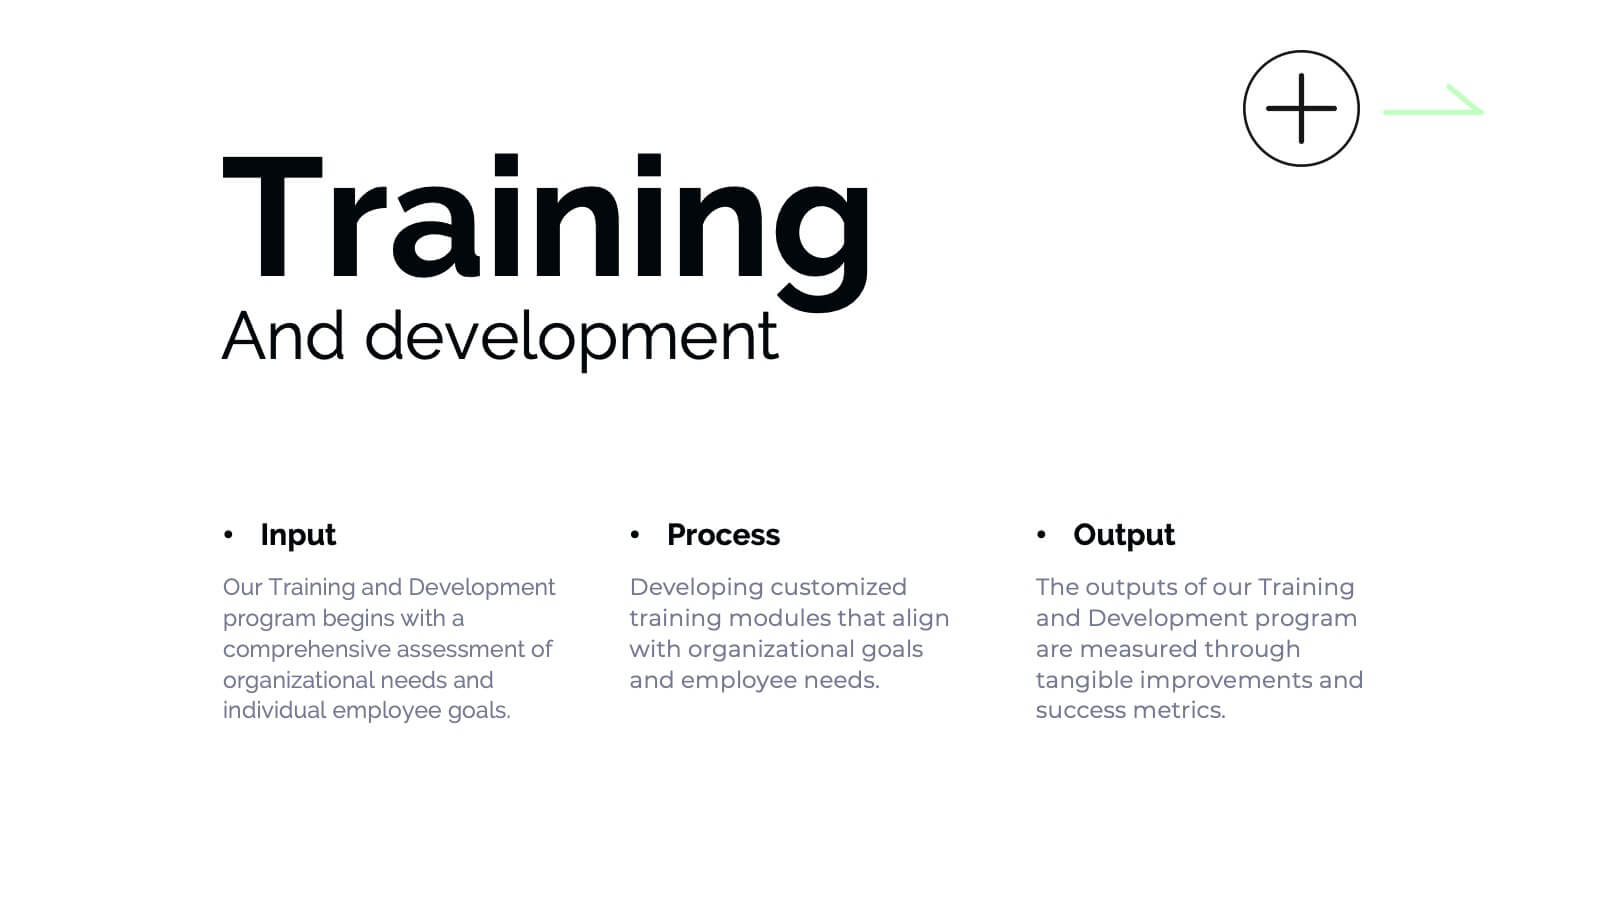
Banshee Business Operations Plan Presentation
Streamline your business operations with this comprehensive presentation template! From team updates and key achievements to challenges and solutions, every aspect of your business plan is covered. Ideal for tracking performance metrics, resource allocation, and upcoming events, this design keeps your operations organized and efficient. Compatible with PowerPoint, Keynote, and Google Slides for seamless integration.


4 diapositivas
Aviation Industry Overview Presentation
Bring your data in for a smooth takeoff with this clean and modern visual layout. Perfect for presenting industry insights, market trends, or operational performance, this design helps convey complex information with clarity and flow. Fully editable and compatible with PowerPoint, Keynote, and Google Slides for seamless customization.


6 diapositivas
Project Timeline and Weekly Schedule Presentation
Plan smarter with the Project Timeline and Weekly Schedule Presentation—a clear, structured template for tracking tasks week by week across multiple projects. Ideal for managers, teams, or freelancers needing a bird’s-eye view of workload distribution. Fully editable for PowerPoint, Keynote, and Google Slides.


8 diapositivas
Lean Business Model Canvas Framework Presentation
Visualize your entire business strategy on a single slide with this Lean Business Model Canvas. Ideal for startups or strategic planning, each editable block represents a key area: value propositions, customer segments, revenue, and more. Streamlined and clear, it's perfect for team alignment or investor-ready business model pitches.


7 diapositivas
Success Business People Infographic Presentation
A Business People Infographic is a visual representation of data and information related to various aspects of business and the people involved in it. This infographic is a great way to illustrate your topic, point by point. This is an ideal template for making professional business presentations. This template is fully editable, perfect for business presentations and meetings. It includes all of the graphics you need to shows your audience interesting statistics and data. Compatible with Powerpoint, Keynote and Google Slides, your audience will be impressed by the dynamic slides!


21 diapositivas
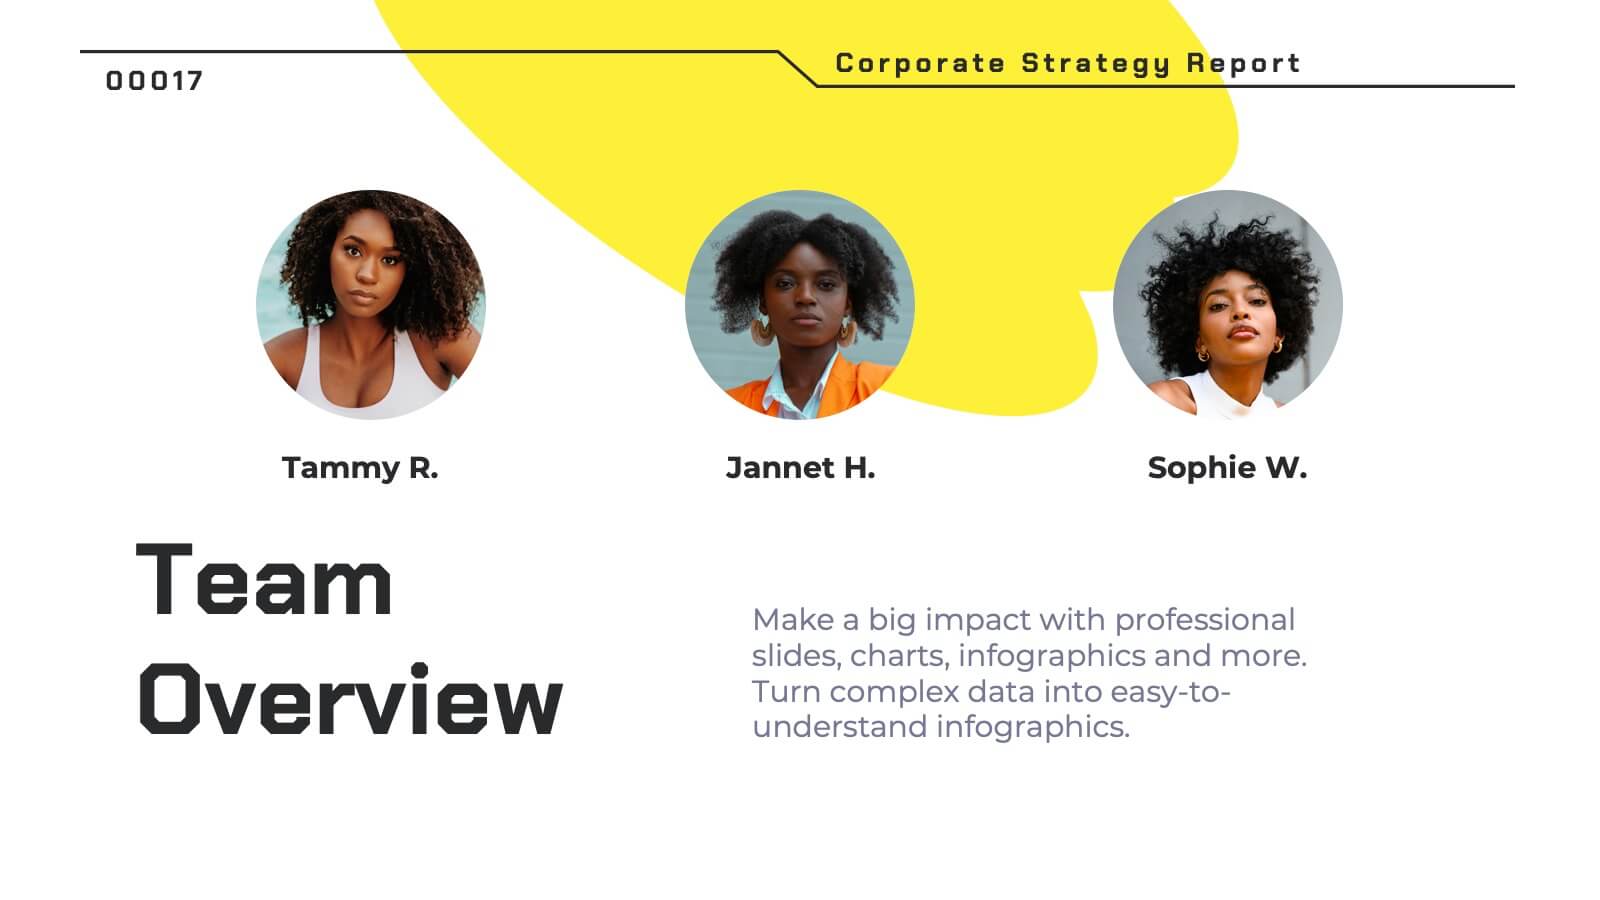
Pyronova Corporate Strategy Report Presentation
This professional corporate strategy template includes slides for market opportunity, SWOT analysis, objectives, marketing plan, revenue model, and competitive analysis. Designed for impactful presentations, it highlights financial performance, investment opportunities, and operational plans. Fully customizable in PowerPoint, Keynote, and Google Slides to suit diverse business needs.


7 diapositivas
Business Model Canvas Segments Infographic Presentation
The Business Model Canvas is a strategic management and entrepreneurial tool that helps businesses to visualize, analyze, and develop their business models. This template gives you the ability to create a visually attractive infographic while presenting your business model in a professional format. This eye-catching template is made to help your audience visualize the business model you are presenting and easily follow it with the instructive text slides. Customize this template in just a couple of minutes. Simple and easy to use, ready to be edited with colors and graphics of your choice.