


Características


¿Tienes alguna pregunta?
Recomendar


4 diapositivas
Cyber Security Measures Overview Presentation
Protect your digital world with this bold and professional template designed to visualize data protection, network security, and online safety strategies. Perfect for IT teams, tech presentations, or training materials. Fully customizable and compatible with PowerPoint, Keynote, and Google Slides for a seamless and secure presentation experience.


5 diapositivas
Stakeholder Expectations and Influence Matrix Presentation
Visualize your stakeholder dynamics with the Stakeholder Expectations and Influence Matrix Presentation. This slide uses a four-quadrant model—Monitor, Keep Informed, Keep Satisfied, Manage Closely—to map influence versus interest. Perfect for strategic planning, stakeholder communication, and project alignment. Editable in PowerPoint, Keynote, and Google Slides.


12 diapositivas
Customer Satisfaction Smile Rating Presentation
Measure customer happiness with this engaging customer satisfaction smile rating template! Featuring a visual scale from dissatisfaction to delight, this design helps businesses track feedback and identify improvement areas. Ideal for reports, surveys, and performance reviews. Fully customizable and compatible with PowerPoint, Keynote, and Google Slides.


21 diapositivas
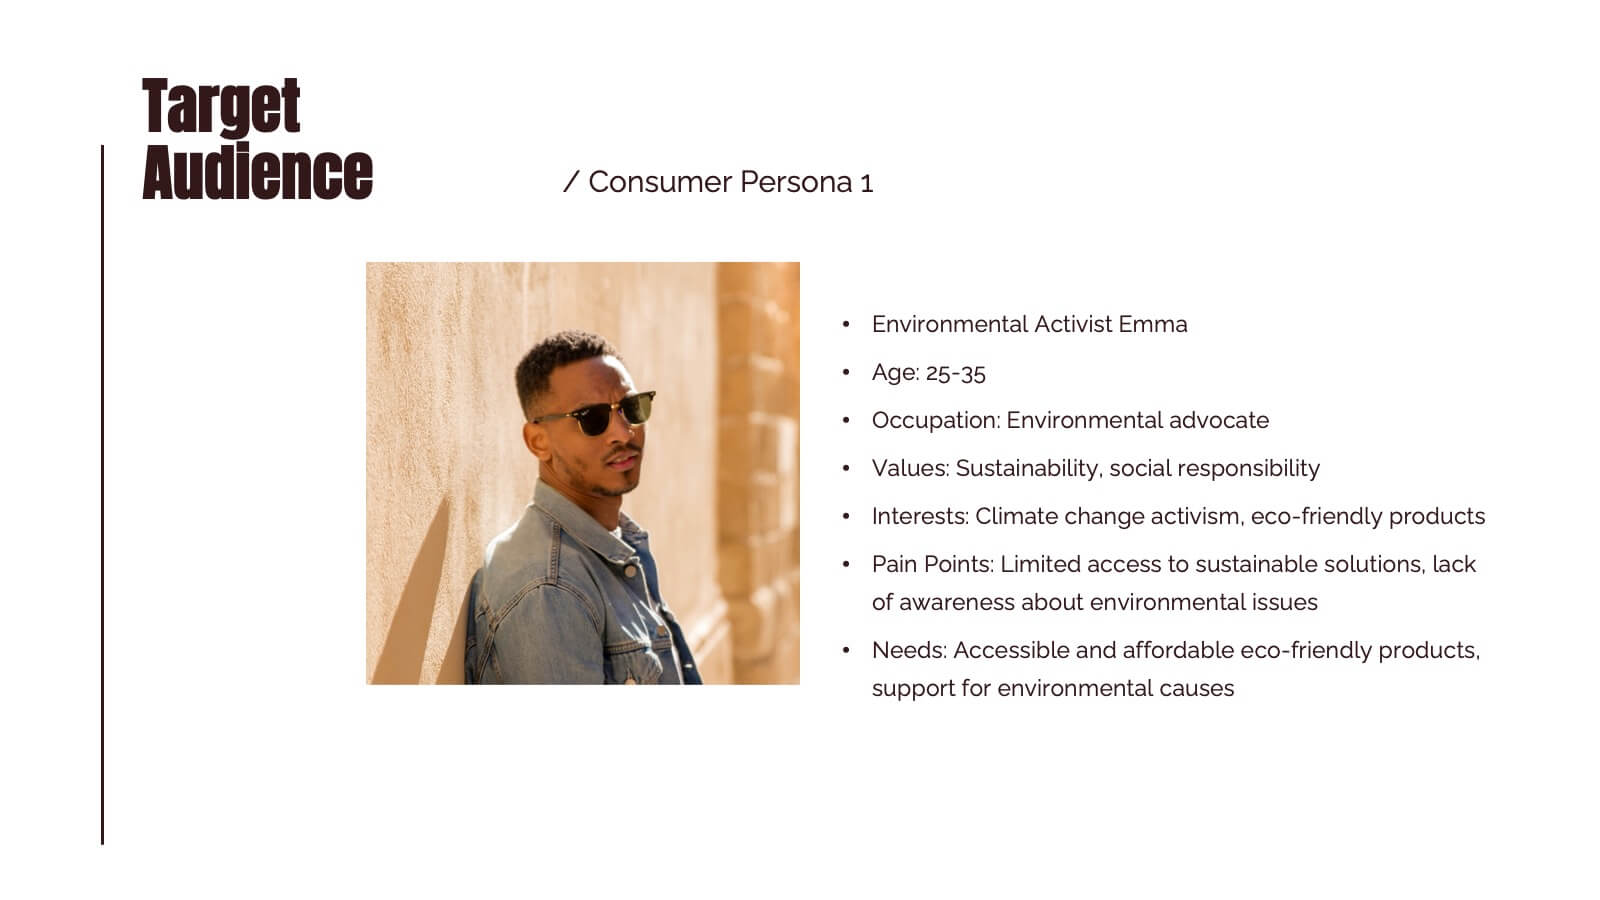
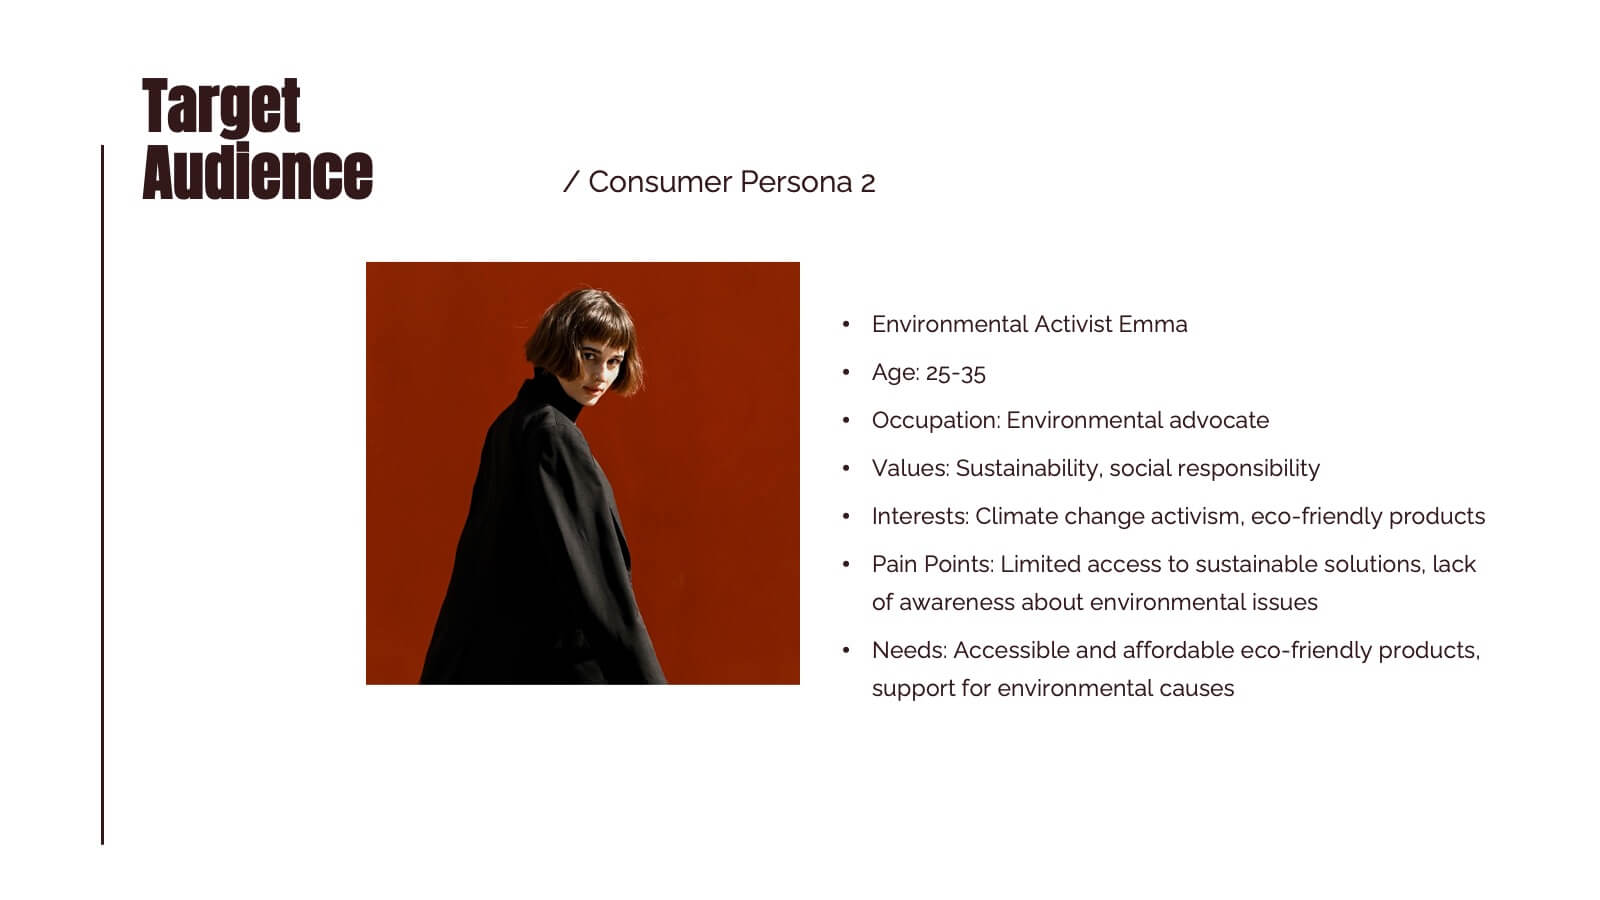
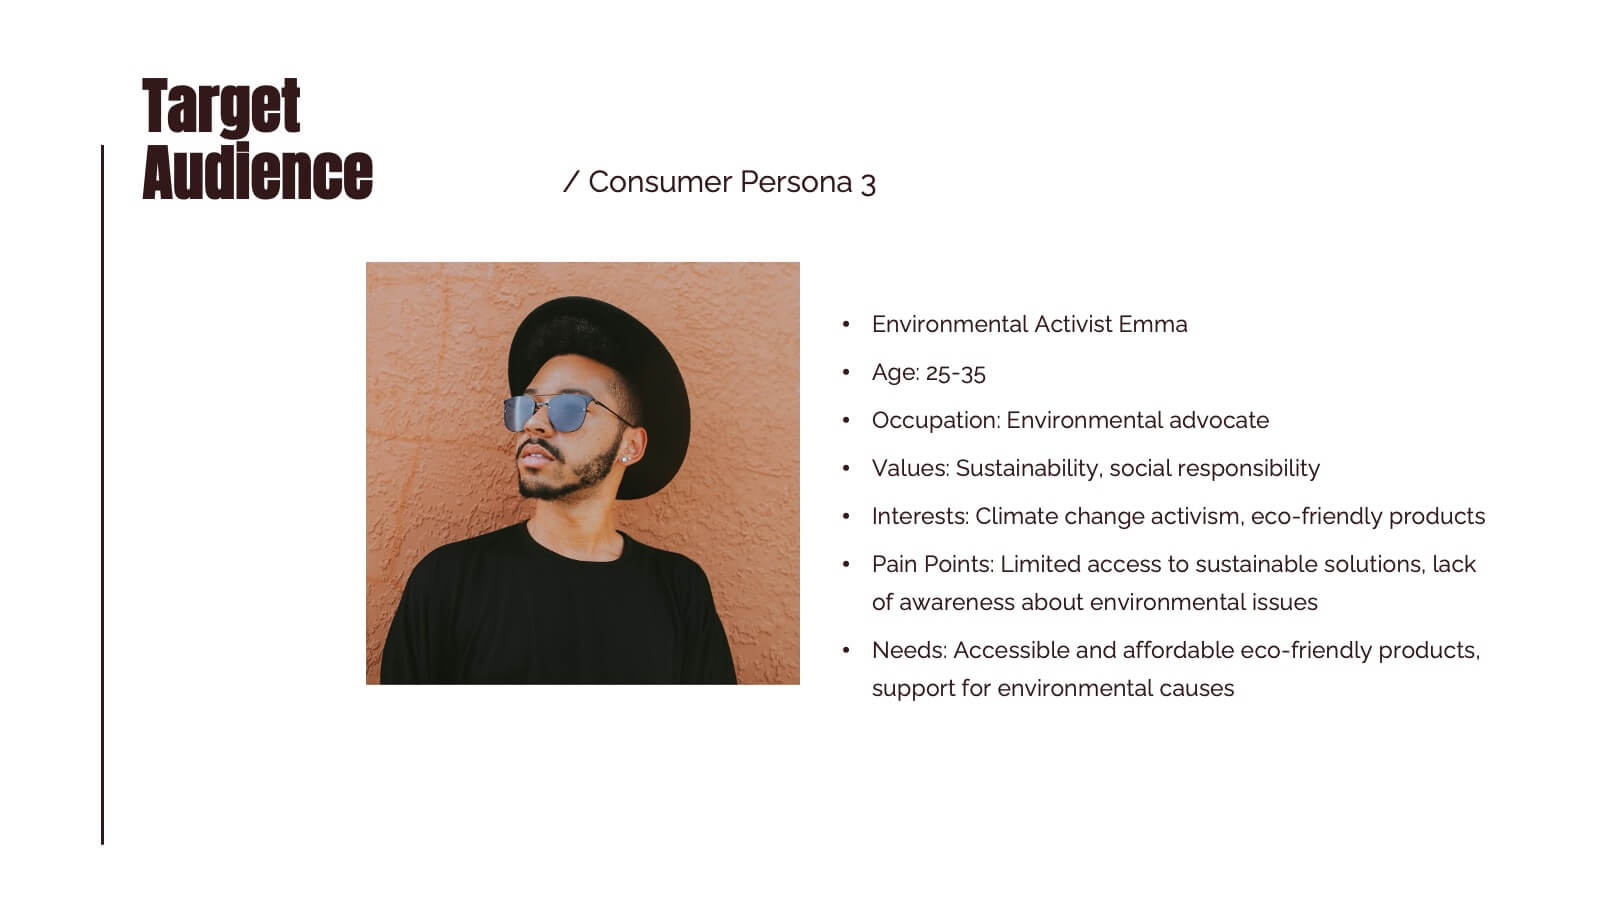
Dreameon Agency Portfolio Presentation
Showcase your agency's expertise with this sleek and modern portfolio presentation template. Designed to highlight your achievements, creative processes, and client success stories, this template offers a comprehensive layout that communicates professionalism and innovation. From introducing your team and services to detailing case studies and market analysis, each slide is meticulously crafted to leave a lasting impression. Display your strategy development, social media impact, and measurement analytics effectively, ensuring a cohesive narrative that resonates with your audience. Easily customizable and compatible with PowerPoint, Google Slides, and Keynote, this template is perfect for agencies looking to pitch their capabilities, attract new clients, or present project achievements with confidence.


5 diapositivas
Scrum Sprint Planning Presentation
Streamline your workflow presentations with this vibrant and intuitive Scrum Sprint Planning slide. Featuring a circular sprint cycle and directional flow, it clearly outlines the iterative process from planning to delivery. Perfect for agile teams presenting timelines, team roles, or workflow overviews. Easily customizable and compatible with PowerPoint, Keynote, and Google Slides.


7 diapositivas
SWOT Analysis Marketing Infographic Presentation
SWOT Analysis is a simple, but powerful strategic planning method. It helps identify your company’s strengths, weaknesses, opportunities and threats as you plan a course for the future. This template includes everything you need for your next project, including data and insight about your business. This template comes with 7 slides. It includes a title for each infographic and allows you to build your swot charts, add icons and convert the text into bullet points. You have complete control over all elements within each slide and can easily add, delete or modify content at any time!


6 diapositivas
Project Goals and Deliverables Presentation
Clearly define and present your project objectives with the Project Goals and Deliverables Presentation. This template offers a structured layout to highlight key goals, milestones, and deliverables, making it perfect for project managers, teams, and stakeholders. Fully customizable and compatible with PowerPoint, Keynote, and Google Slides.


7 diapositivas
Scope Management and Planning Presentation
Ensure clear project scope definition with the Scope Management and Planning Presentation. This structured template highlights key elements of project scope, responsibilities, and deliverables using an intuitive layout. Ideal for project managers, business analysts, and teams aligning project goals. Fully editable and compatible with PowerPoint, Keynote, and Google Slides.


6 diapositivas
Artificial Intelligence Stocks Infographics
Our "Artificial Intelligence Stocks" infographic template, ideal for PowerPoint, Keynote, and Google Slides, is tailored for financial analysts, investors, and tech enthusiasts. This template seamlessly blends technology and finance, focusing on AI stocks and investment trends. This futuristic design includes elements such as AI technology trends, stock market performance, and investment opportunities. It’s an invaluable tool for presenting complex financial and technological data in a clear and visually appealing manner. The template is perfect for conveying intricate investment strategies and market insights related to the burgeoning AI sector. The template features a cutting-edge design with a color scheme that blends shades of blue and gray, symbolizing innovation and financial growth. It’s designed to make your presentation not only informative but also visually engaging. Whether used in investor meetings, tech conferences, or educational seminars, this template ensures your insights on AI stocks are presented with clarity and sophistication.


7 diapositivas
Venn Diagram Structure Infographic
Illuminate intersections and highlight distinctions with our Venn diagram infographic. Cast on a pristine white canvas, the design radiates with harmonious hues of pastel purple, calming blue, passionate red, and rejuvenating green, emphasizing the areas of overlap and distinct zones in a structured manner. Bolstered with infographics, representative icons, and adjustable image placeholders, this template is an epitome of clarity in showcasing relational logic among sets. Configured for Powerpoint, Keynote, or Google Slides. An ally for data analysts, statisticians, educators, or anyone seeking to depict intertwined relationships in a clear, visual format.


5 diapositivas
User Experience Customer Path Map
Visualize the full customer journey with the User Experience Customer Path Map Presentation. This engaging slide illustrates five key touchpoints in the user experience cycle using a connected flow design with bold icons and captions. Perfect for mapping onboarding steps, product interactions, or decision-making stages. Fully editable in PowerPoint, Keynote, and Google Slides.


20 diapositivas
Aurorium Sales Proposal Presentation
Win over clients with confidence using this sleek and modern sales proposal presentation. Designed to highlight key business strategies, pricing plans, competitive analysis, and future opportunities, this template helps you communicate your value with clarity and impact. Fully customizable and compatible with PowerPoint, Keynote, and Google Slides for seamless presentations.


6 diapositivas
Threat and Mitigation Bowtie Model Presentation
Clarify cause and consequence pathways with the Threat and Mitigation Bowtie Model Presentation. This template helps visualize risk sources, critical events, and mitigation strategies in a clear bowtie format. Ideal for incident analysis, safety reviews, and compliance reporting. Fully editable in PowerPoint, Keynote, and Google Slides.

25 diapositivas
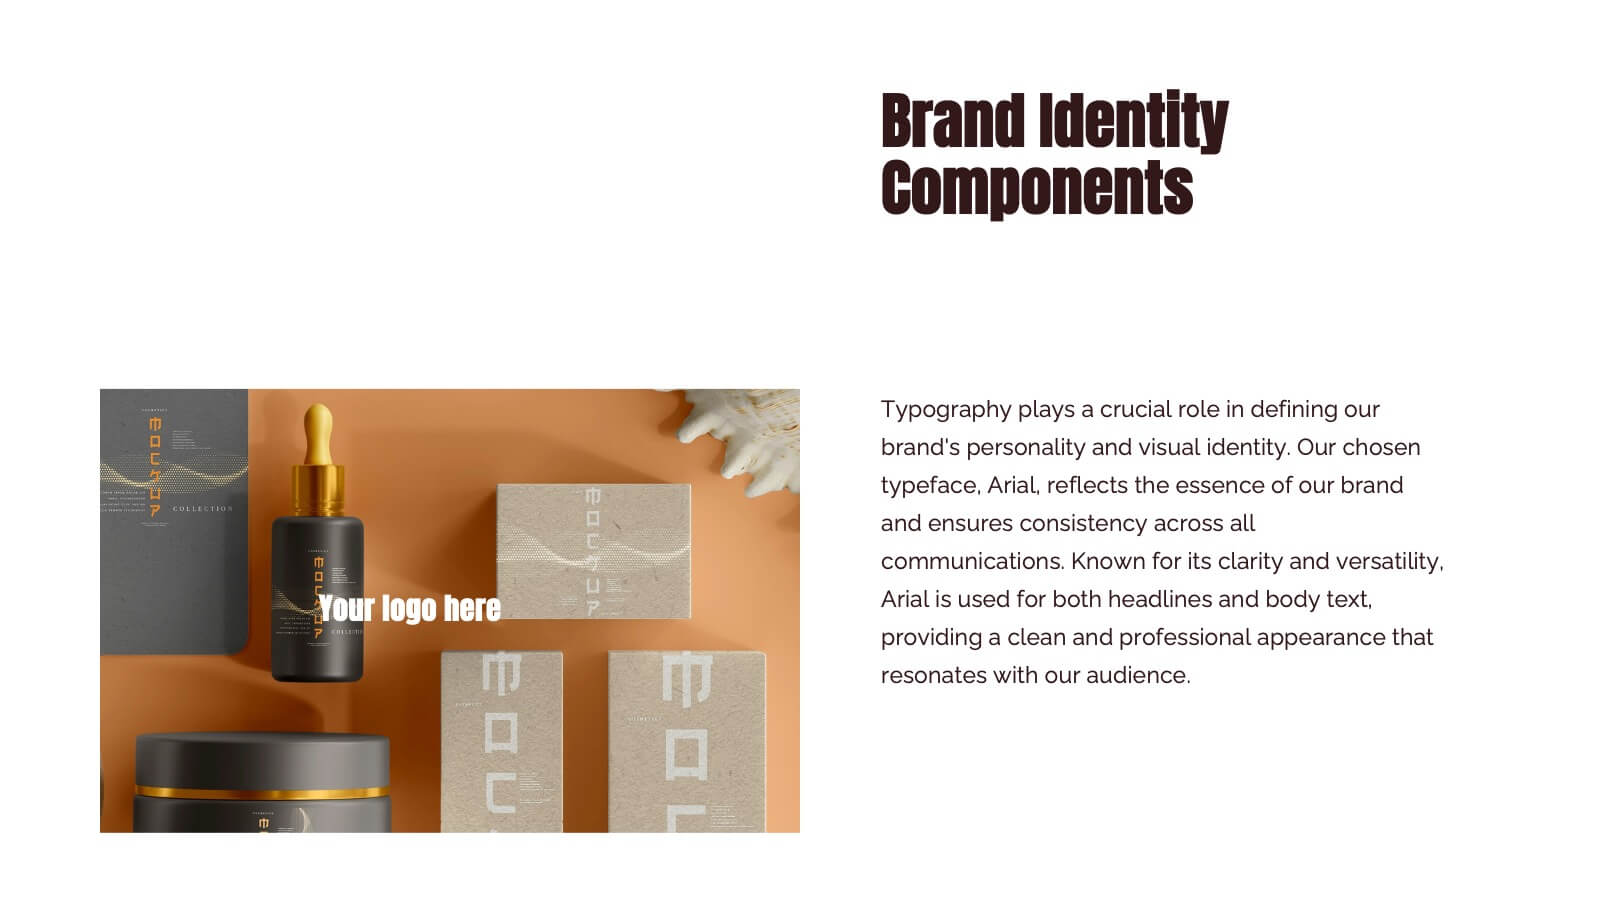
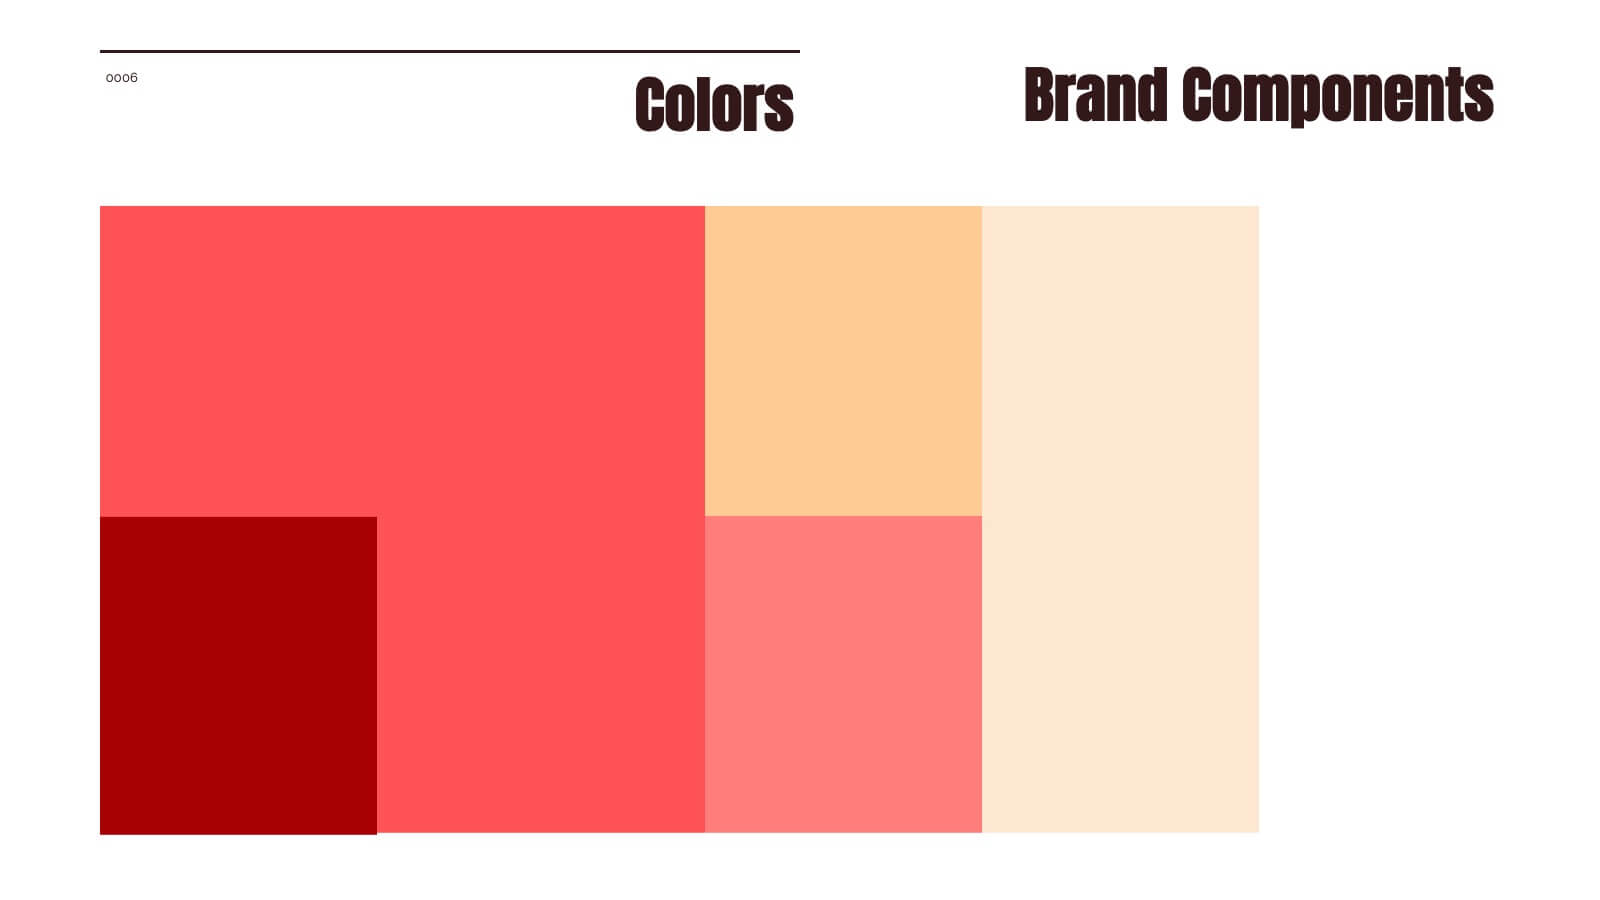
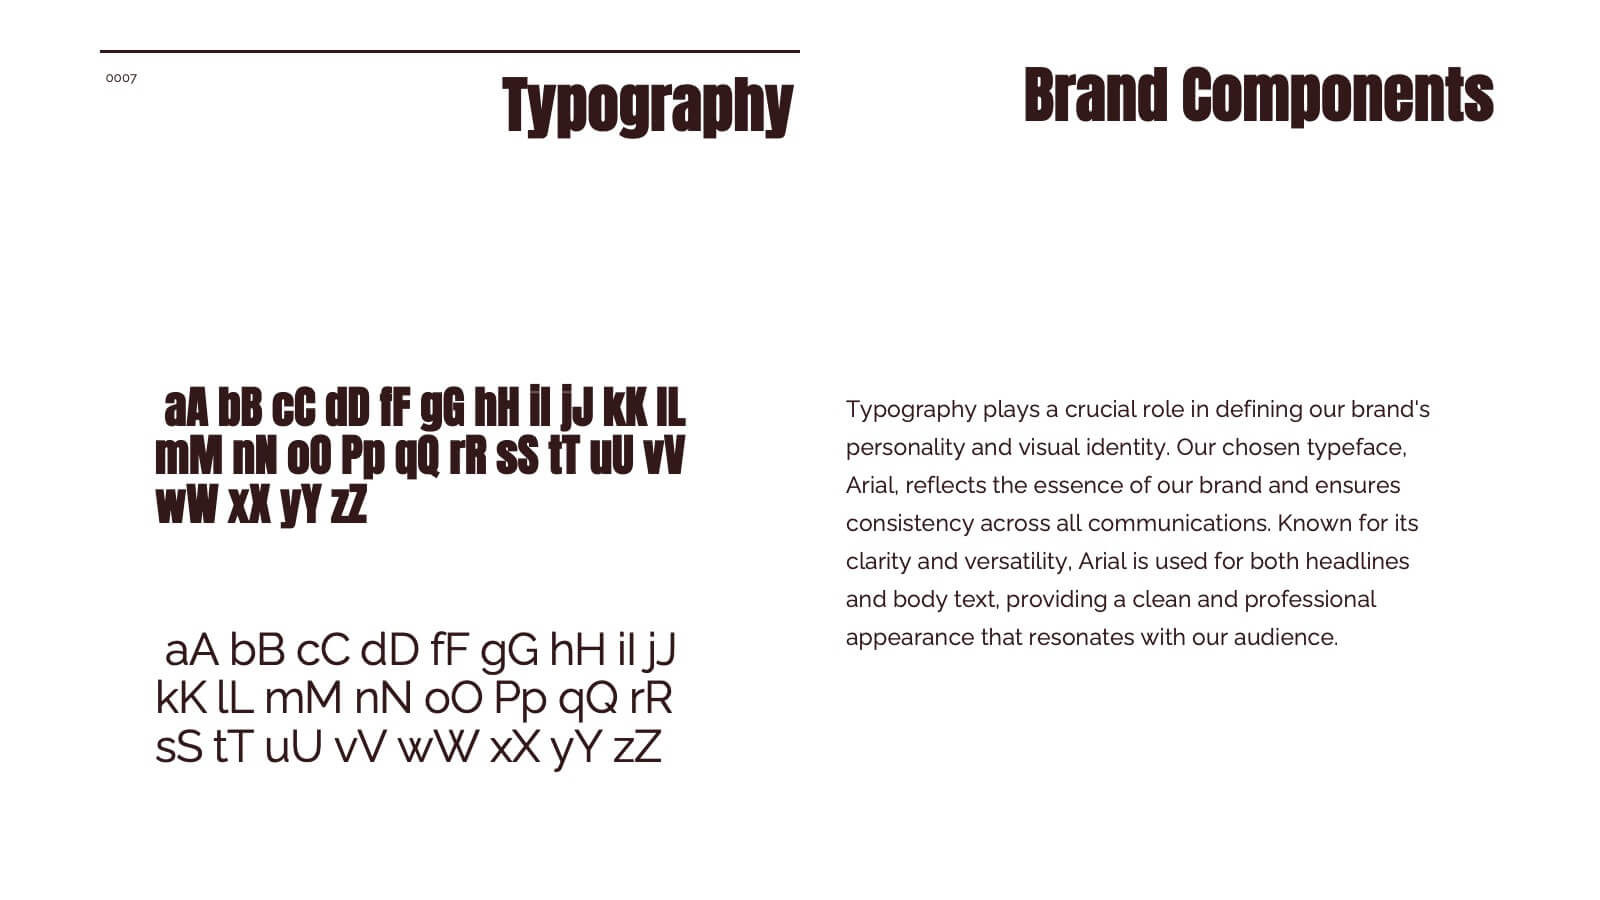
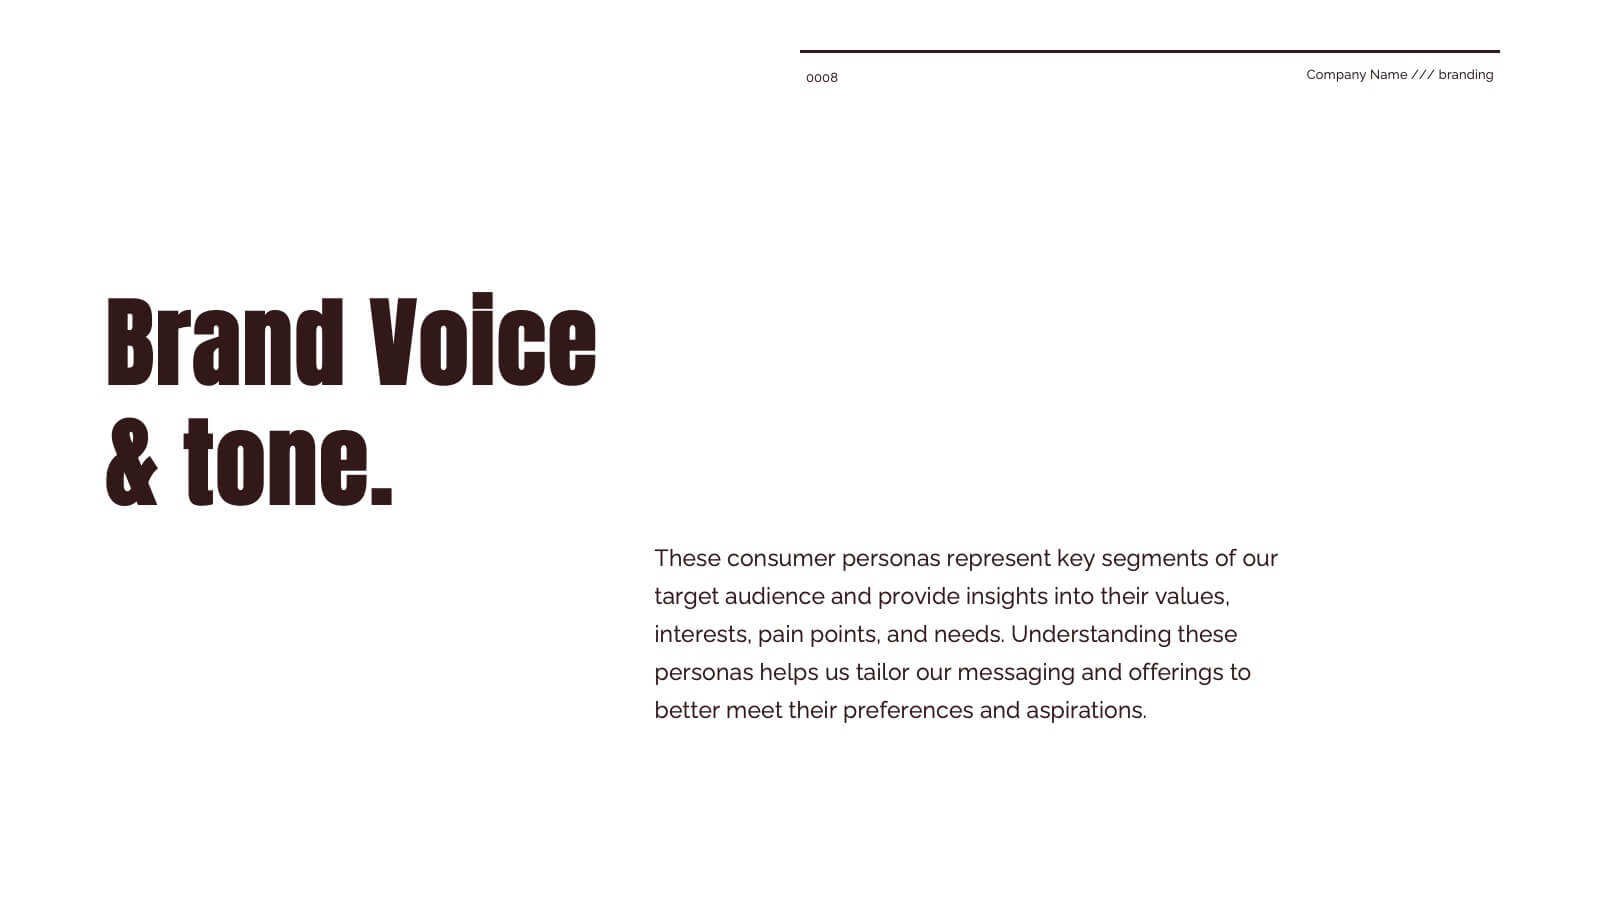
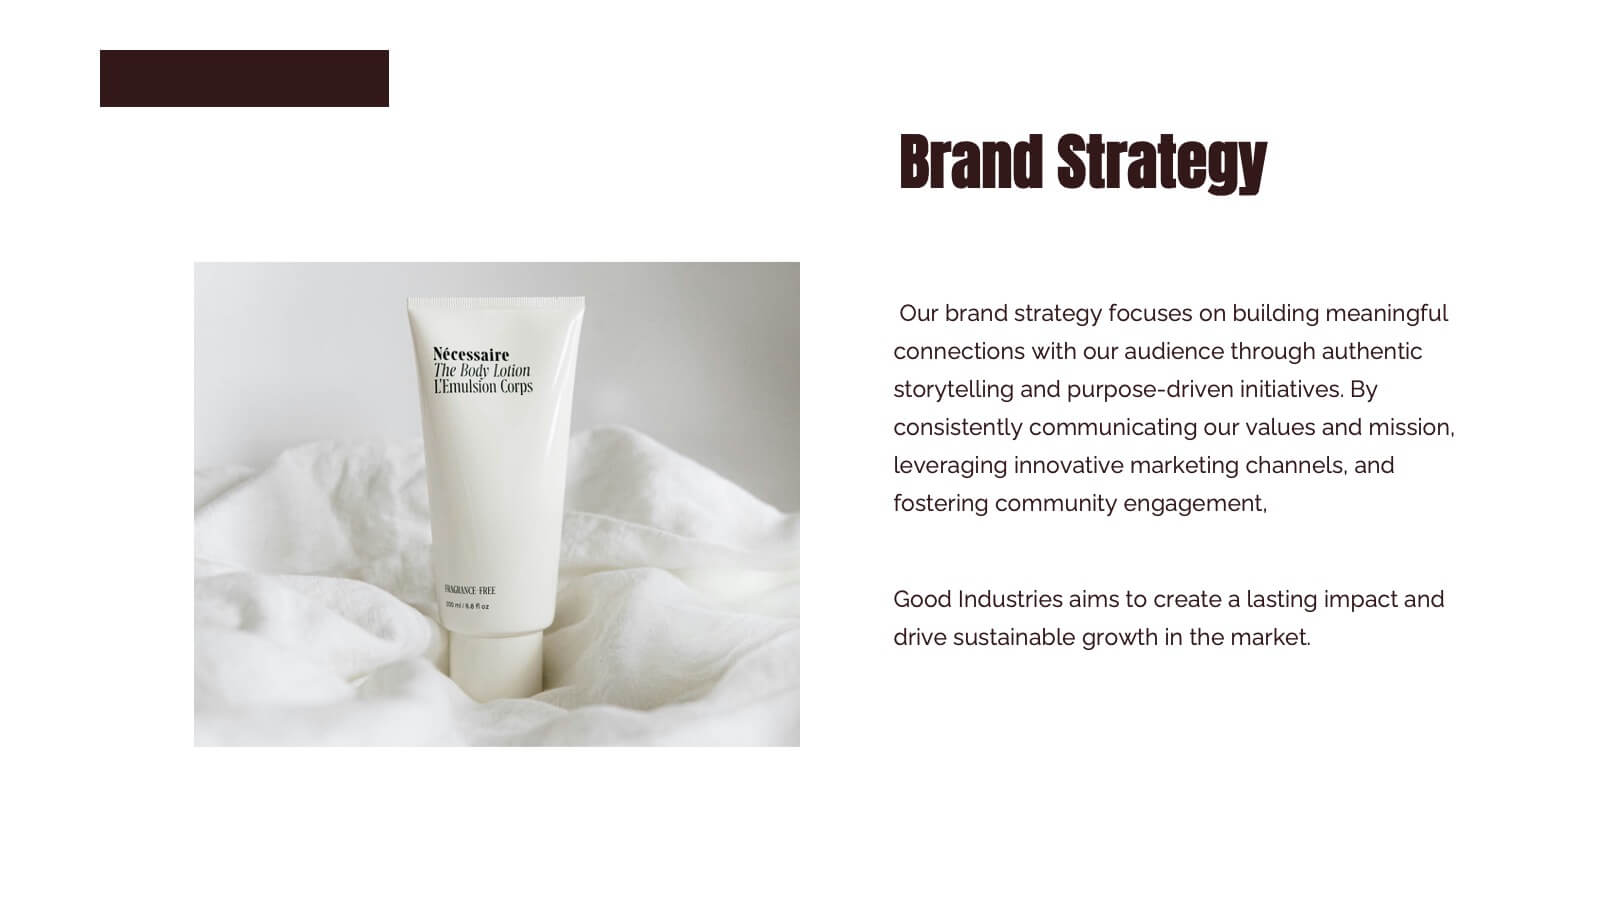
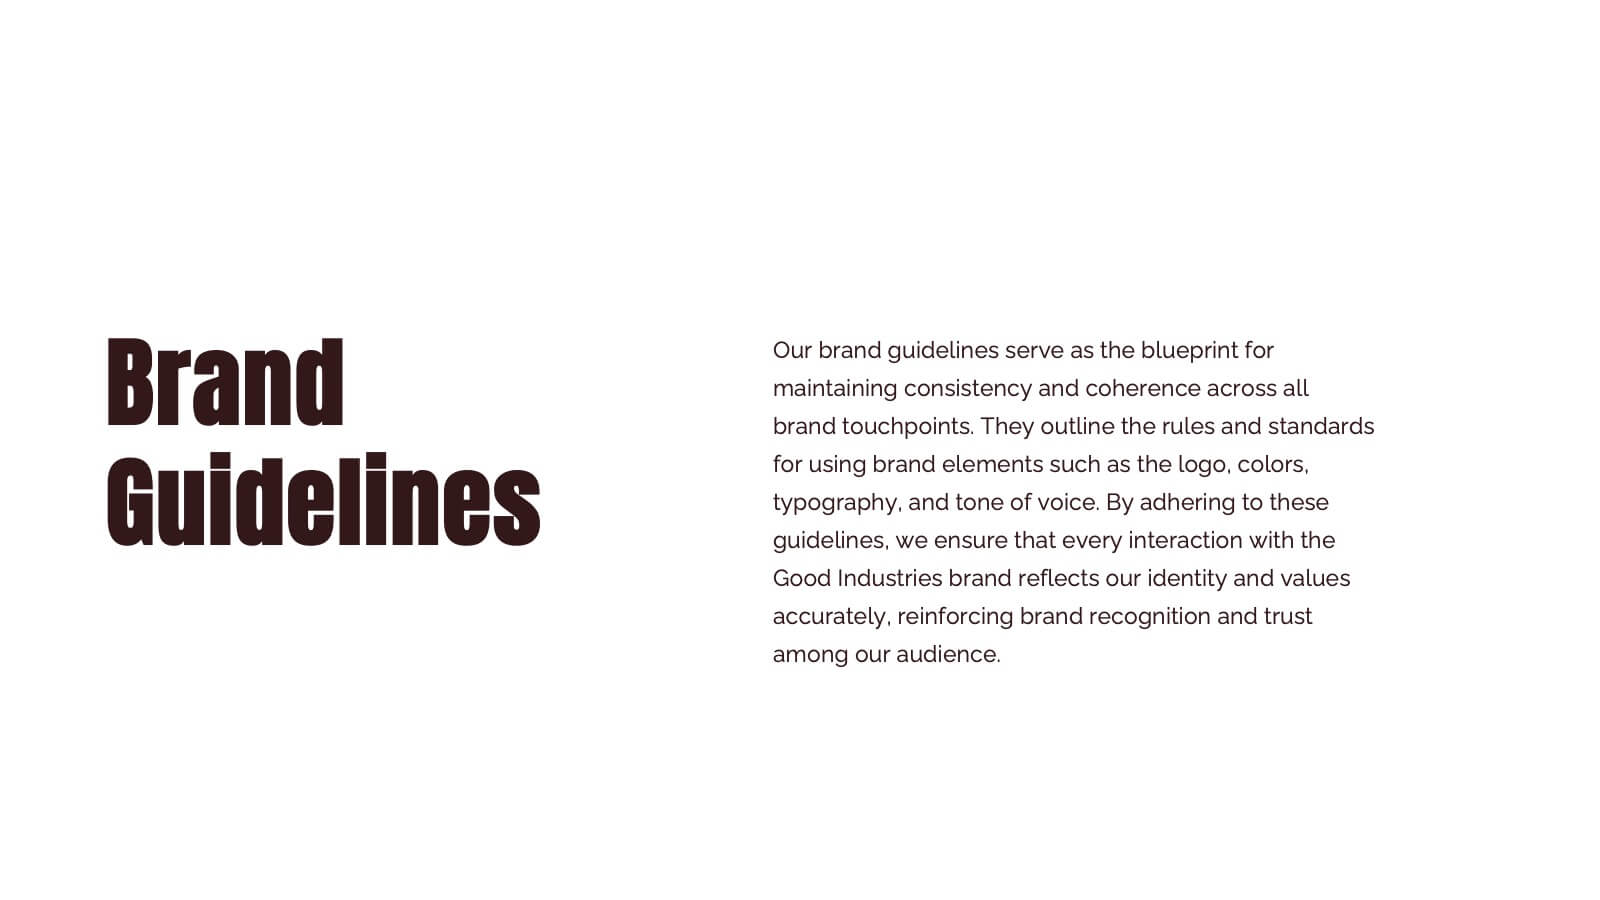
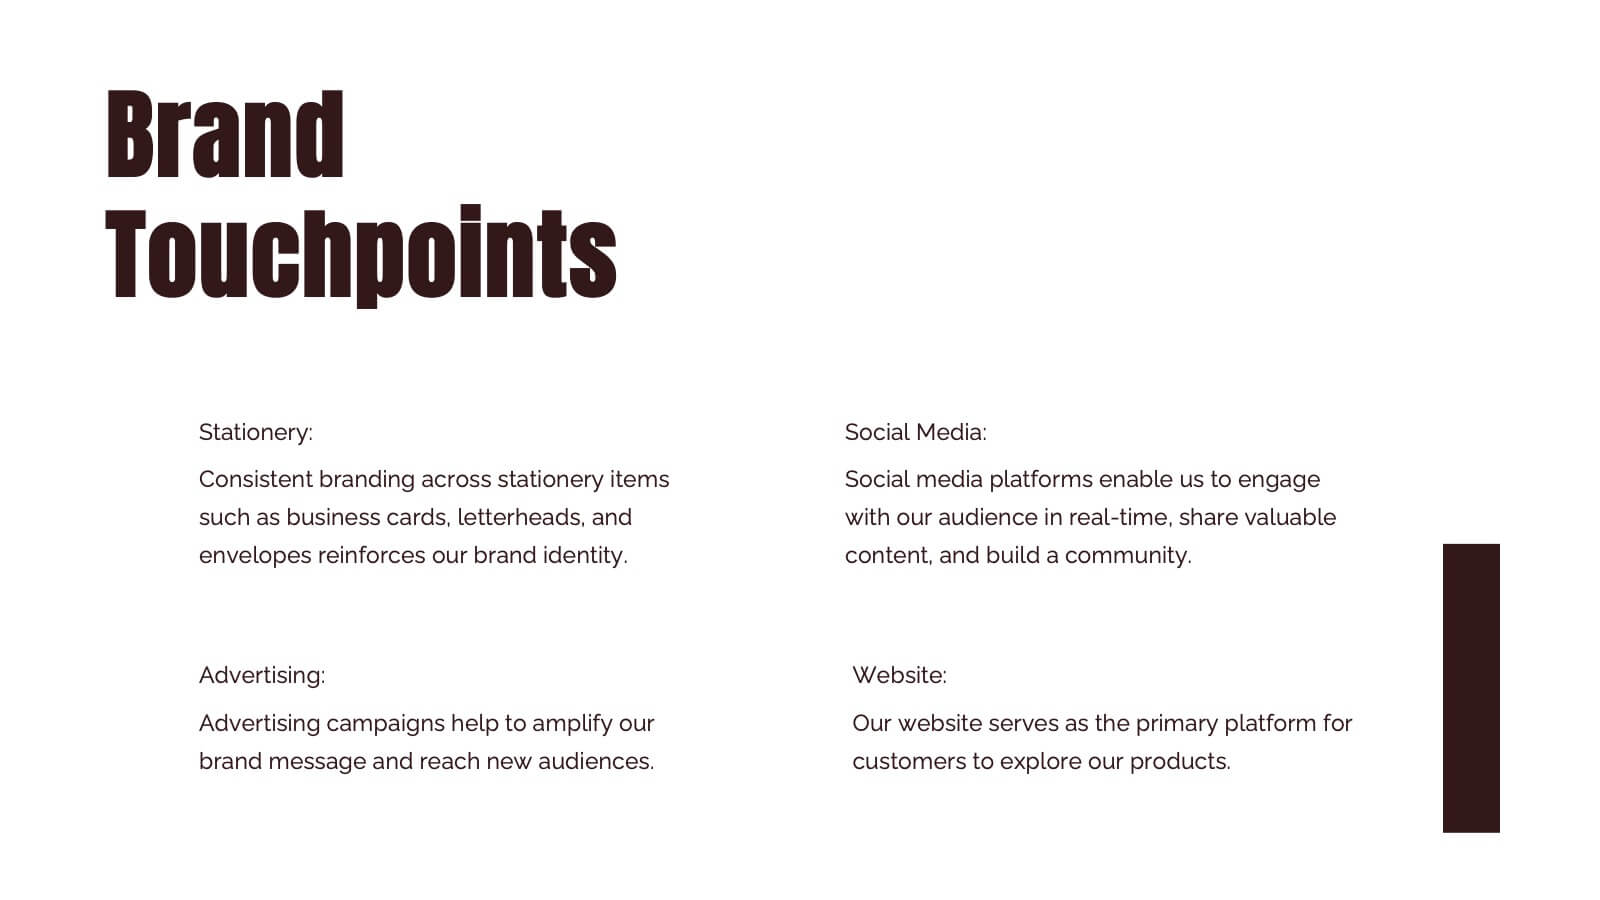
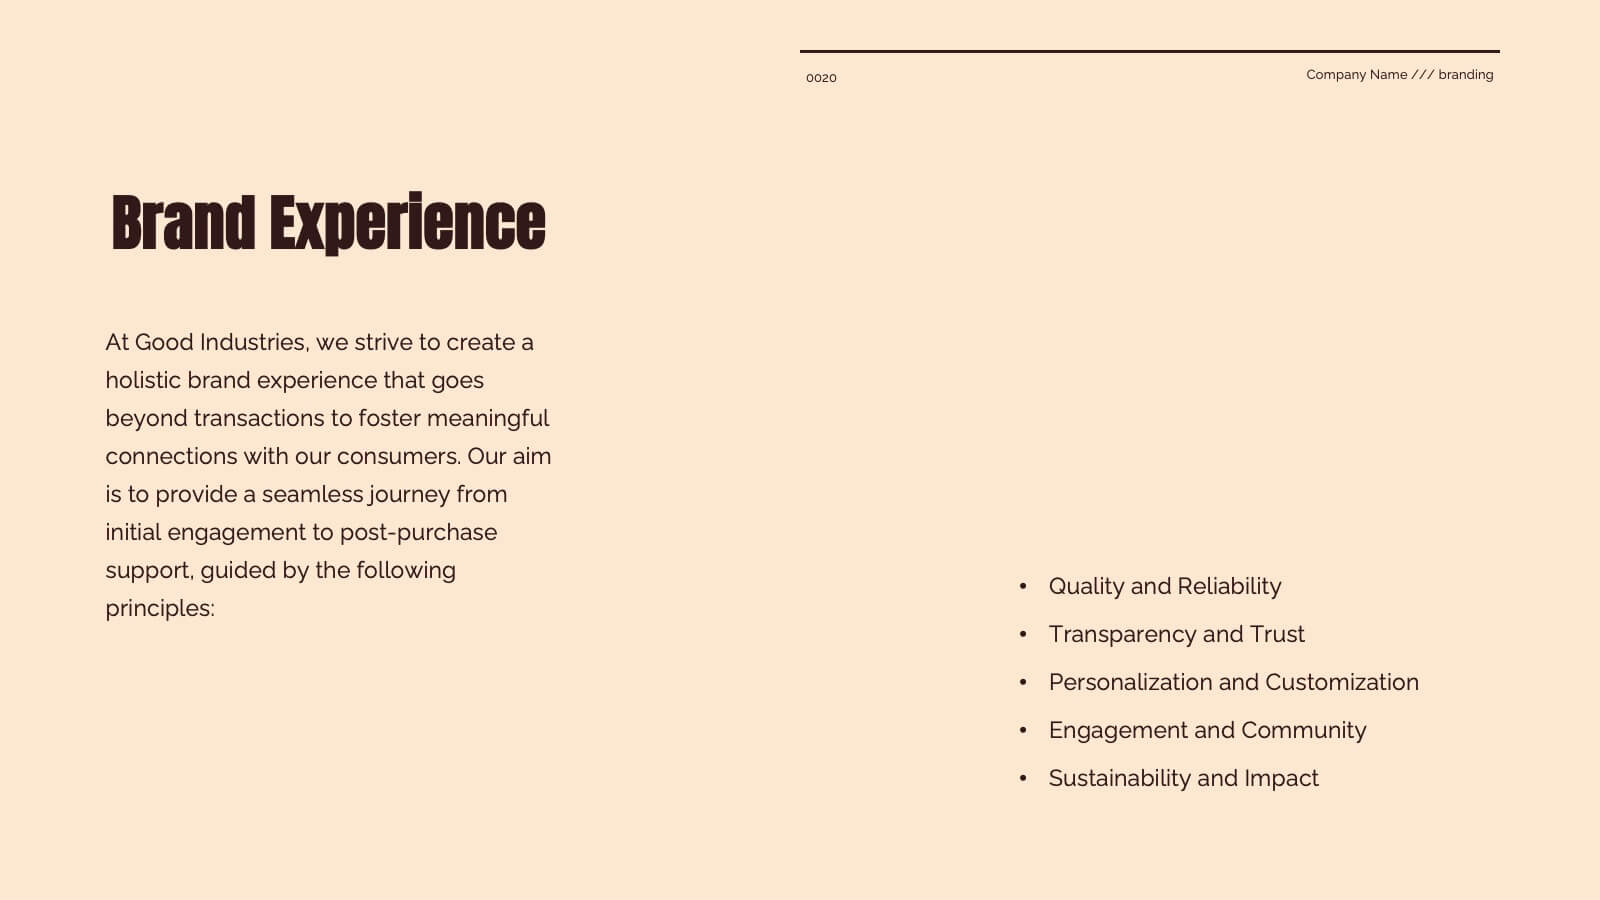
Blaze Brand Identity Presentation
Ignite your brand's potential with this vibrant, blaze-inspired presentation! Ideal for showcasing your brand identity, this template highlights key elements like logo design, color palette, and brand messaging with bold visuals and a modern layout. Perfect for making your brand stand out. Compatible with PowerPoint, Keynote, and Google Slides.


7 diapositivas
Real Estate Infographic Presentation Template
Real estate is a form of property that can be used for residential, commercial or industrial purposes, and typically includes any resources on the land such as water or minerals. This template is especially useful for real estate agents and brokers who can use it to better understand the real estate industry. This template comes with Infographics that are a great way to explain complex ideas and trends in a simple, easy-to-understand way, and can help your clients better understand as well. This template displays data visually, which will allow your audience to grasp complex ideas quickly.


20 diapositivas
Solar Beam Sales Proposal Presentation
Supercharge your sales presentation with the Solar Beam Sales Proposal template! This vibrant and dynamic template is designed to capture attention and drive home your key points with flair. Start with a bold introduction, then seamlessly guide your audience through your company overview, product/service details, and target market analysis. Highlight your sales objectives, showcase your team, and provide compelling customer testimonials. With dedicated slides for pricing strategies, sales collateral, and performance metrics, you’ll have all the tools you need to make a persuasive pitch. The template also includes sections for discussing future opportunities, action plans, and a Q&A session to address any final questions. Its modern, professional design ensures that your proposal stands out in any setting. Fully customizable and compatible with PowerPoint, Keynote, and Google Slides, this template is your go-to for creating impactful sales presentations that leave a lasting impression.
5 diapositivas
Business Strategy Arrow Presentation
Enhance your strategic planning with the Business Strategy Arrow Presentation. This visually structured template guides your audience through a step-by-step progression, making it ideal for business roadmaps, strategic plans, and goal-oriented workflows. Easily customize the colors, text, and icons to align with your brand. Fully compatible with PowerPoint, Keynote, and Google Slides for effortless editing and professional presentations.