


Características


¿Tienes alguna pregunta?
Recomendar


23 diapositivas
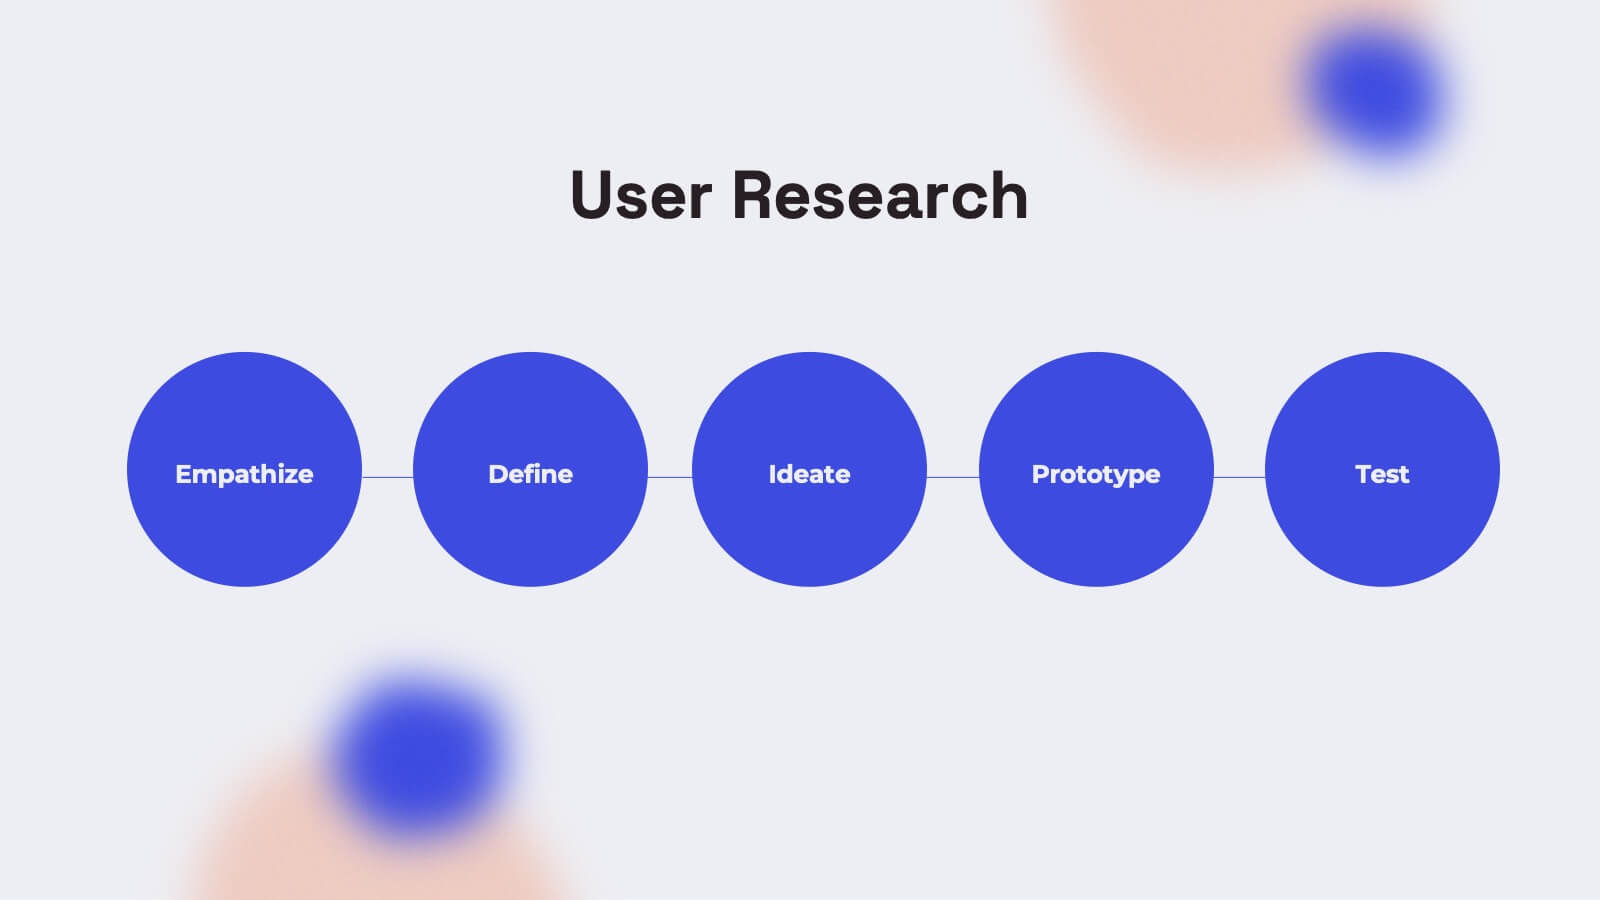
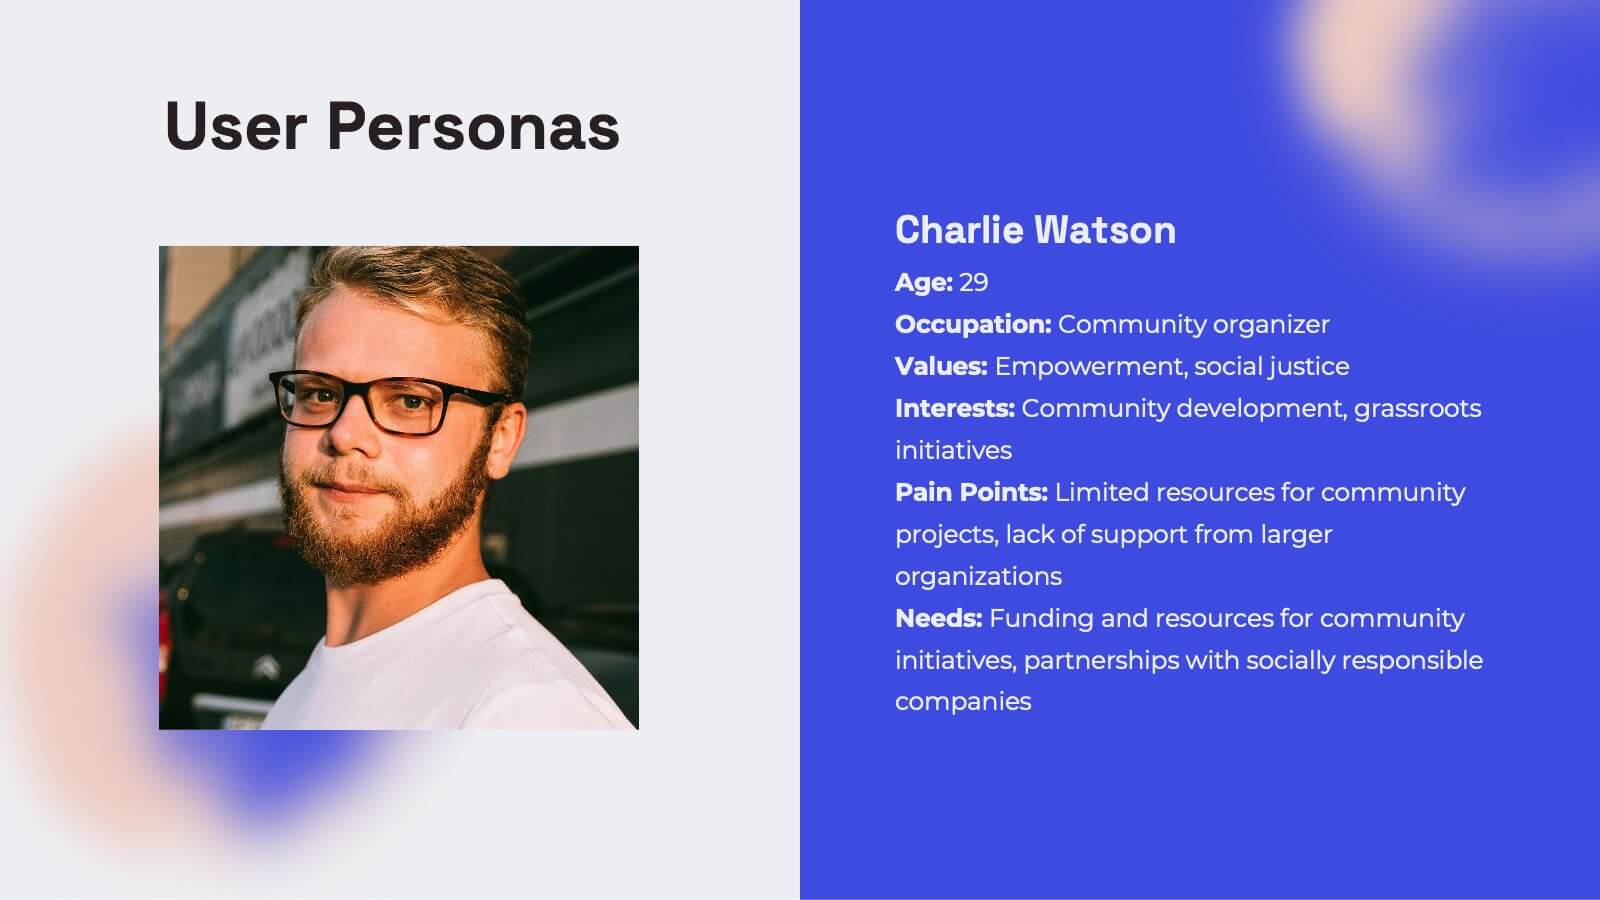
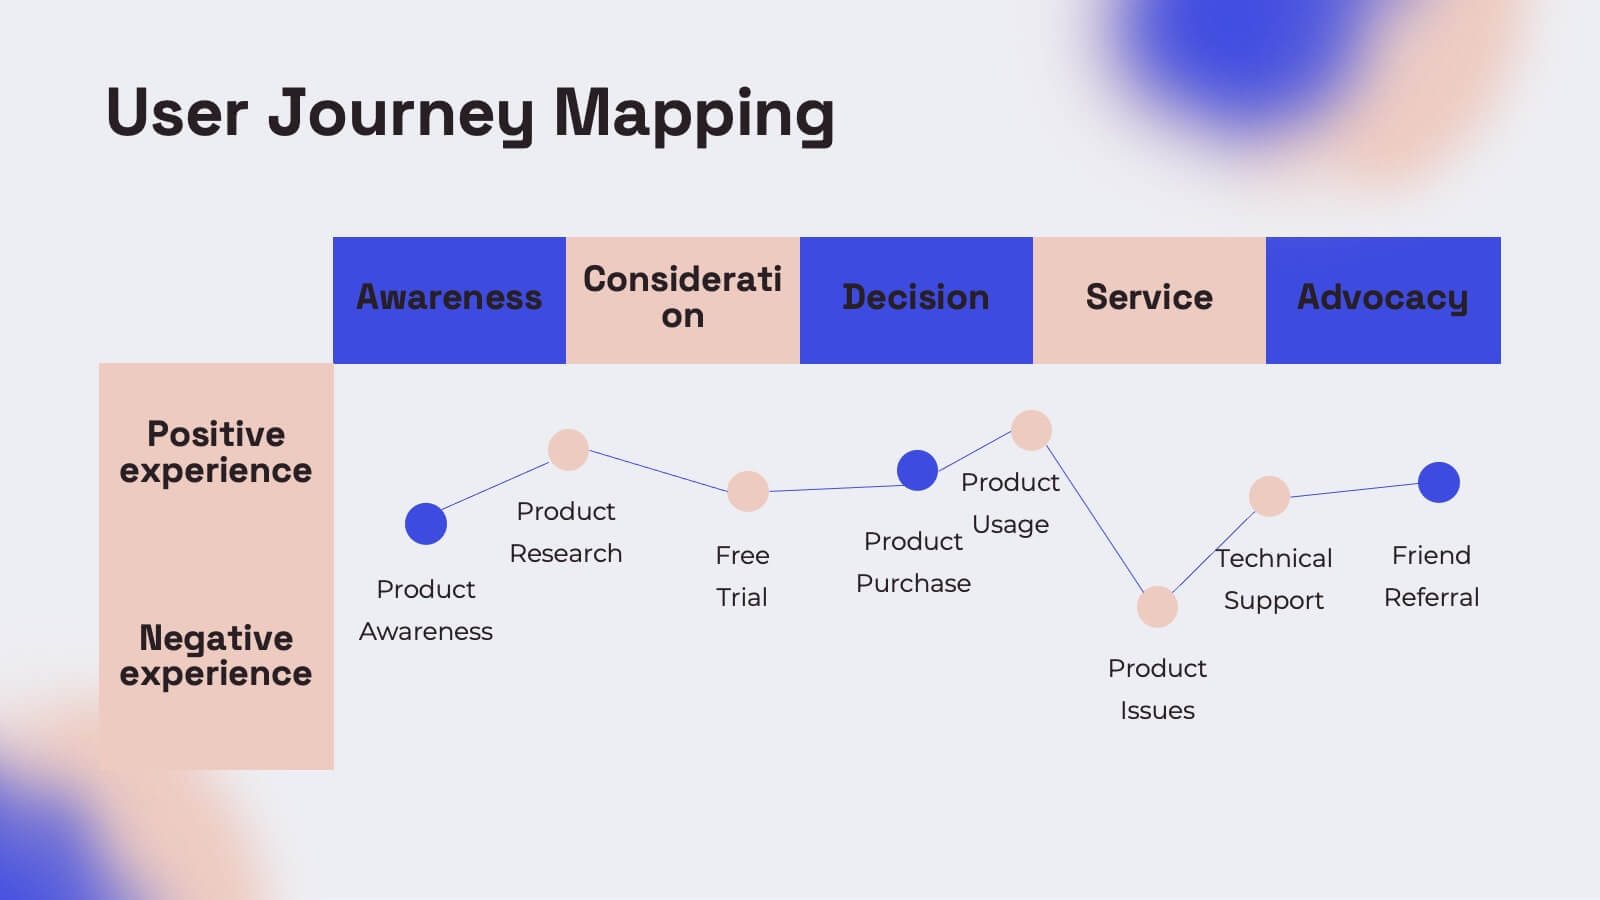
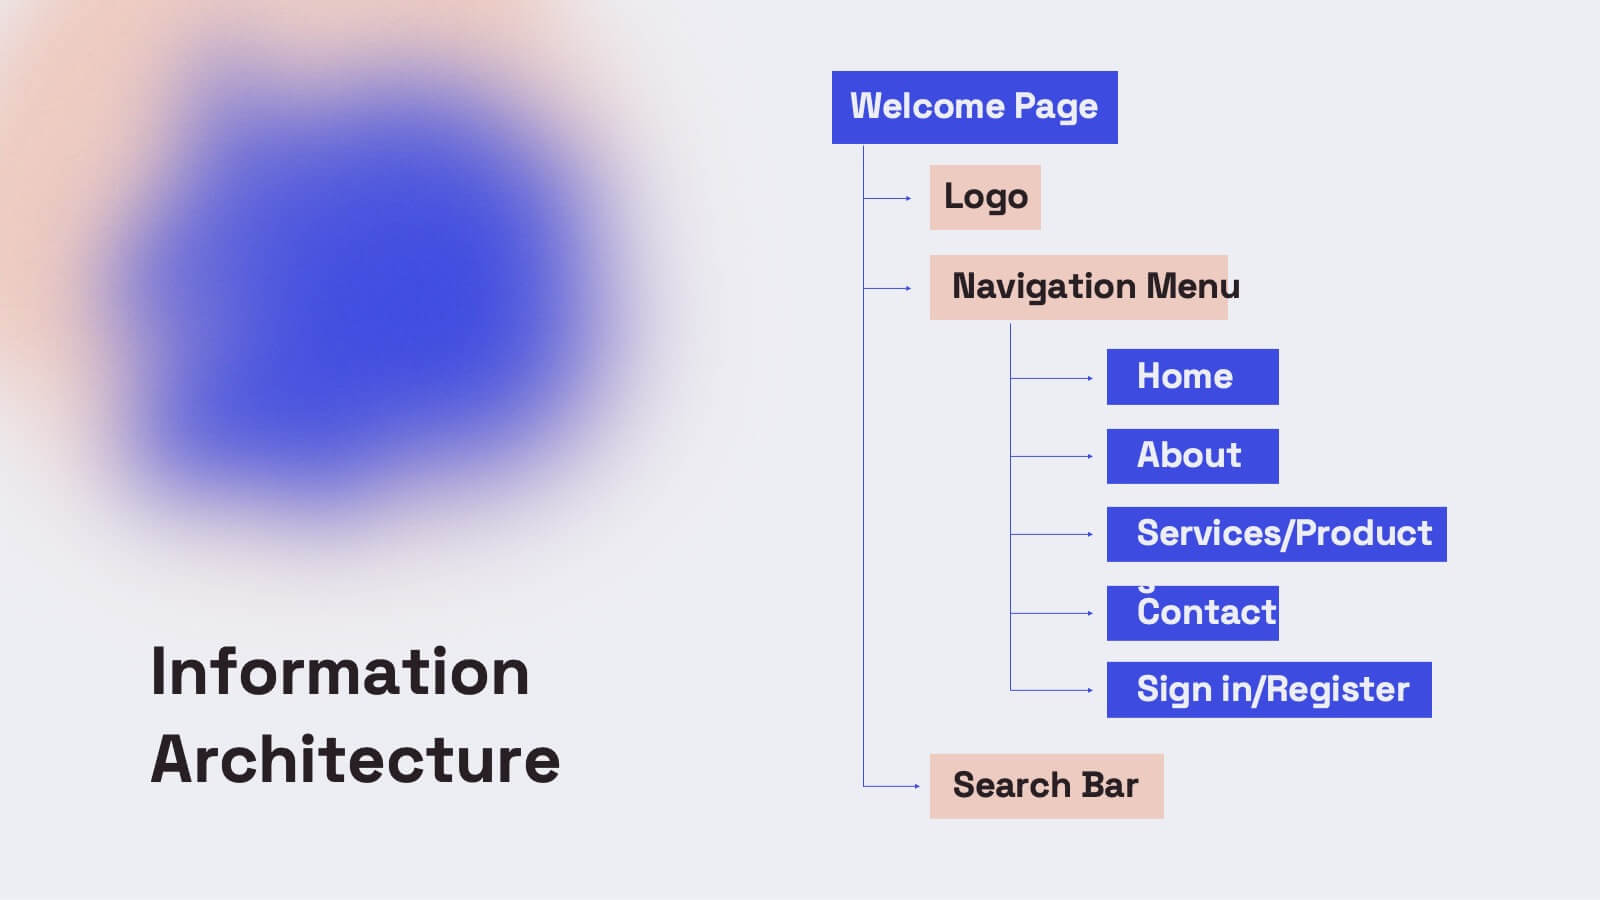
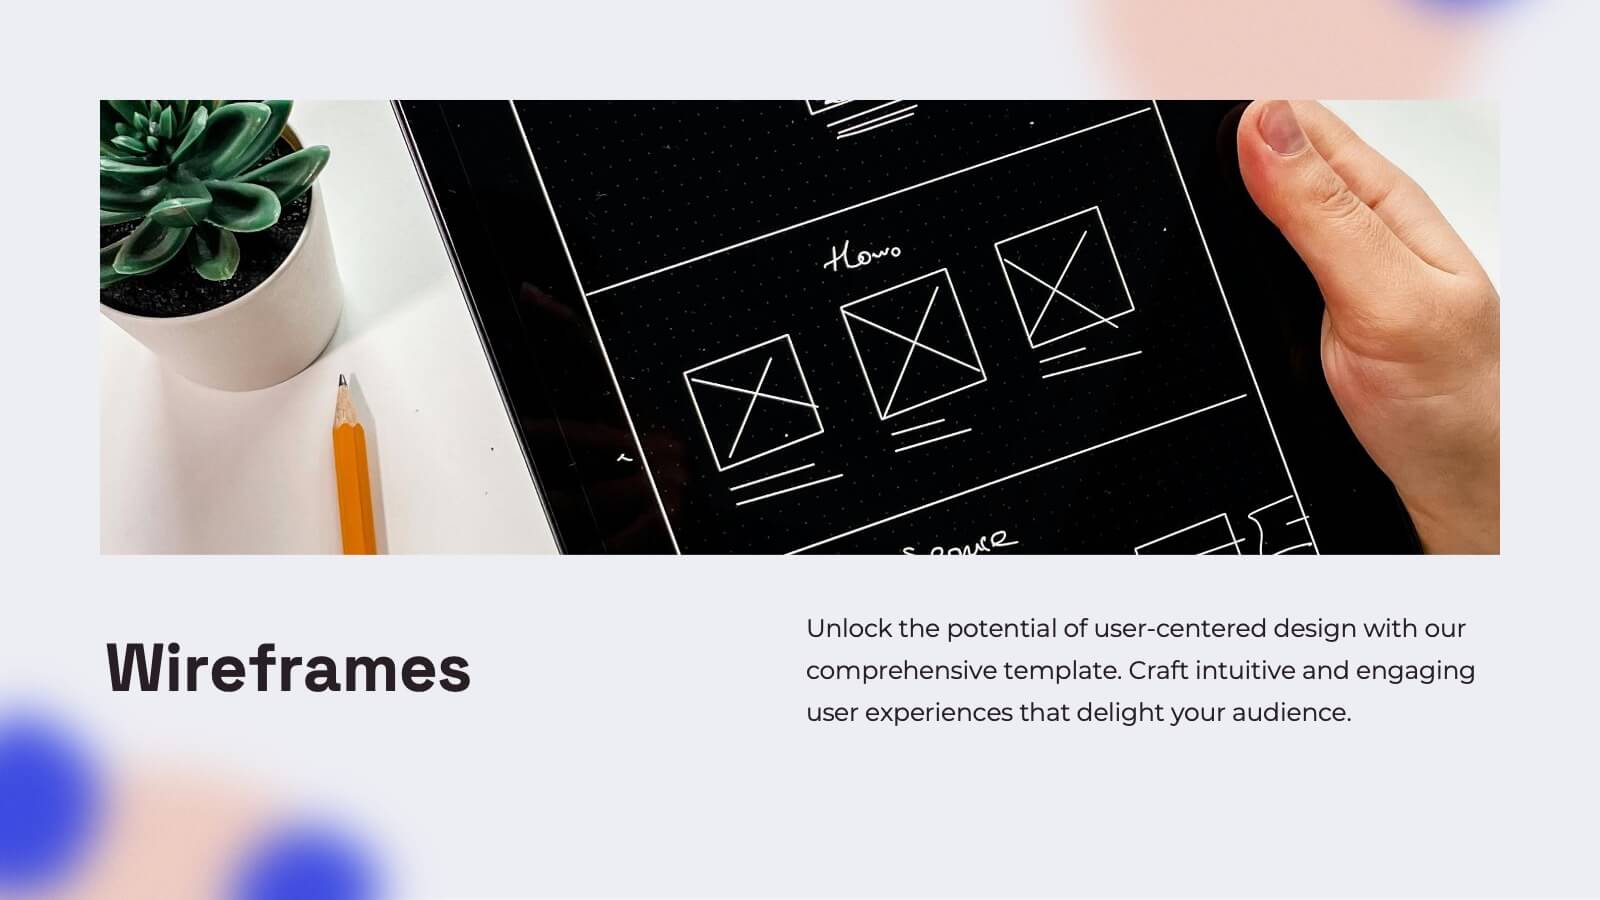
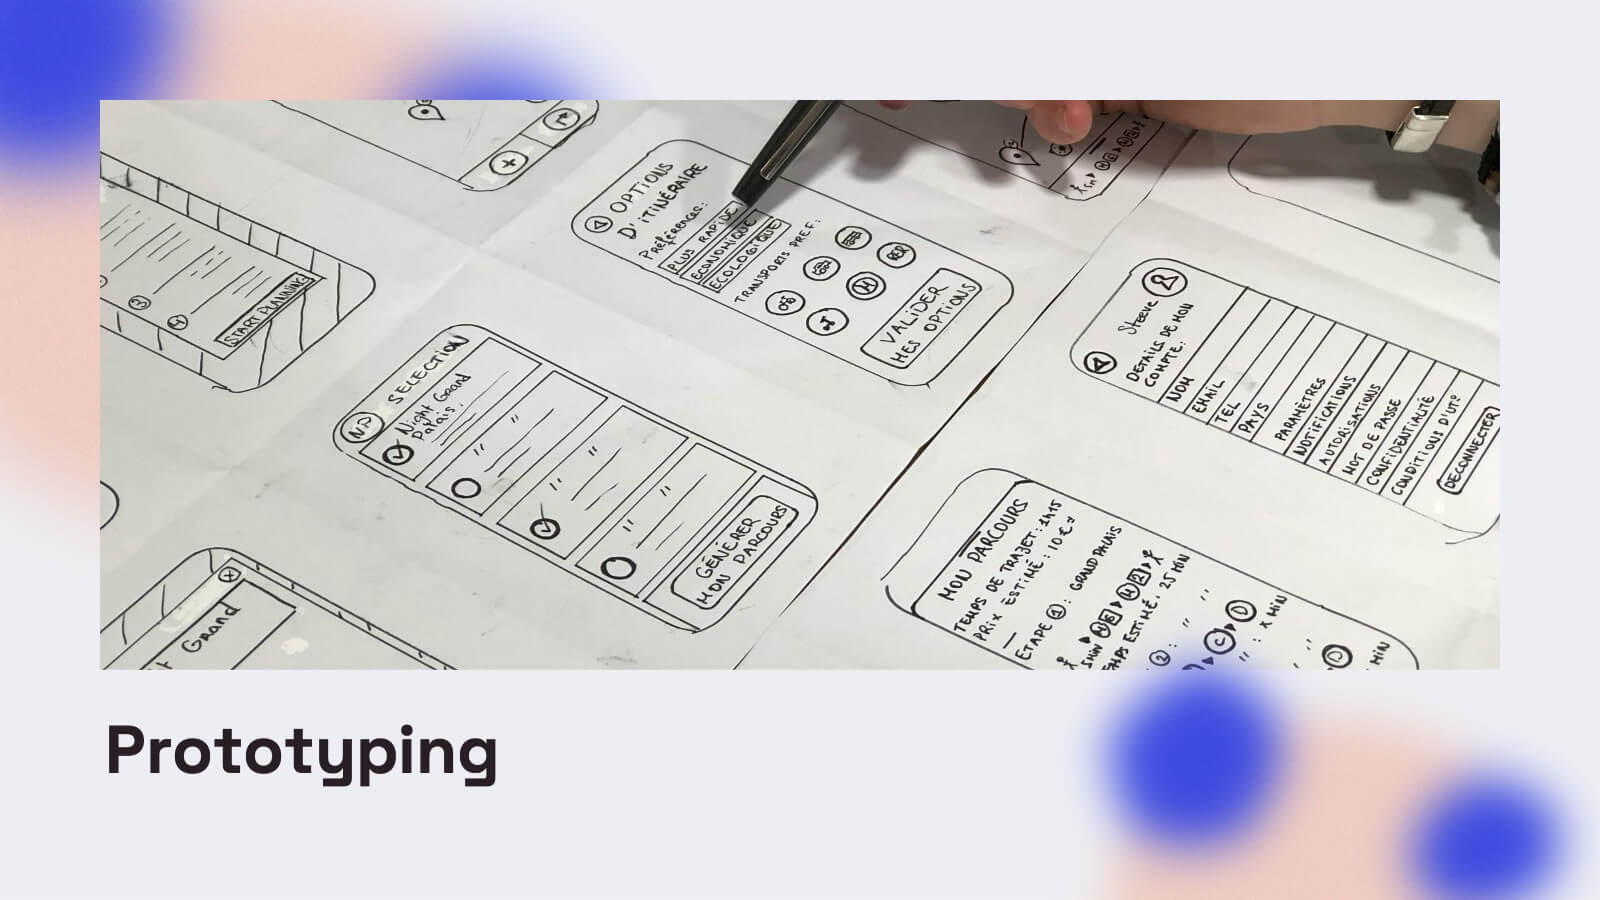
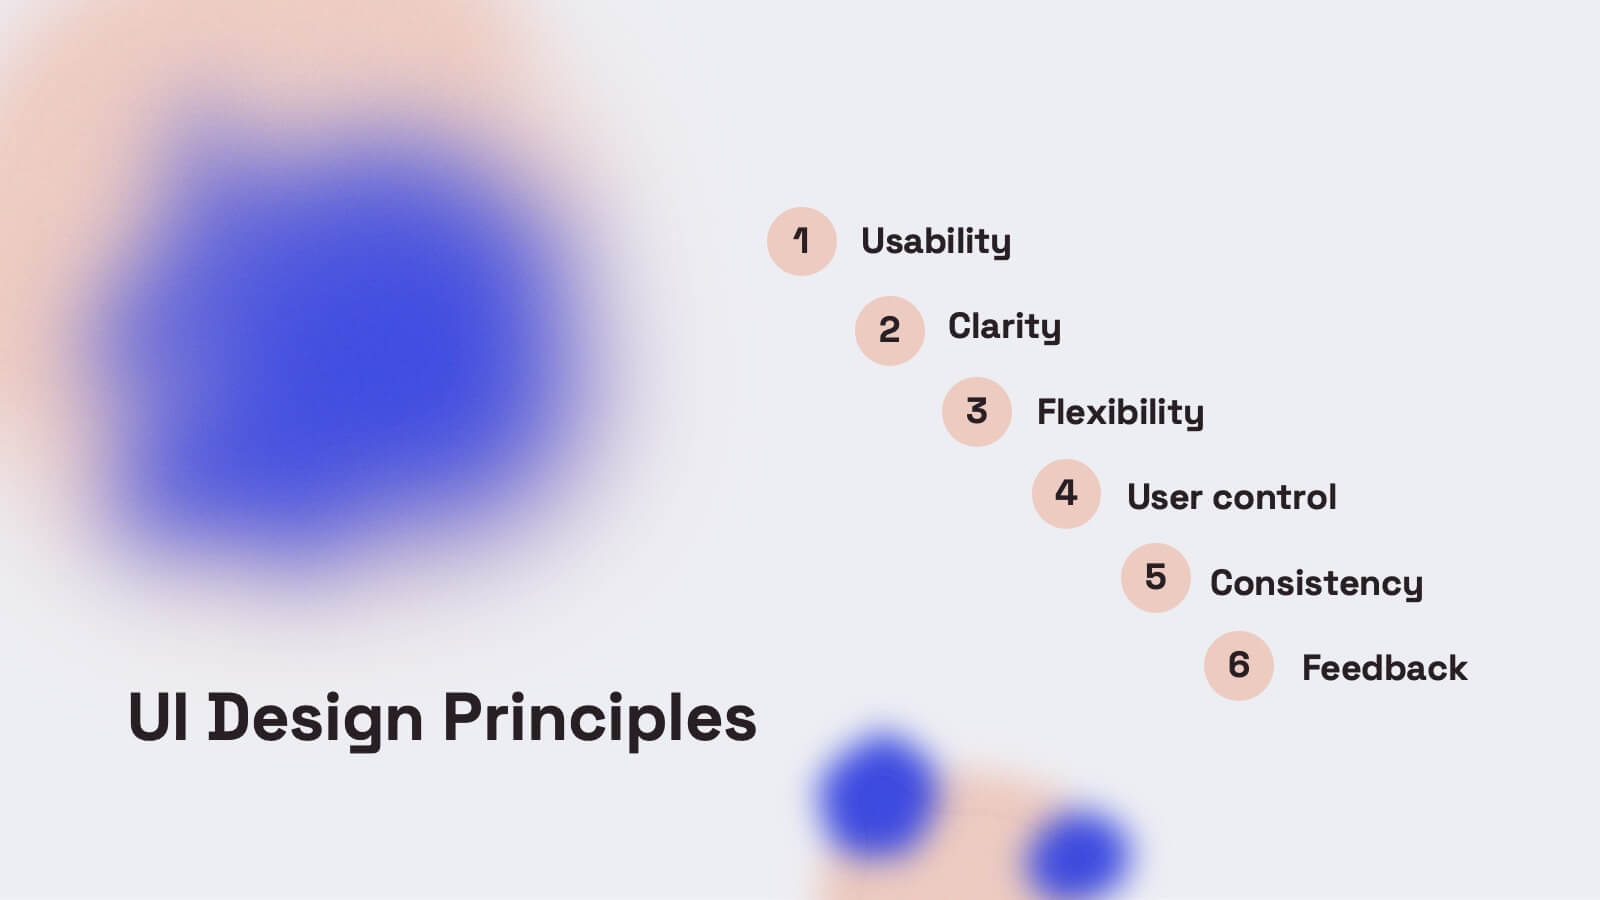
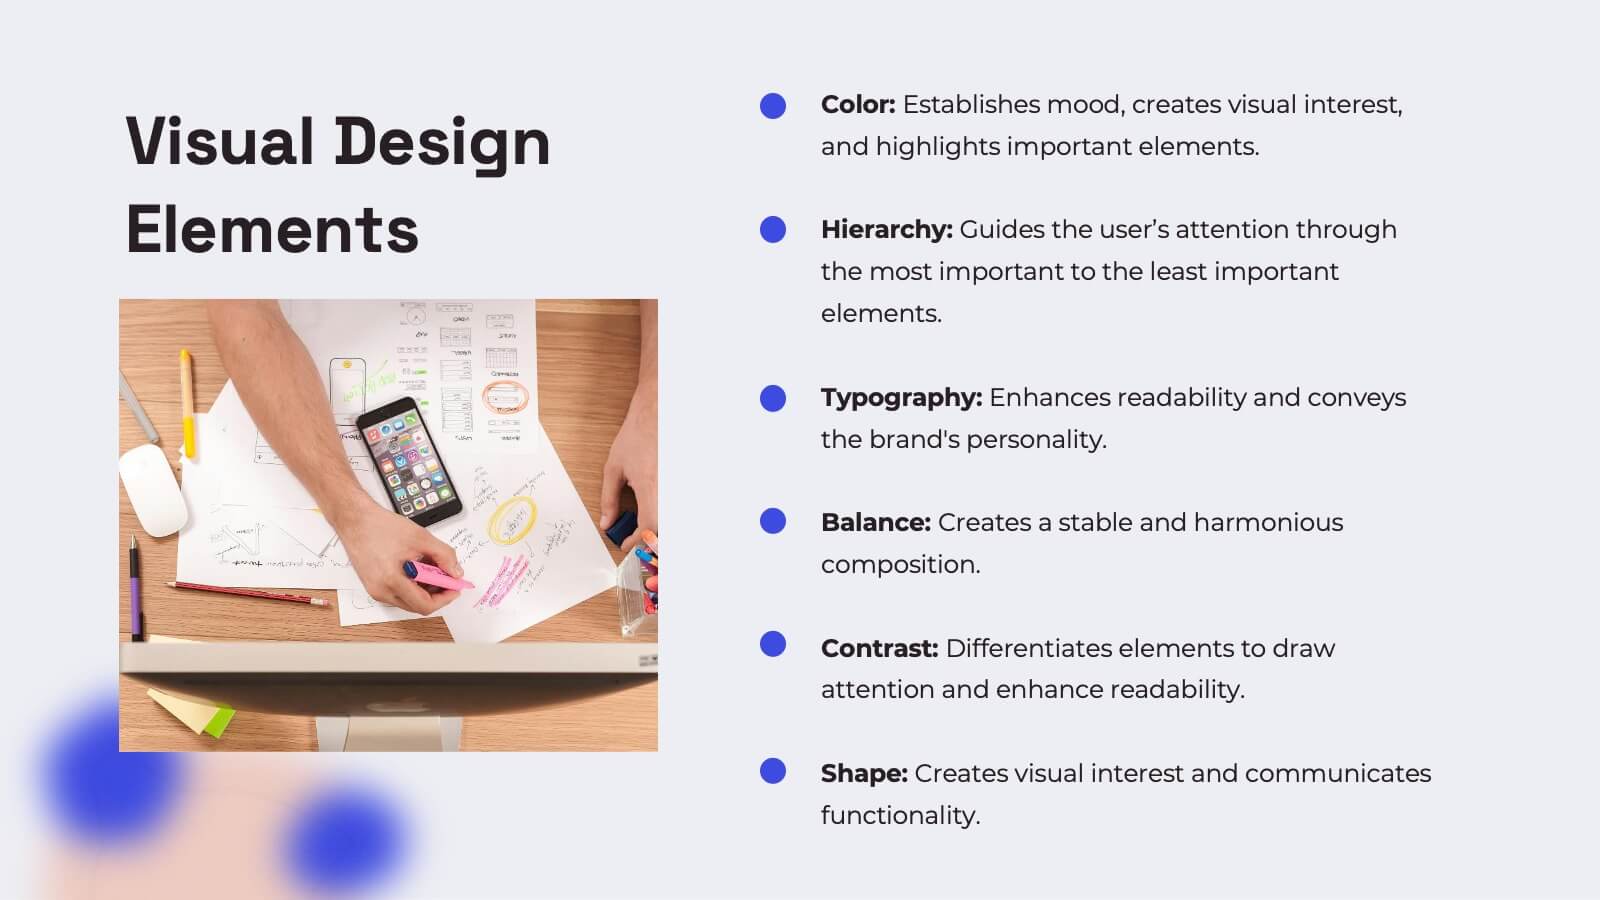
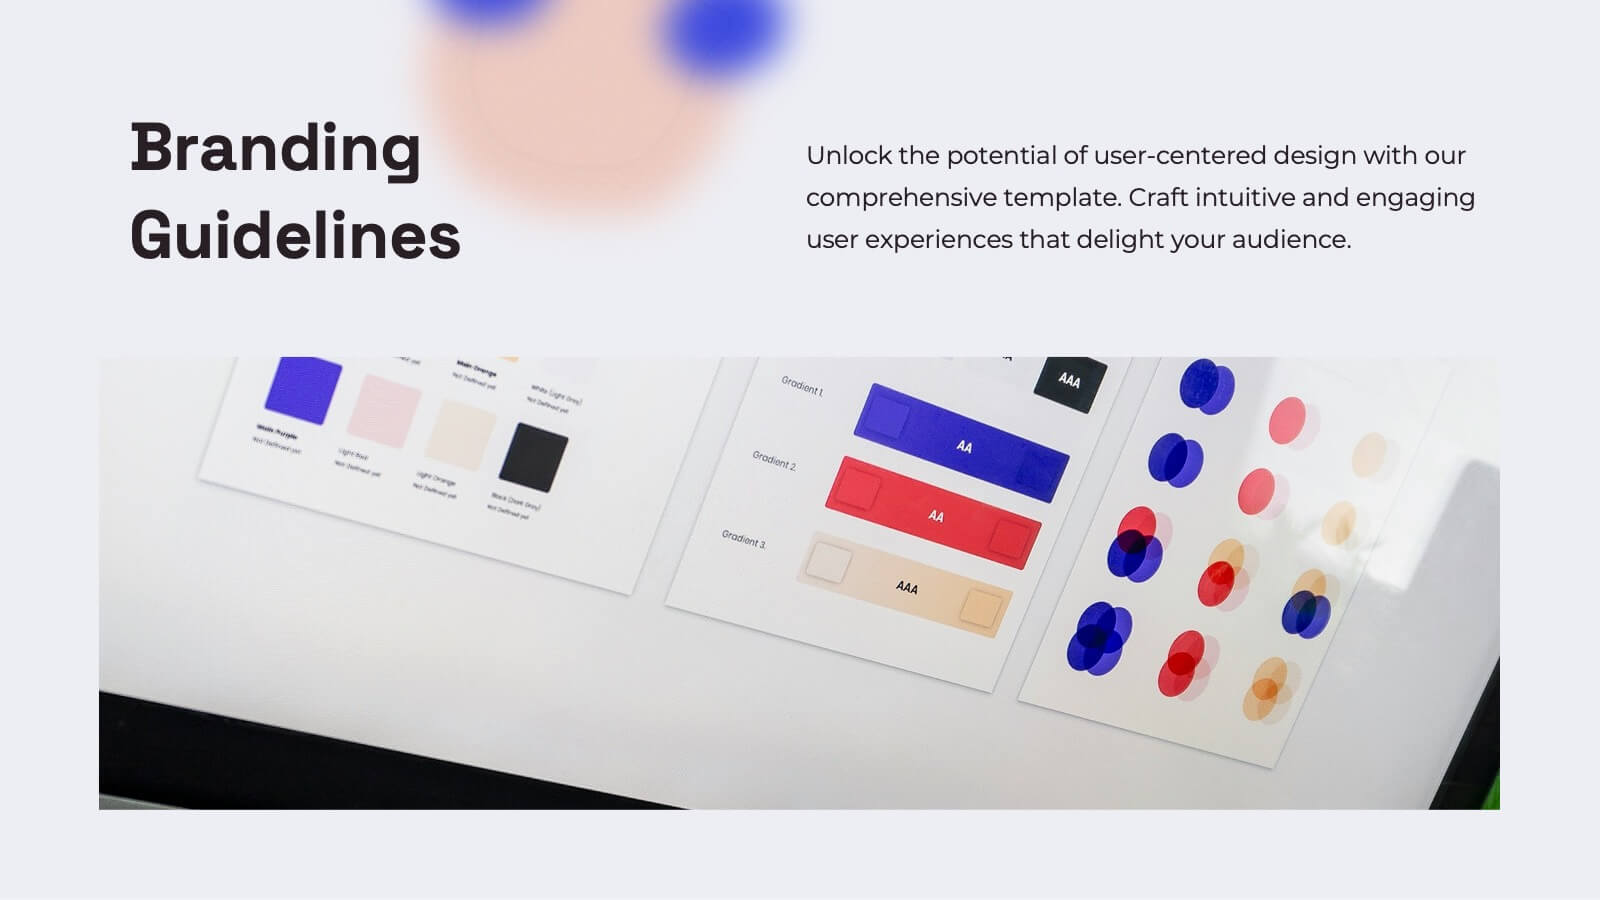
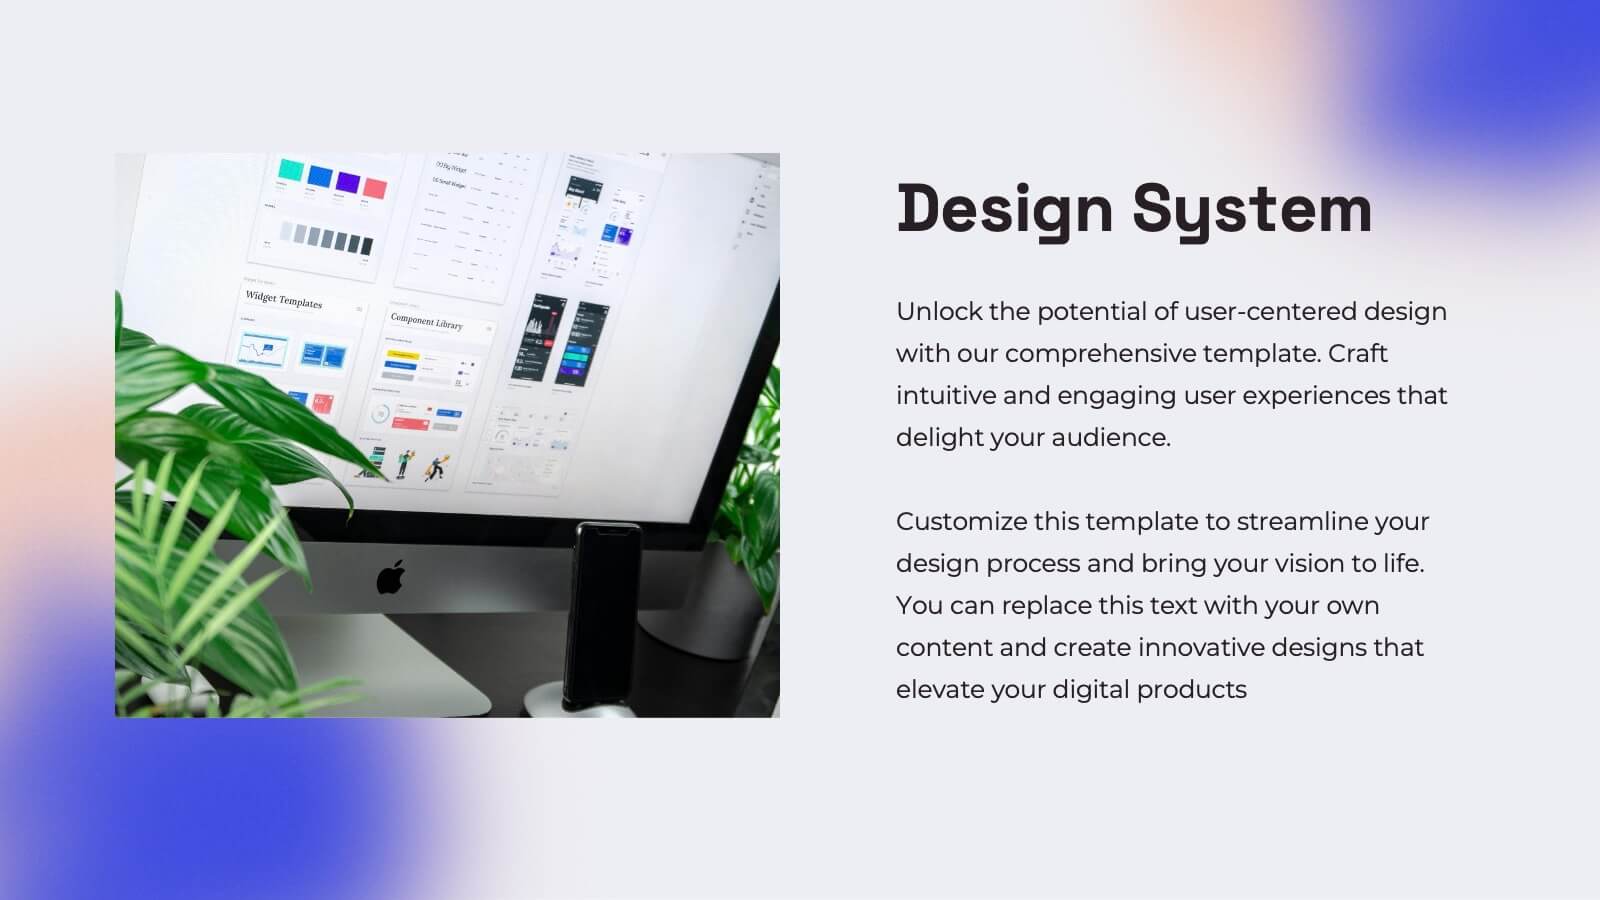
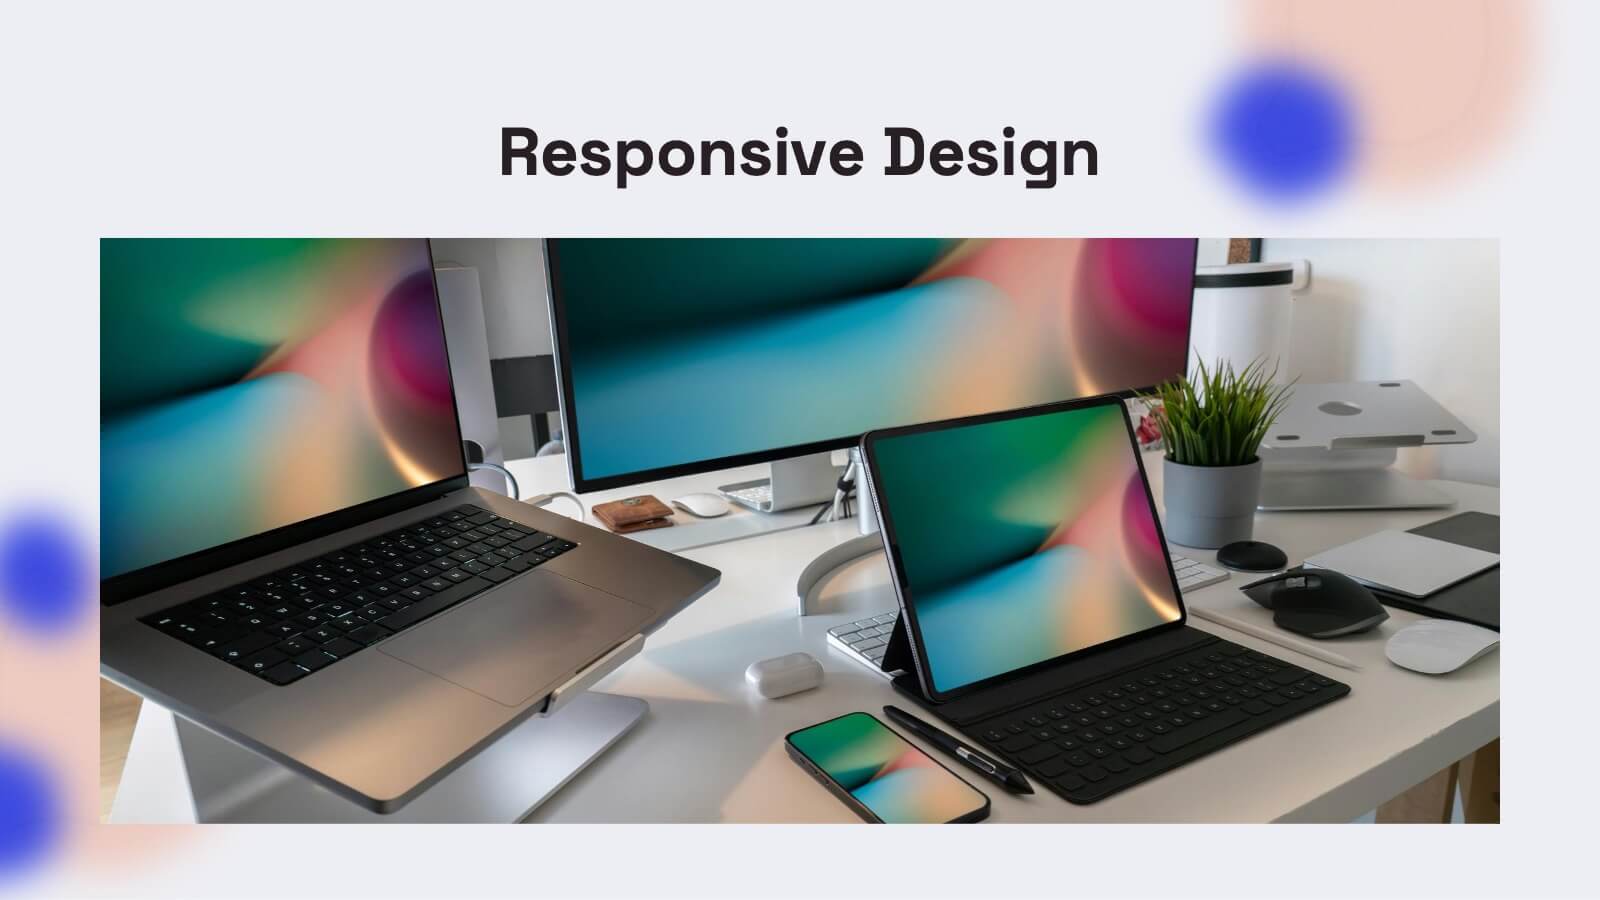
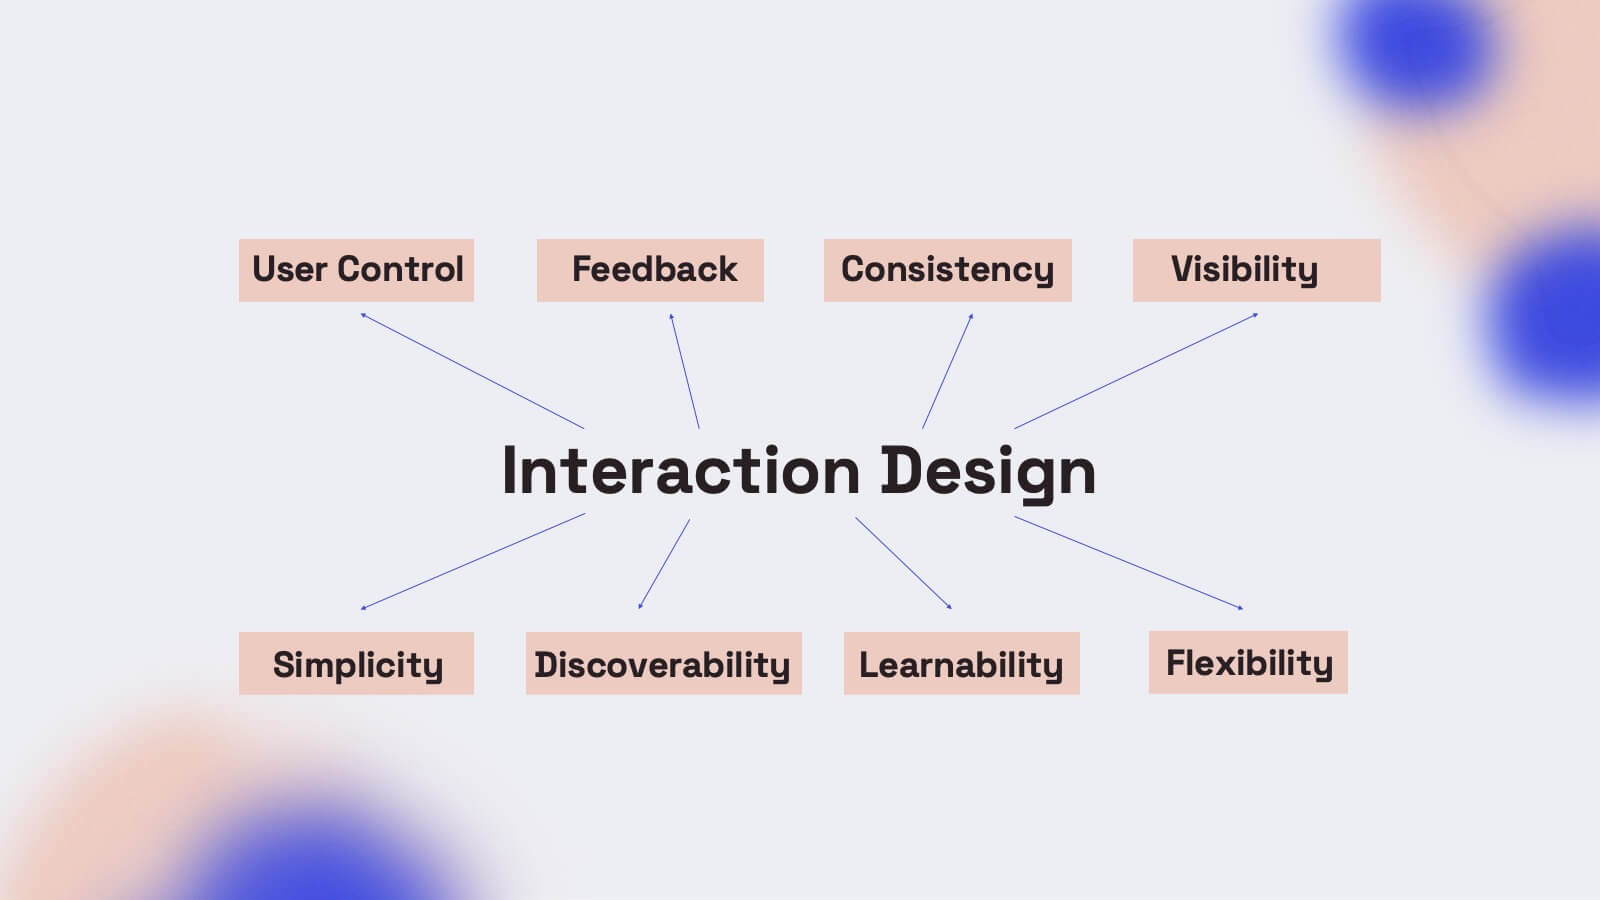
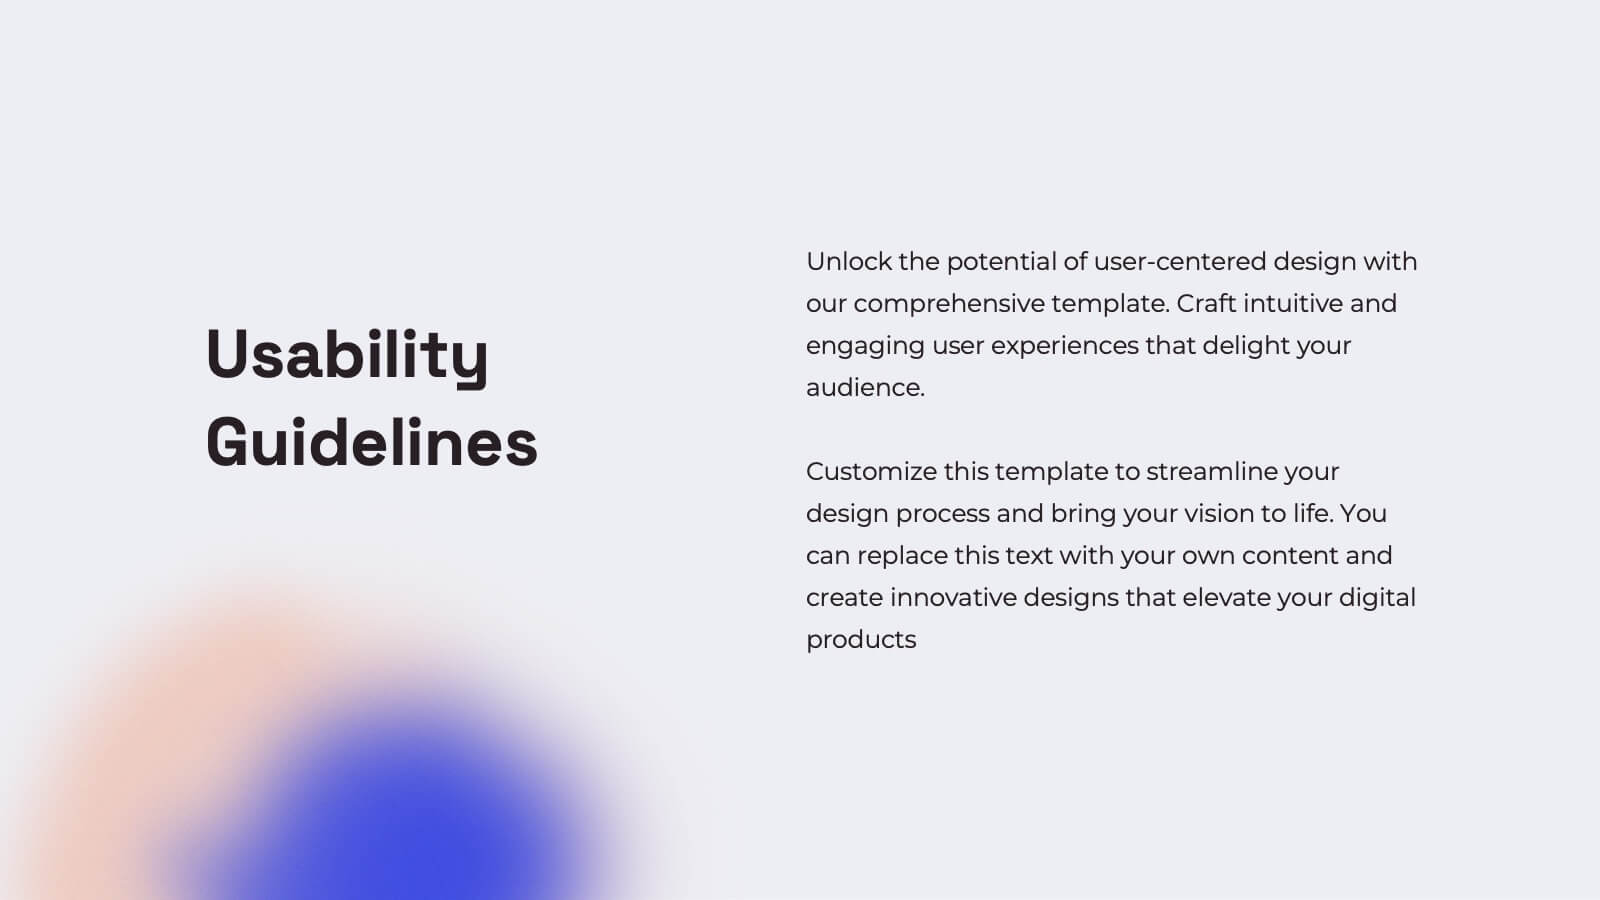
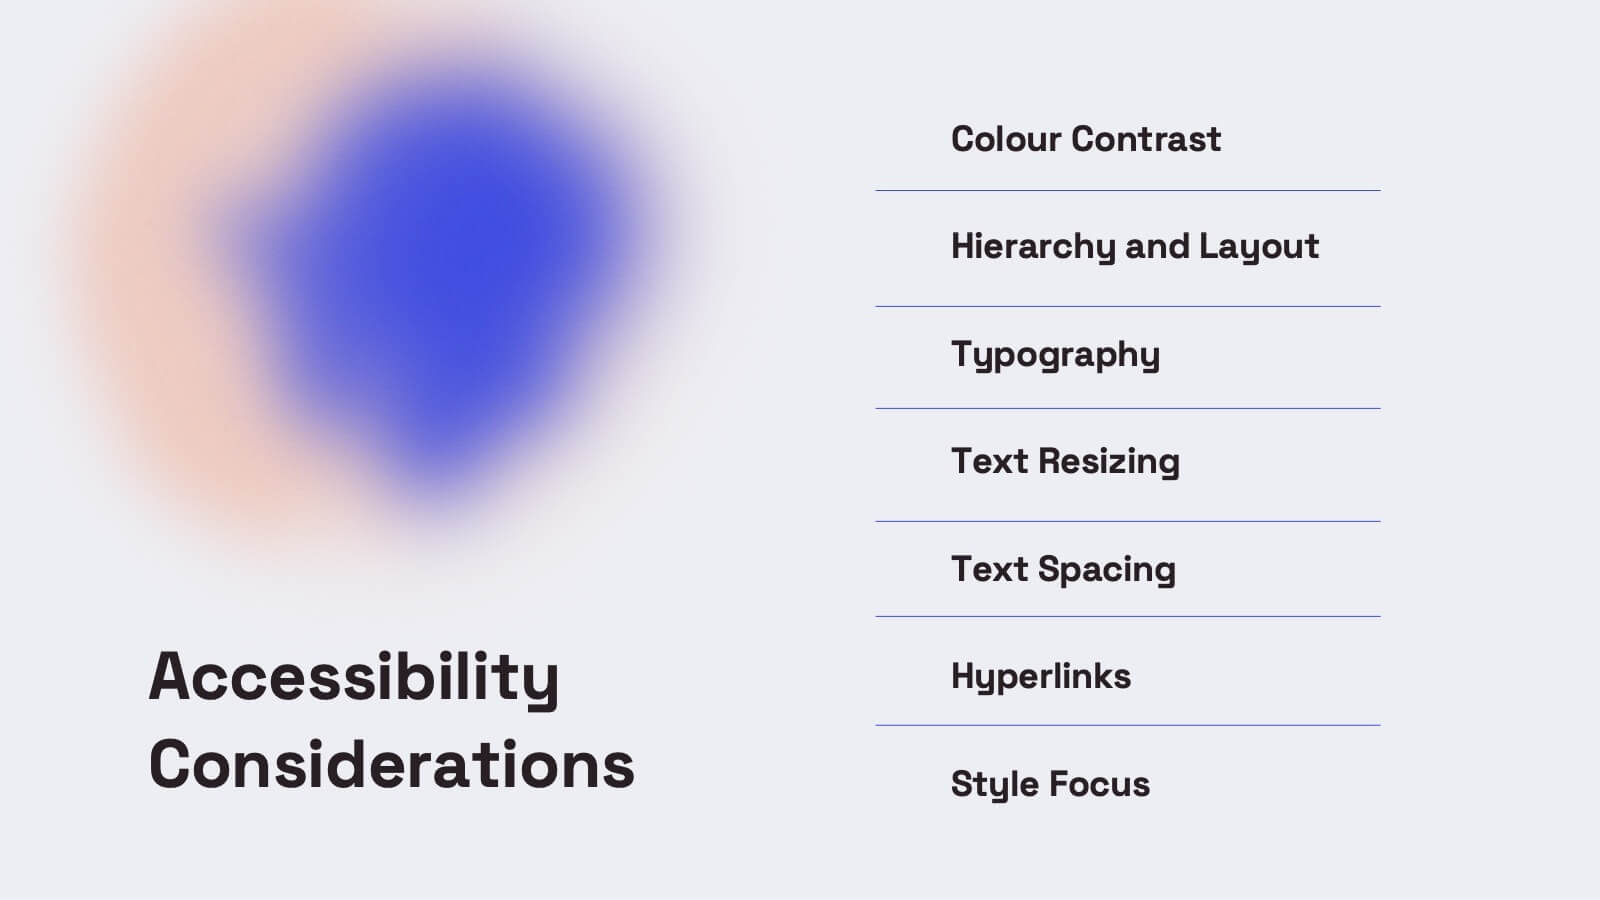
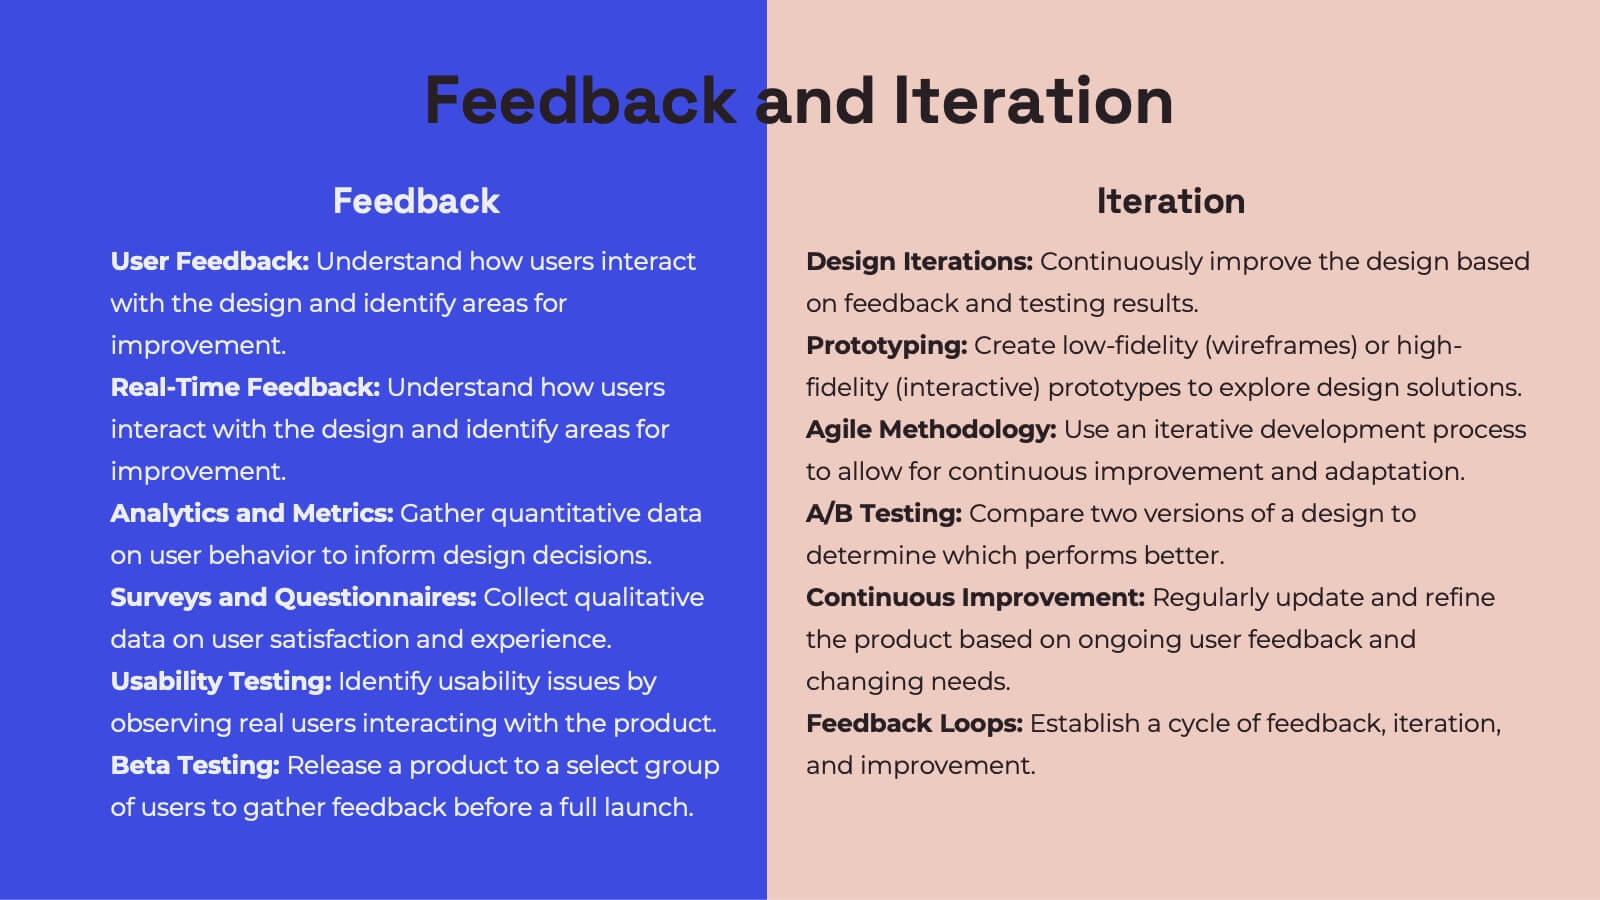
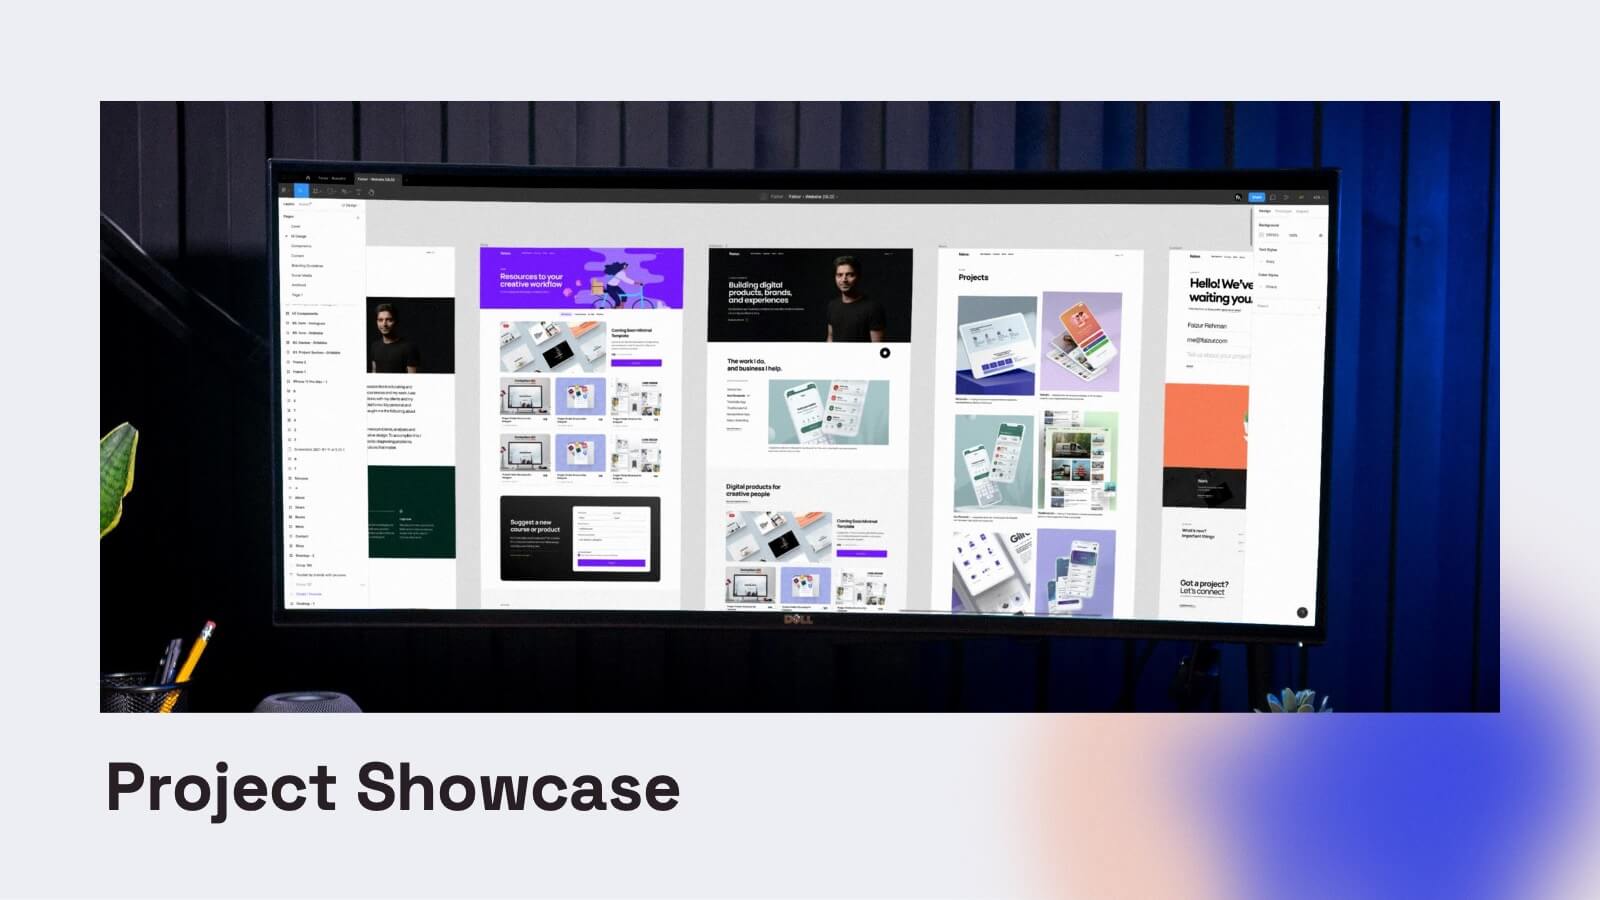
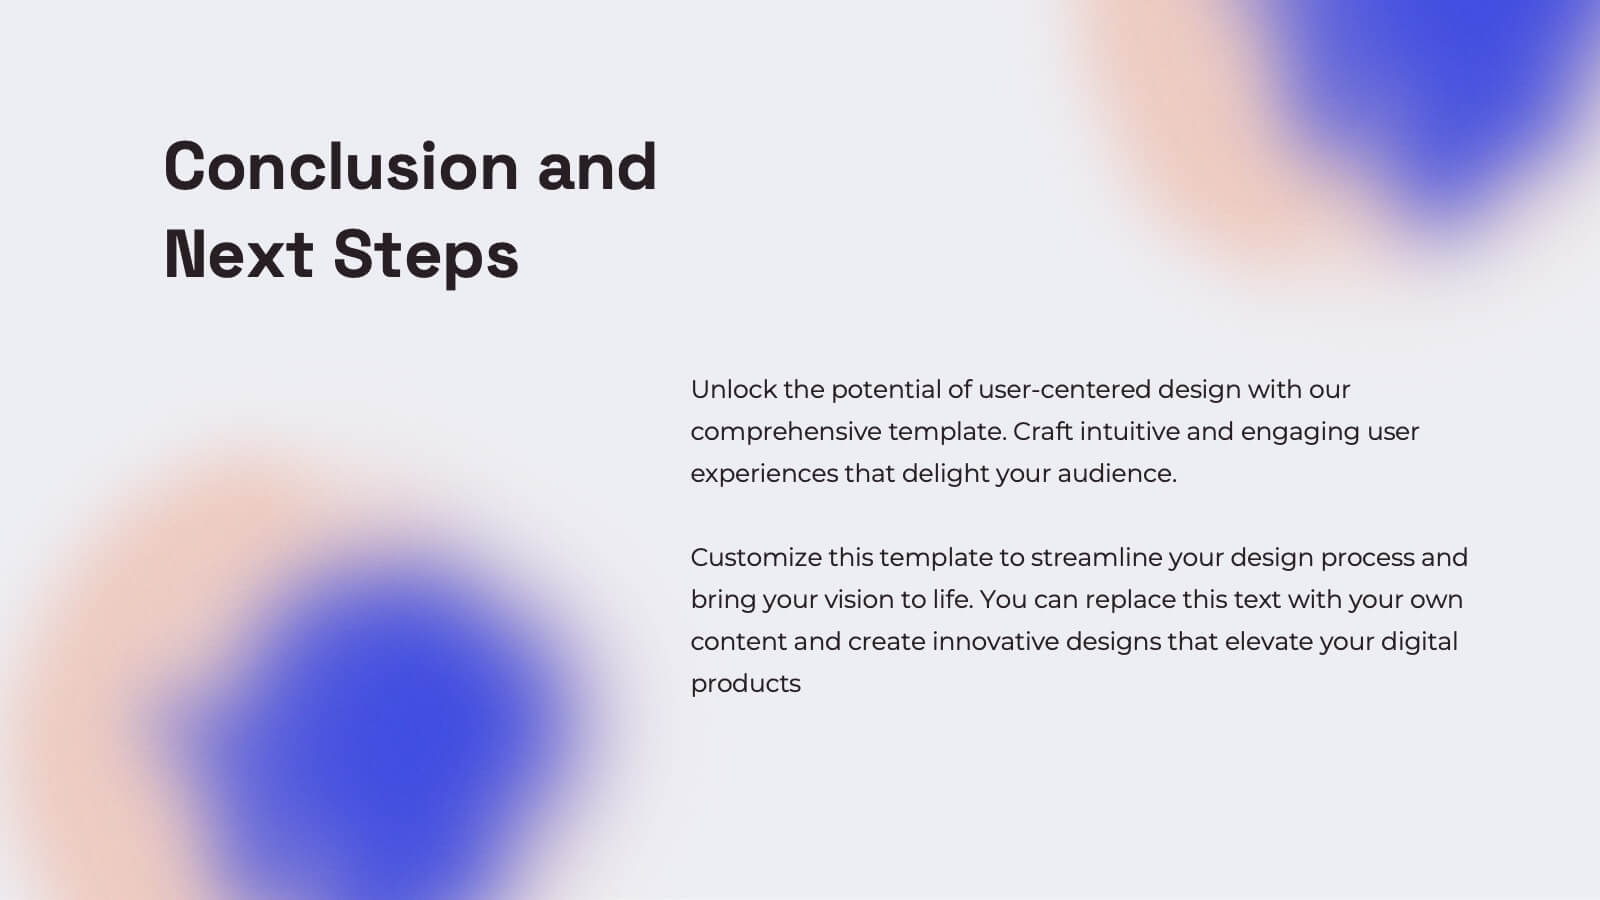
Gemini UX Design Presentation
Enhance your UX presentations with this vibrant and user-friendly template. Designed to cover every aspect of UX design, from user research and personas to wireframes and prototyping, this template ensures a comprehensive and engaging delivery. Its modern design and structured layout make your insights clear and impactful. Compatible with PowerPoint, Keynote, and Google Slides, it's perfect for any platform.


5 diapositivas
Video Games History Infographics
The history of video games is a testament to the constant innovation and evolution of technology. These vertical infographics are visually captivating and informative designs that allow you to showcase the evolution and milestones of the video game industry. This template is perfect for presentations, educational materials, or any content related to video game history. Compatible with PowerPoint, Keynote, and Google Slides. This template features a combination of text, icons, illustrations, and vibrant colors to captivate your audience and present information in a visually appealing way. This is a powerful tool for showcasing the impact of the video game industry.


6 diapositivas
Business Flow Chart Design Presentation
Bring clarity and momentum to your process with a clean, visual layout that turns complex steps into an easy-to-follow flow. This presentation helps teams map stages, responsibilities, and progress with confidence, making it perfect for planning, strategy, and operations. Fully compatible with PowerPoint, Keynote, and Google Slides.


7 diapositivas
Venn Diagram Statistics Infographic Presentation
Venn diagrams are important because they show relationships between two or more ideas. The circles—either filled in with color or left empty—create a picture of how things relate to one another, while arrows show which things are overlapping. This template is easy to use and has a cool green color scheme that is easy on the eyes. It has a customizable layout to make your presentation unique! With this template, you can create awesome Venn Diagrams that will help you compare and contrast information in a way that is easy to understand. This is perfect for school projects or even work presentations.


5 diapositivas
Types of Agriculture Infographics
Agriculture encompasses a wide range of practices and techniques used for cultivating plants and raising animals for food, fiber, medicinal plants, and other products. These infographic templates explore the different types of agriculture practices and methods. This template is designed to provide a comprehensive overview of the various approaches to farming and cultivation, showcasing their characteristics, benefits, and applications. This template is ideal for presentations, reports, or educational materials related to agriculture, sustainable farming, or food production. Compatible with Powerpoint, Keynote, and Google Slides.

21 diapositivas
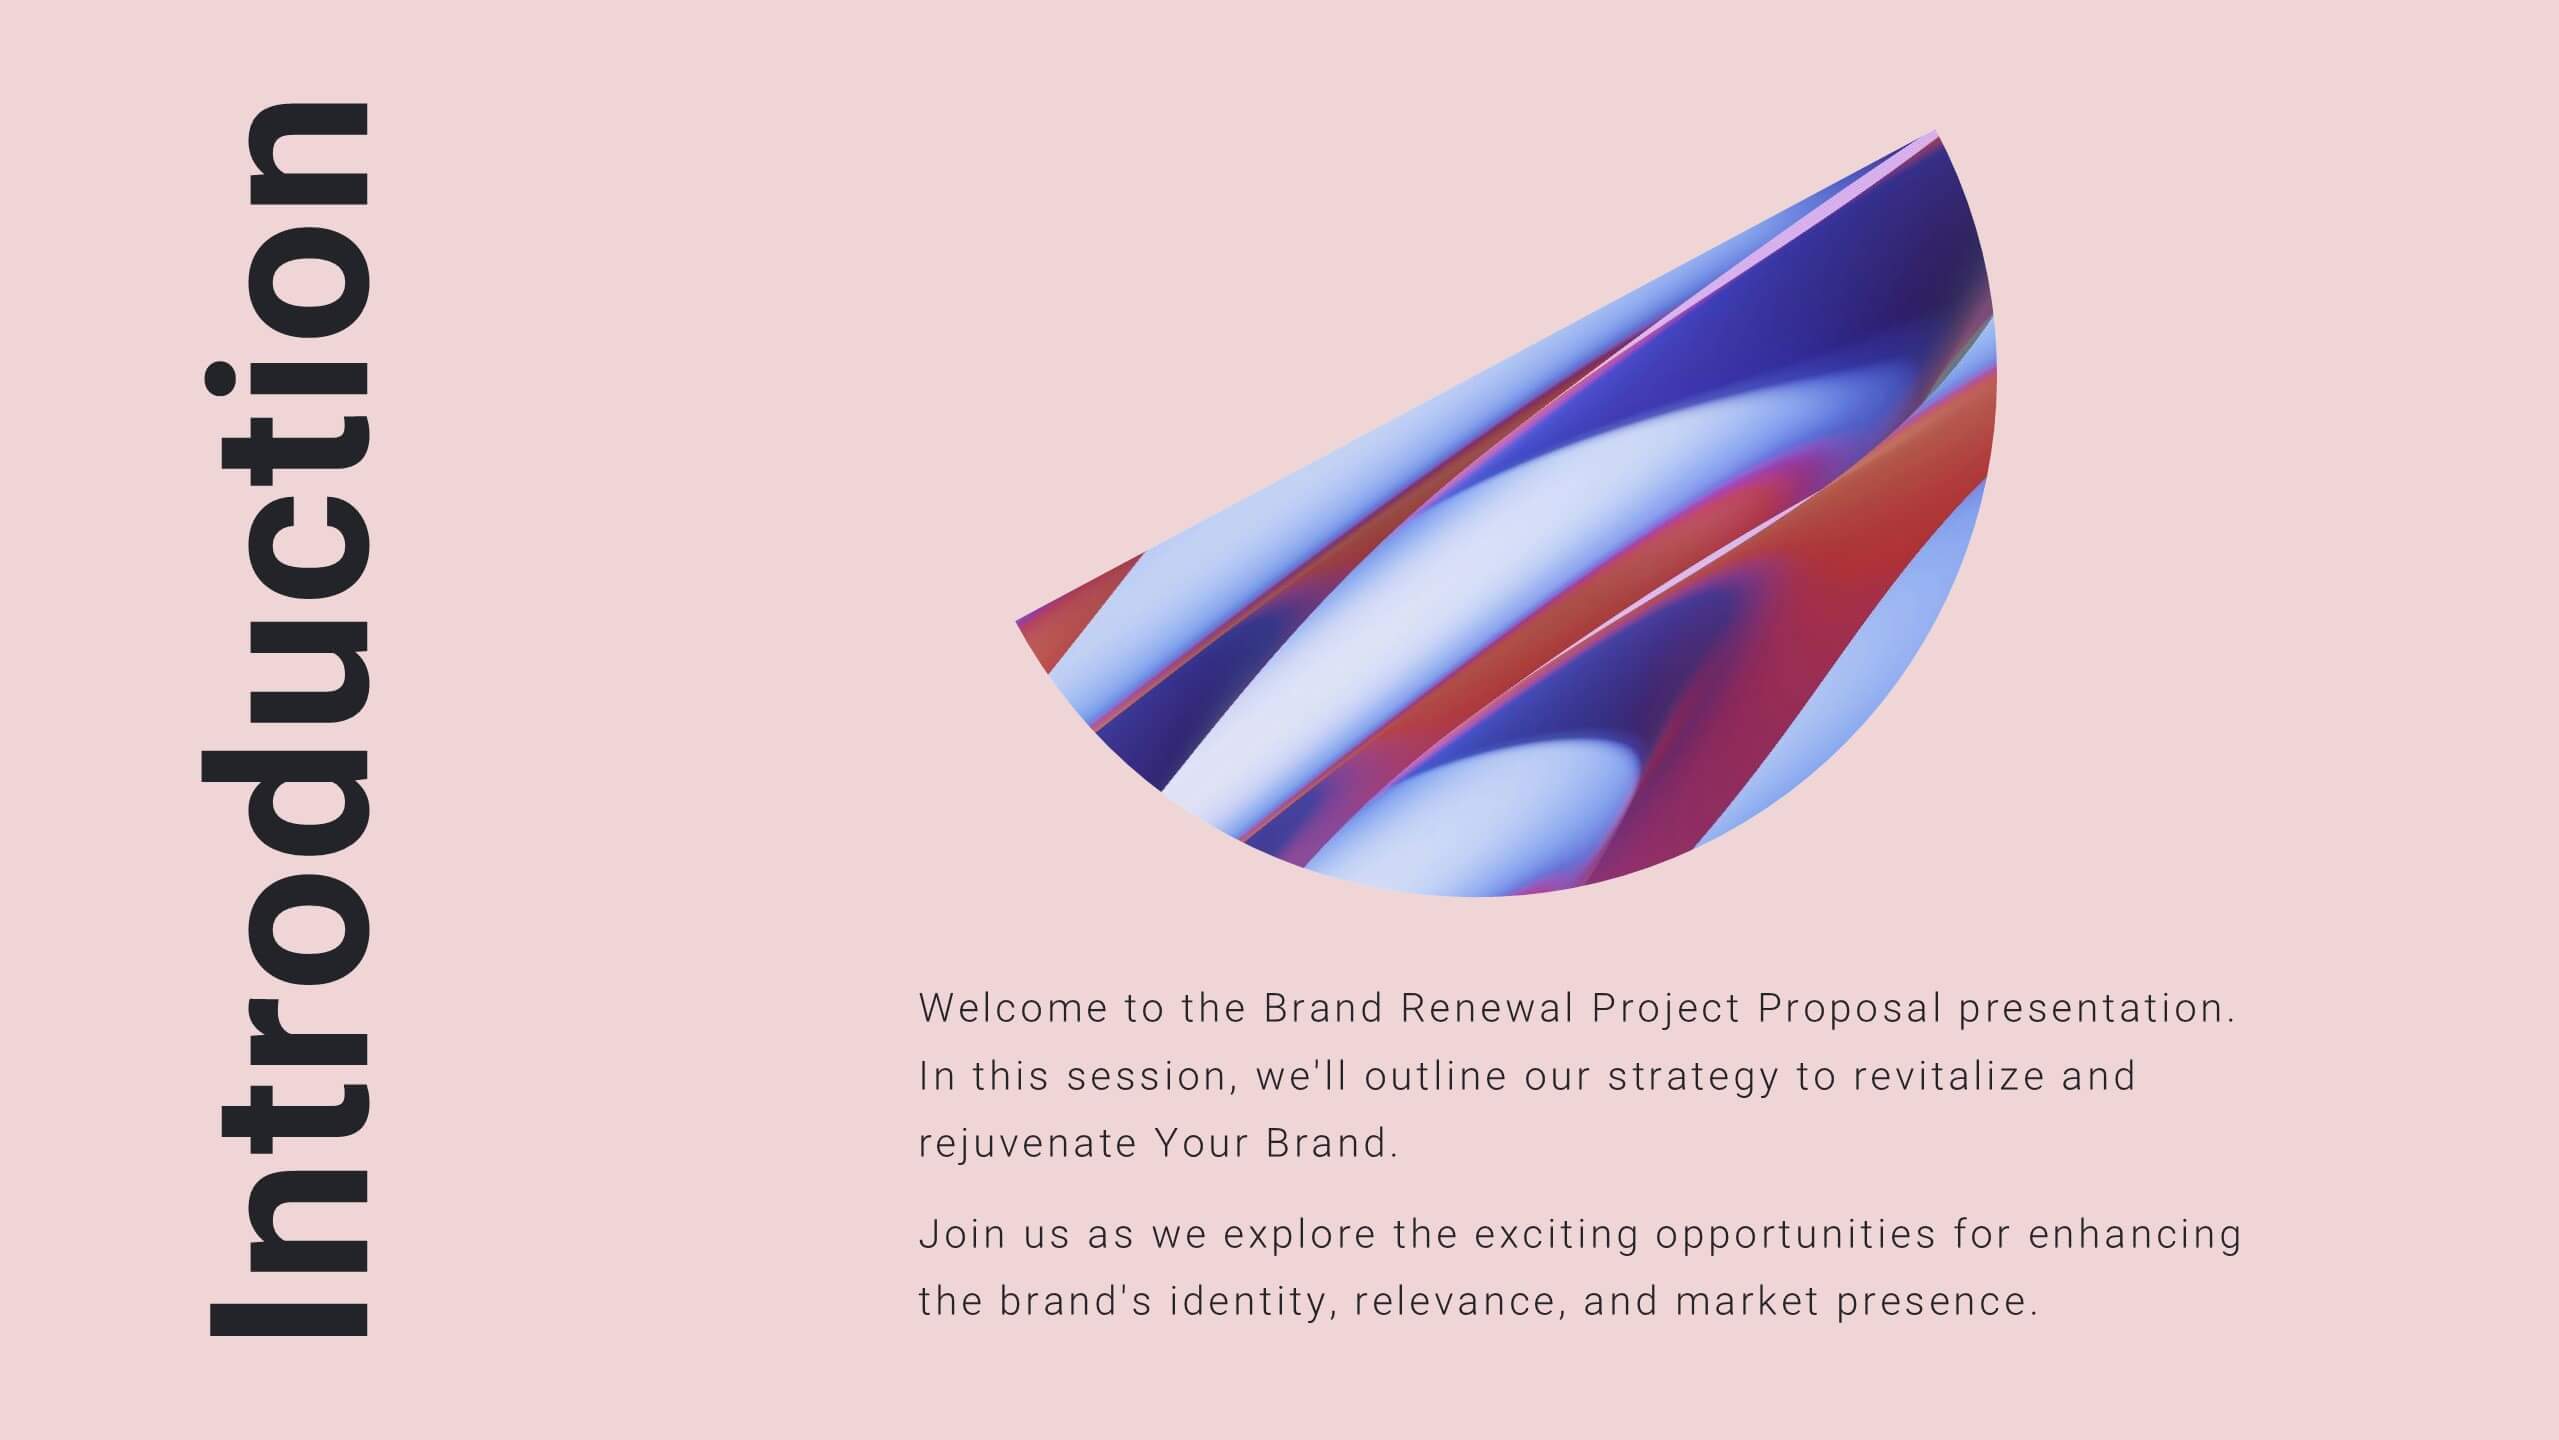
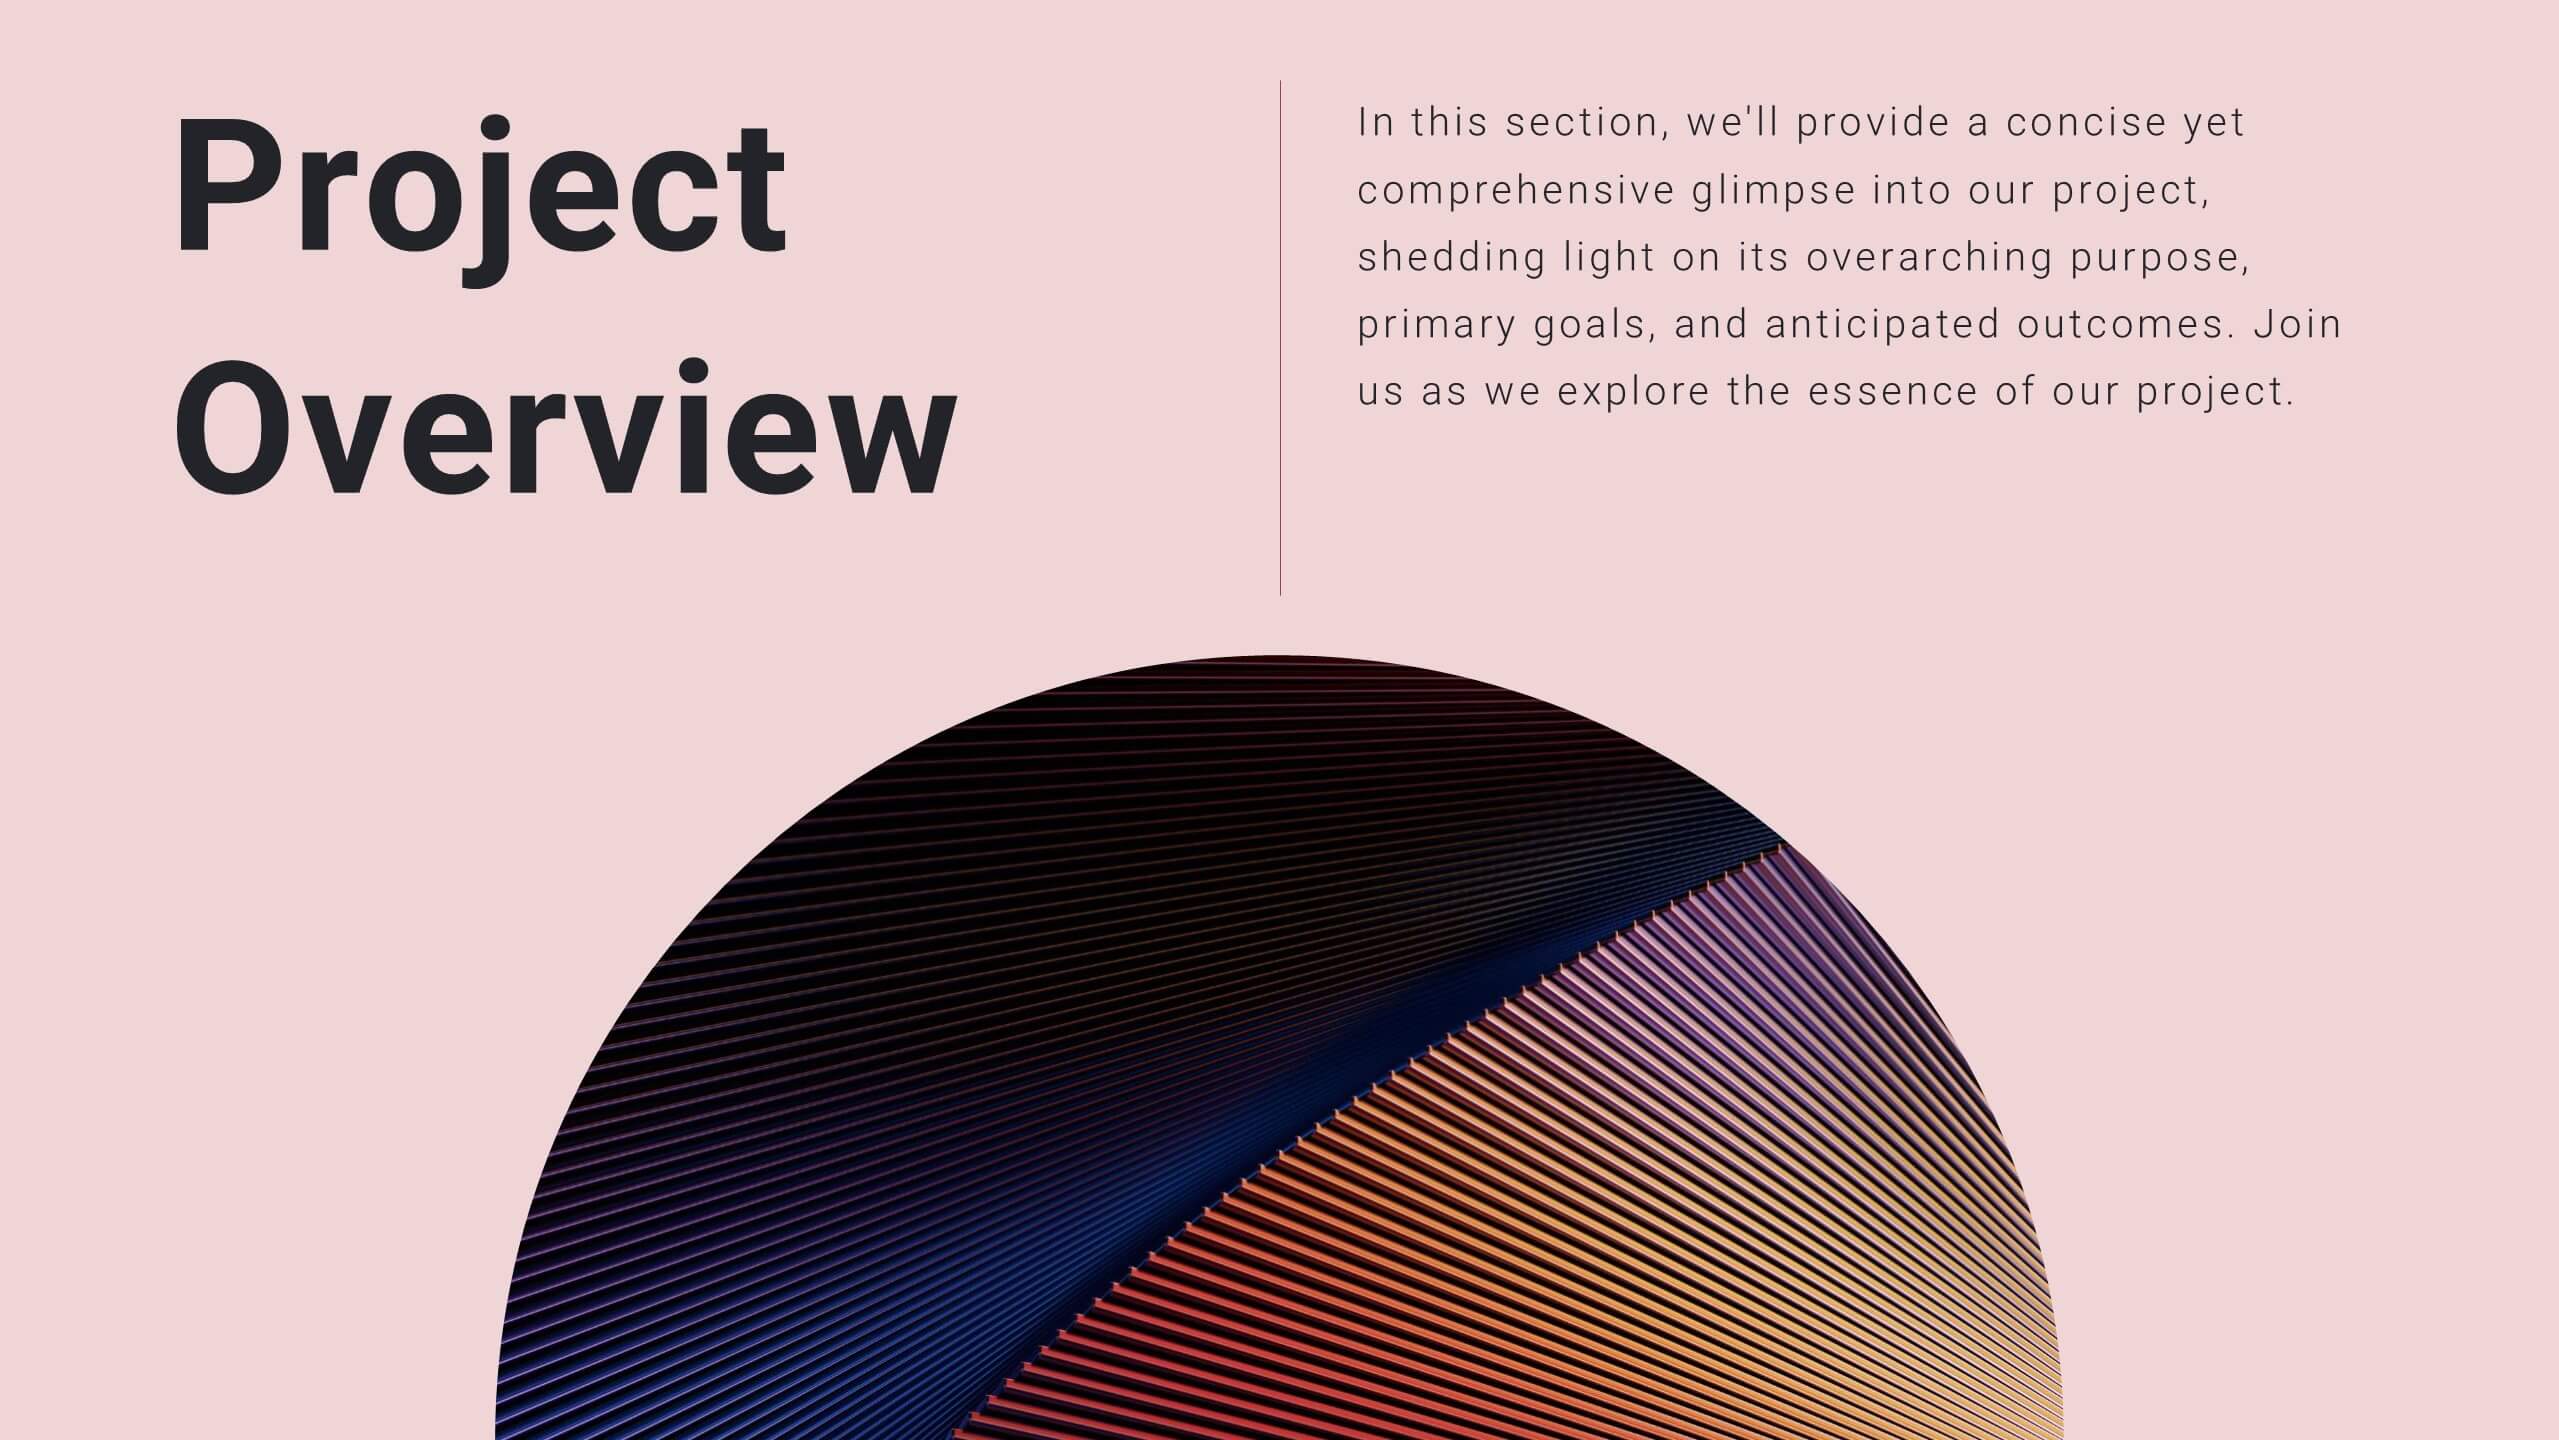
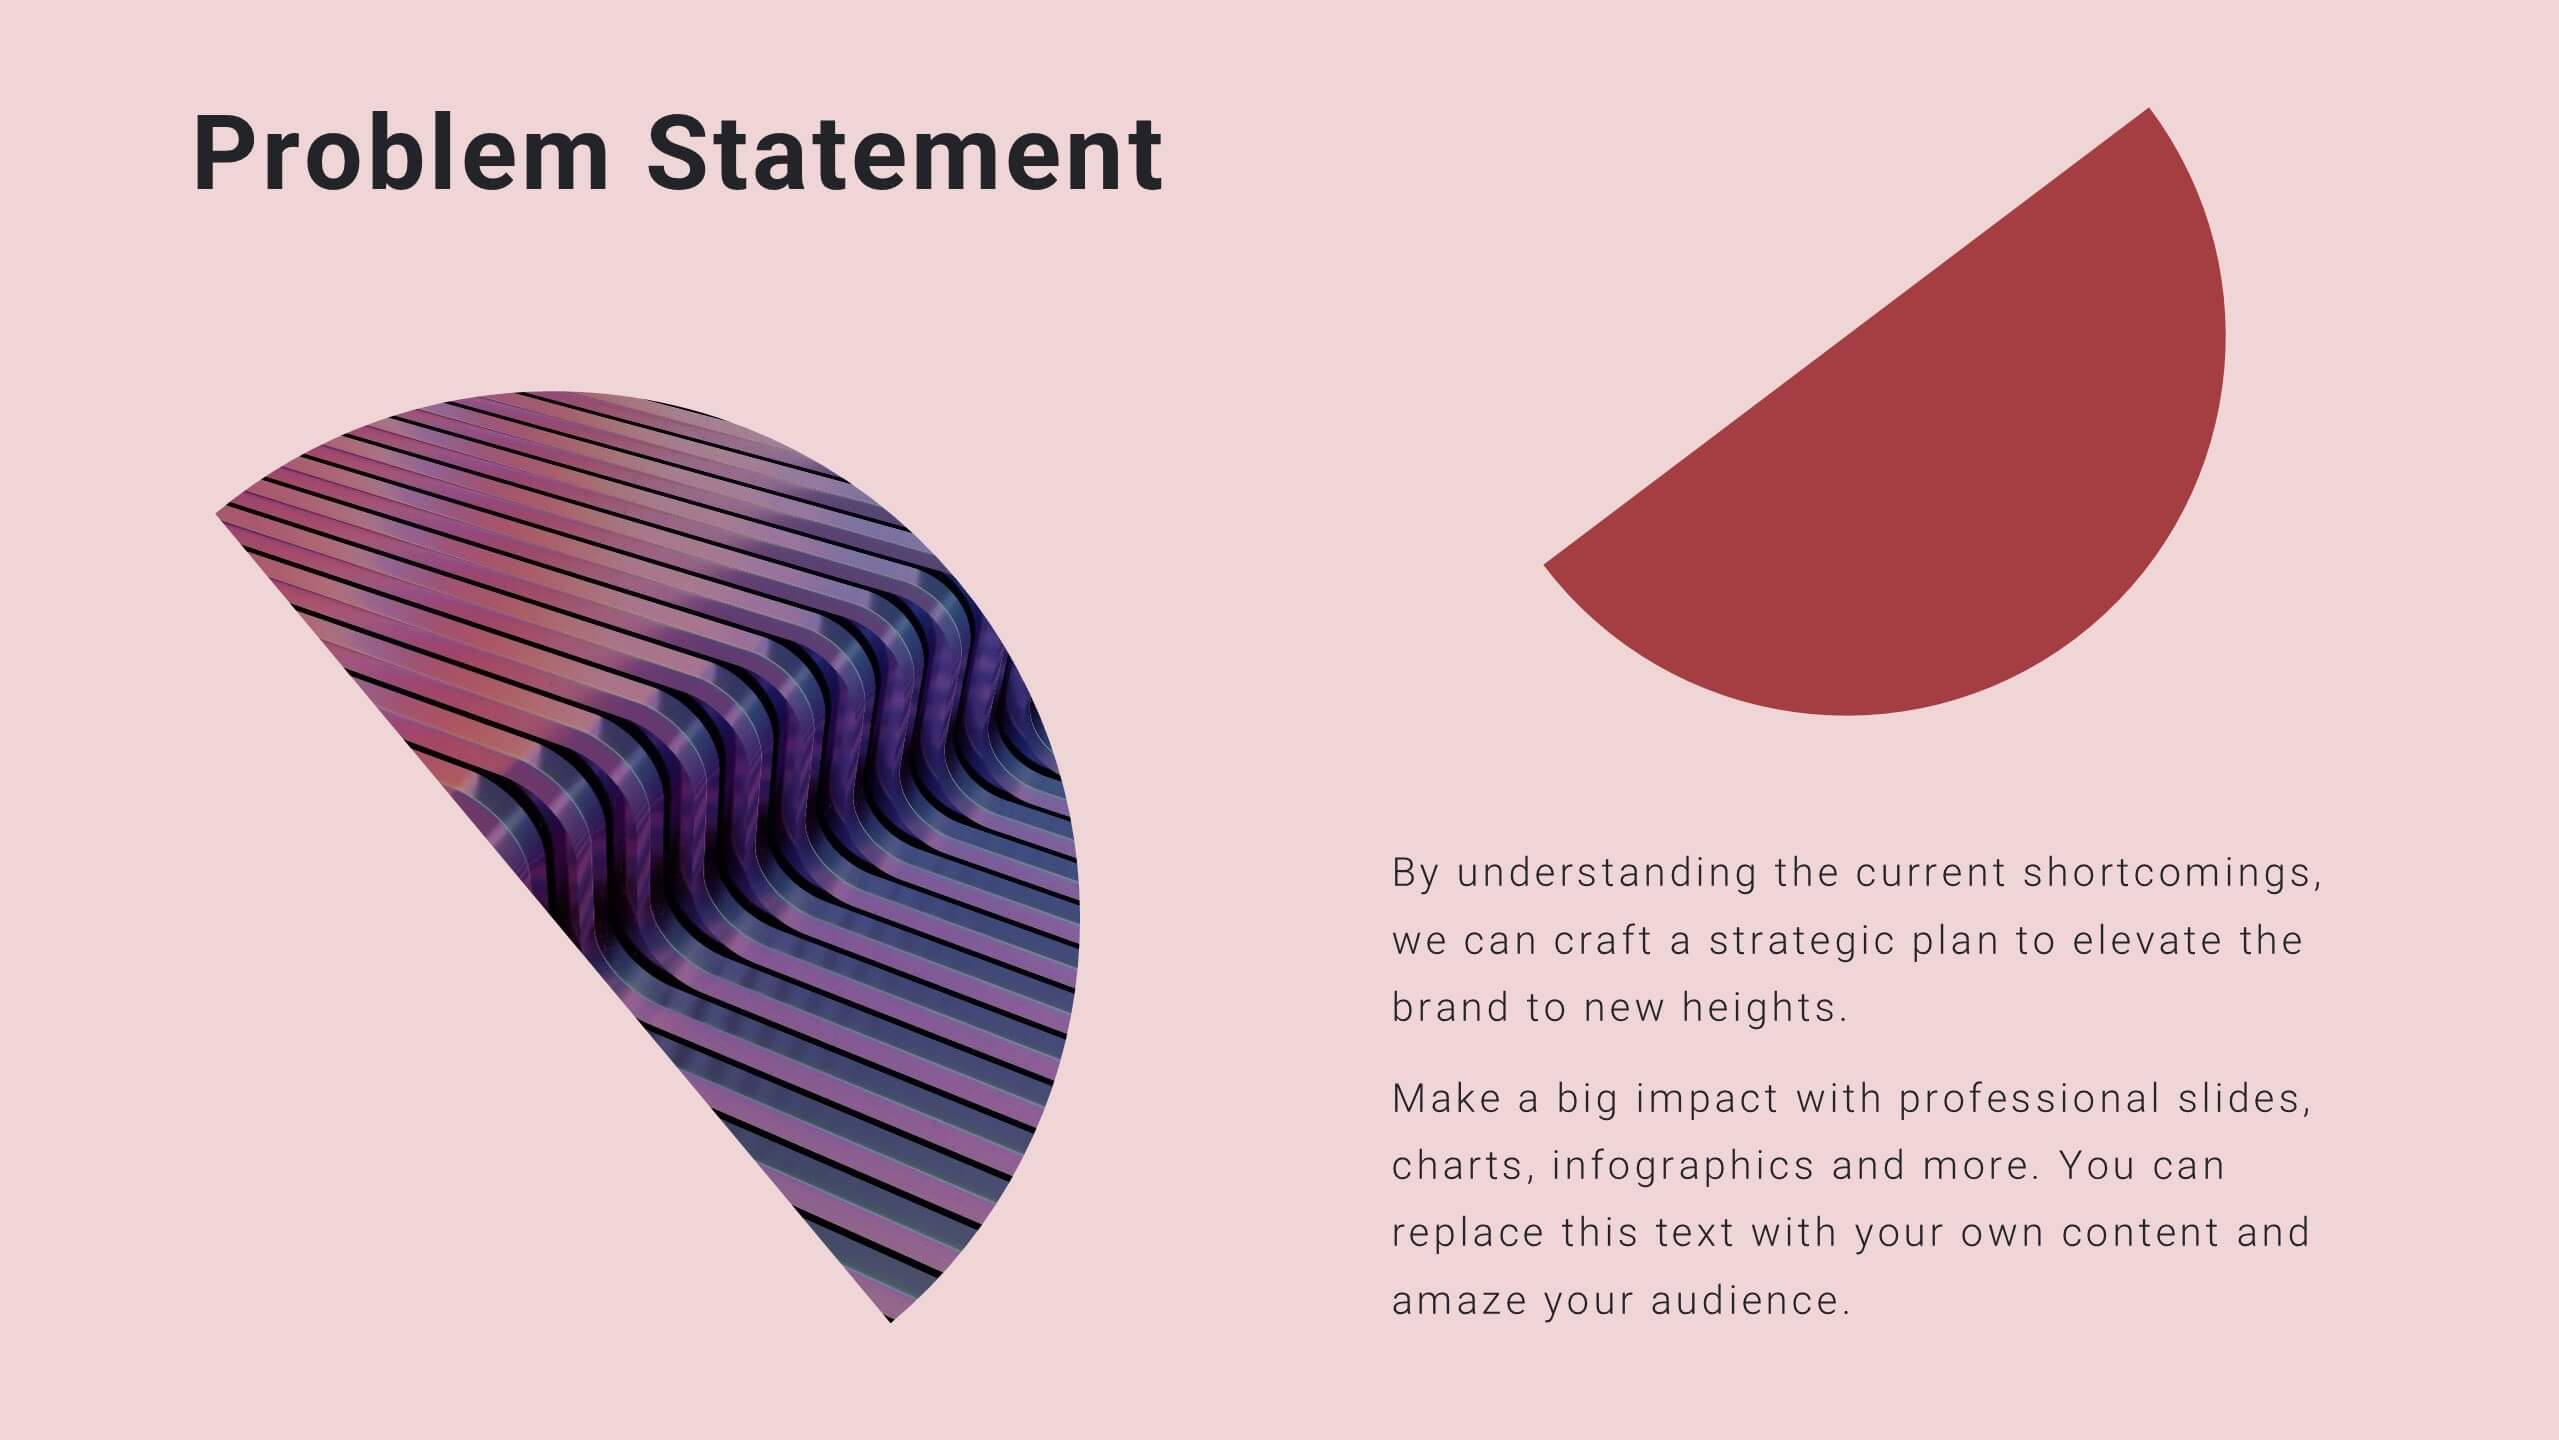
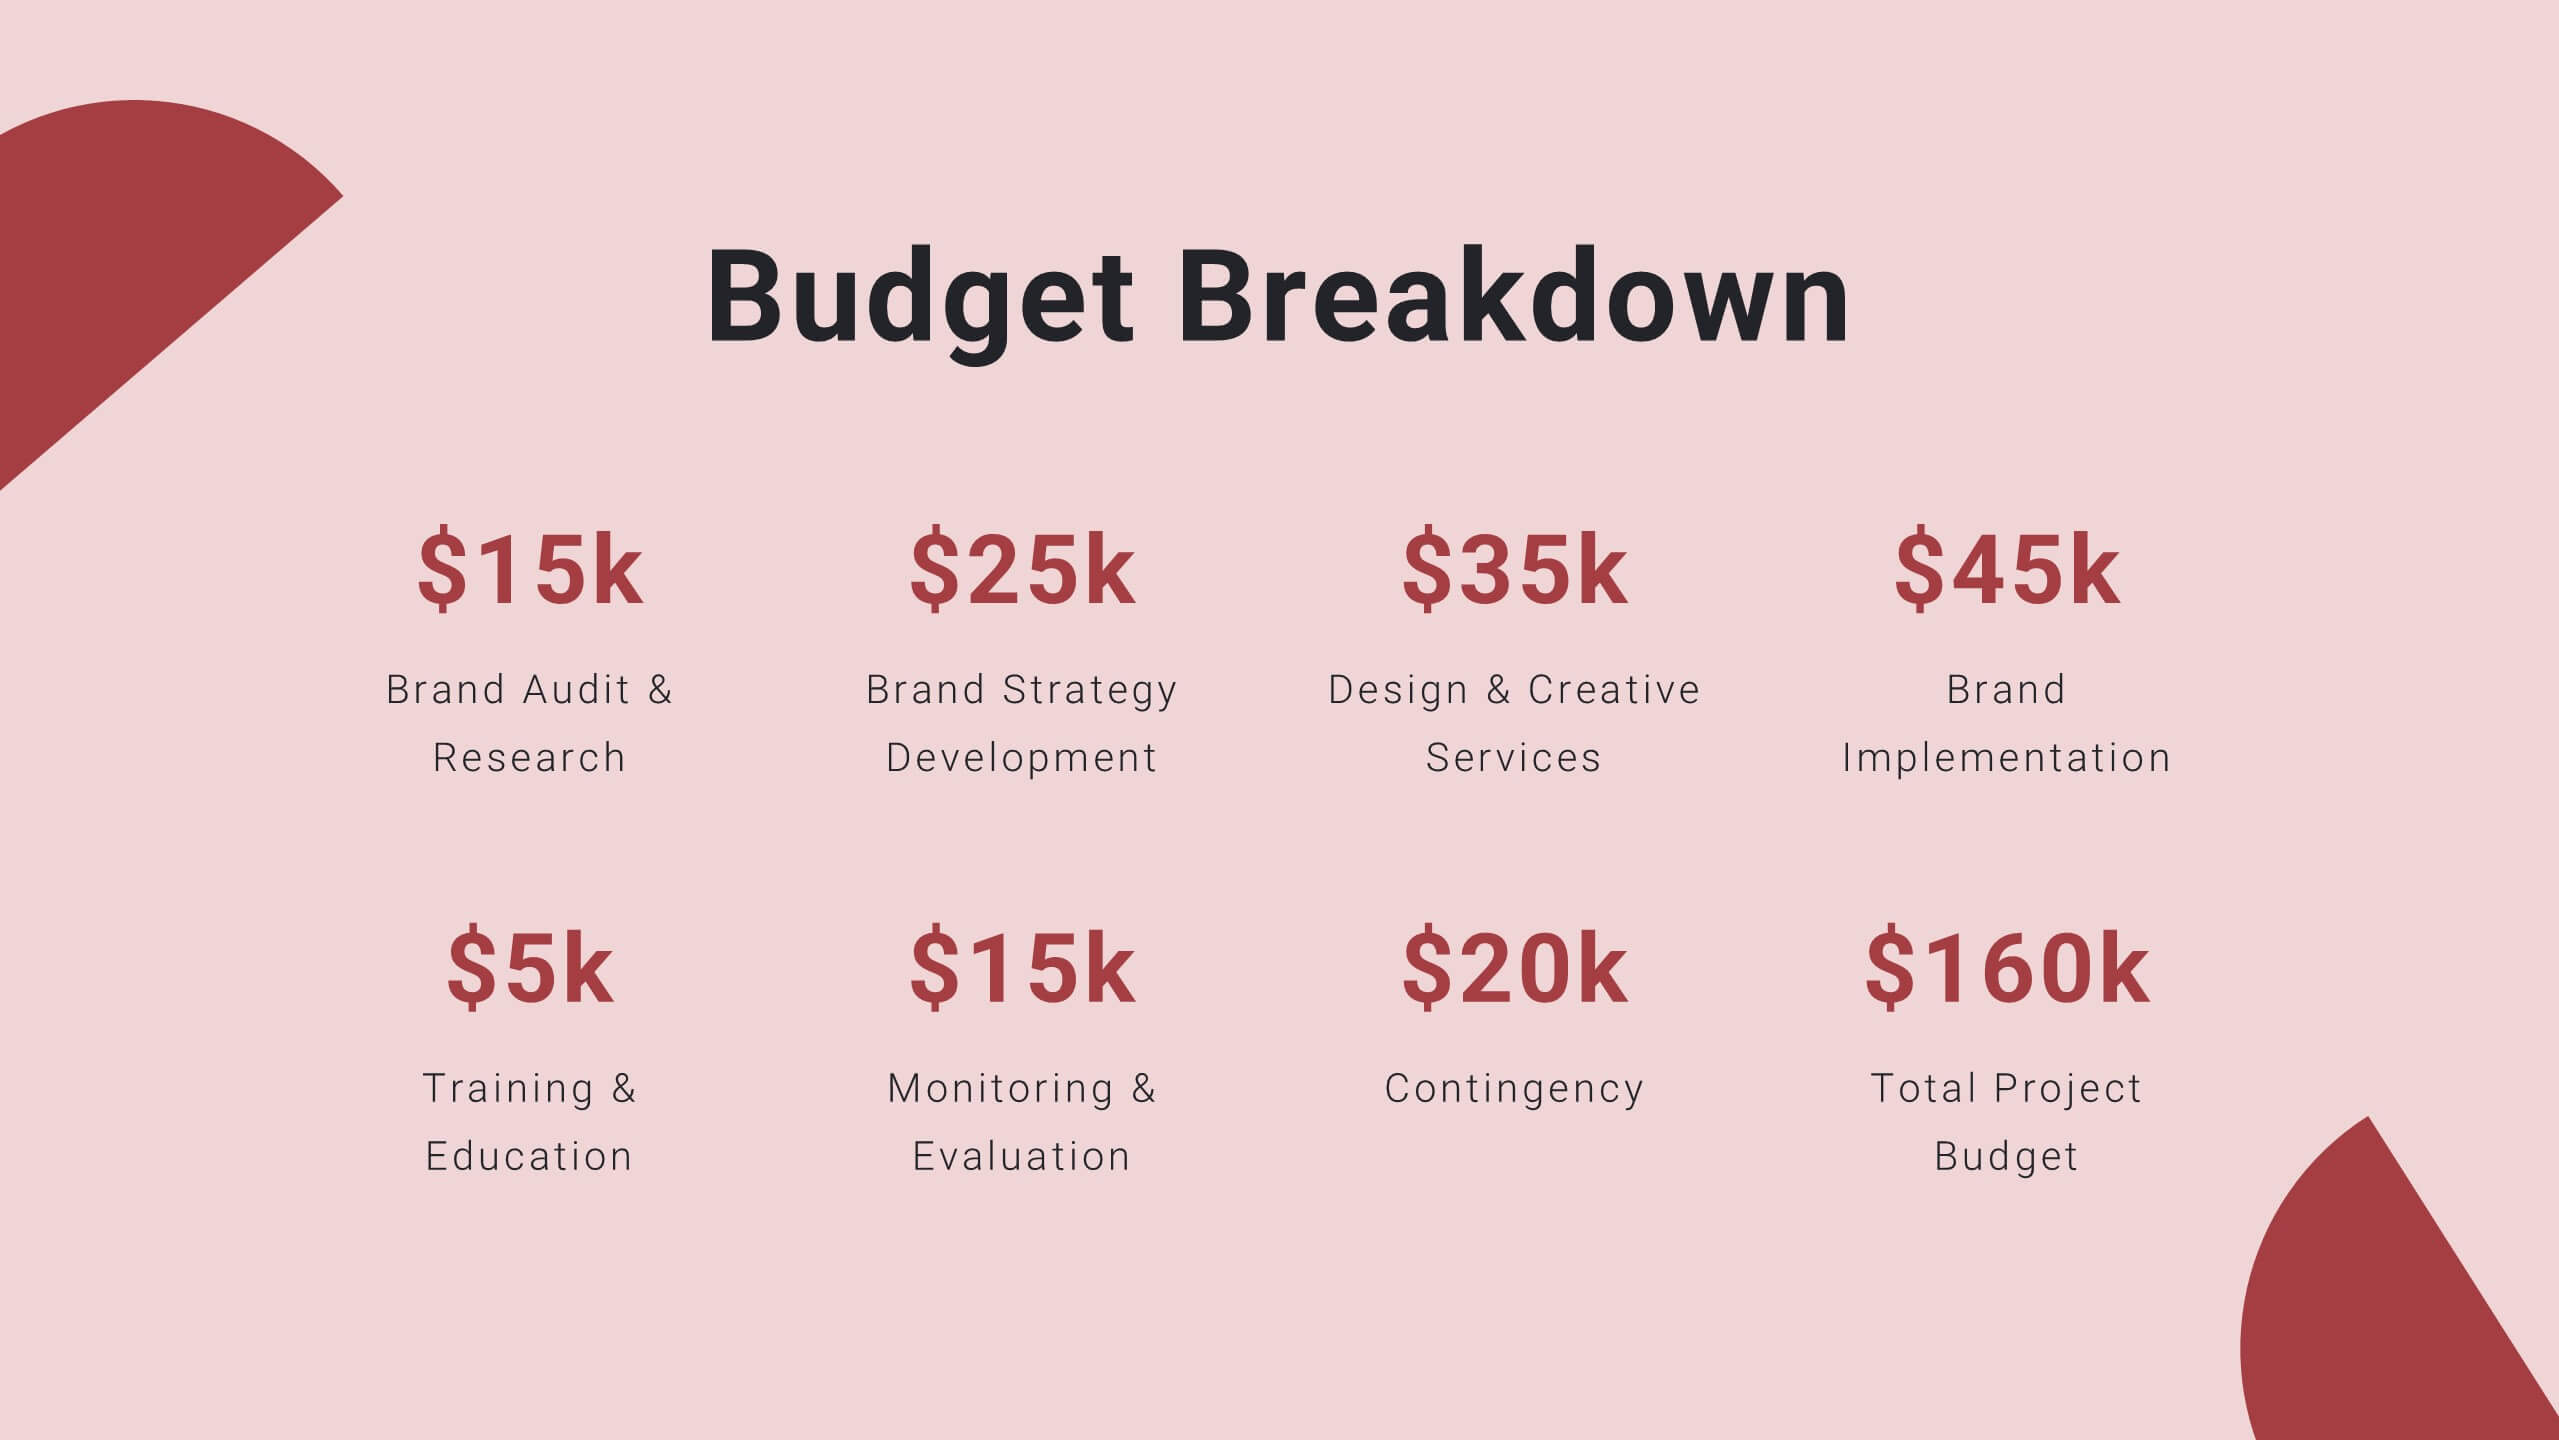
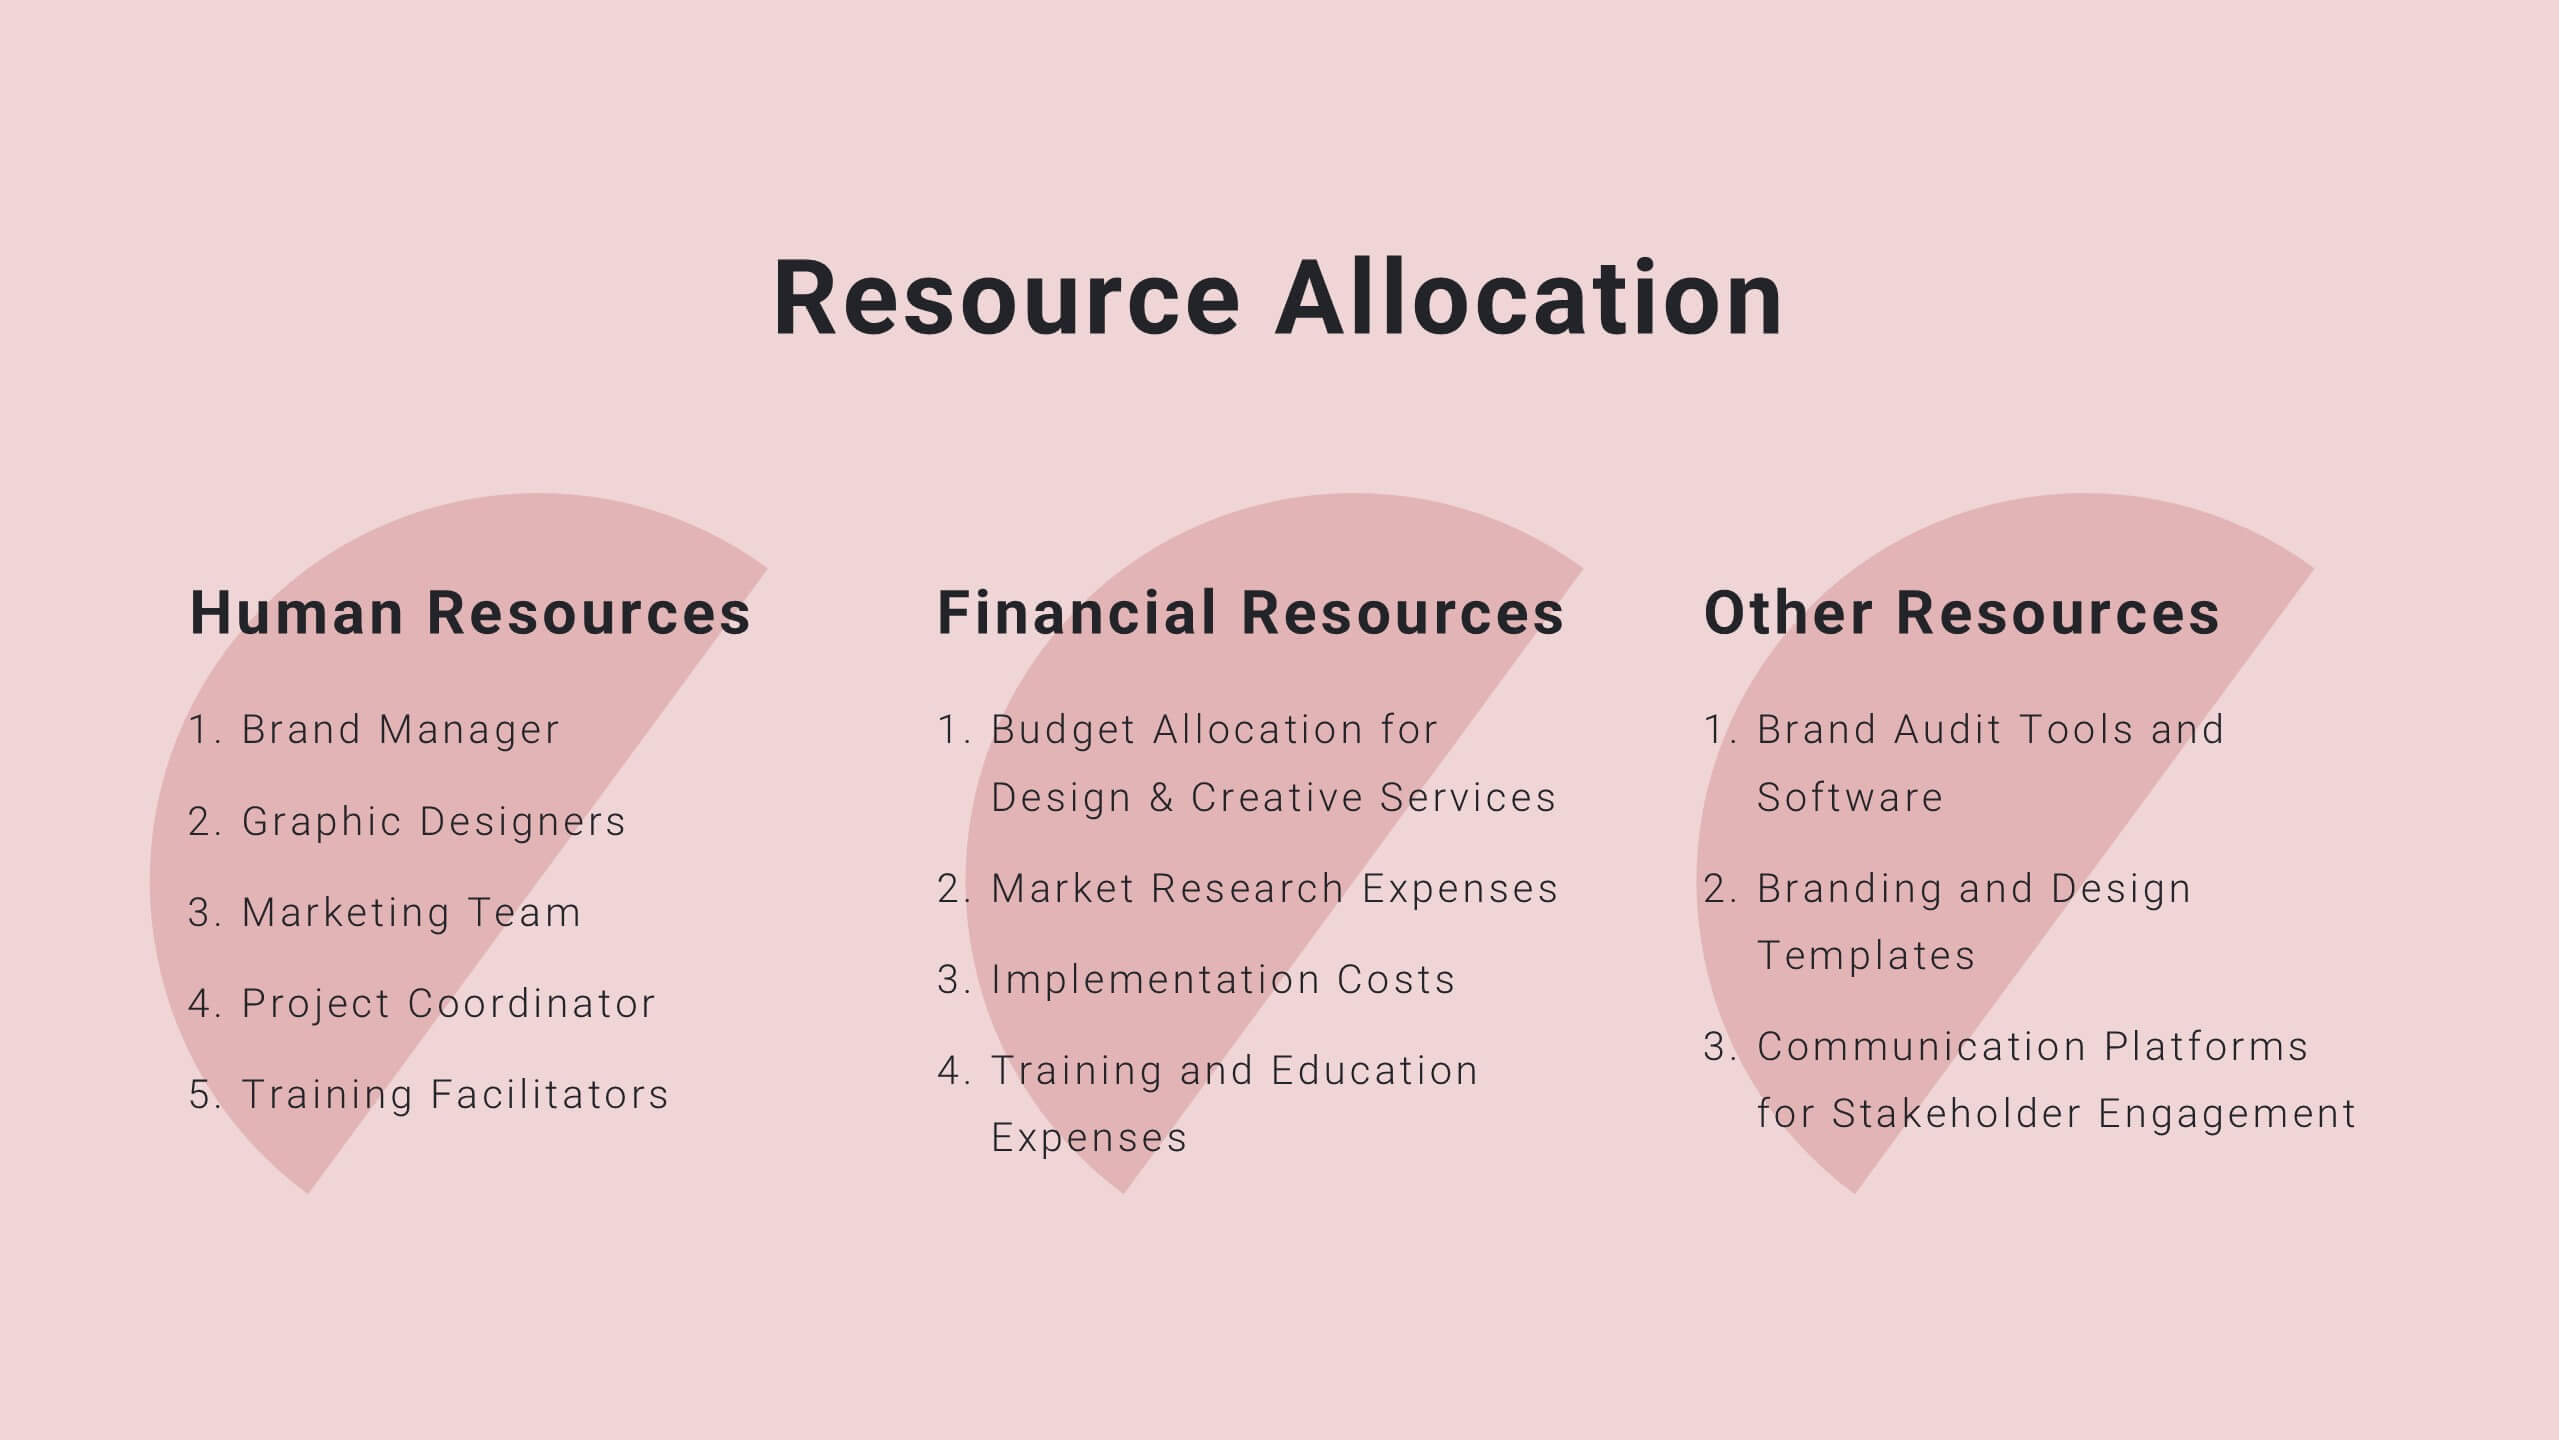
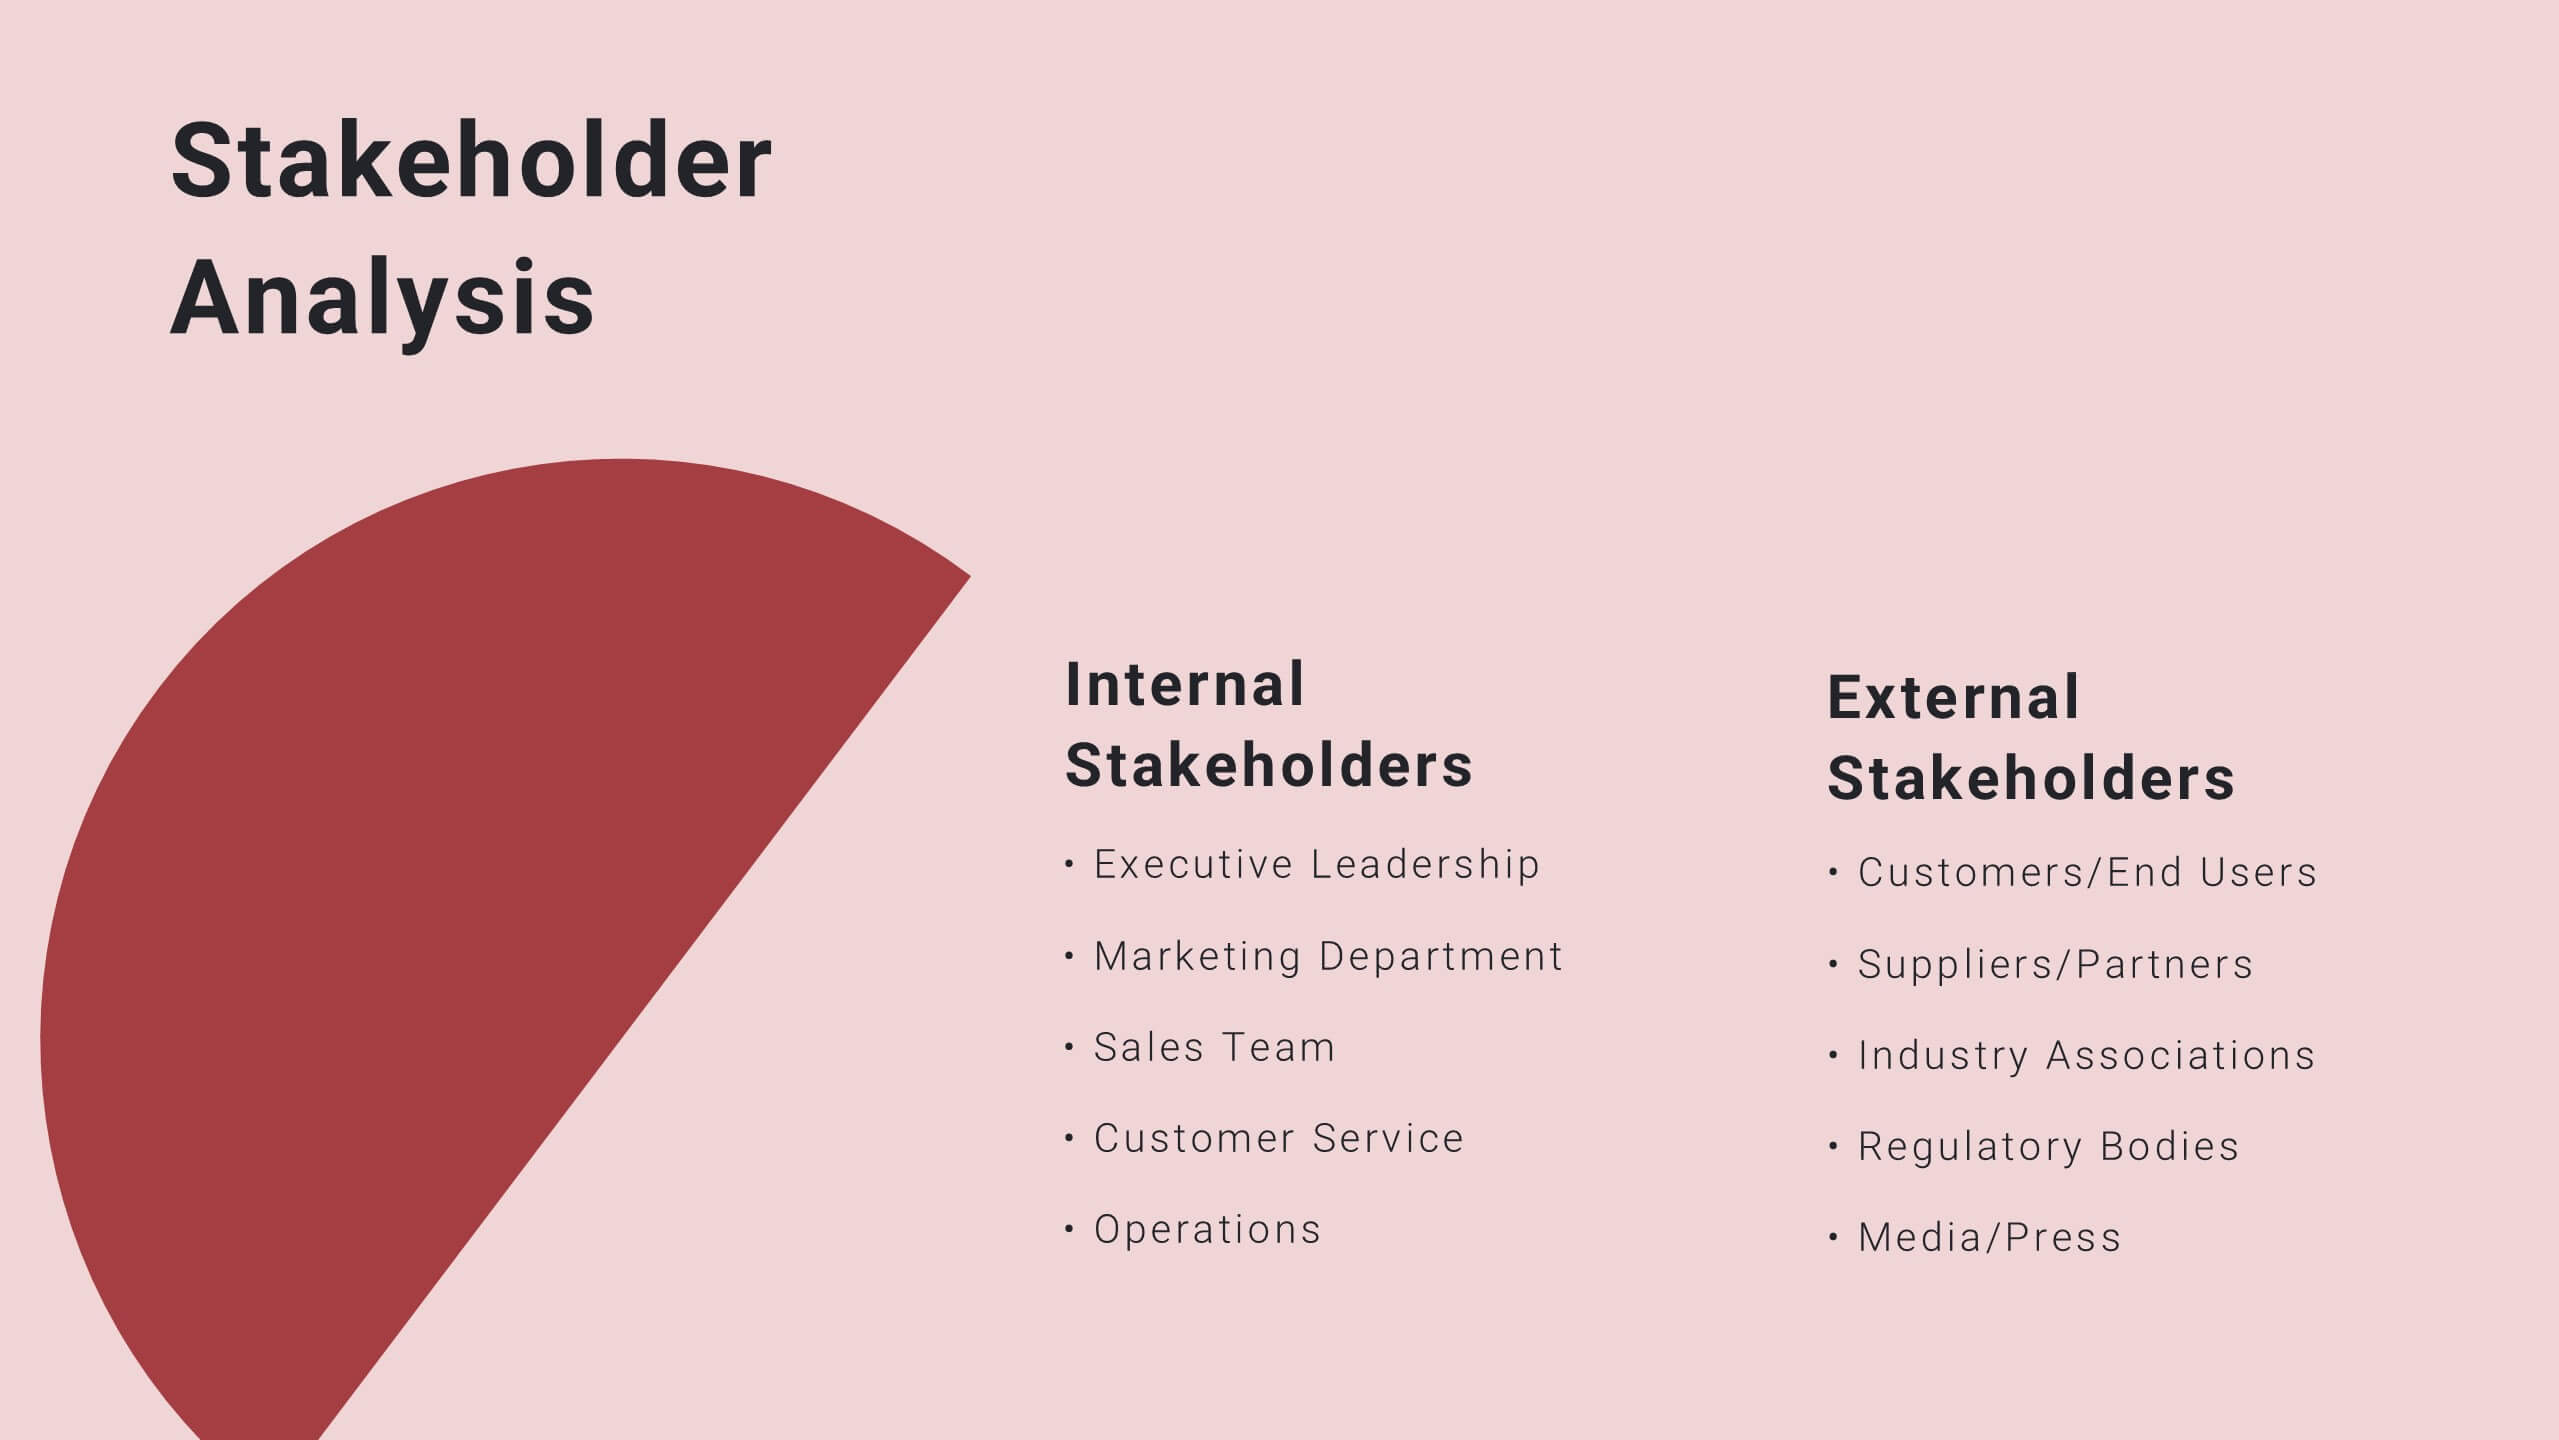
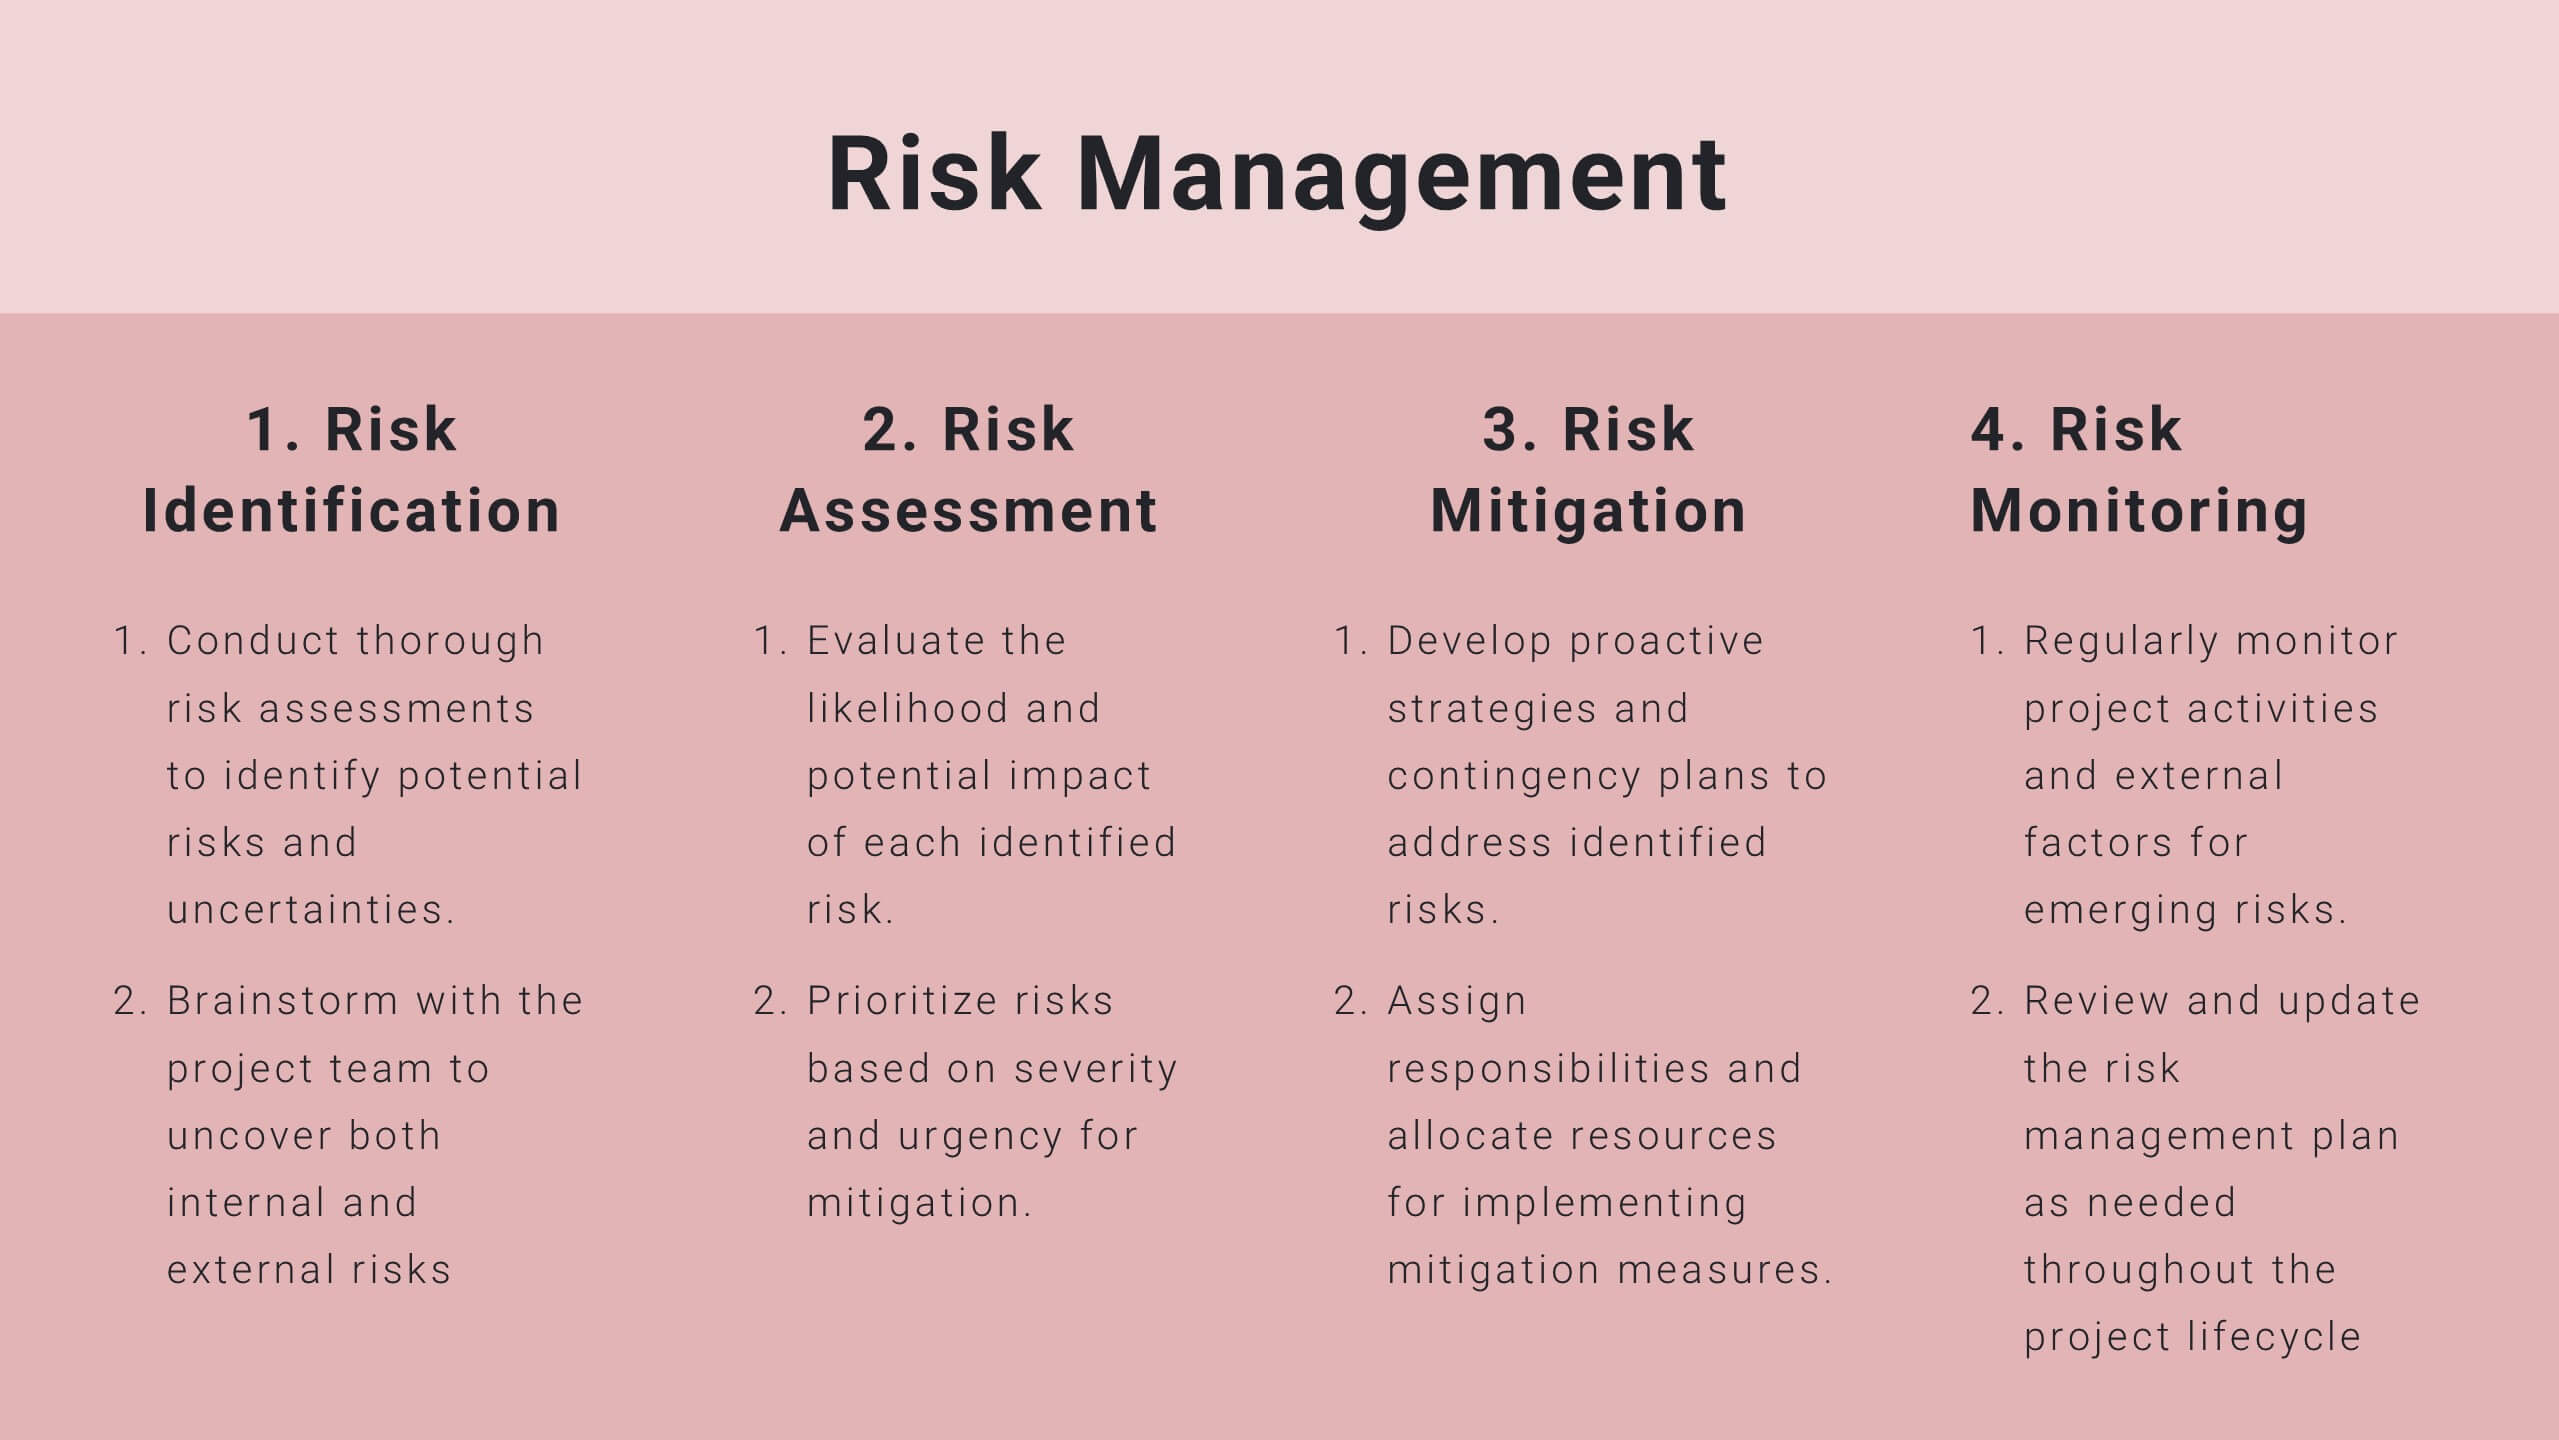
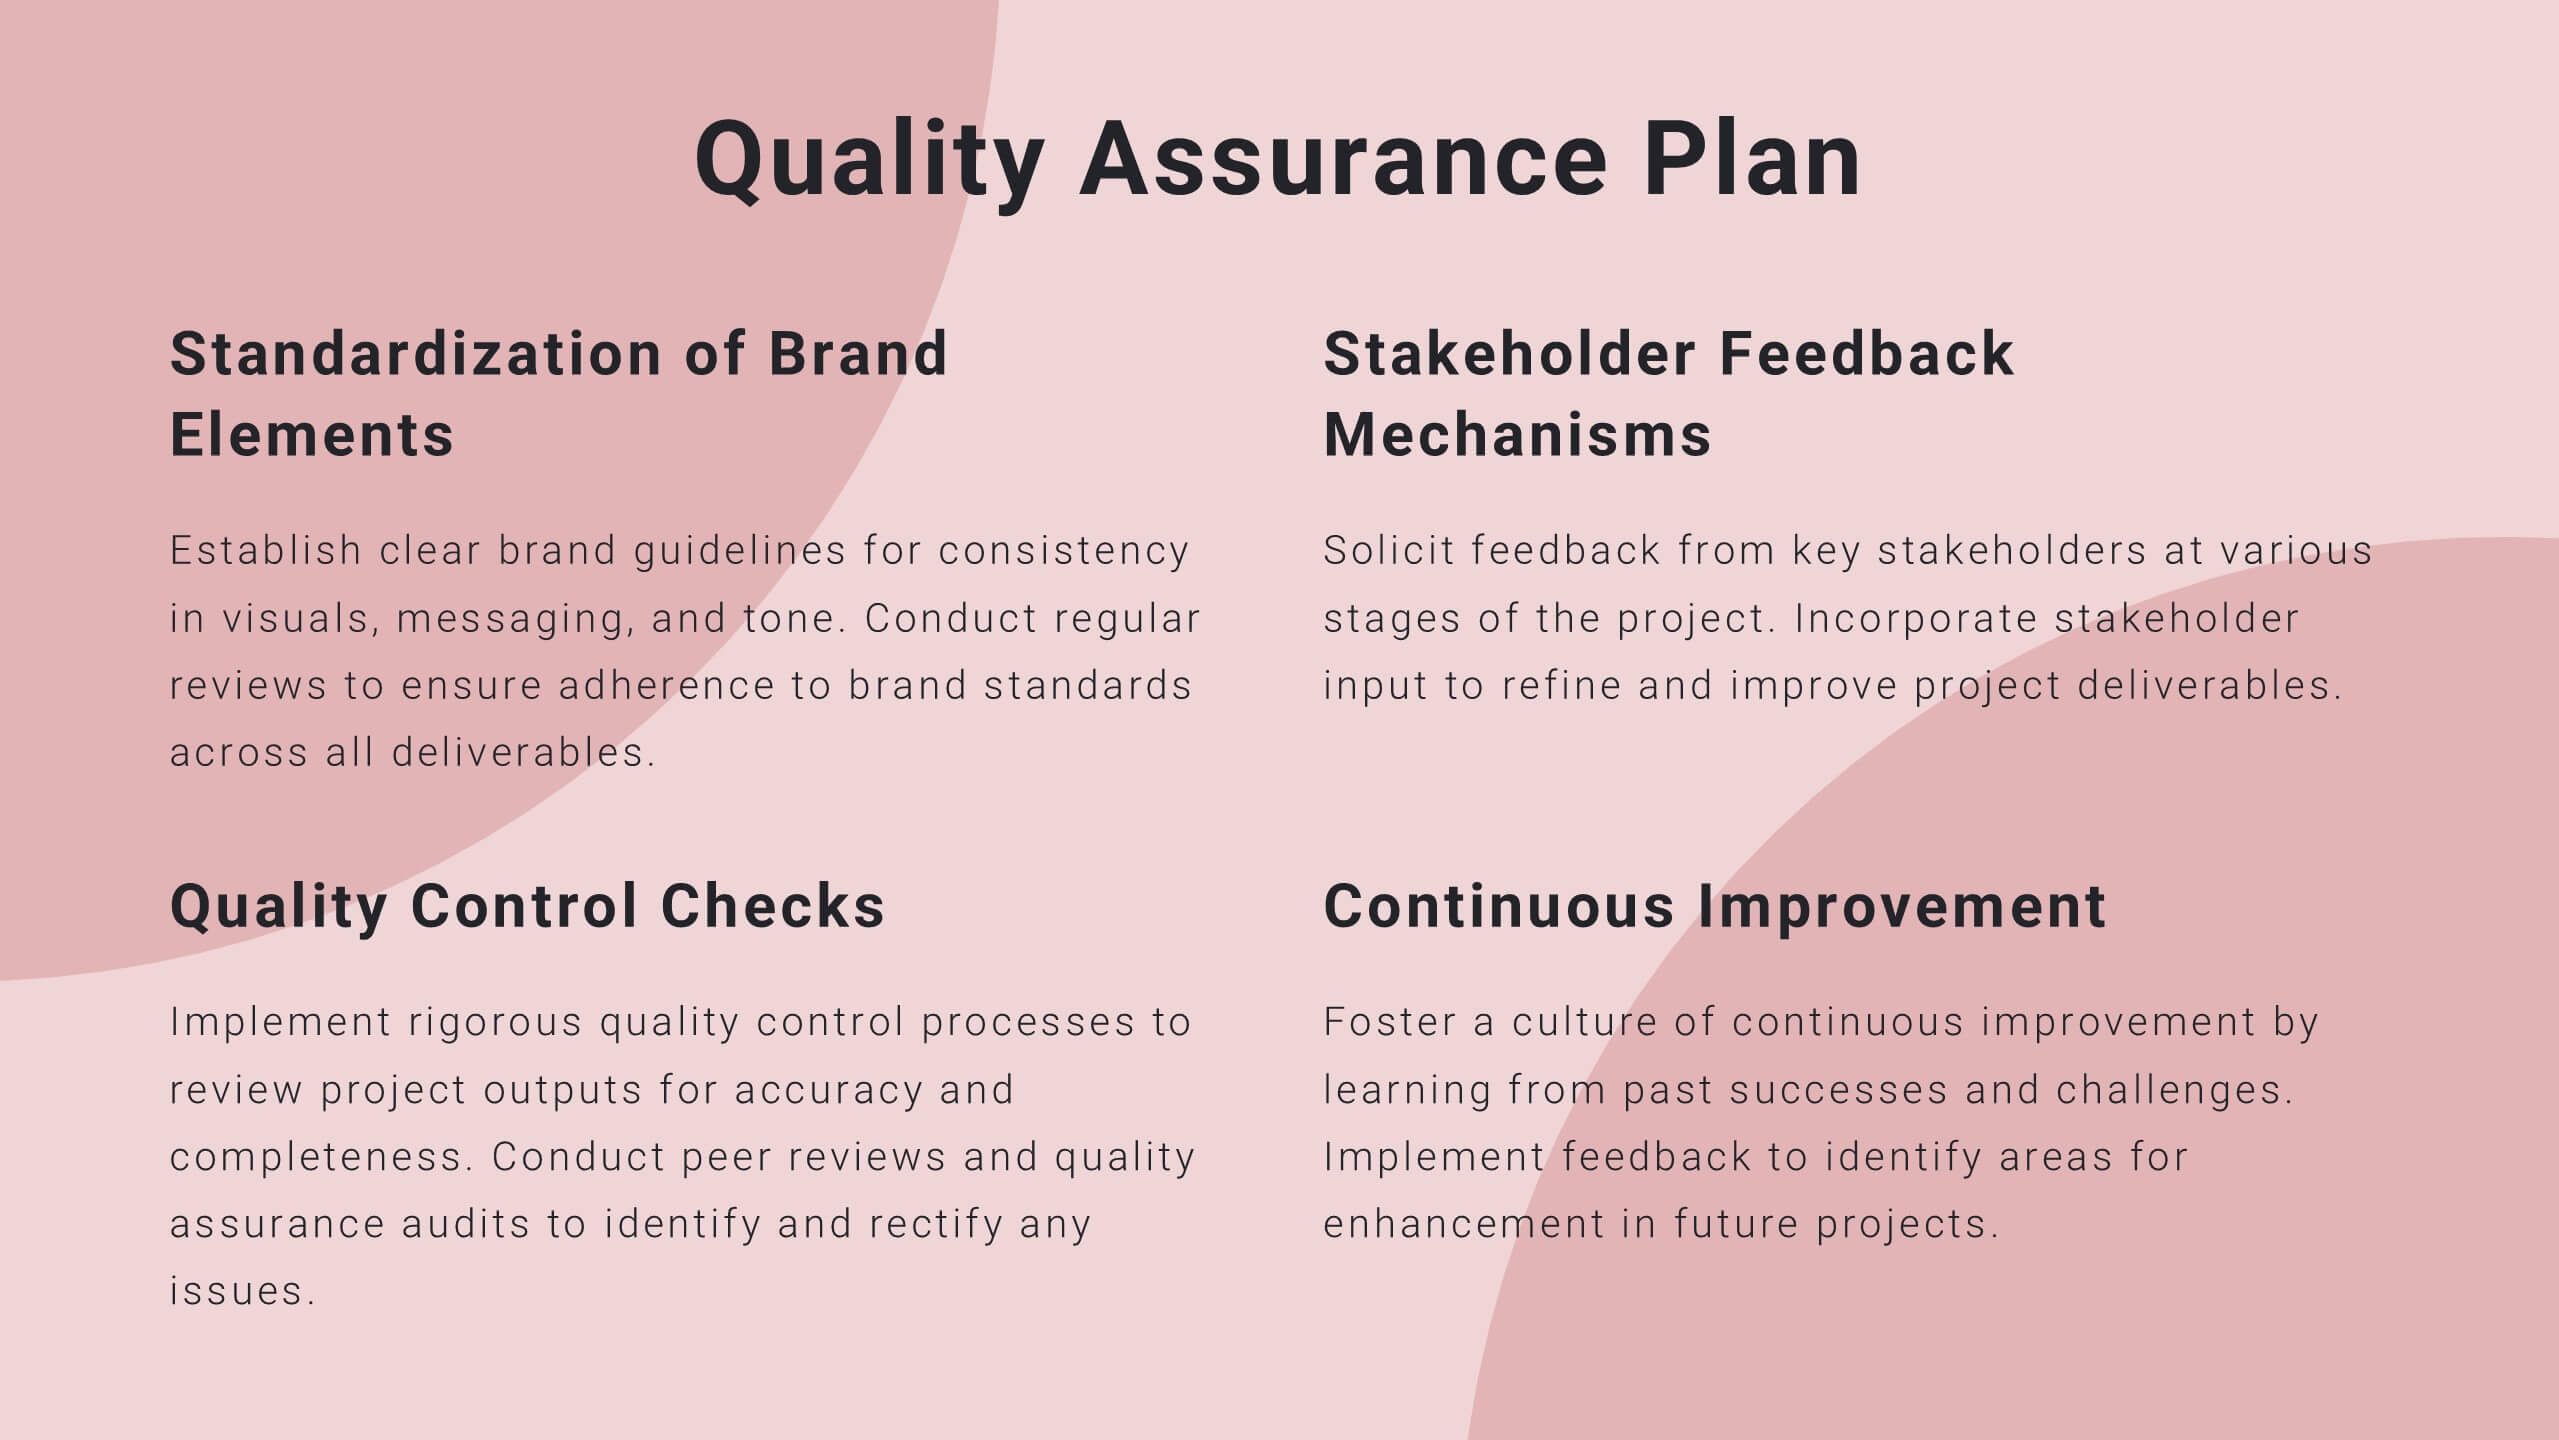
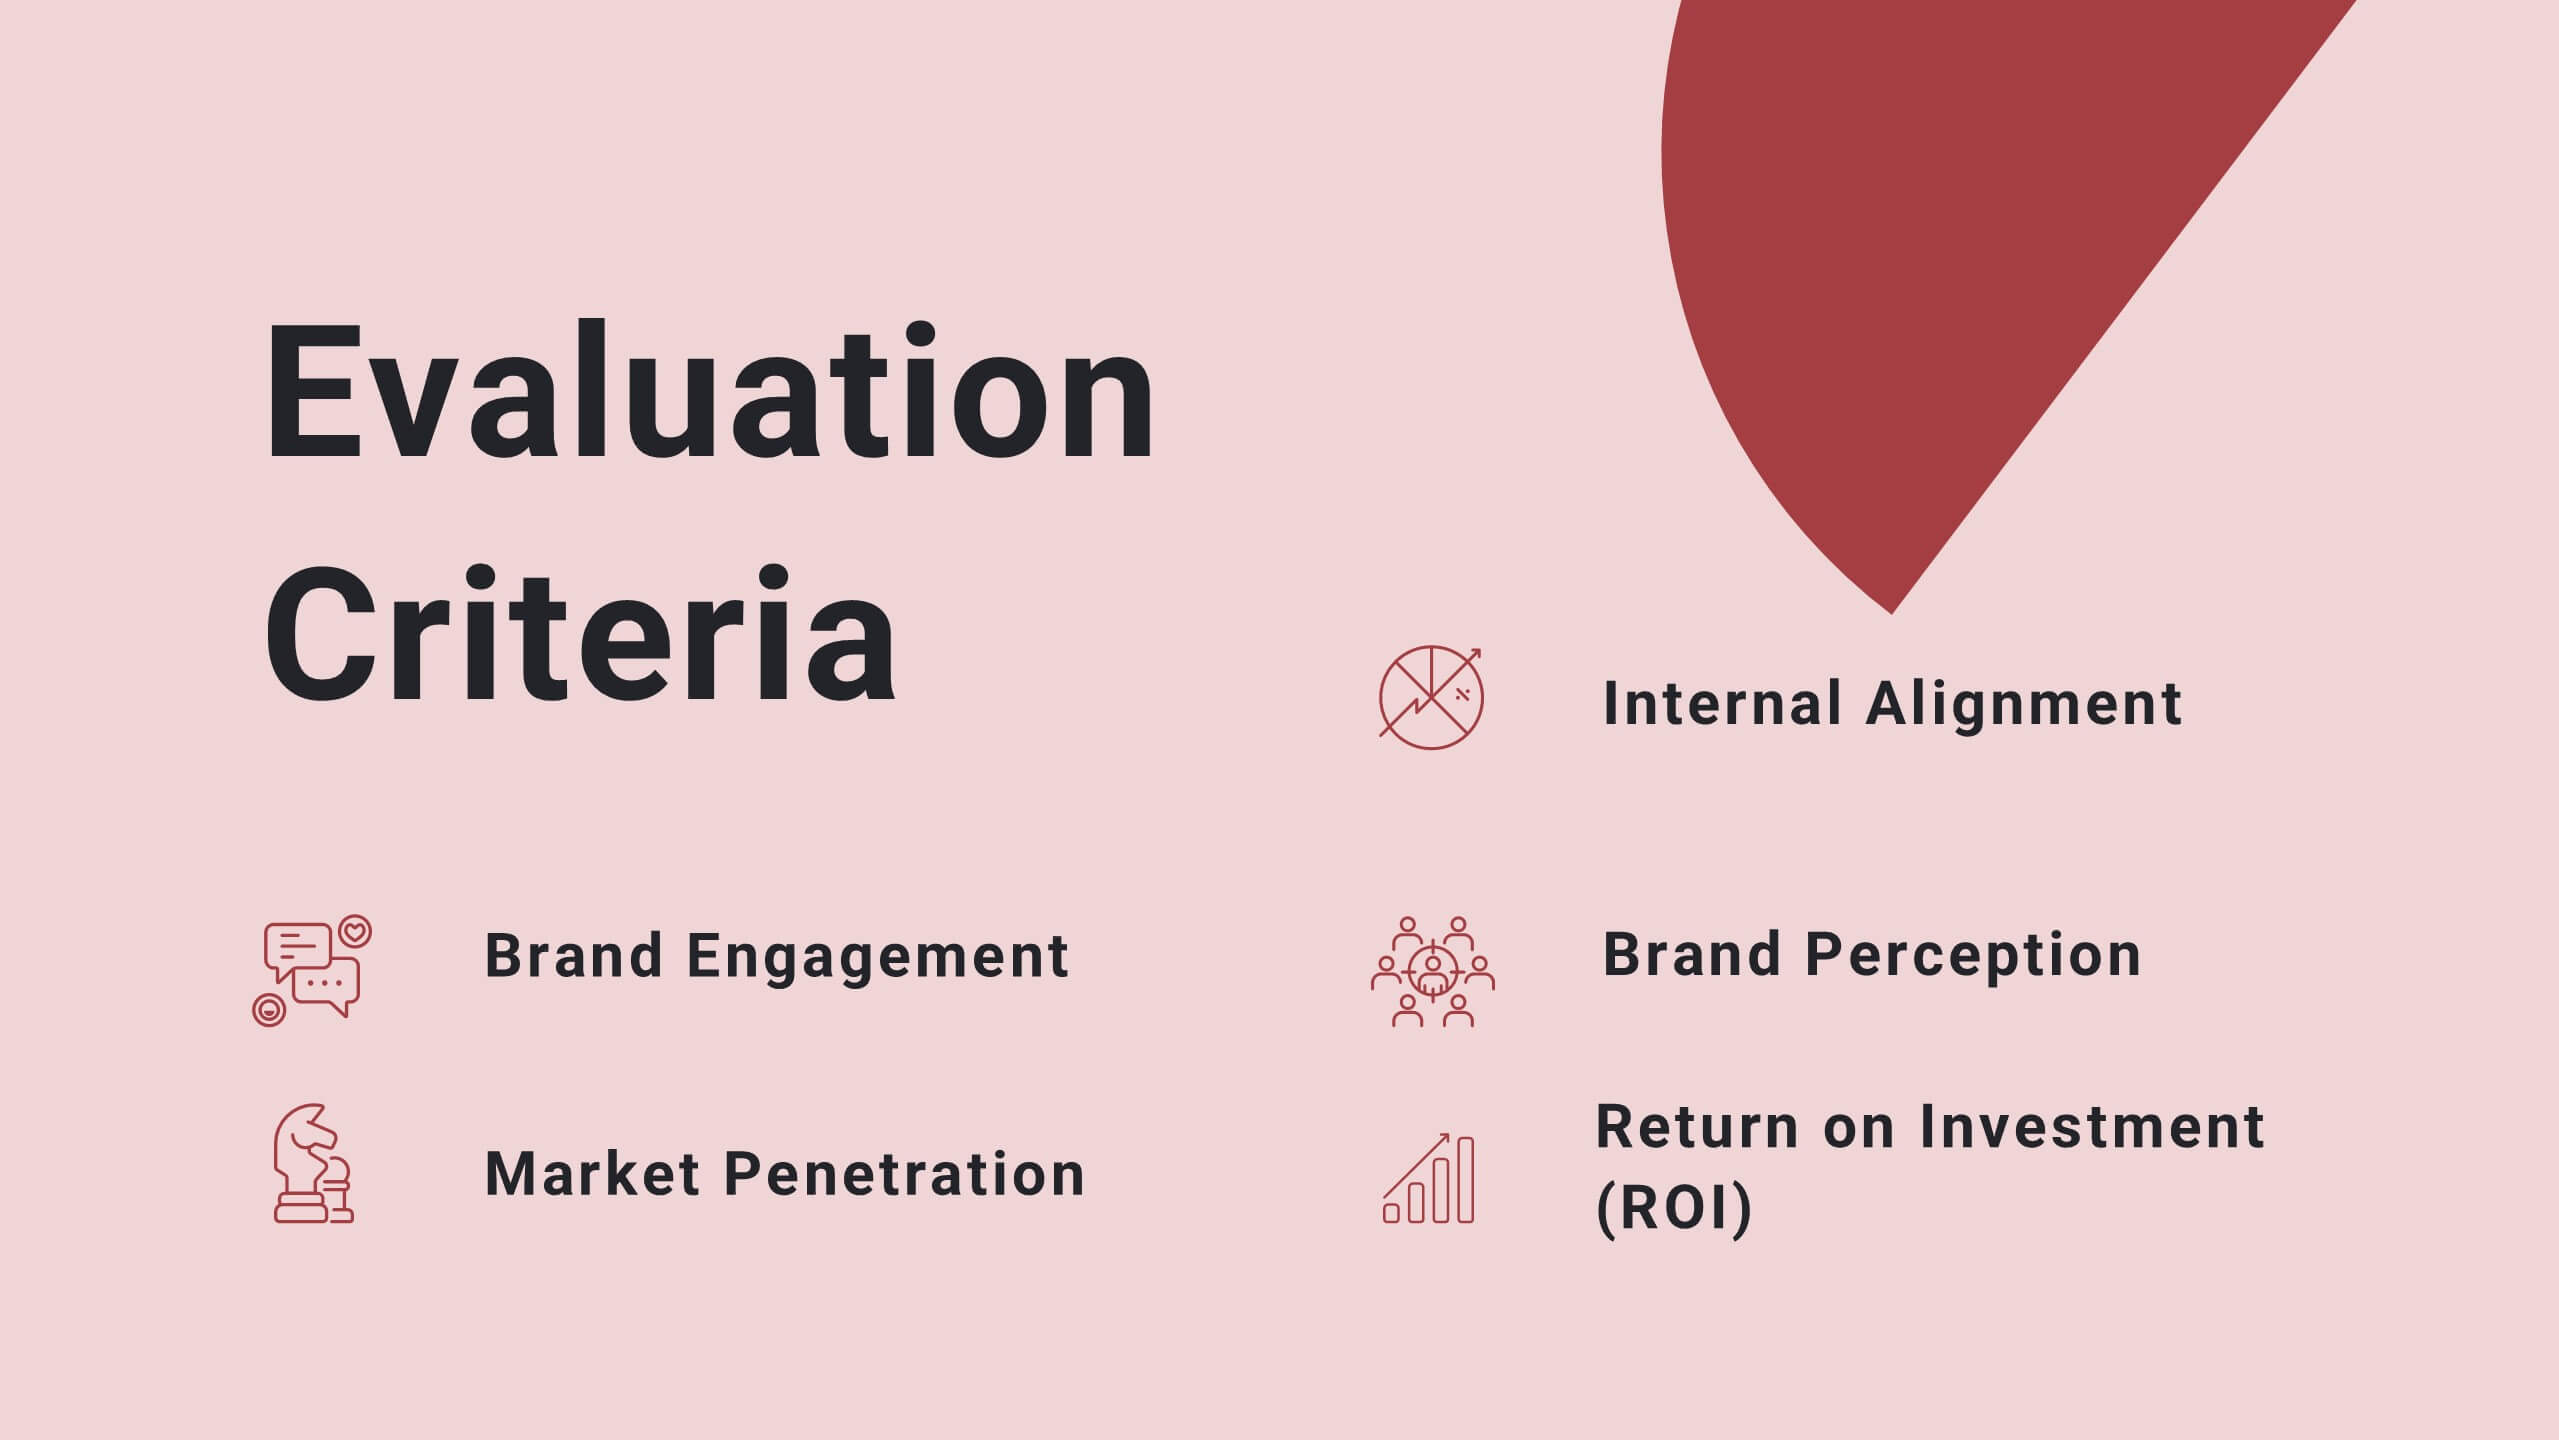
Twilight Project Milestones Report Presentation
Present your project milestones and plan with clarity using this sleek project proposal template! It includes sections for objectives, timelines, budget breakdowns, and risk management. Perfect for organizing and presenting complex project plans, it’s fully customizable and compatible with PowerPoint, Keynote, and Google Slides, ensuring a professional presentation every time.


10 diapositivas
Effective Decision-Making in Five Steps Presentation
Make smarter choices with the Effective Decision-Making in Five Steps presentation. This dynamic template breaks down the key stages of strategic thinking and problem-solving into a clear, engaging framework. Designed for leaders, teams, and consultants, this structured layout helps guide discussions and optimize workflows. Fully editable and available for PowerPoint, Keynote, and Google Slides for seamless customization.


4 diapositivas
Corporate Finance and Expense Review Presentation
Visualize your company's financial structure with this Corporate Finance and Expense Review Presentation. Featuring a wallet-themed layout with three editable icons and text blocks, this slide helps you clearly present income sources, expenses, and budget allocations. Fully customizable in Canva, PowerPoint, and Google Slides.


20 diapositivas
Quasar Design Strategy Proposal Presentation
Elevate your design strategy presentations with this modern, engaging template. Perfect for showcasing design briefs, concept development, and project timelines, it features a sleek layout with a cohesive color scheme. Highlight key elements like typography, textures, and feedback processes to captivate your audience. Compatible with PowerPoint, Keynote, and Google Slides, it ensures seamless presentations on any platform.


5 diapositivas
Four-Step Marketing Funnel Plan Presentation
Streamline your messaging with the Four-Step Marketing Funnel Plan Presentation. This clean, vertical funnel layout highlights each stage of your strategy—ideal for visualizing lead nurturing, sales processes, or campaign progression. Each level is clearly marked and editable, helping you deliver focused insights with ease. Fully compatible with PowerPoint, Canva, Keynote, and Google Slides.


5 diapositivas
Strategic Business Pillars Model Presentation
Visualize your core strategies with this vertical pillar infographic slide. Each level represents a key focus area or foundational element essential for business success. Ideal for leadership talks, team alignment, or growth strategies. Fully editable in PowerPoint, Keynote, and Google Slides.


7 diapositivas
Stock Market Infographic Presentation Template
The stock market is a global system that operates through electronic communication and trading. It allows buyers and sellers to meet, interact, and transact. This template is perfect if you want to become informed or want to inform someone how the stock market operates. This template comes packed with all the information you need. The market allows for price discovery and serve as a barometer for the overall economy. The stock market is highly transparent, allowing sellers to seek the best price. The illustrations provided are made to help you and your viewer understand the bull and bear market.


26 diapositivas
Creative Cryptocurrency Investment Presentation
The growth of Cryptocurrency has been significant over the past few years. It is very important to do your own research, understand the risks involved, and only invest what you can afford to lose. This template is designed with a focus on cryptocurrencies and includes customizable photo layouts, charts, a gold coin pattern and unique cryptocurrency-themed icons and illustrations. You can use this template for any topic related to Cryptocurrency or Blockchain. Create your own presentation within minutes using Powerpoint, Keynote, or Google slides, it is fully editable to suit your needs.


14 diapositivas
Business Proposal Presentation
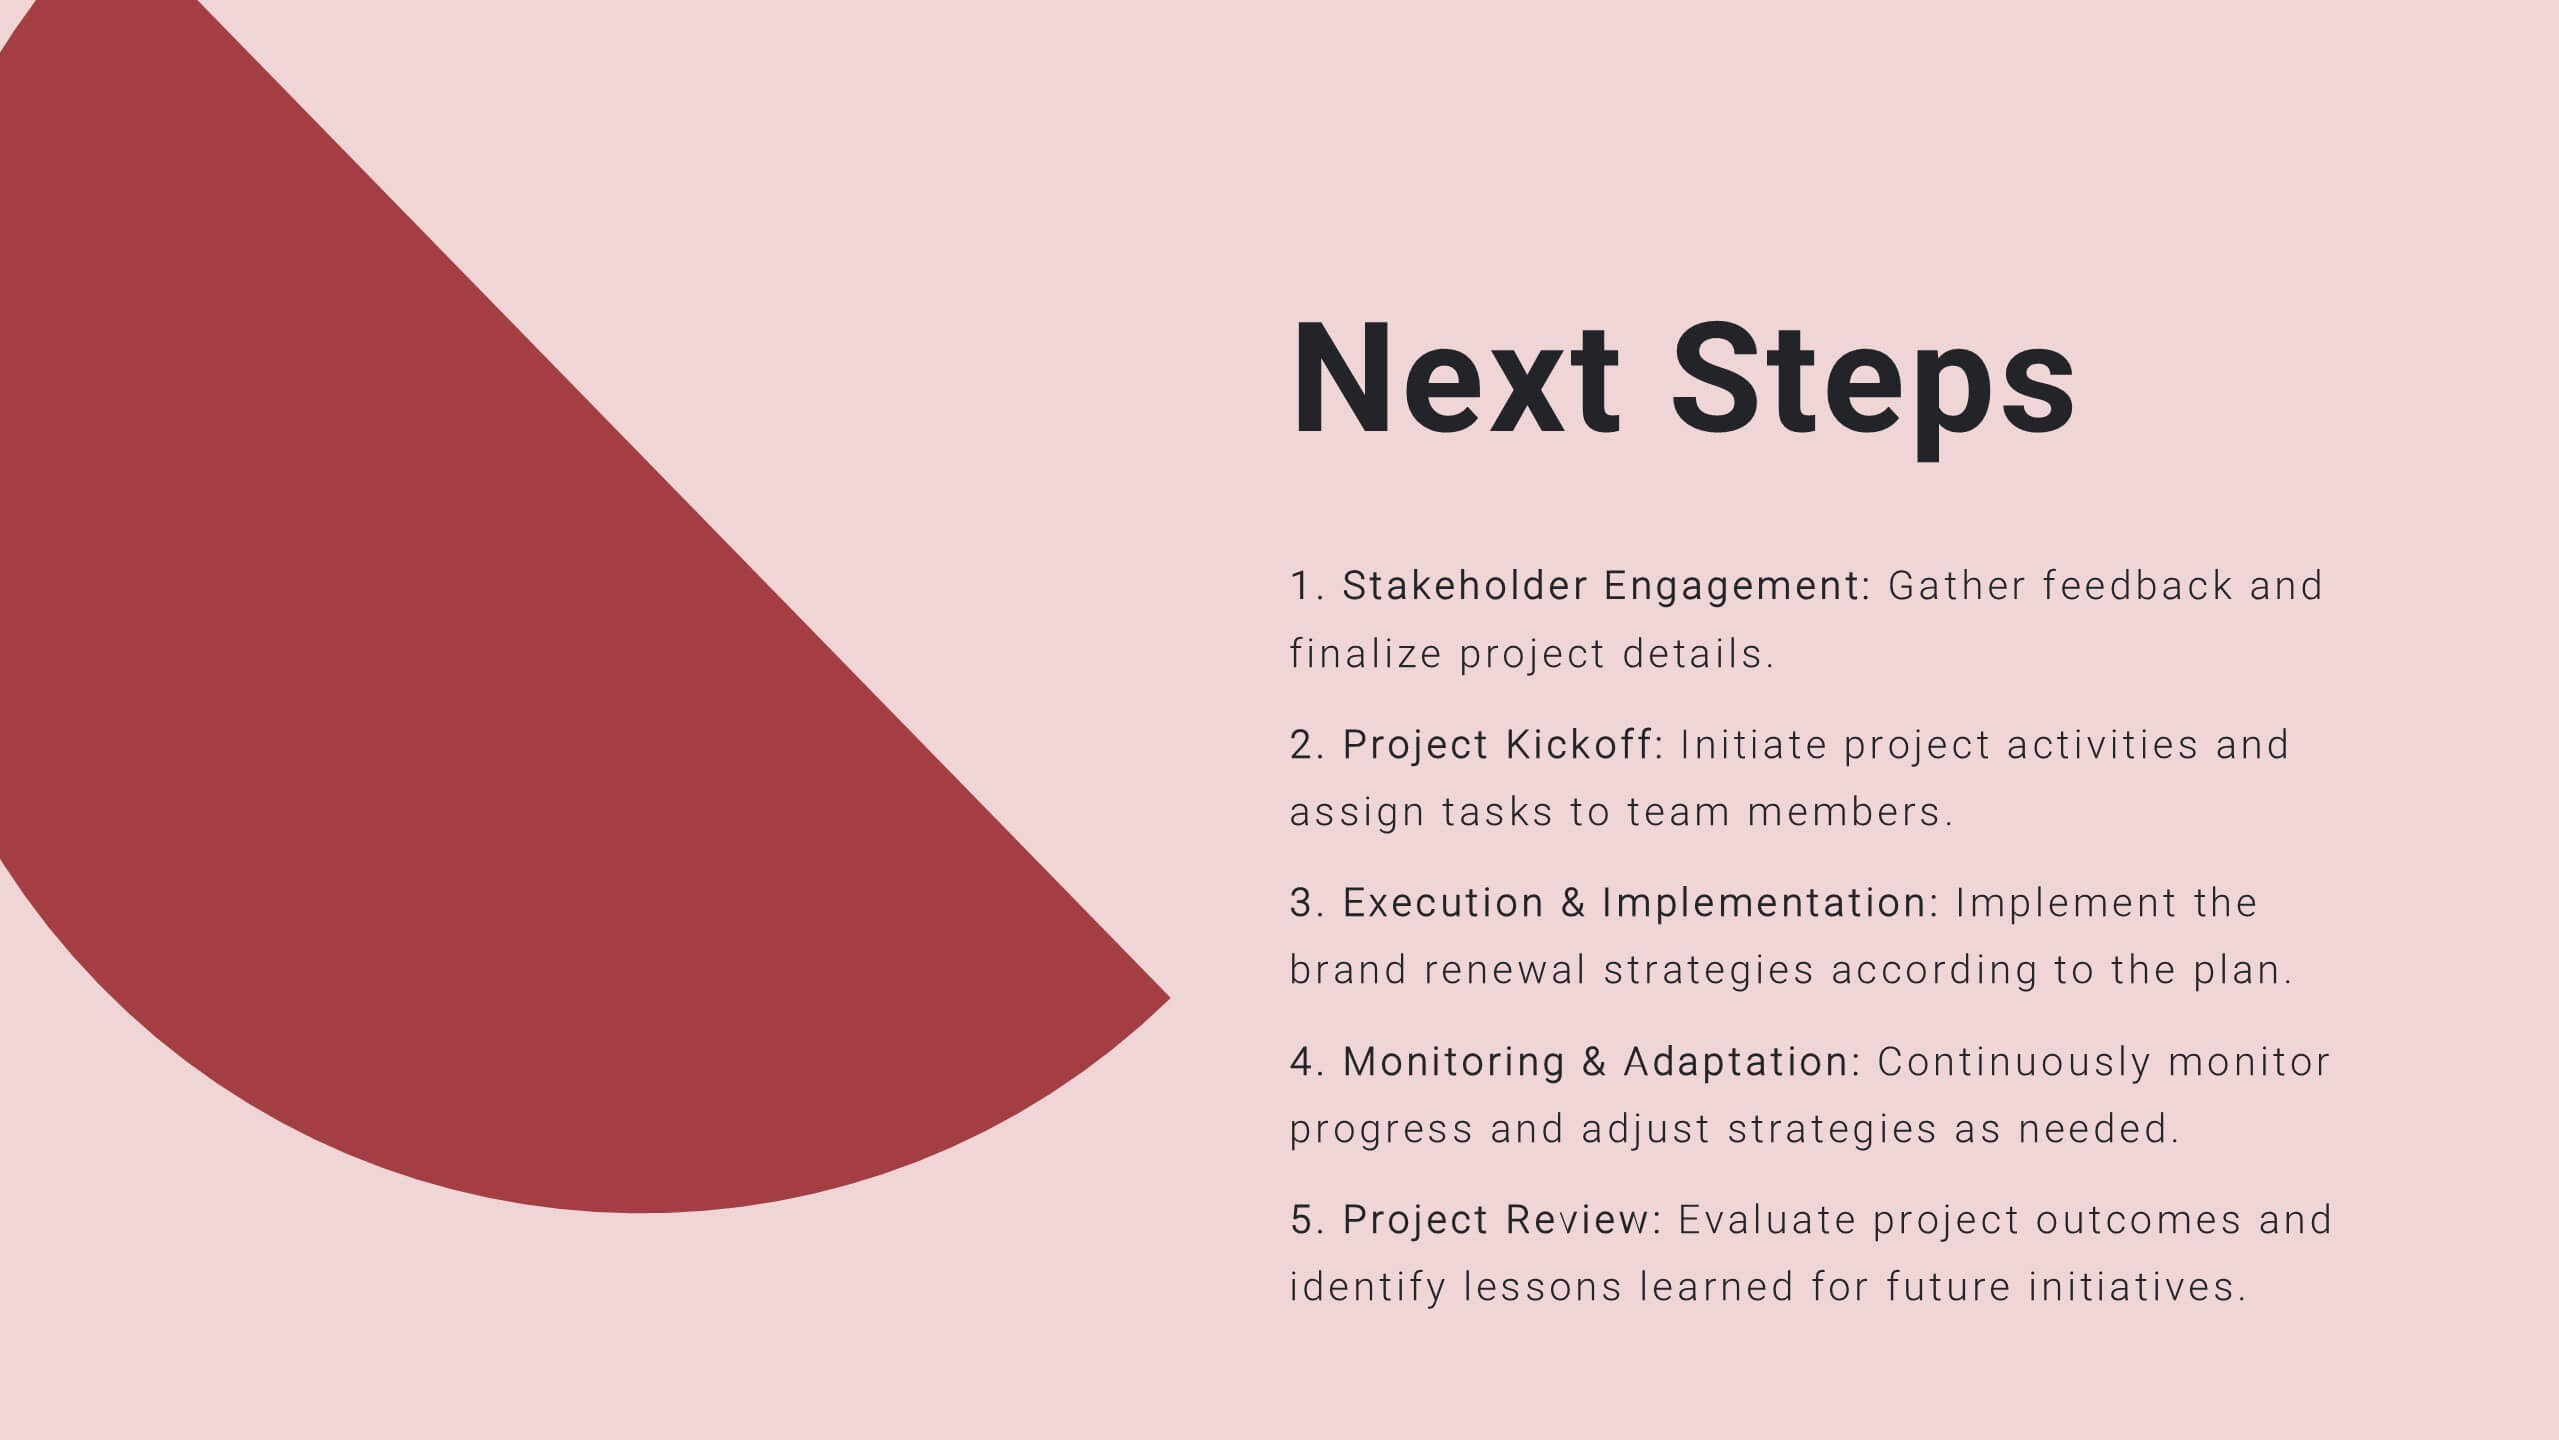
Step into a world of strategic planning and execution with the Business Plan presentation template. The leading slide grabs attention, emblazoned with the bold title 'Business Plan', ready to unfold the story of your enterprise. Progress through a detailed Table of Contents, foreshadowing the comprehensive analysis within. You'll find meticulous breakdowns of data analytics, budget and pricing, benefits for clients and customers, and returns on investment. Each segment is crafted to deliver a thorough examination of your business model and projections. Punctuating the proposal are thought-provoking quotes and a clear call to action, guiding your potential partners towards engagement. A friendly 'We will be delighted to work with you' solidifies the welcoming approach, and the credits slide ensures due acknowledgement of all sources and contributions. This template is a beacon for any business aiming to present a compelling case for partnership or investment.

1 diapositiva
Professional Presentation Cover Slide Presentation
Make a bold first impression with this sleek and modern cover slide designed to introduce your presentation with confidence. Its clean layout and striking geometric shapes create a polished look while giving viewers a clear sense of professionalism. Perfect for business, marketing, or project presentations, and fully compatible with PowerPoint, Keynote, and Google Slides.


4 diapositivas
Veterinary Services and Animal Care Presentation
Deliver professional insights with compassion using the Veterinary Services and Animal Care presentation. This slide features a clean, pet-centered illustration layout ideal for showcasing services such as treatment, grooming, preventive care, and boarding. Each section includes editable icons and placeholder text, making it easy to customize for veterinary clinics, pet hospitals, or animal wellness campaigns. Fully compatible with PowerPoint, Keynote, and Google Slides.


22 diapositivas
Meteor Academic Research Report Presentation
Get ready to make your research presentation stand out with the Meteor Academic Research Report template! This elegant and sophisticated design is perfect for showcasing your research findings with clarity and impact. The template features a refined color scheme of earthy browns and soft greens, giving your presentation a polished and professional look. Each slide is carefully crafted to highlight key aspects of your research, from objectives and methodology to data analysis and conclusions. With dedicated sections for literature review, key findings, and future research directions, this template ensures that your audience can follow your research journey from start to finish. The clean and structured layout makes it easy to present complex information in a way that is easy to understand. Fully compatible with PowerPoint, Keynote, and Google Slides, the Meteor template is the ideal choice for delivering compelling and visually appealing academic presentations.