


Características


¿Tienes alguna pregunta?
Recomendar


5 diapositivas
Pet Health Clinic Workflow Presentation
Guide your audience through each stage of care with the Pet Health Clinic Workflow presentation. This engaging slide features a horizontal visual of a dog segmented into four workflow stages, making it ideal for explaining clinical procedures, pet treatment plans, or wellness programs. Each section includes editable text areas for customizable labels and descriptions. Perfect for veterinary clinics, pet hospitals, and animal health professionals. Fully compatible with PowerPoint, Keynote, and Google Slides.


6 diapositivas
Agenda Network Infographic
Elevate your networking events with our sophisticated collection of agenda slide templates. These slides are crafted to structure and present the flow of activities at networking events, making them essential for coordinators who aim to foster professional connections among attendees. Each template is designed with clarity and style, featuring clean lines and modern graphics to outline key segments of your event, such as welcome remarks, networking sessions, panel discussions, and closing statements. The thoughtful layout includes designated spaces for time slots, session titles, and speaker details, ensuring that participants can easily follow the event's progression and plan their participation accordingly. These slides are fully customizable, allowing you to match the visual design with your event’s theme or corporate branding. The adaptable format makes it simple to insert or remove sections based on the specific needs of your event. Ideal for business conferences, industry meet-ups, or any professional gathering, these agenda slides help you manage and execute a seamless networking experience.


7 diapositivas
South America Infographic Presentation Template
South America is the fourth largest continent in size and the fifth largest in population. It is located primarily in the southern hemisphere, situated between the Pacific and Atlantic Oceans, with mostly colonies on other continents. South America is a continent entirely in the Western Hemisphere, mostly in the Southern Hemisphere. This South America map template is a great base for lesson plans, reference guides and much more. This map template is fully editable and can be easily customized to suit your presentation needs, add multiple layers of text, pictures and various other features.


3 diapositivas
Decision-Making Bowtie Framework Presentation
Break down complex decisions with clarity using the Decision-Making Bowtie Framework Presentation. This template lets you visually weigh options, outcomes, and impacts from both sides of a decision point, making it ideal for strategic planning, risk assessment, and executive reporting. Compatible with PowerPoint, Keynote, and Google Slides.


6 diapositivas
Business Strategy Wheel Model Presentation
Present your key strategic components in a clear, circular layout with this wheel model template. Ideal for outlining interconnected steps, departments, or initiatives, this design allows you to visualize all six elements of your strategy at once. Fully customizable in PowerPoint, Keynote, and Google Slides.

20 diapositivas
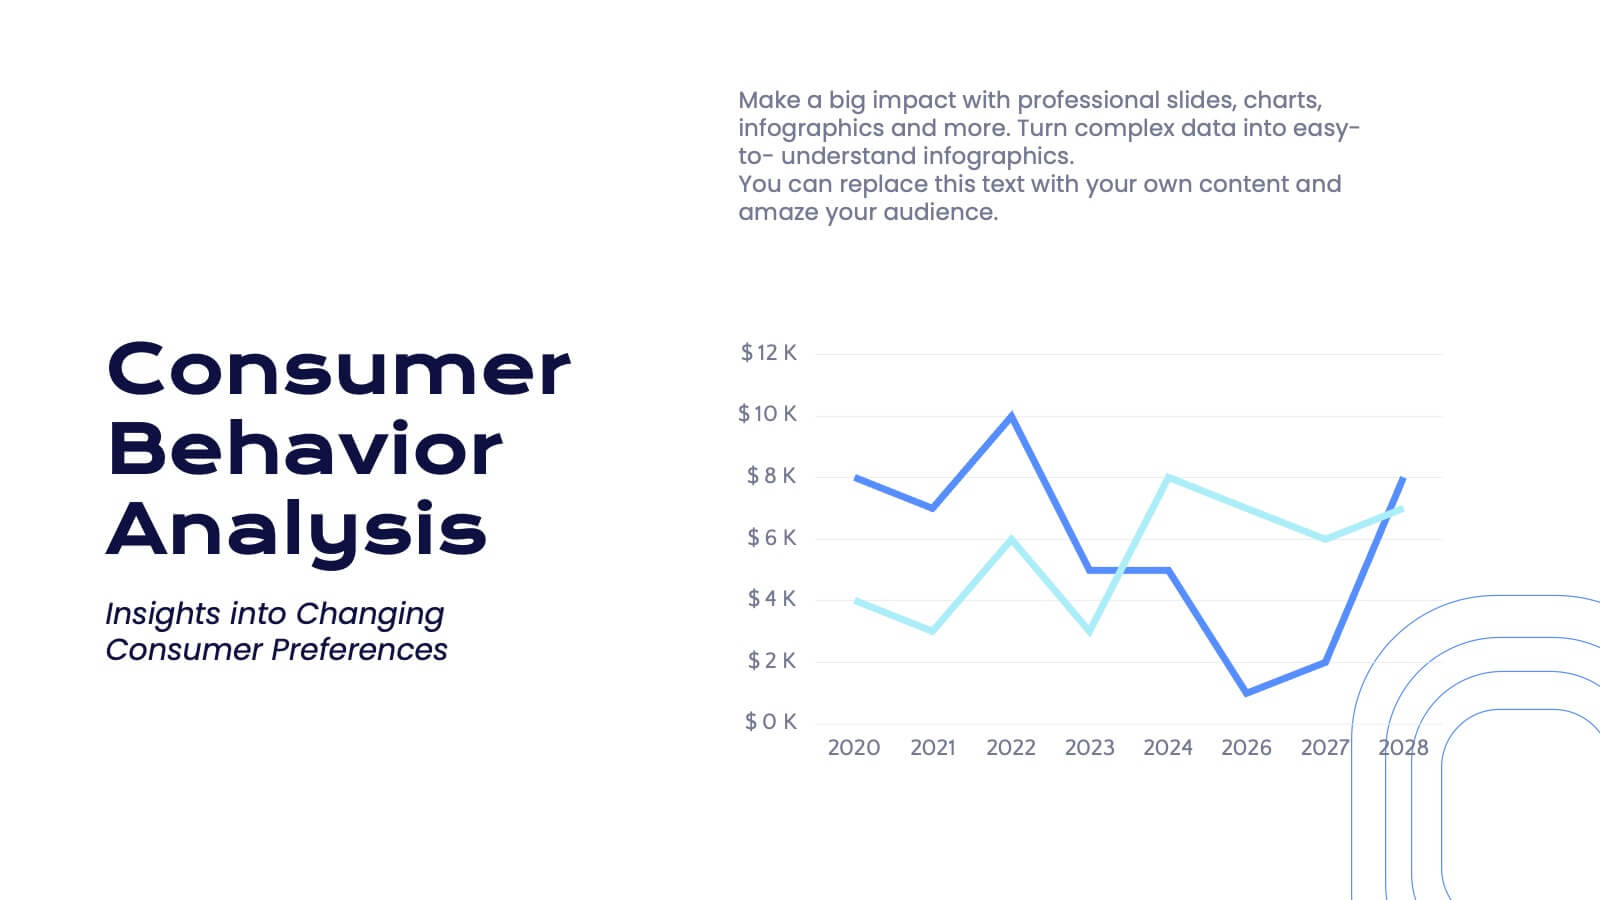
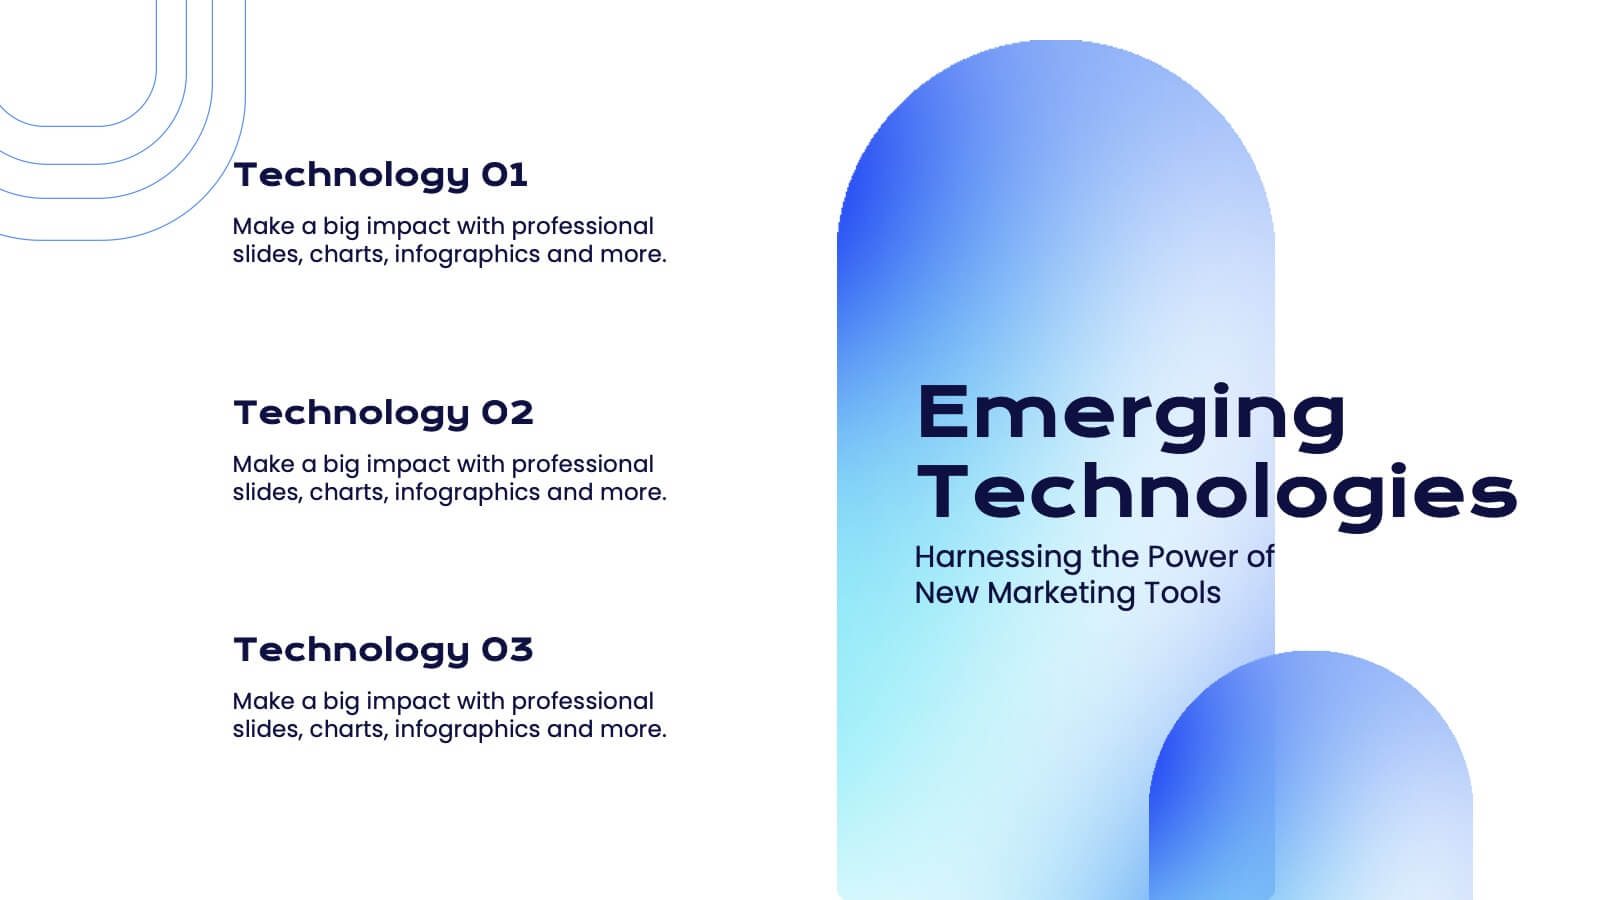
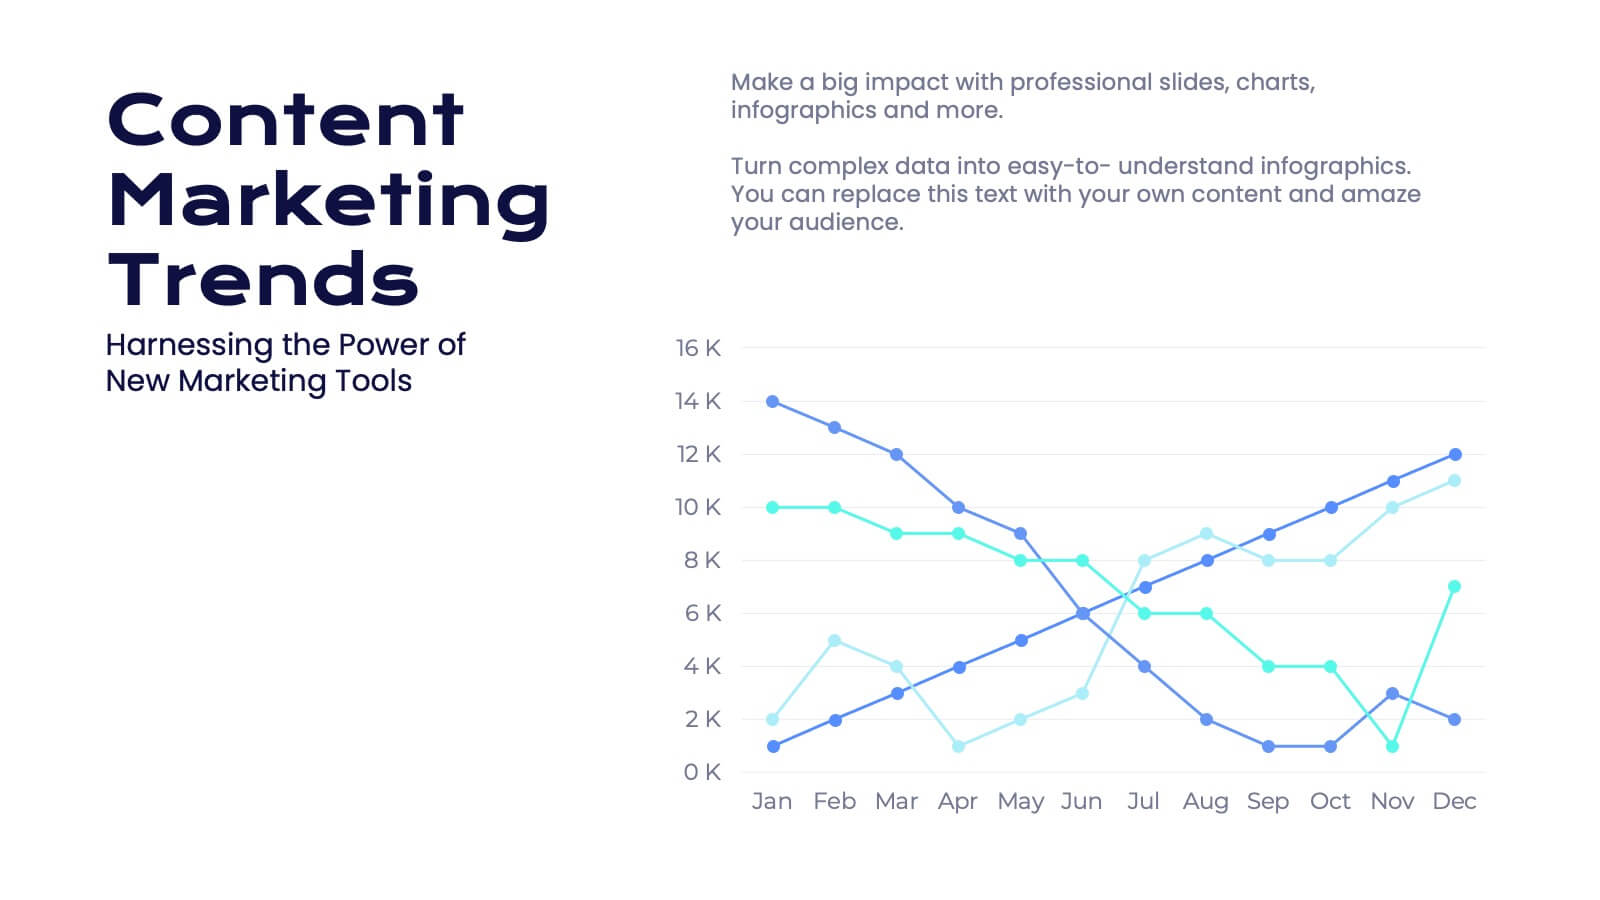
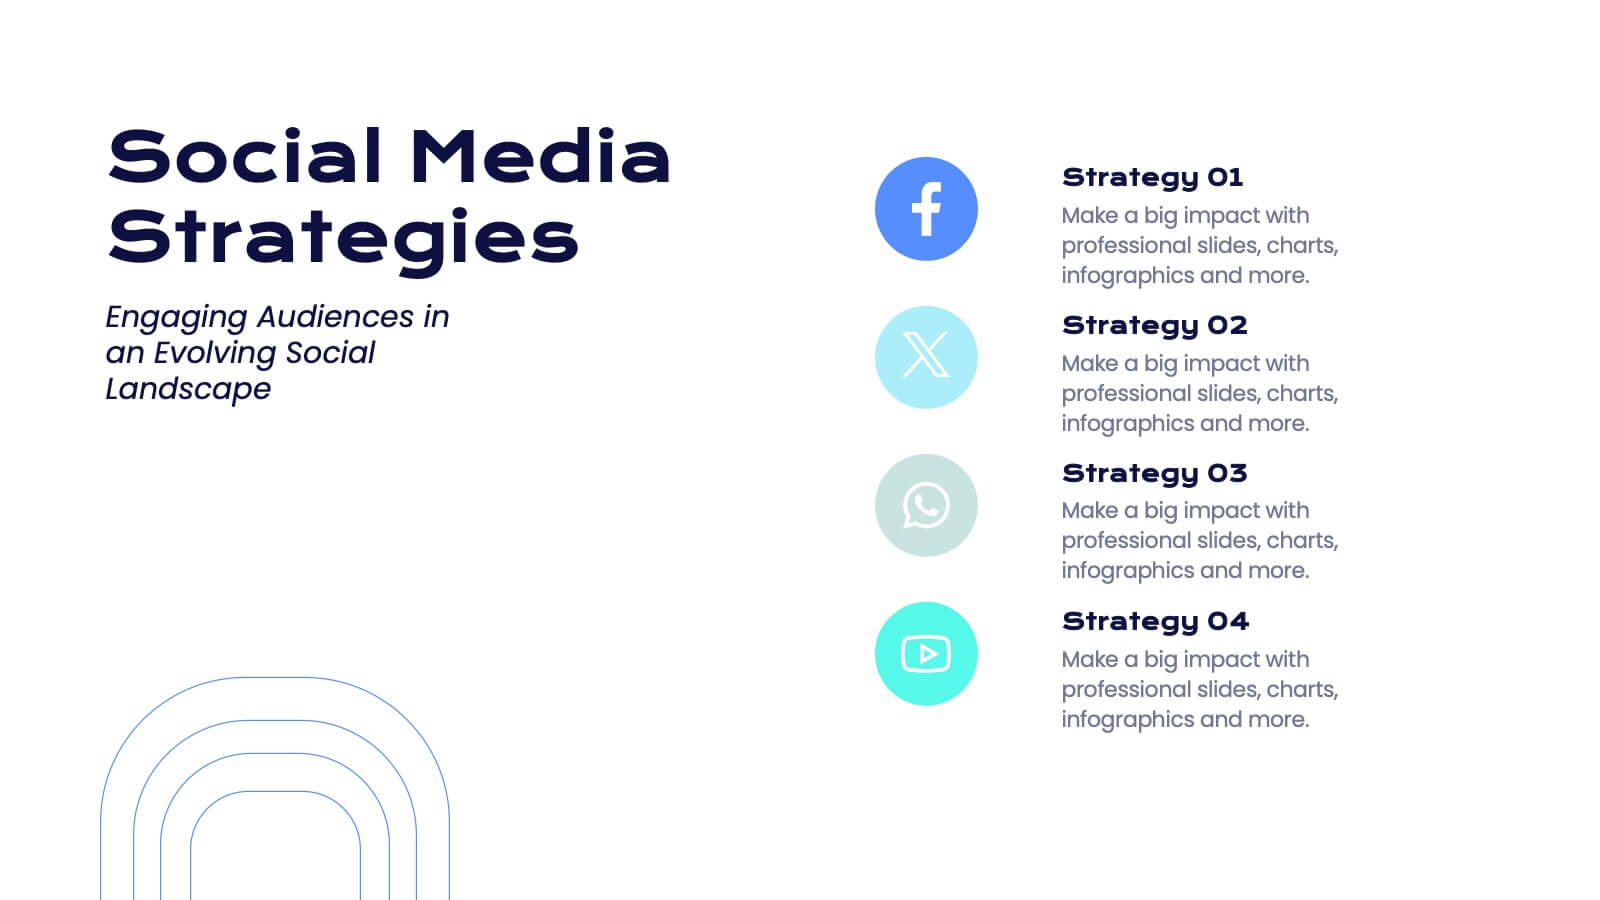
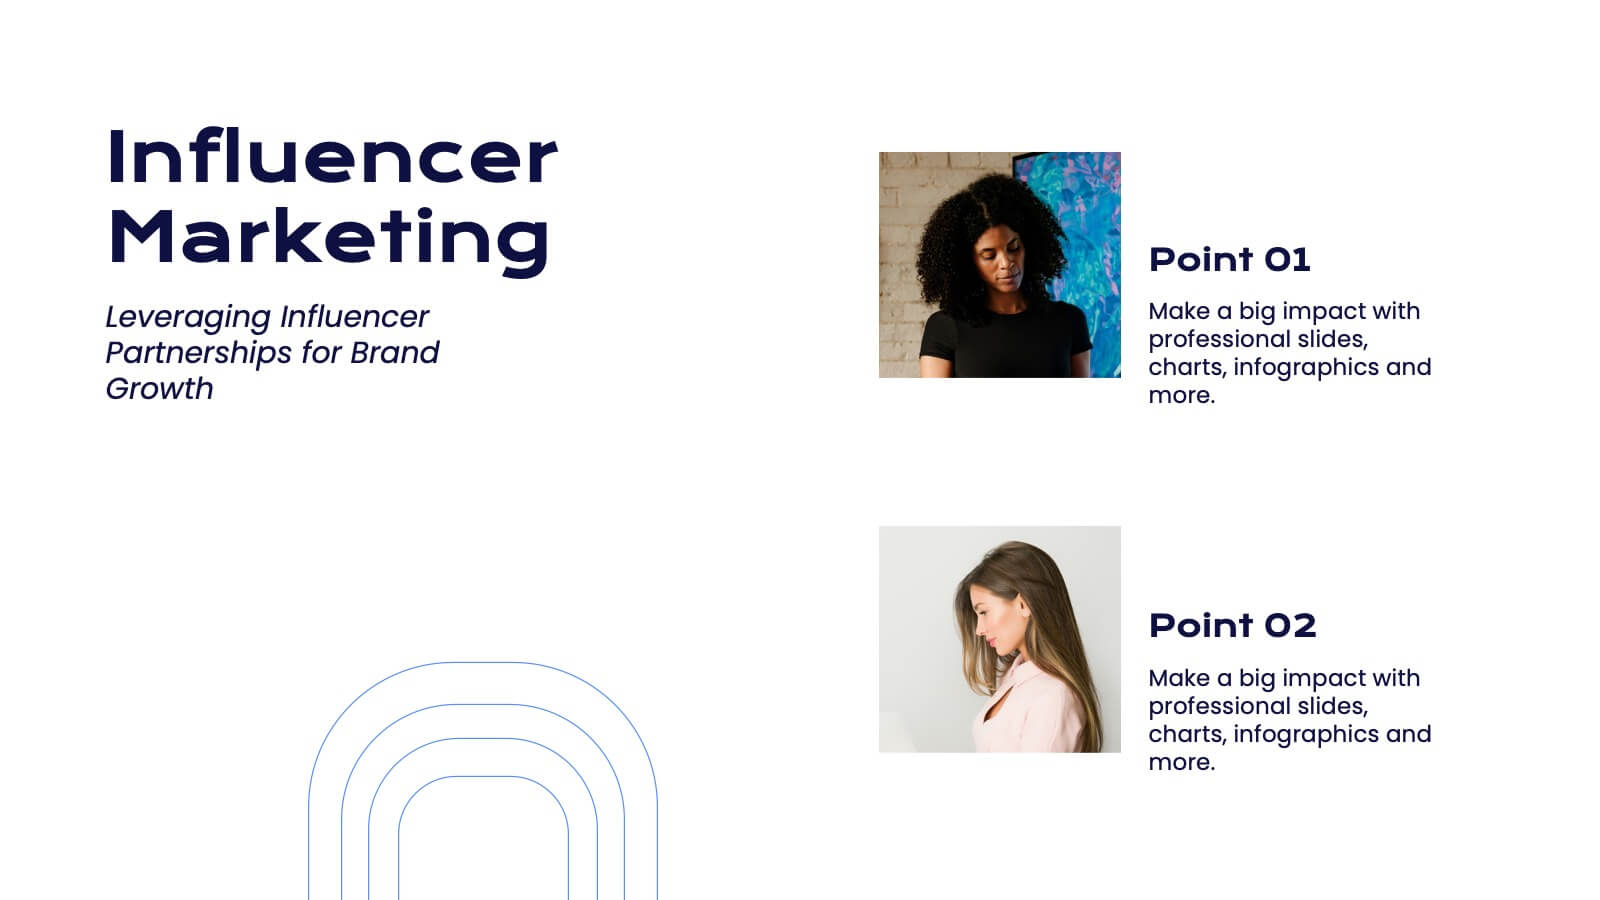
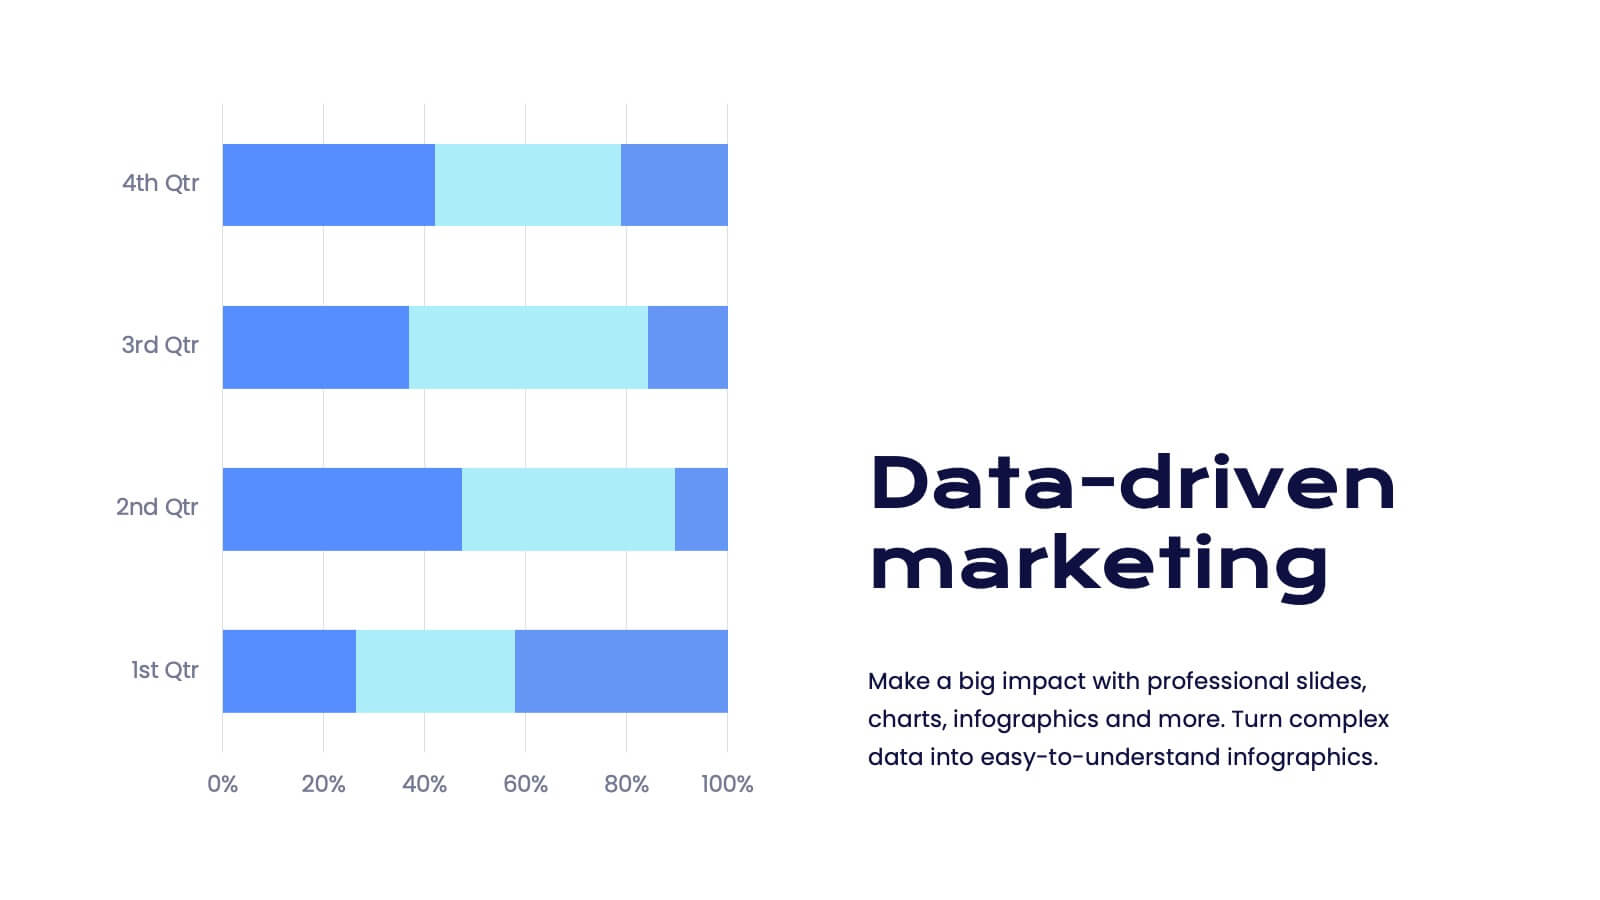
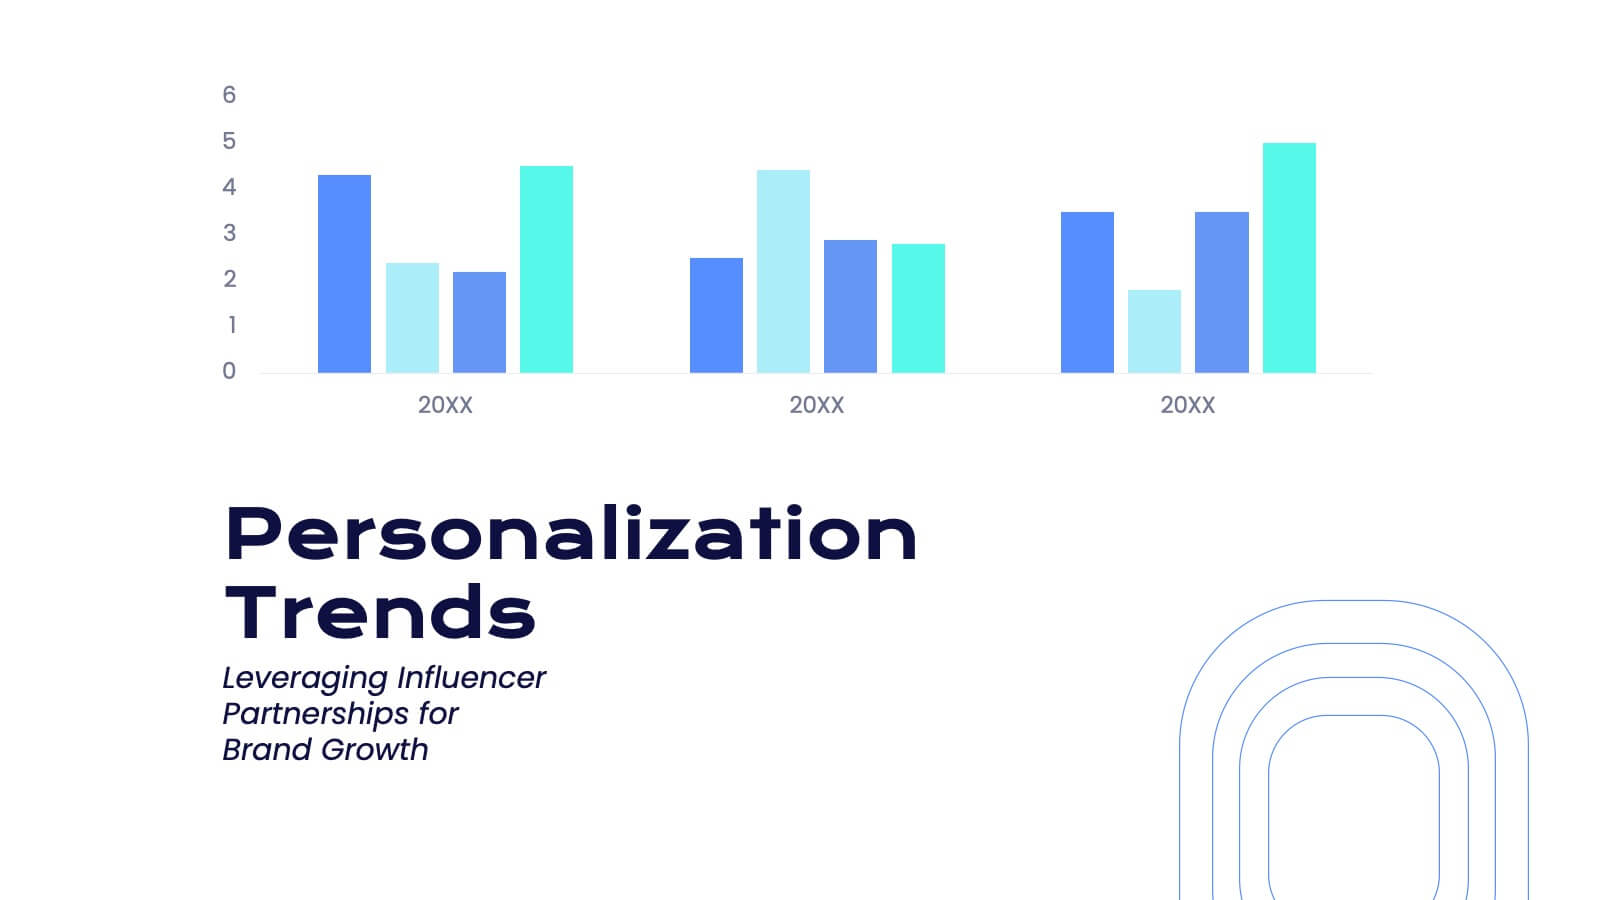
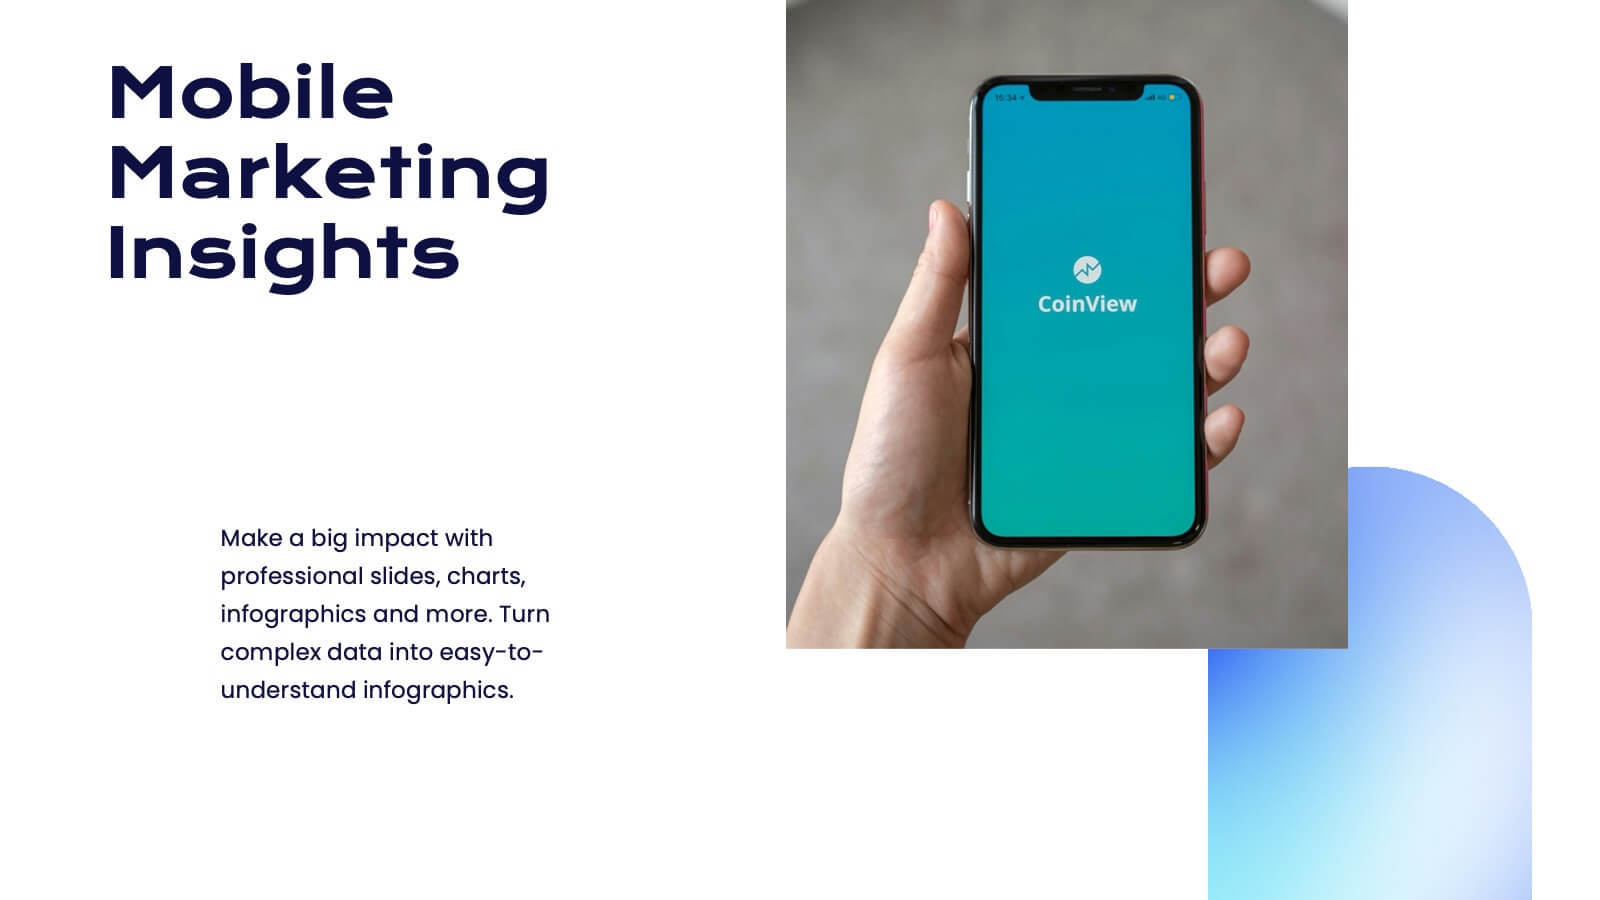
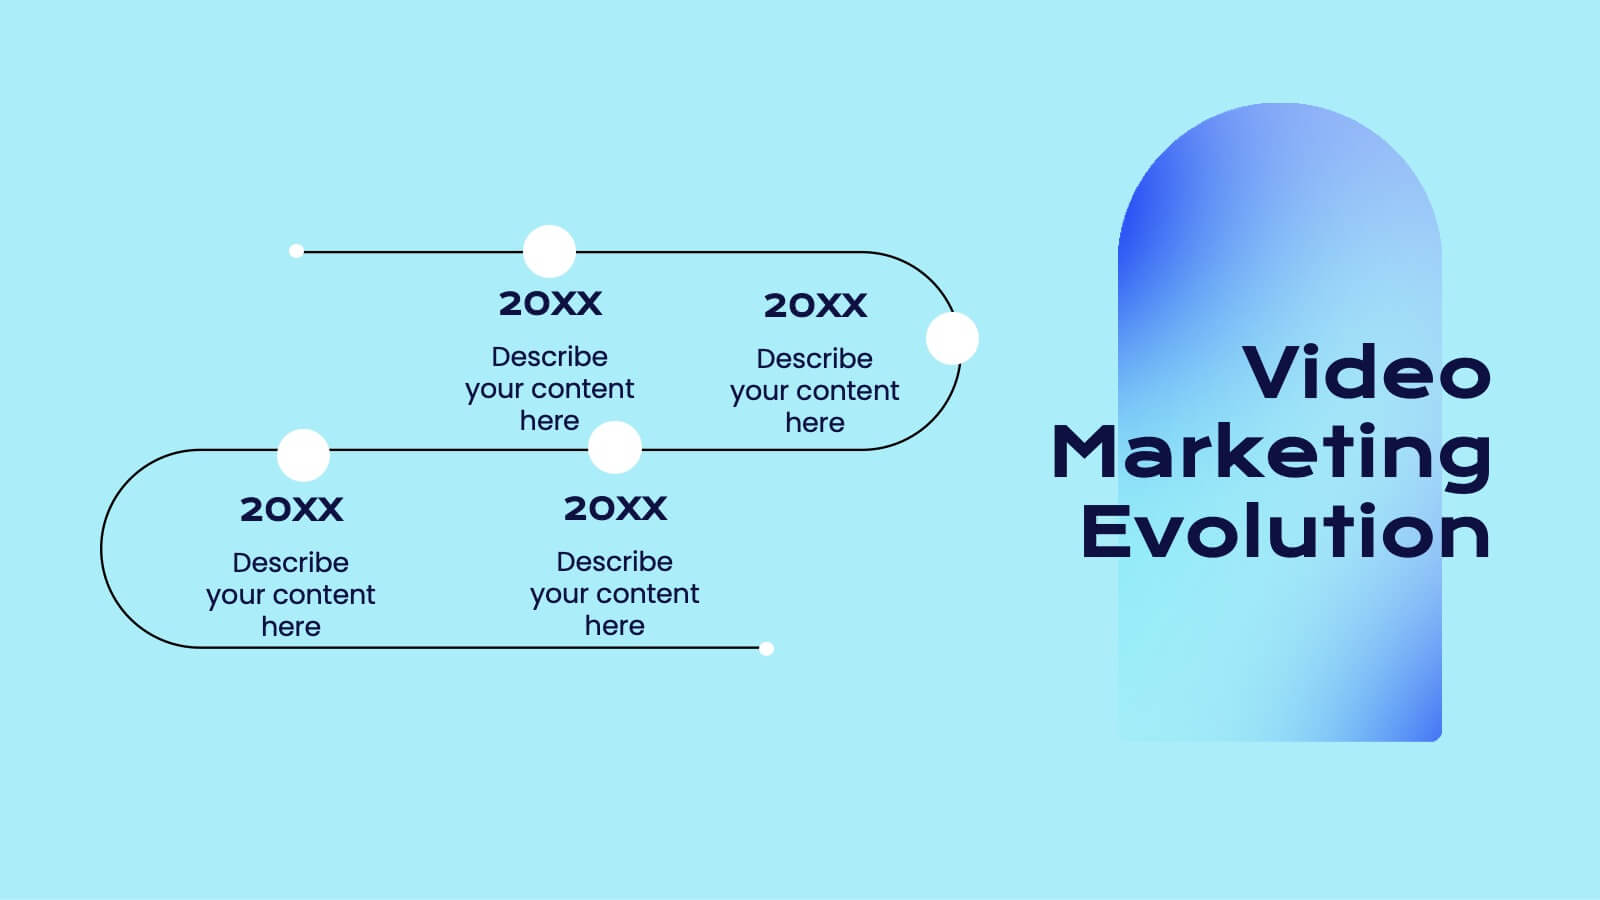
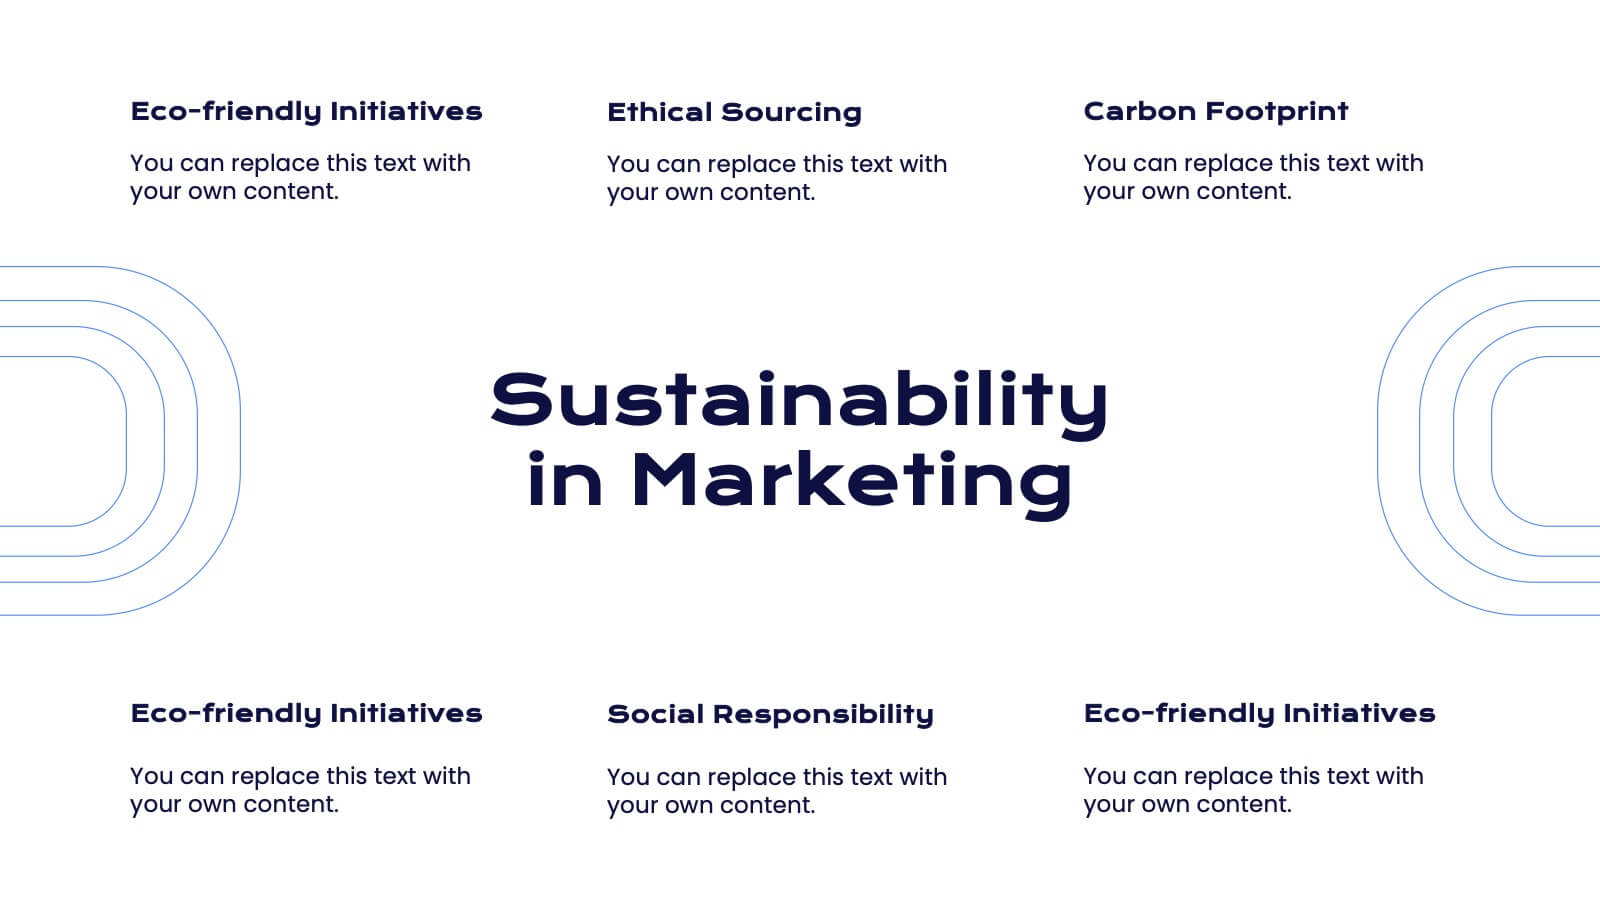
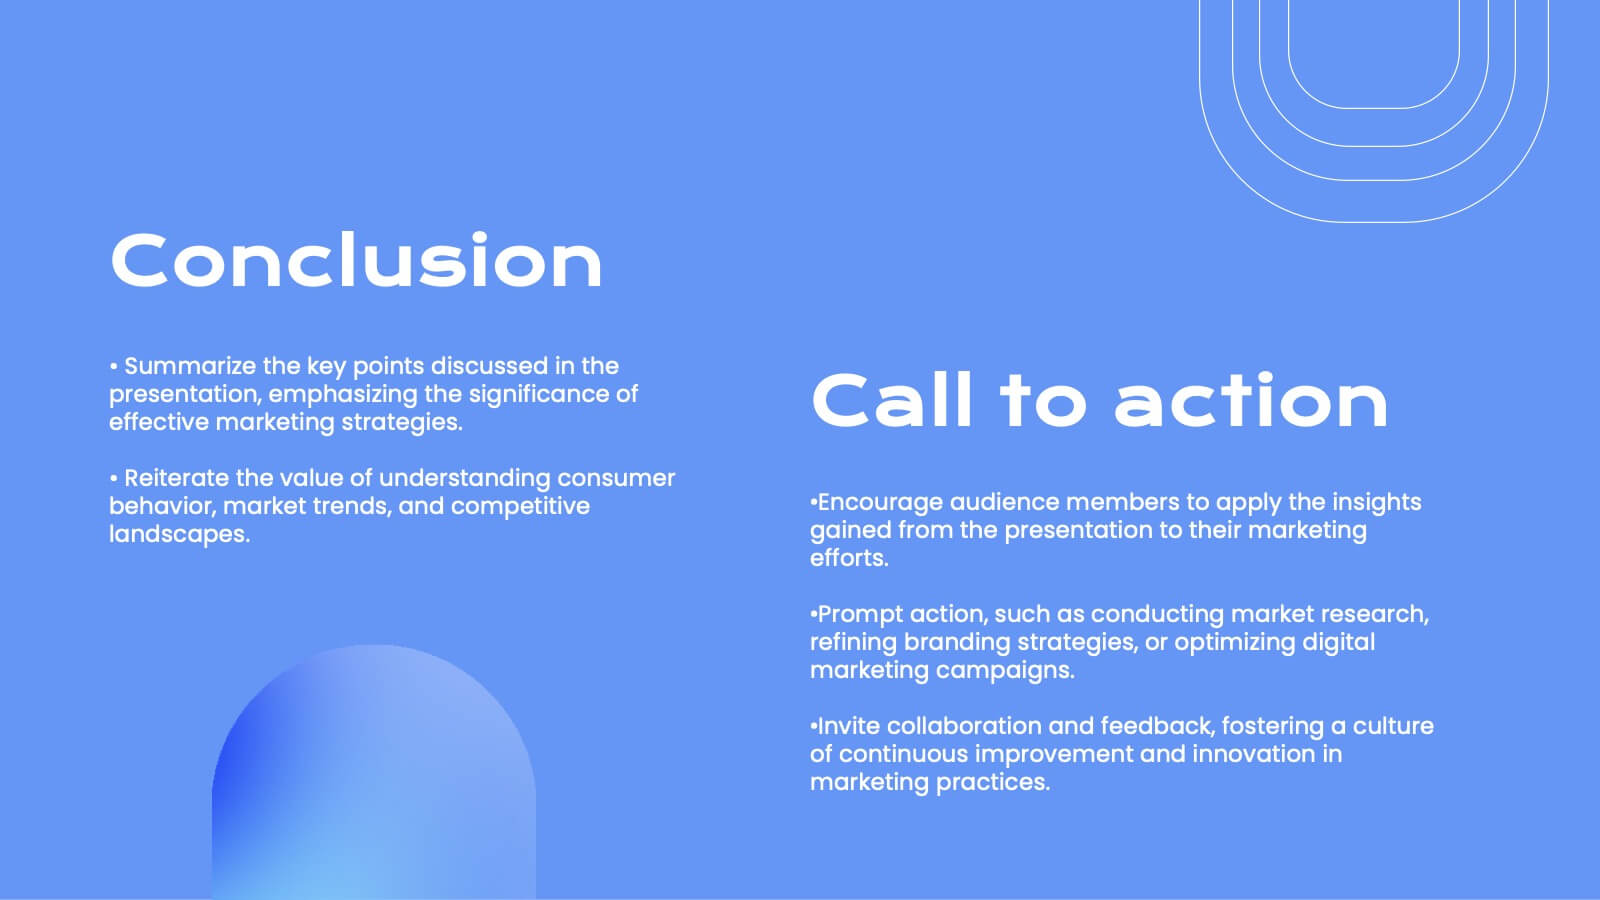
Faerie Digital Marketing Strategy Plan Presentation
Create a compelling marketing strategy with this sleek, modern template! It covers key topics like consumer behavior, social media strategies, and emerging trends. Perfect for showcasing insights in a clear, data-driven format. Fully customizable, it works seamlessly with PowerPoint, Keynote, and Google Slides for effective presentations.


23 diapositivas
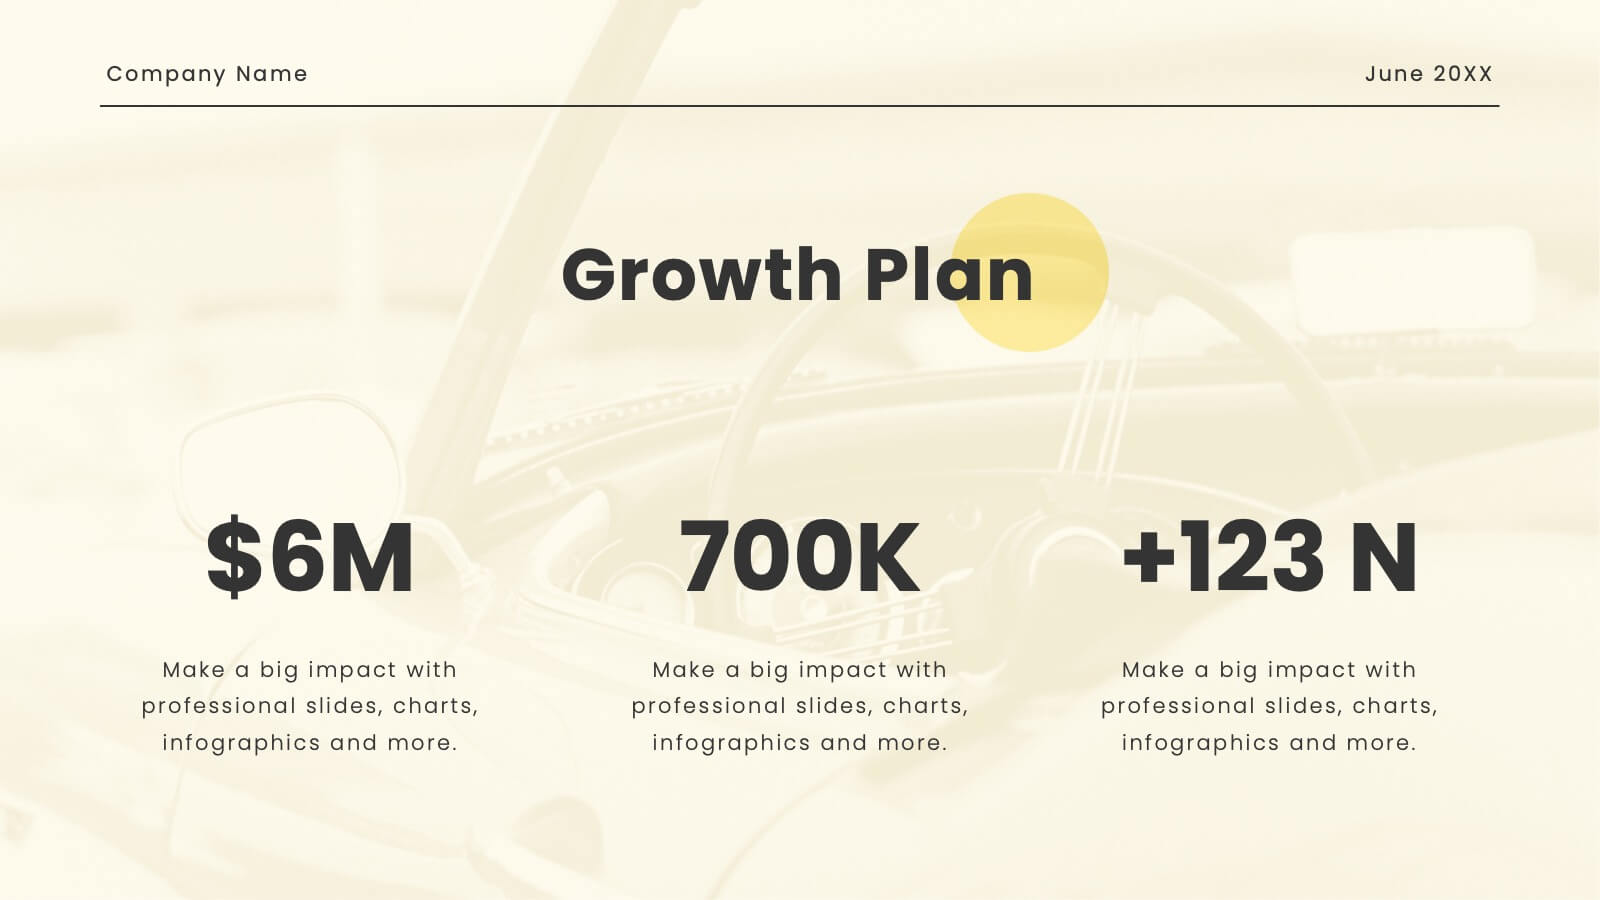
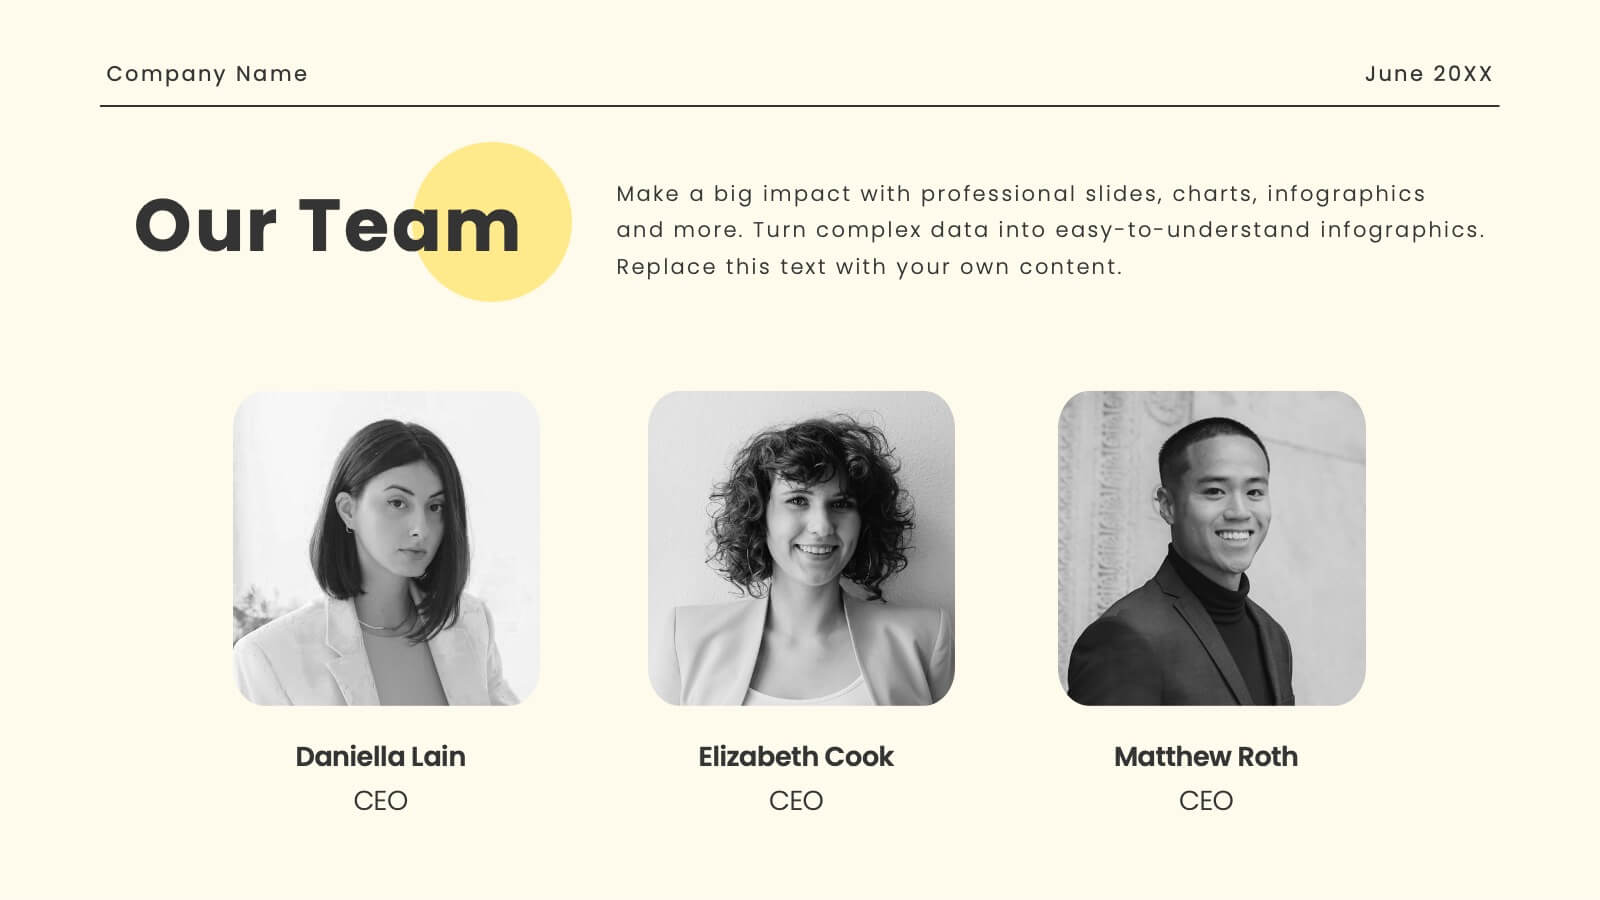
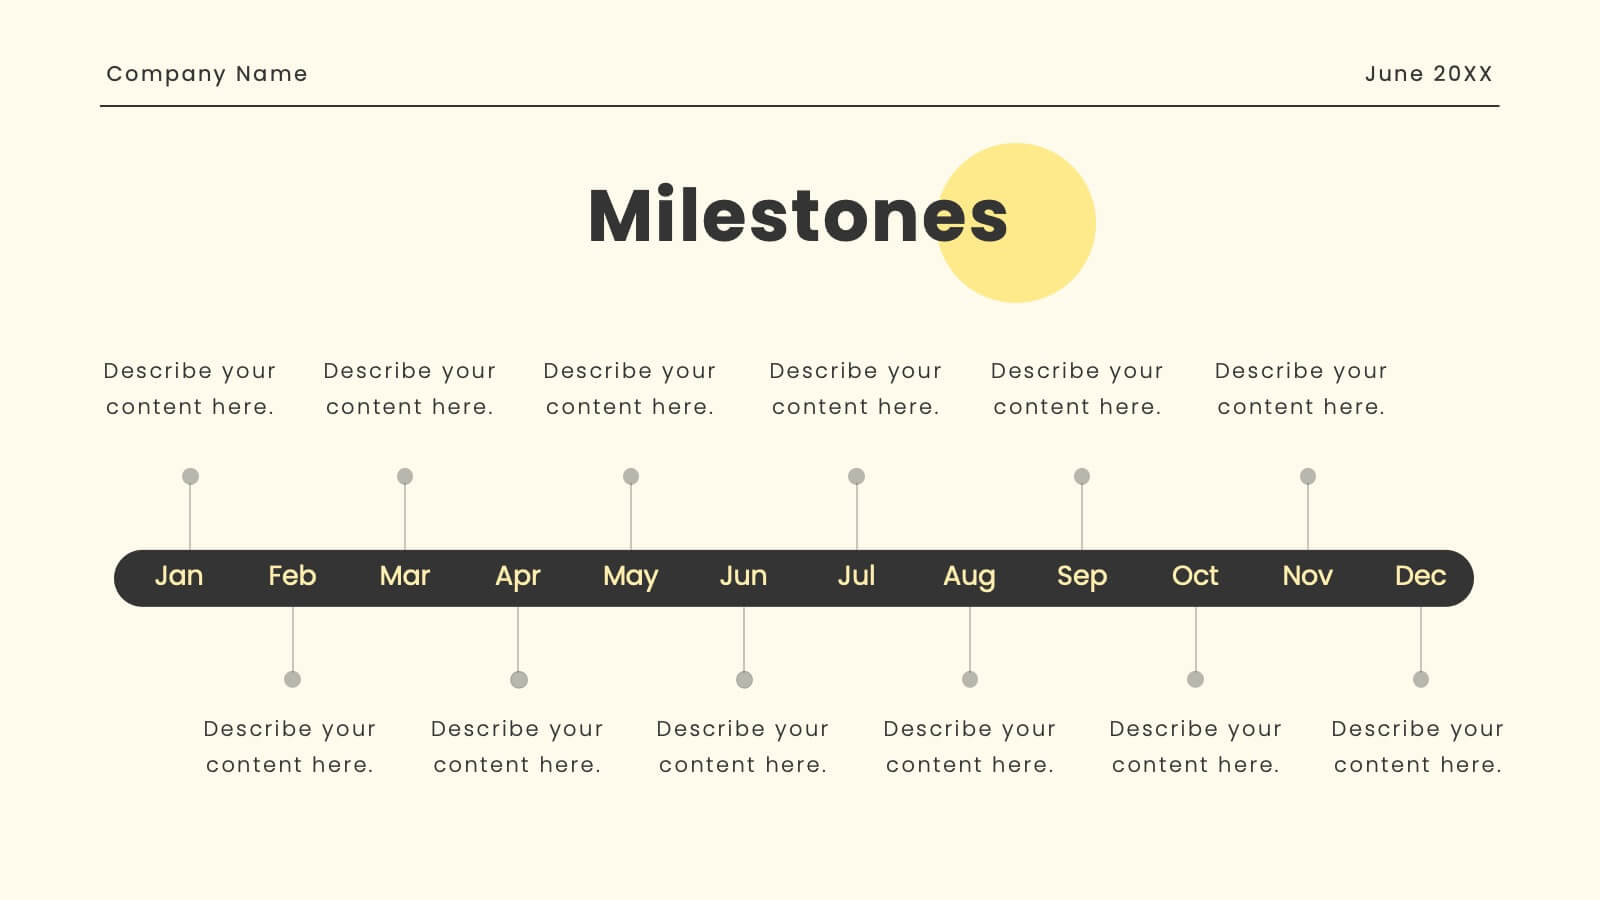
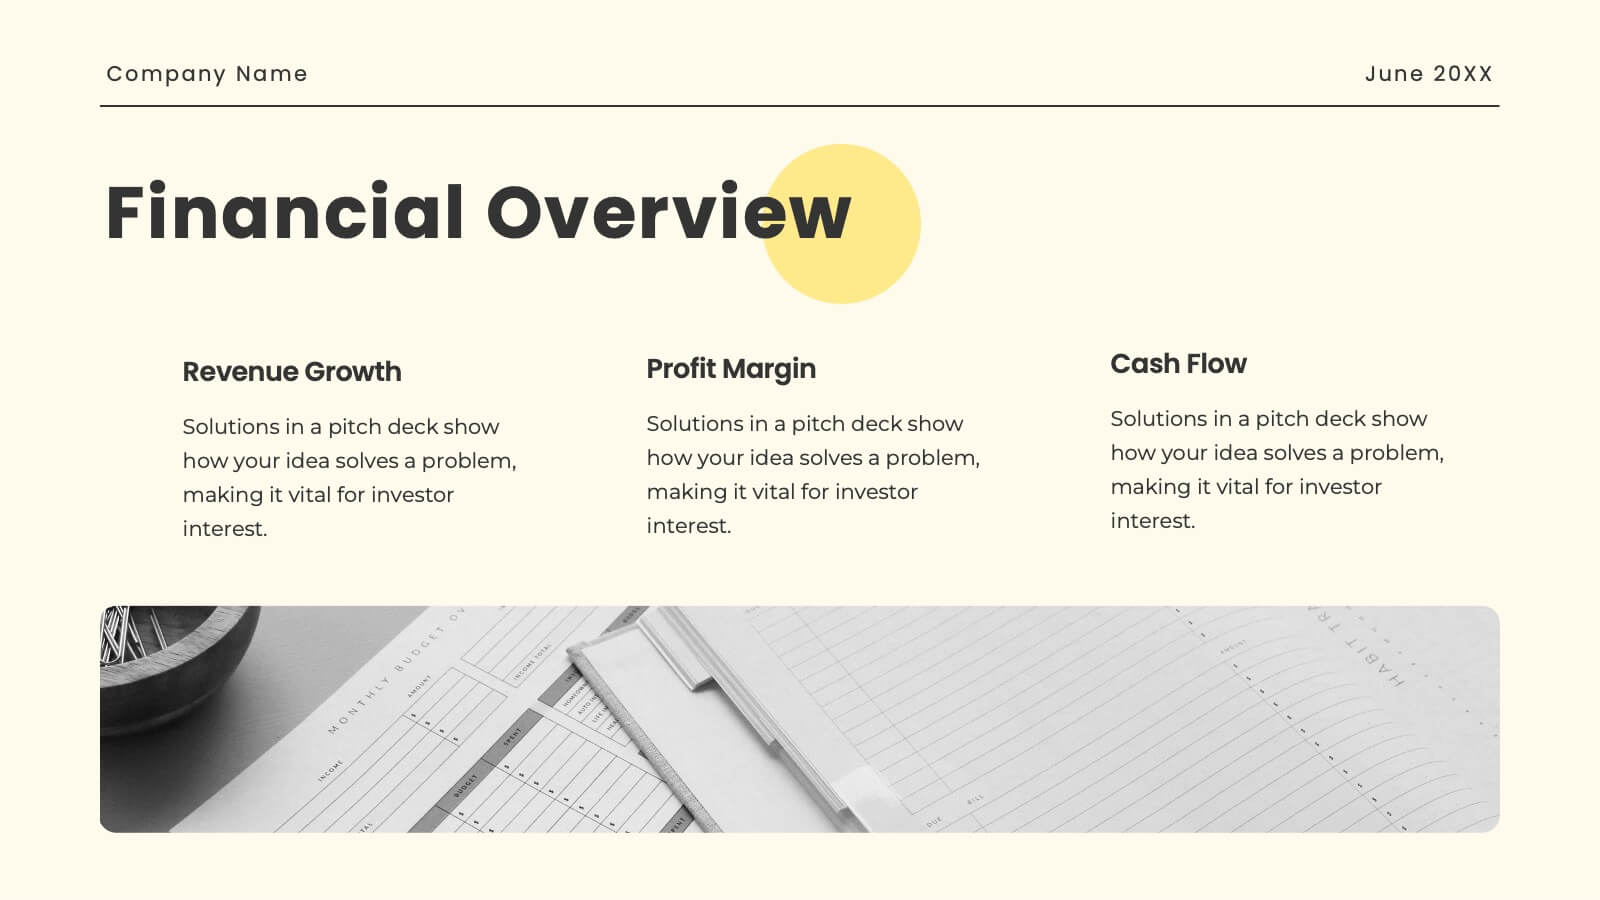
Wave Small Business Pitch Deck Presentation
This business pitch deck is your key to winning over investors! It covers everything from company background and product overview to SWOT analysis and market opportunity. With clear visuals of financial performance and strategic goals, this deck provides the perfect roadmap for success. Ideal for PowerPoint, Keynote, and Google Slides presentations!

22 diapositivas
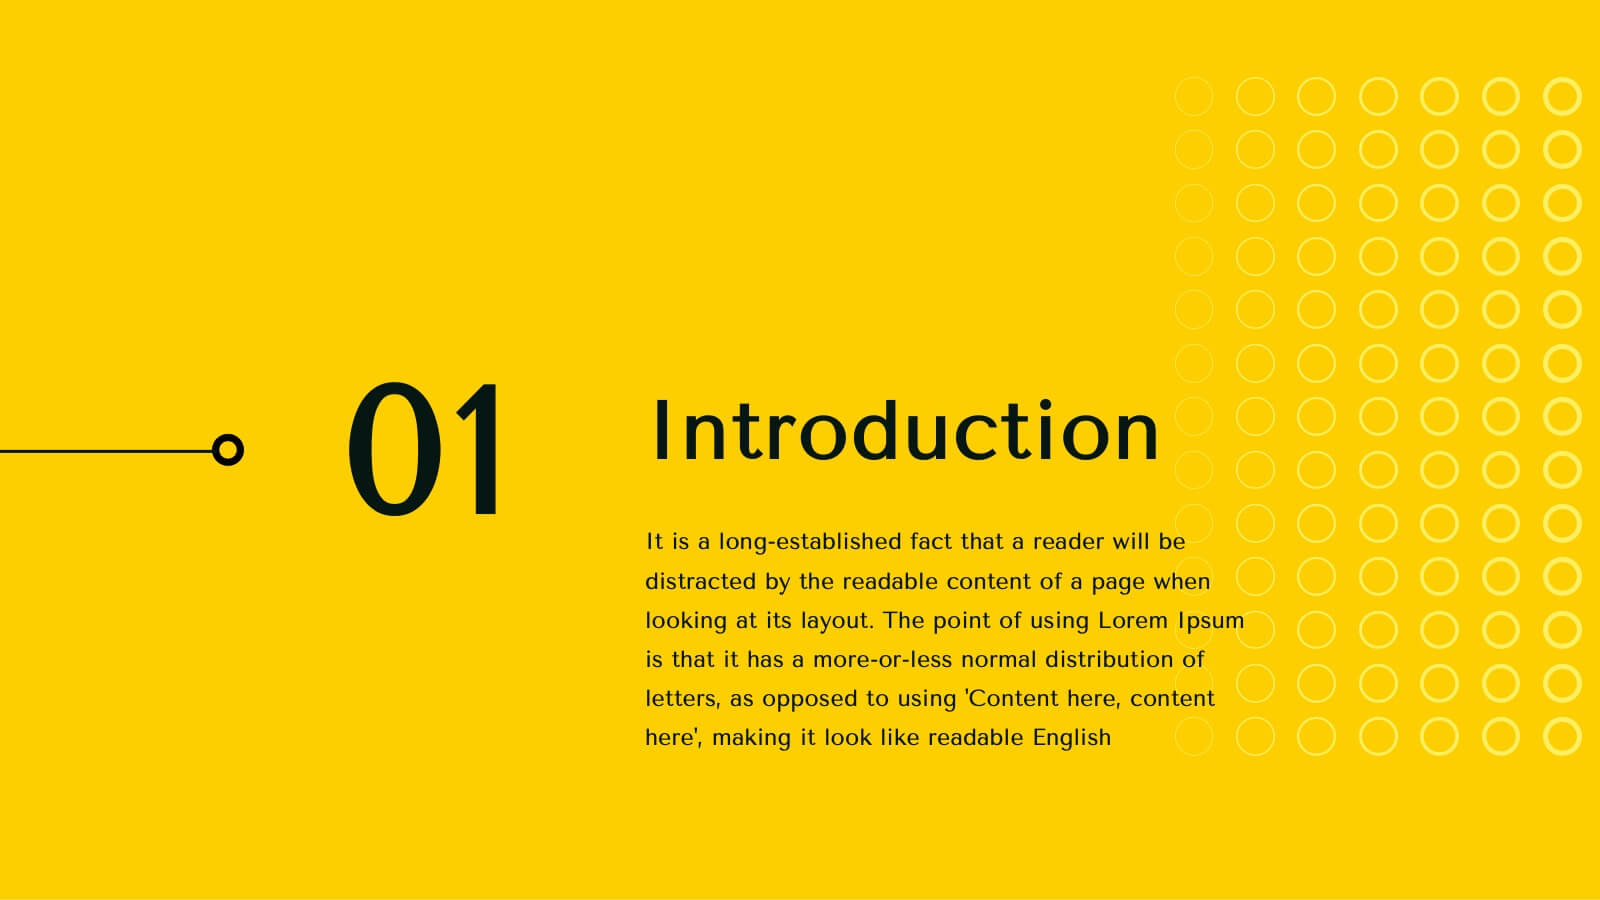
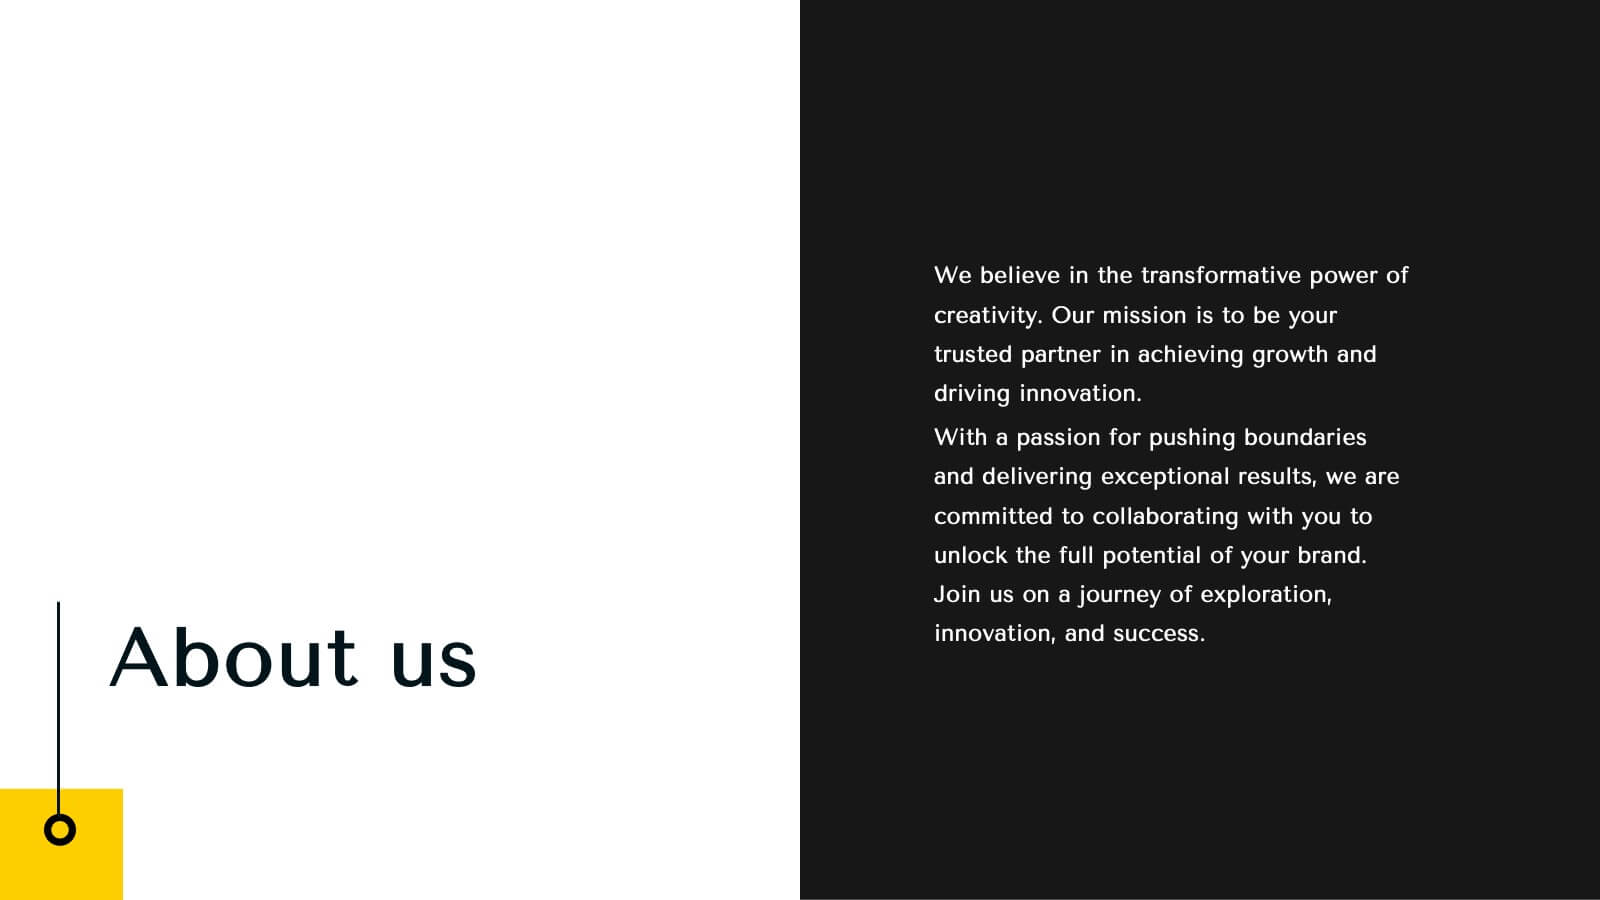
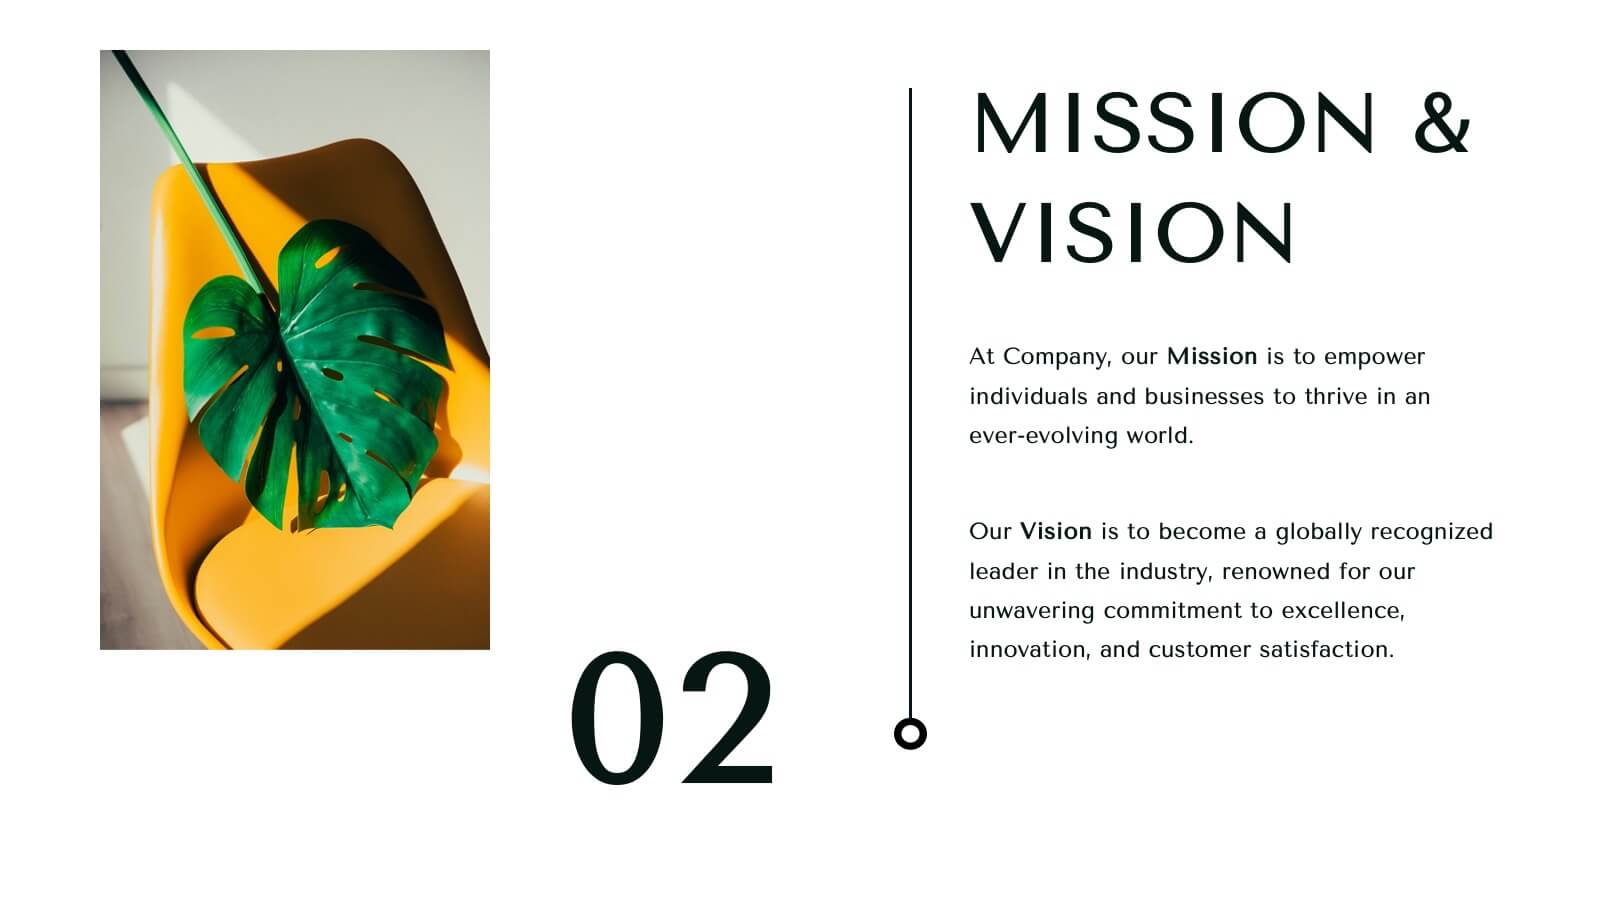
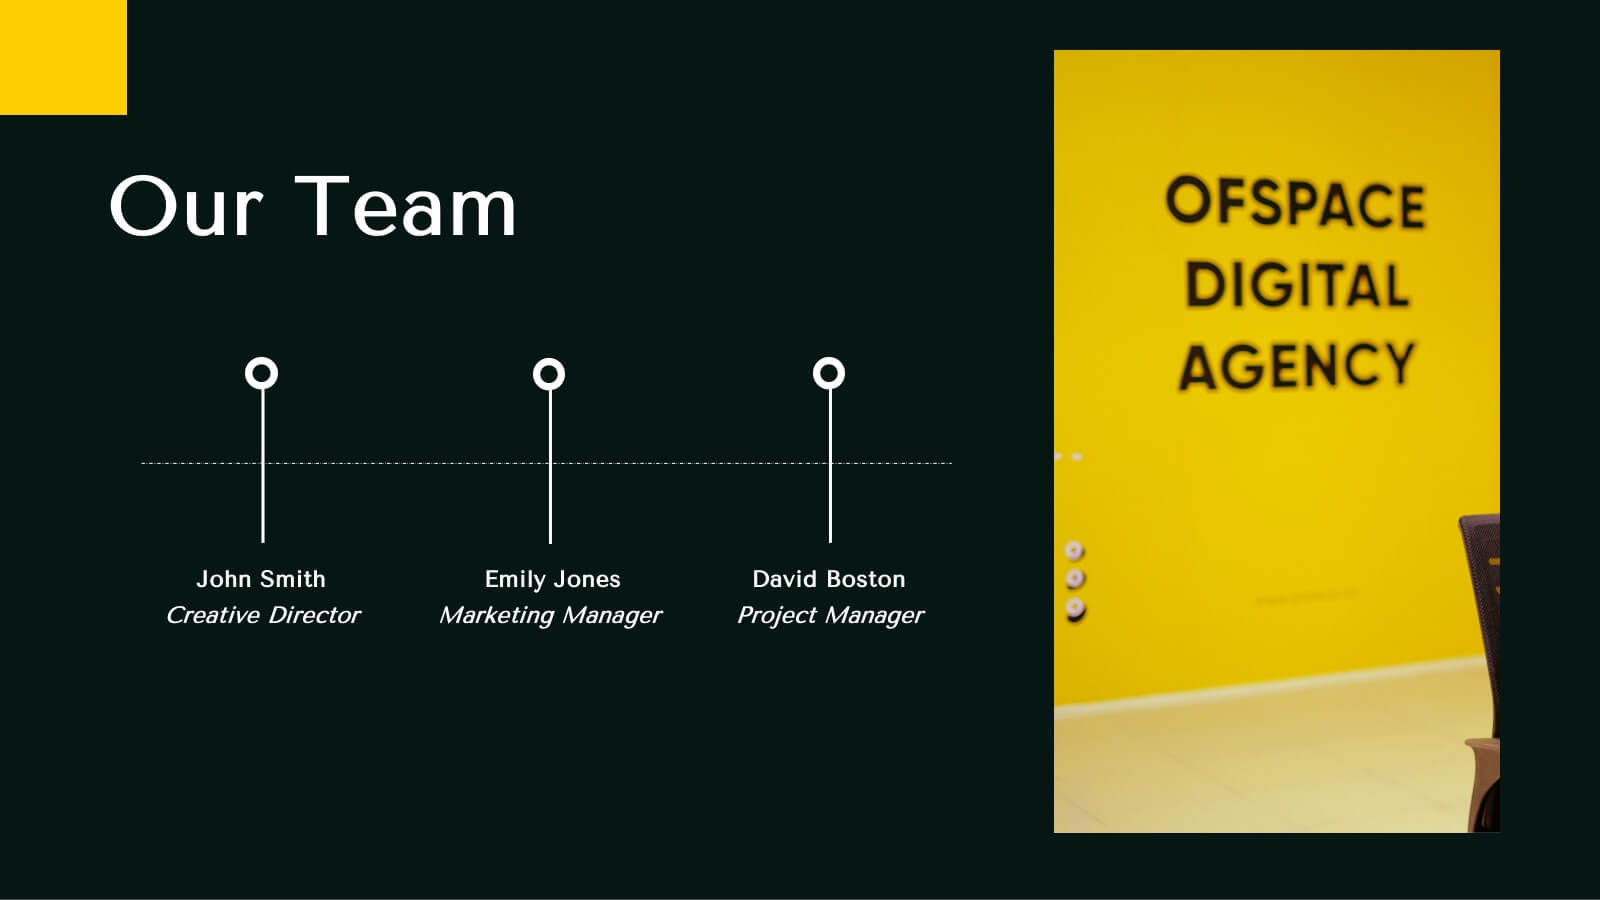
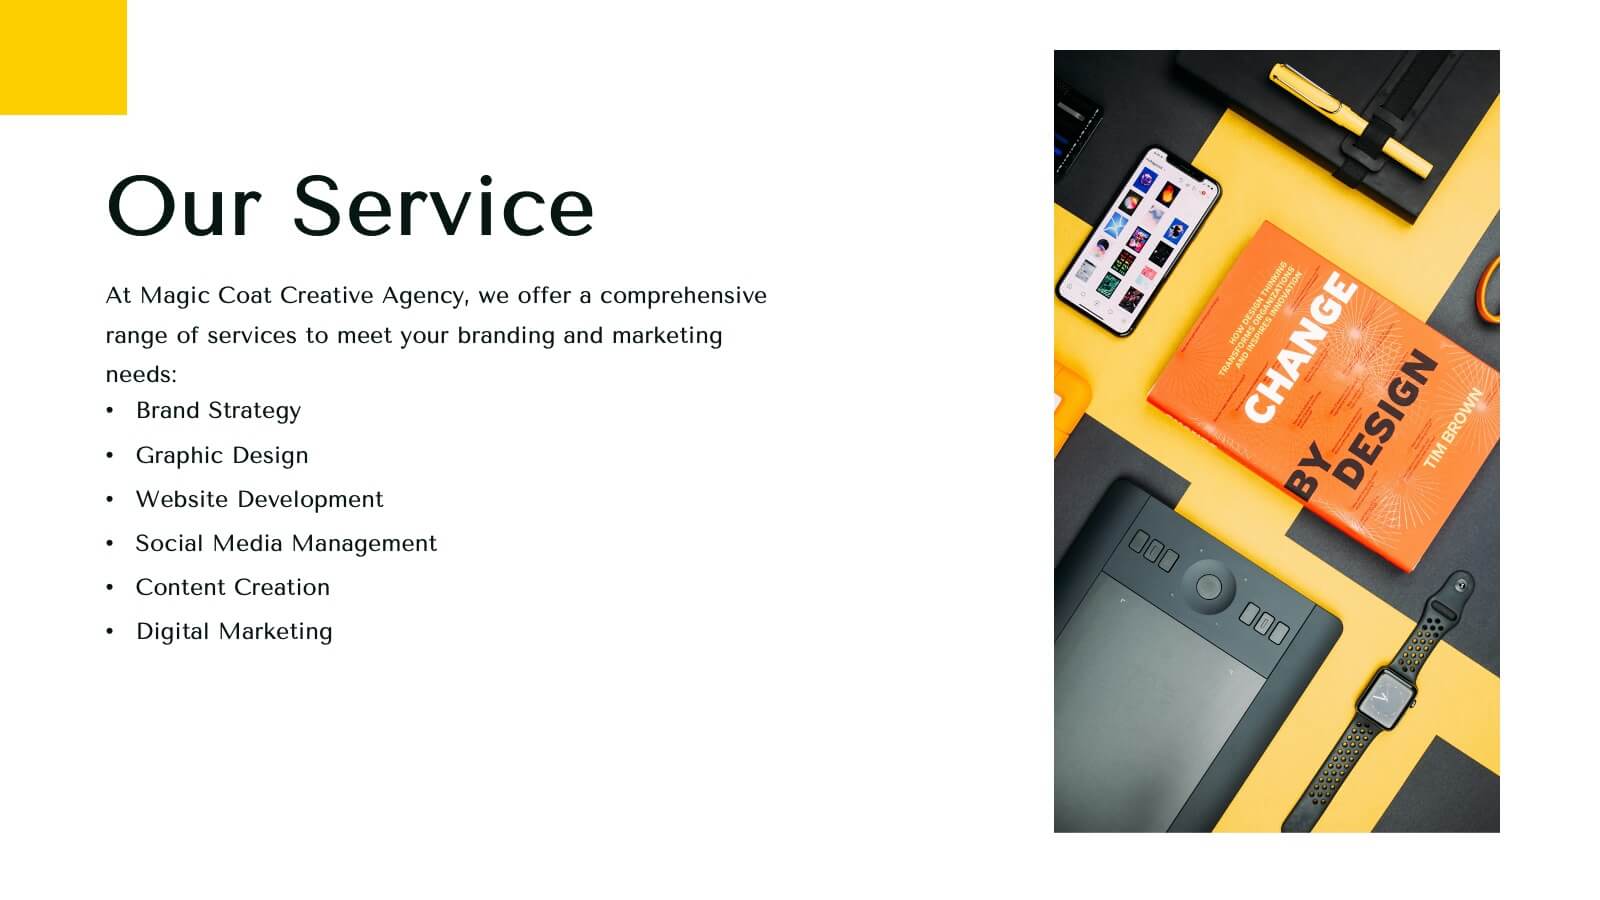
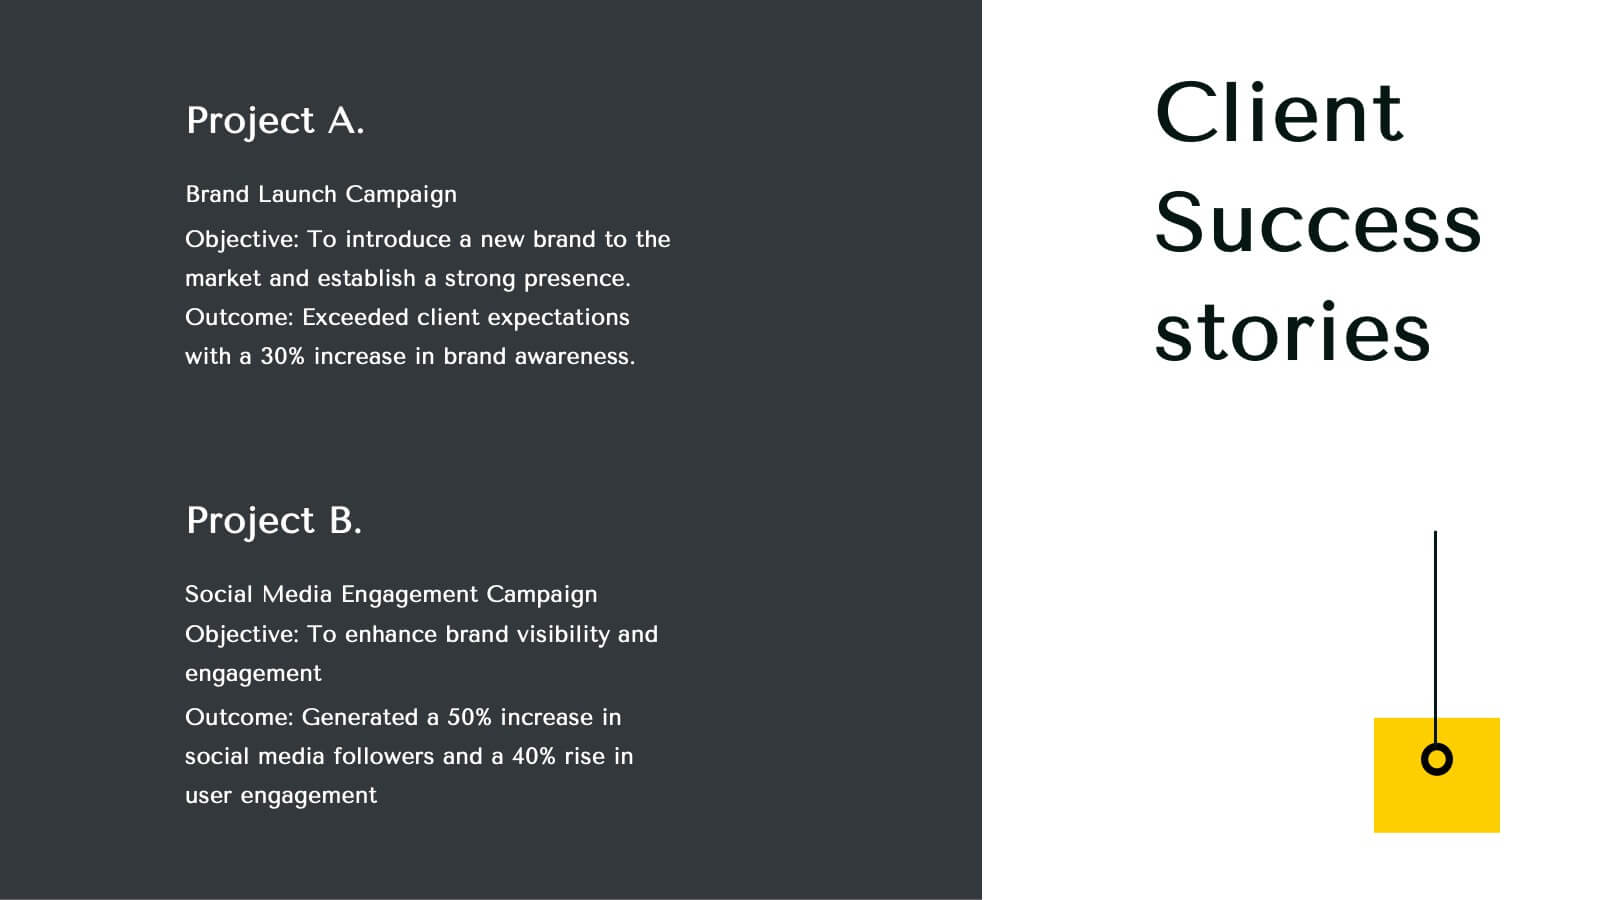
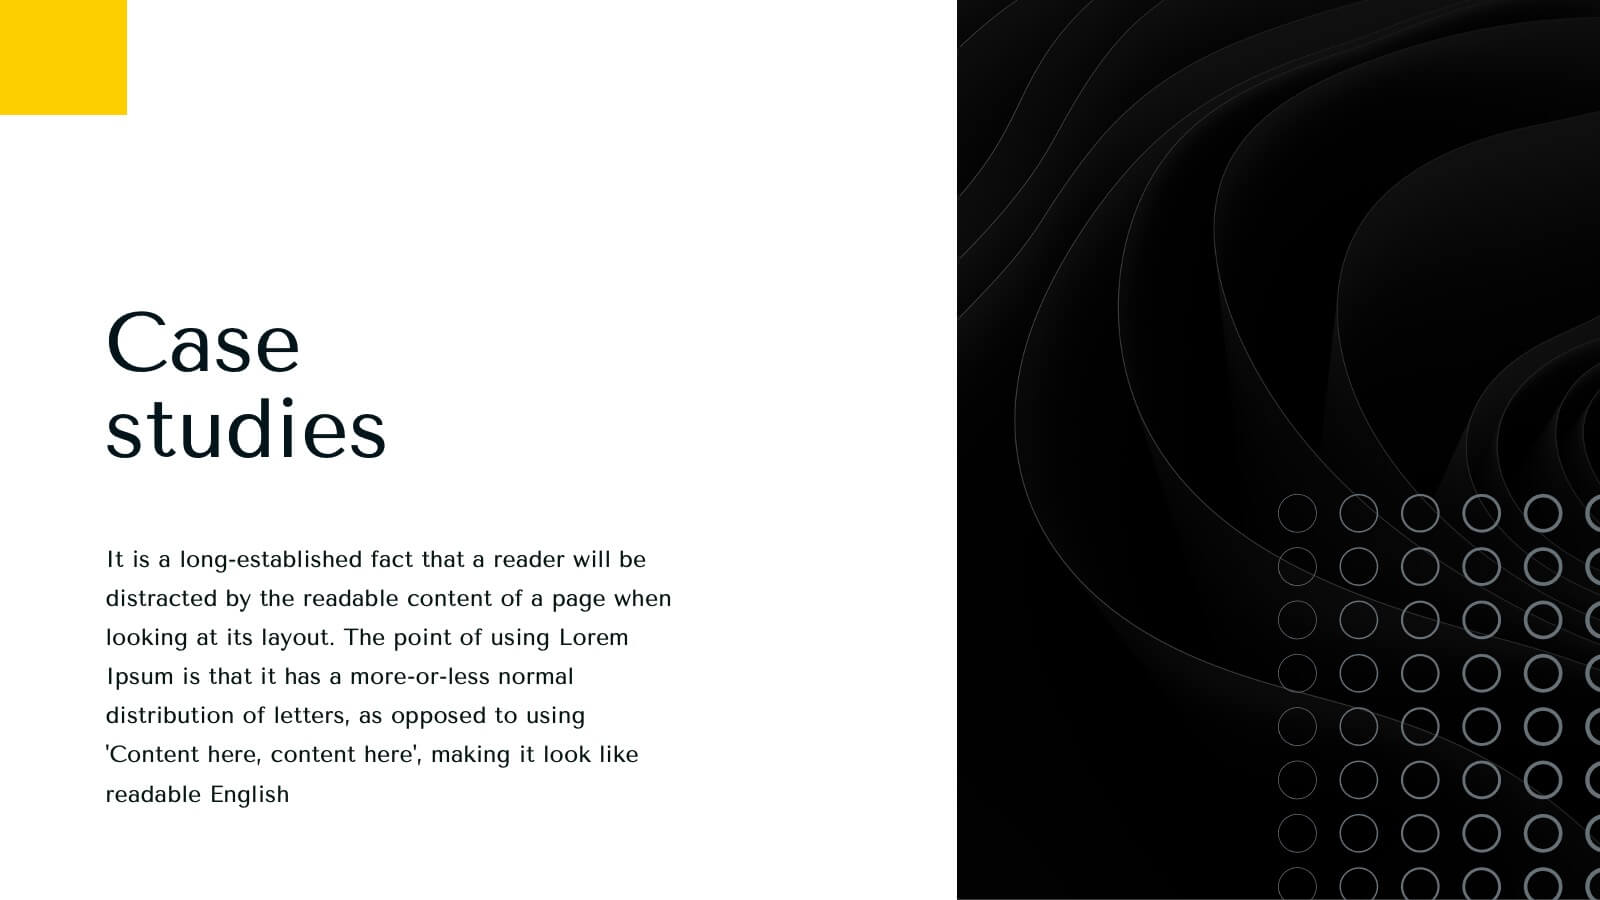
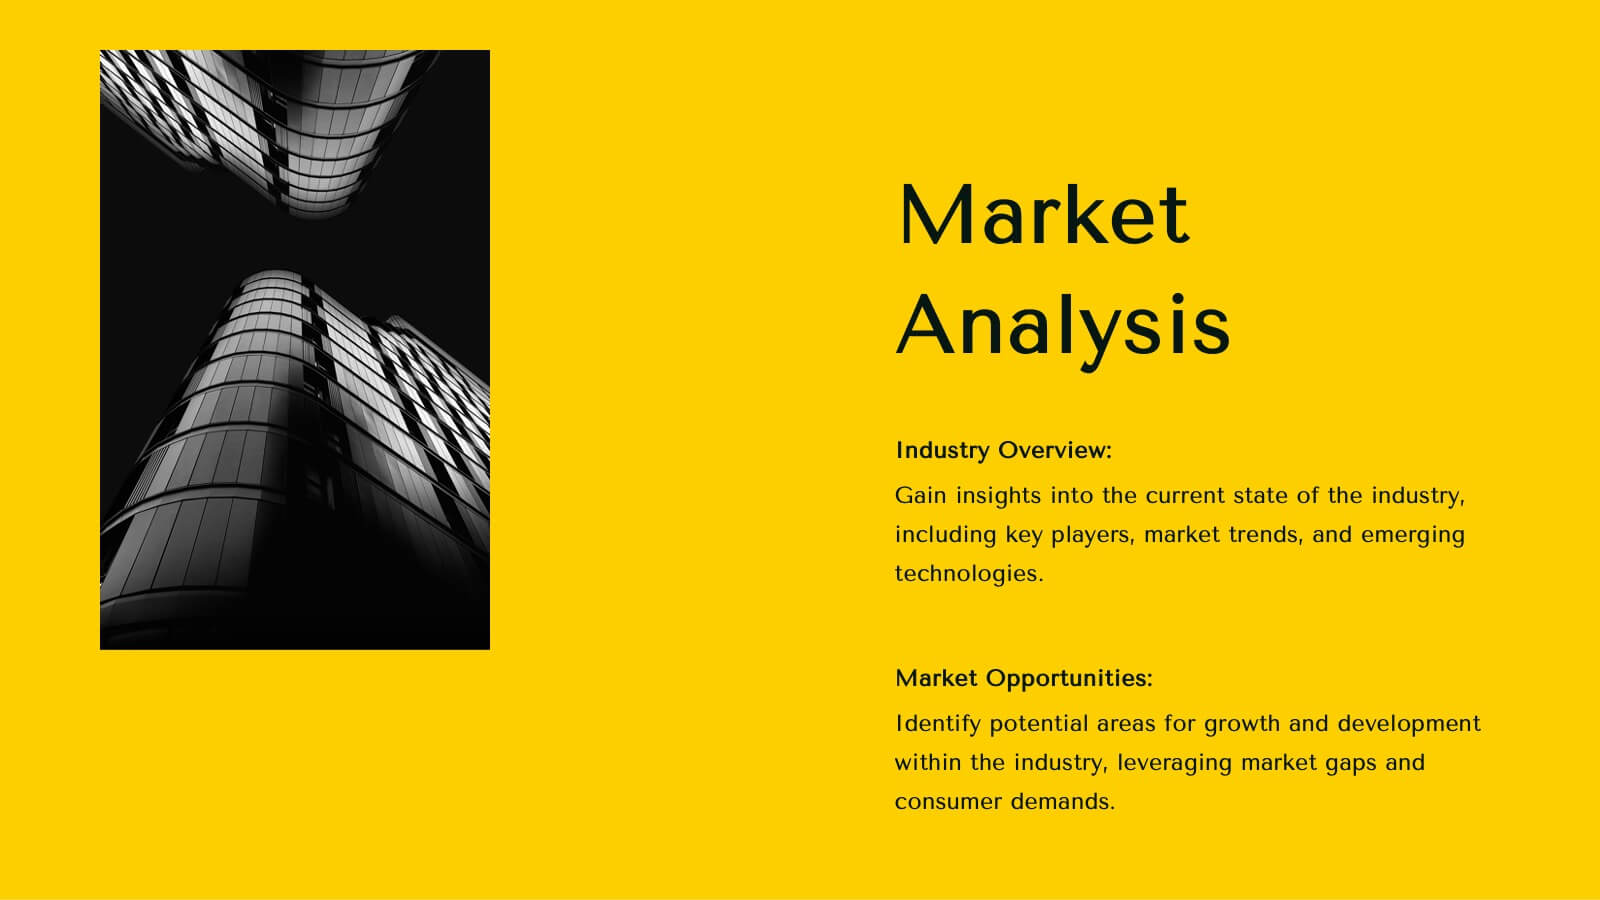
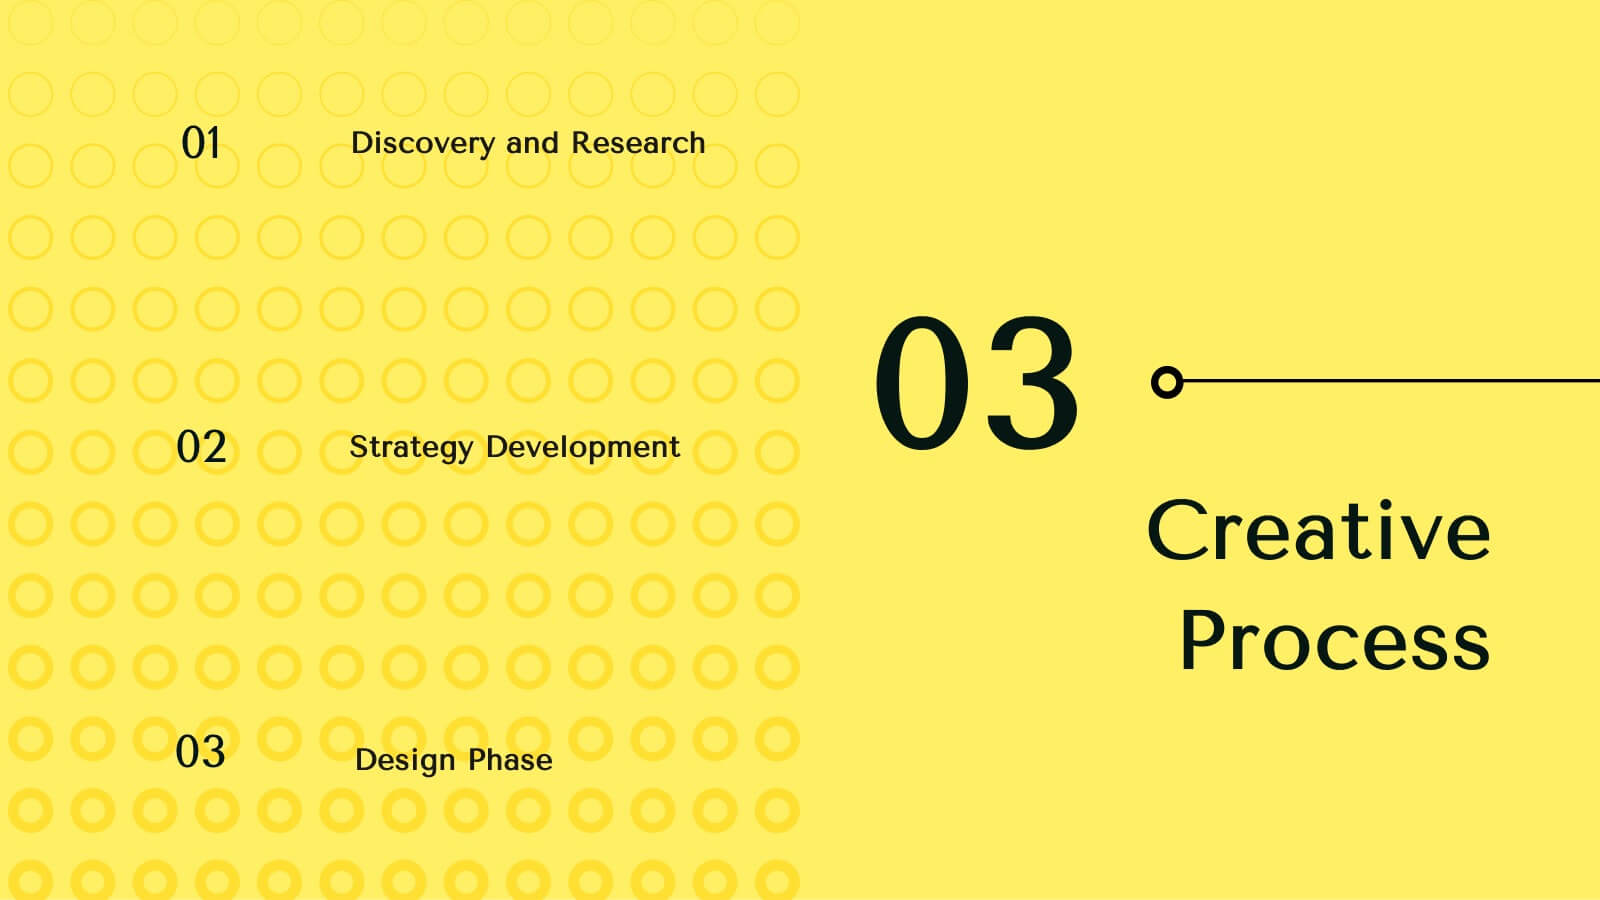
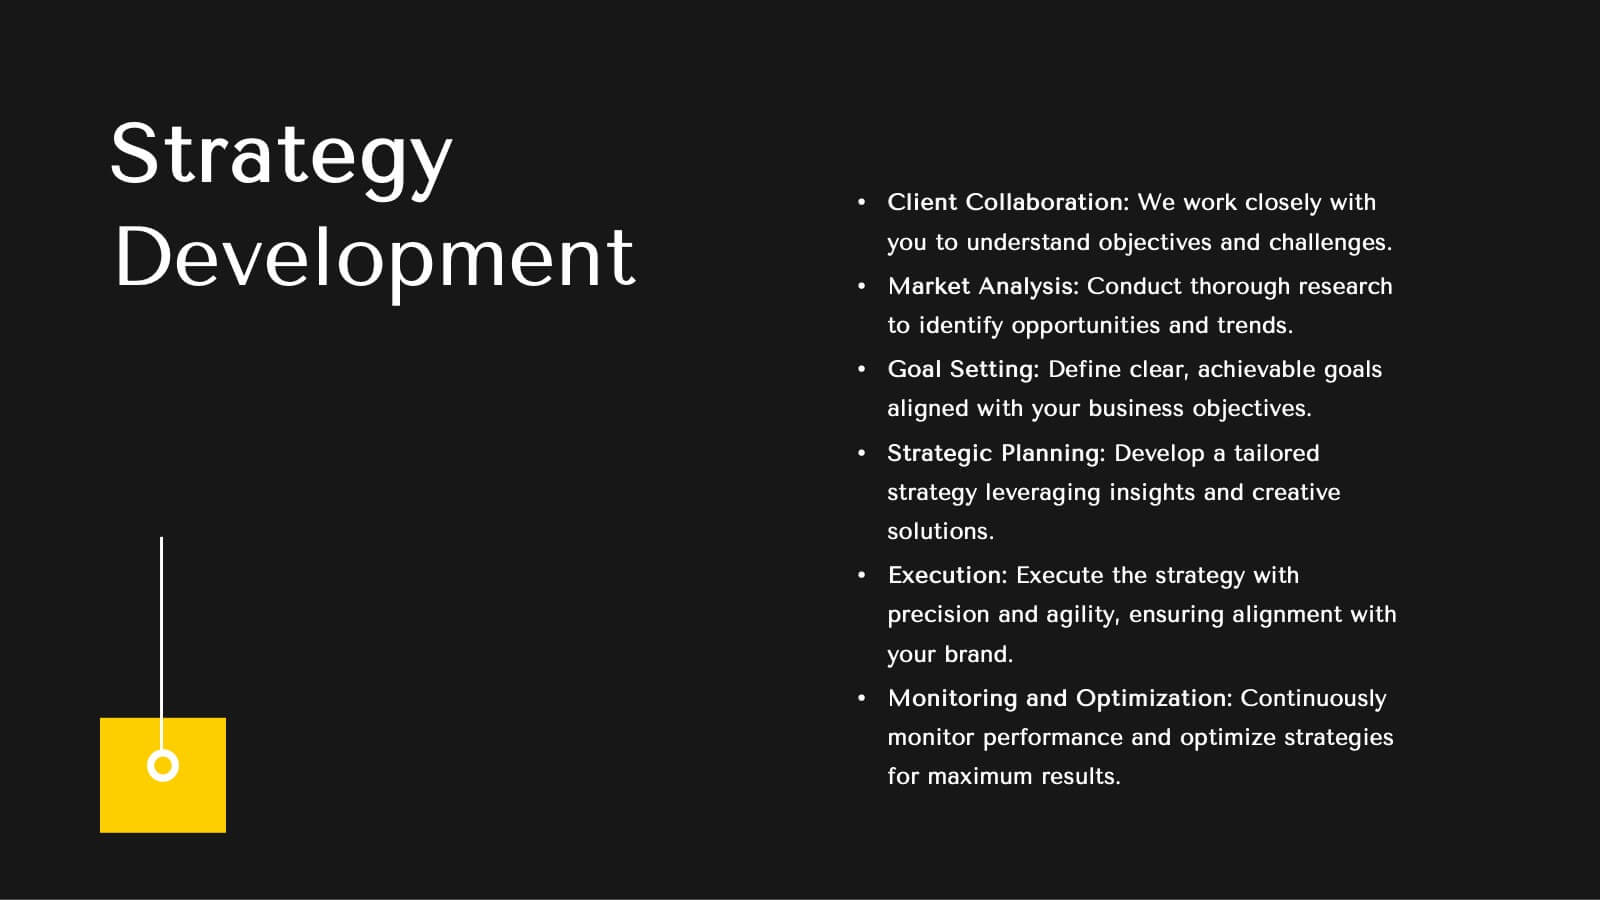
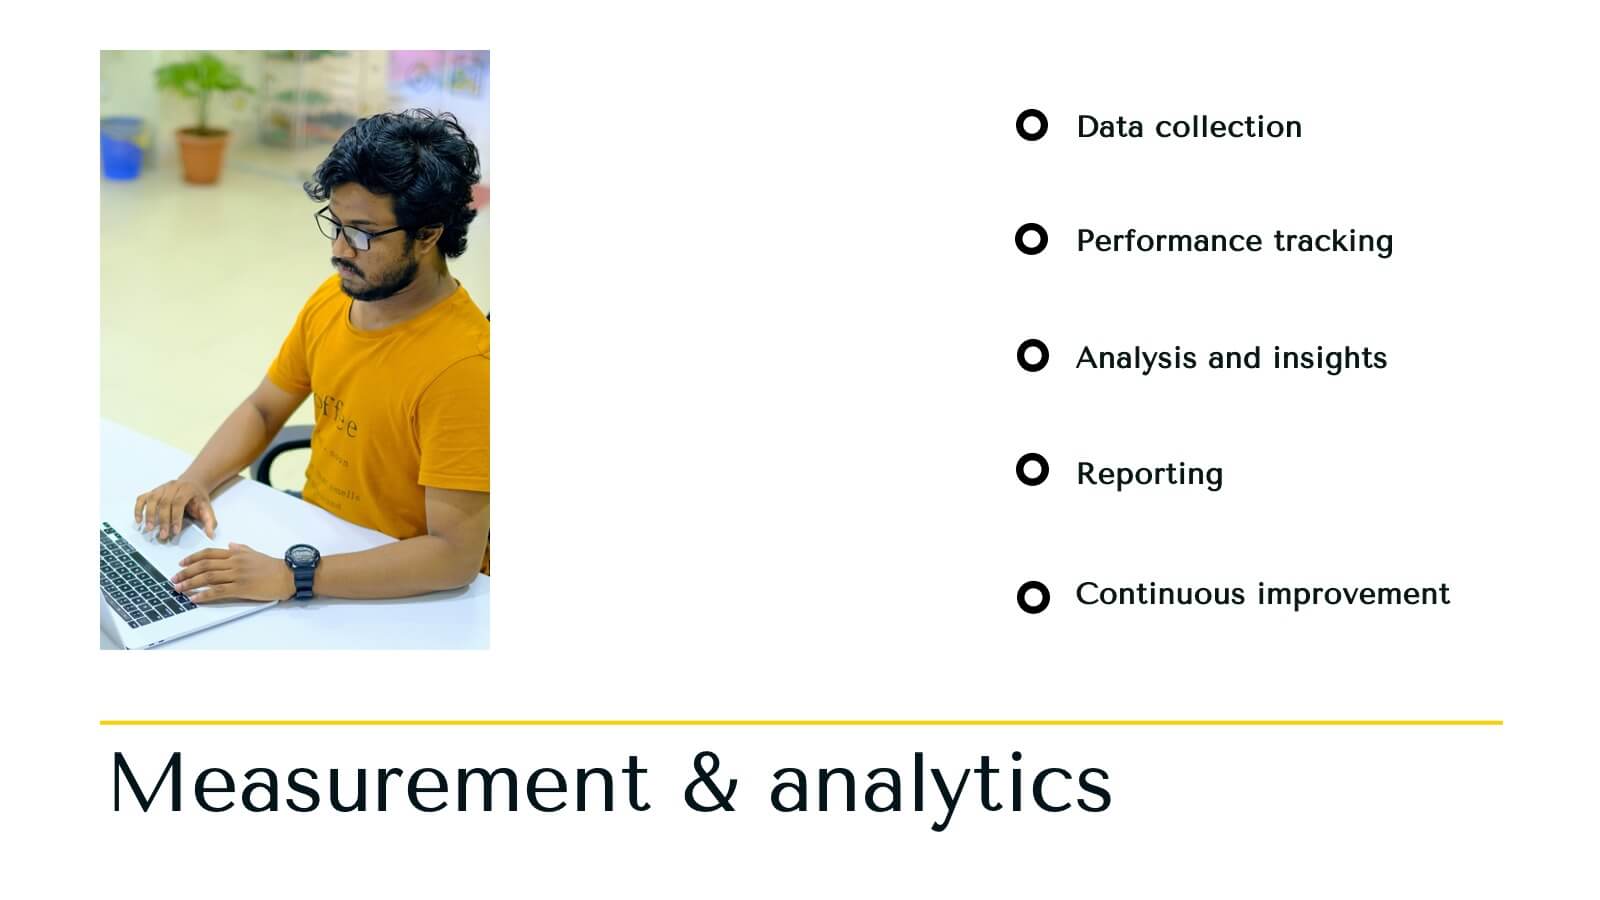
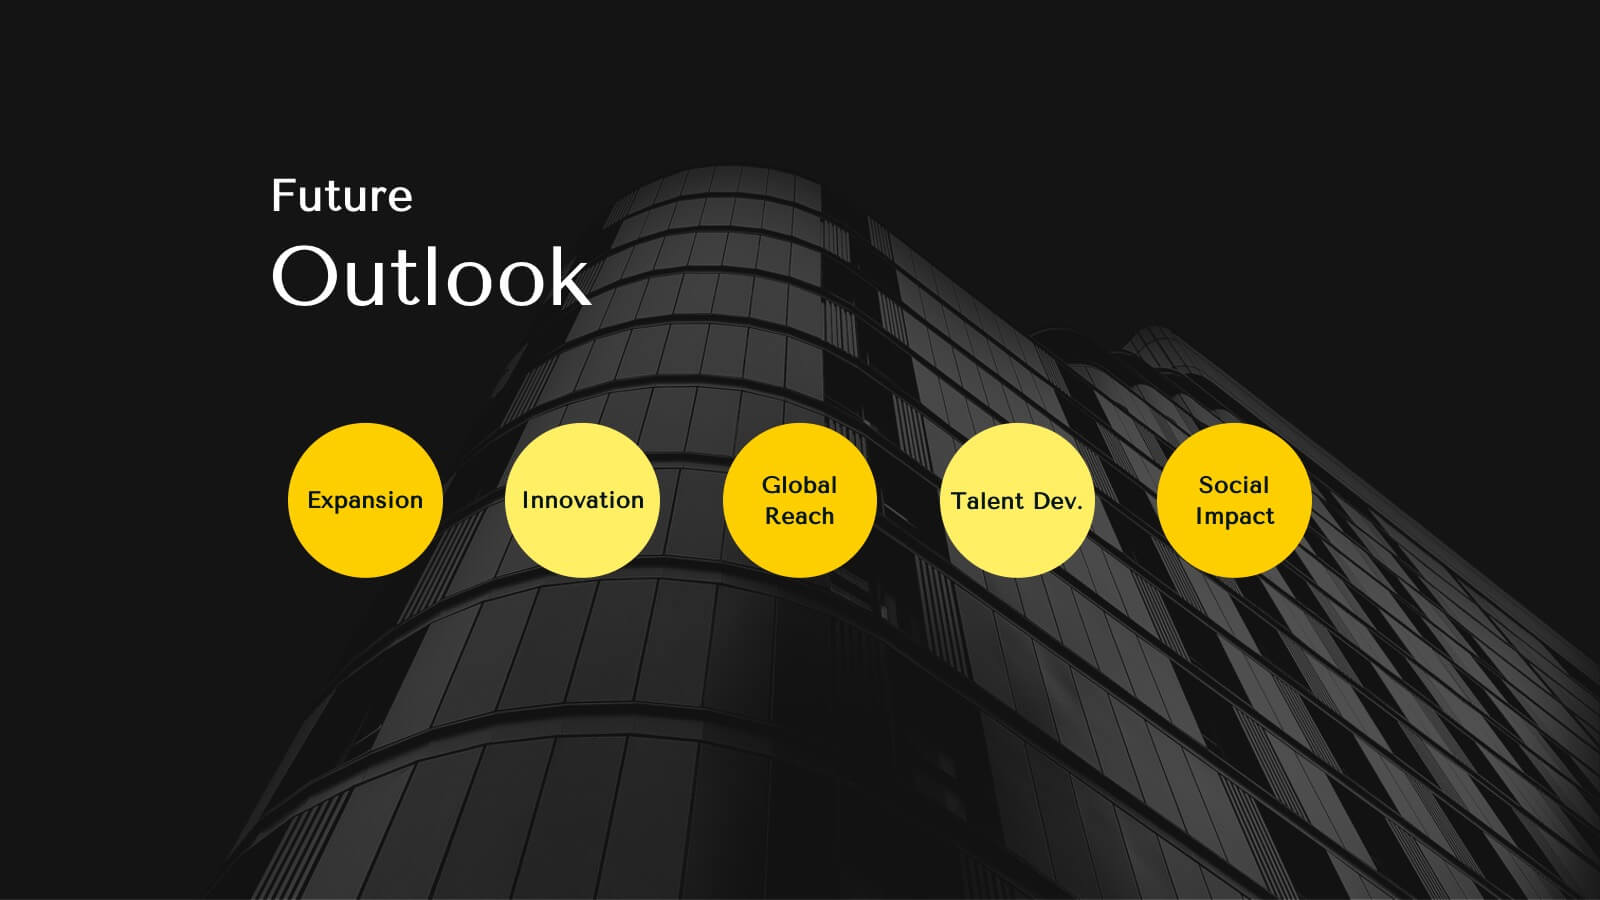
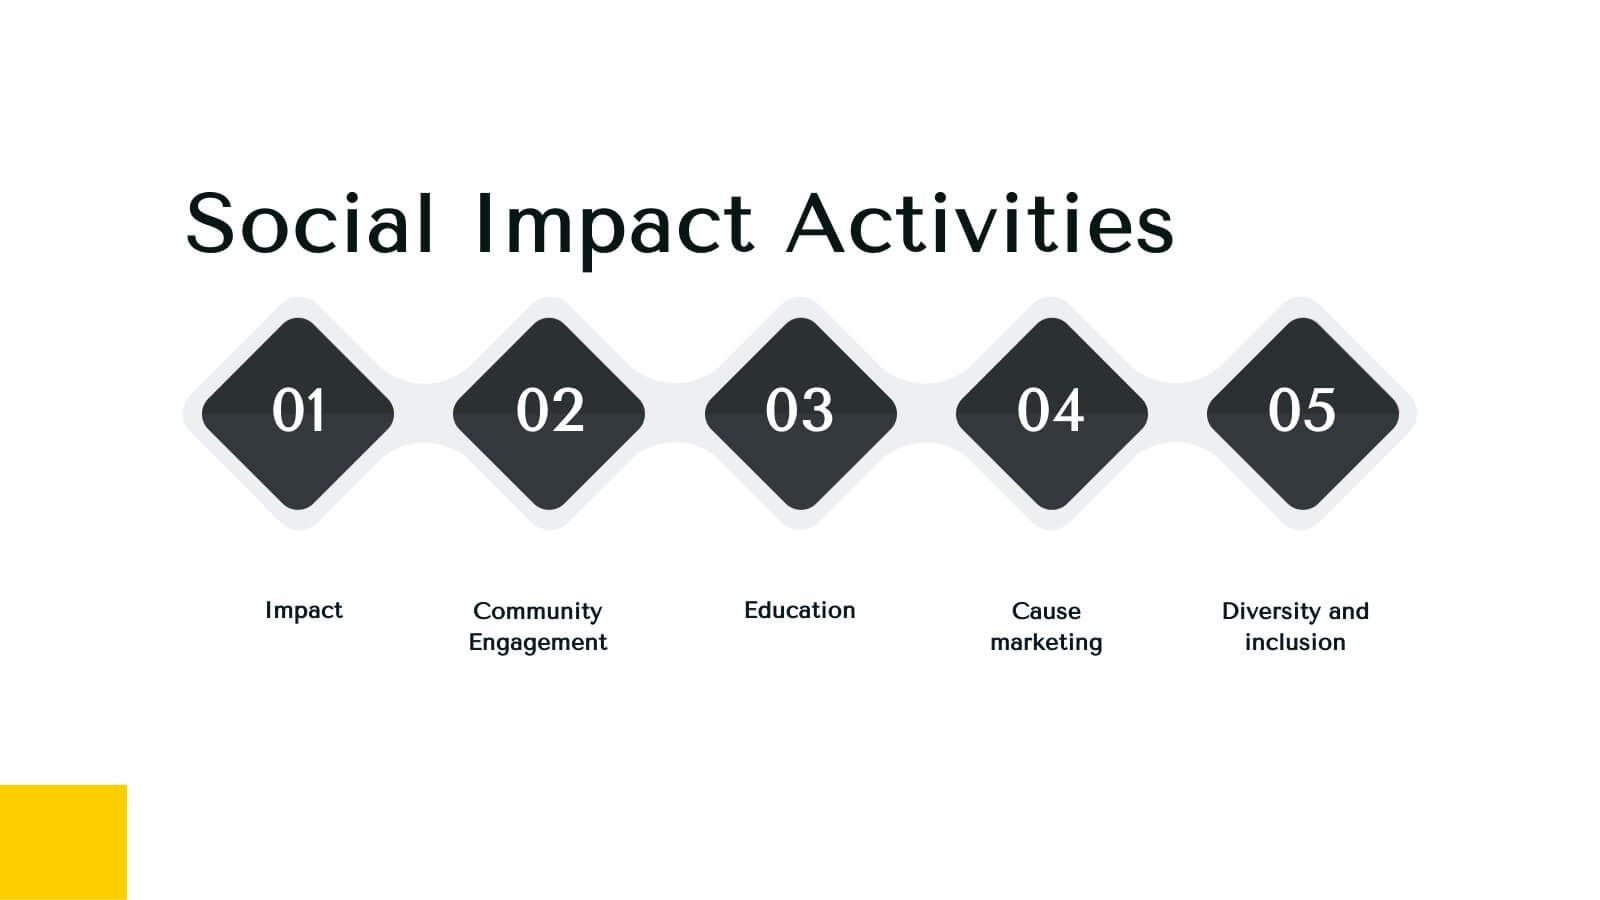
Infinity Agency Portfolio Presentation
Showcase your agency's excellence with this dynamic and modern presentation template. Ideal for presenting market analysis, client success stories, and strategic development plans, it features a bold design with a vibrant yellow and black theme. Highlight your unique approach and creative process to captivate your audience. Compatible with PowerPoint, Keynote, and Google Slides, it's perfect for any platform.


21 diapositivas
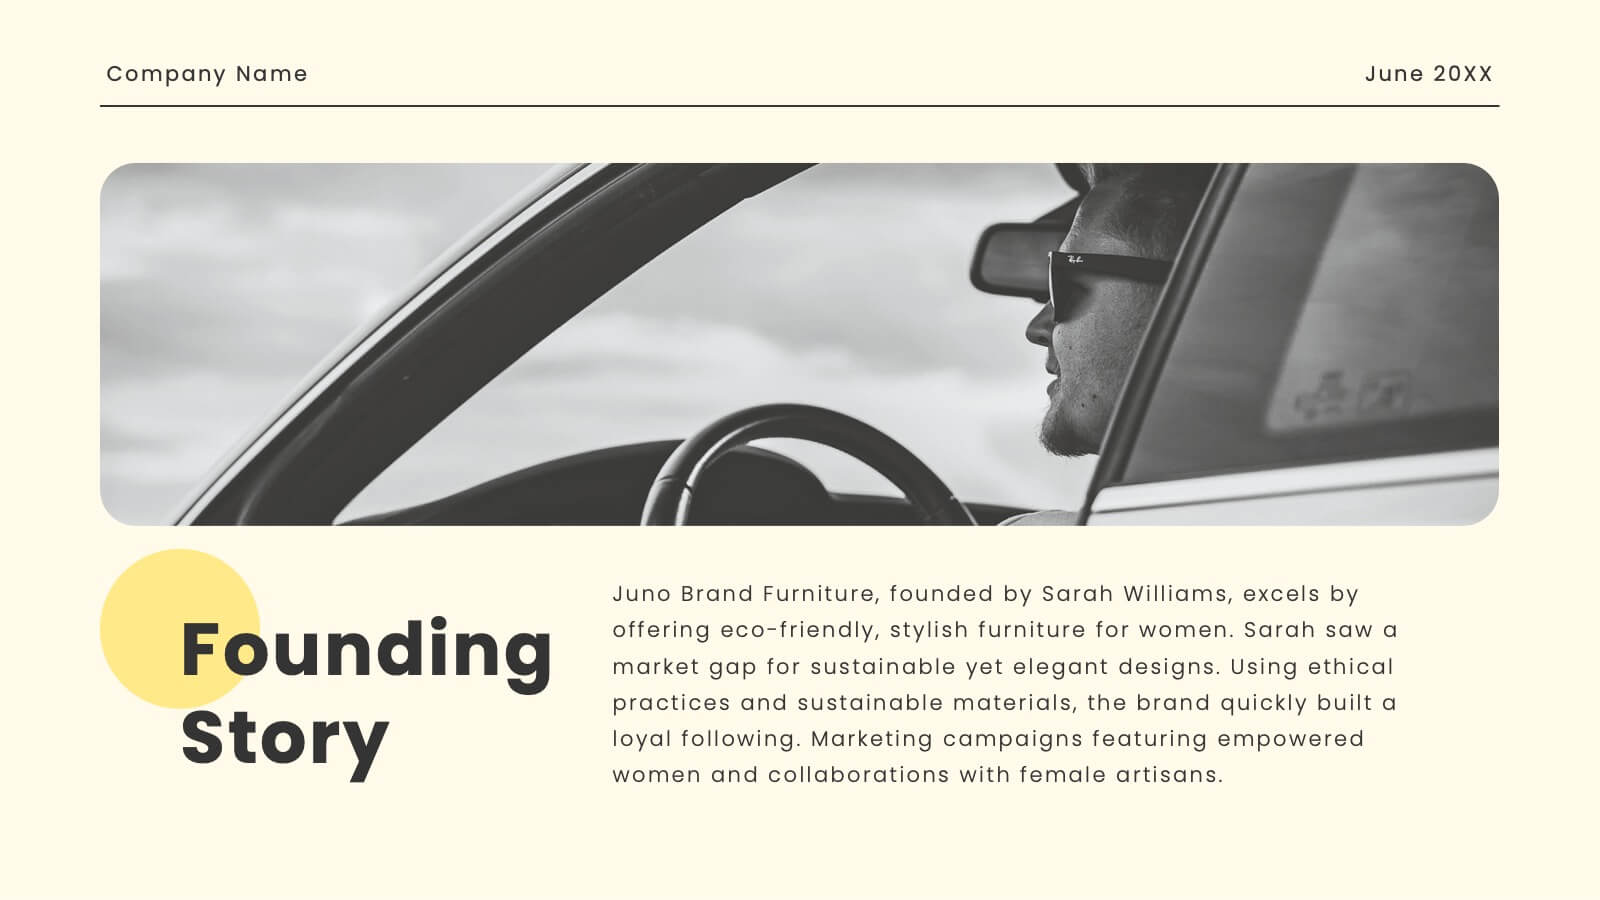
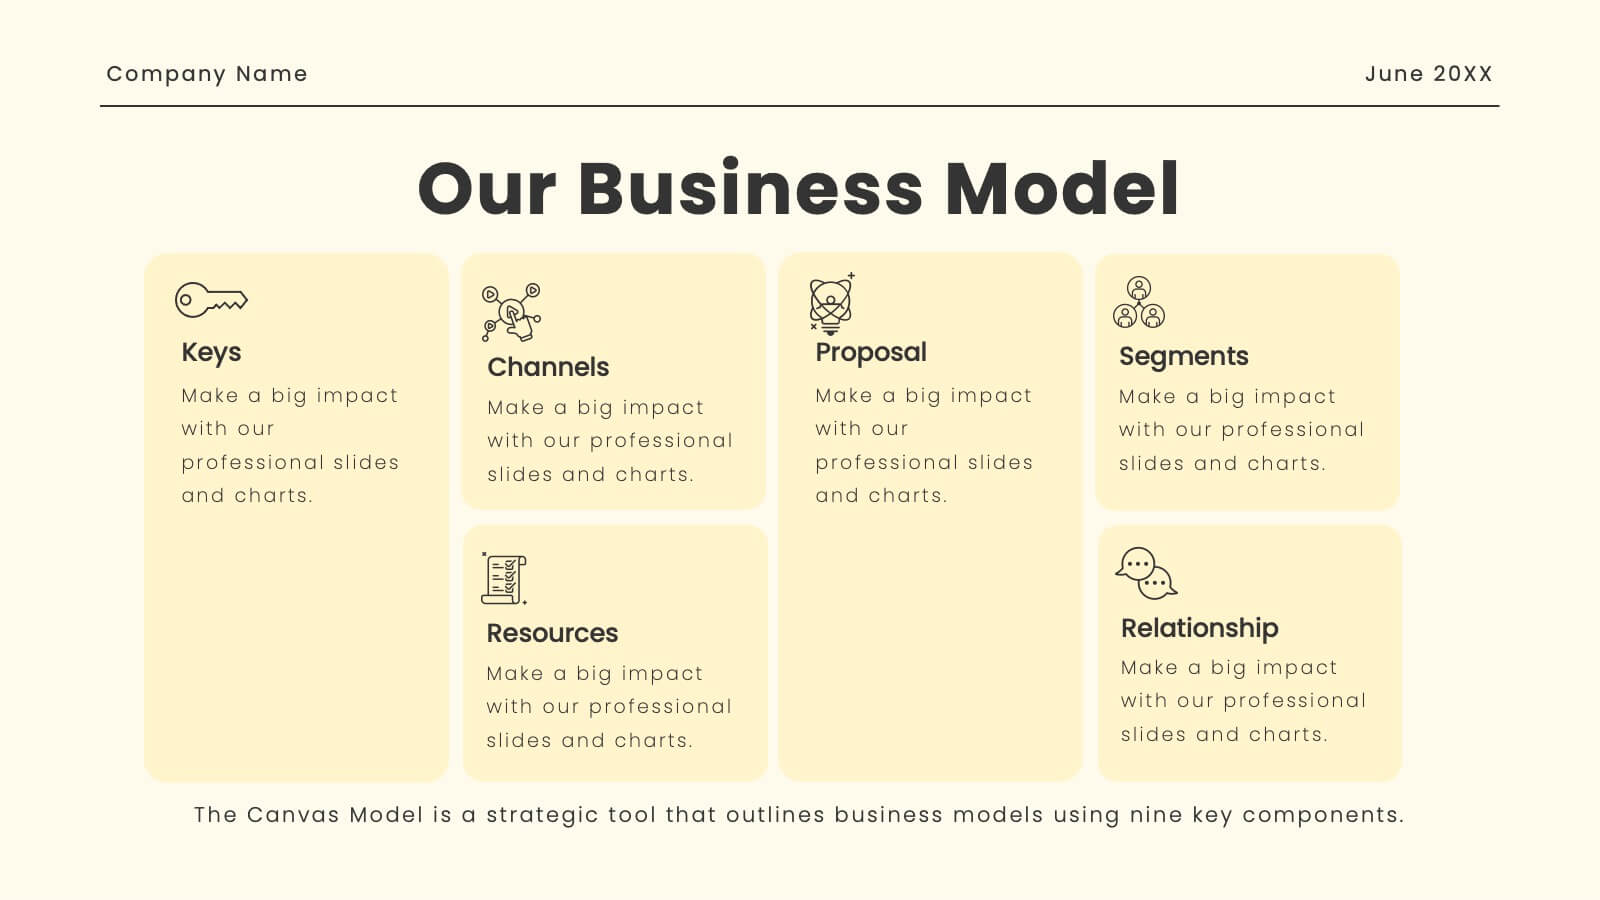
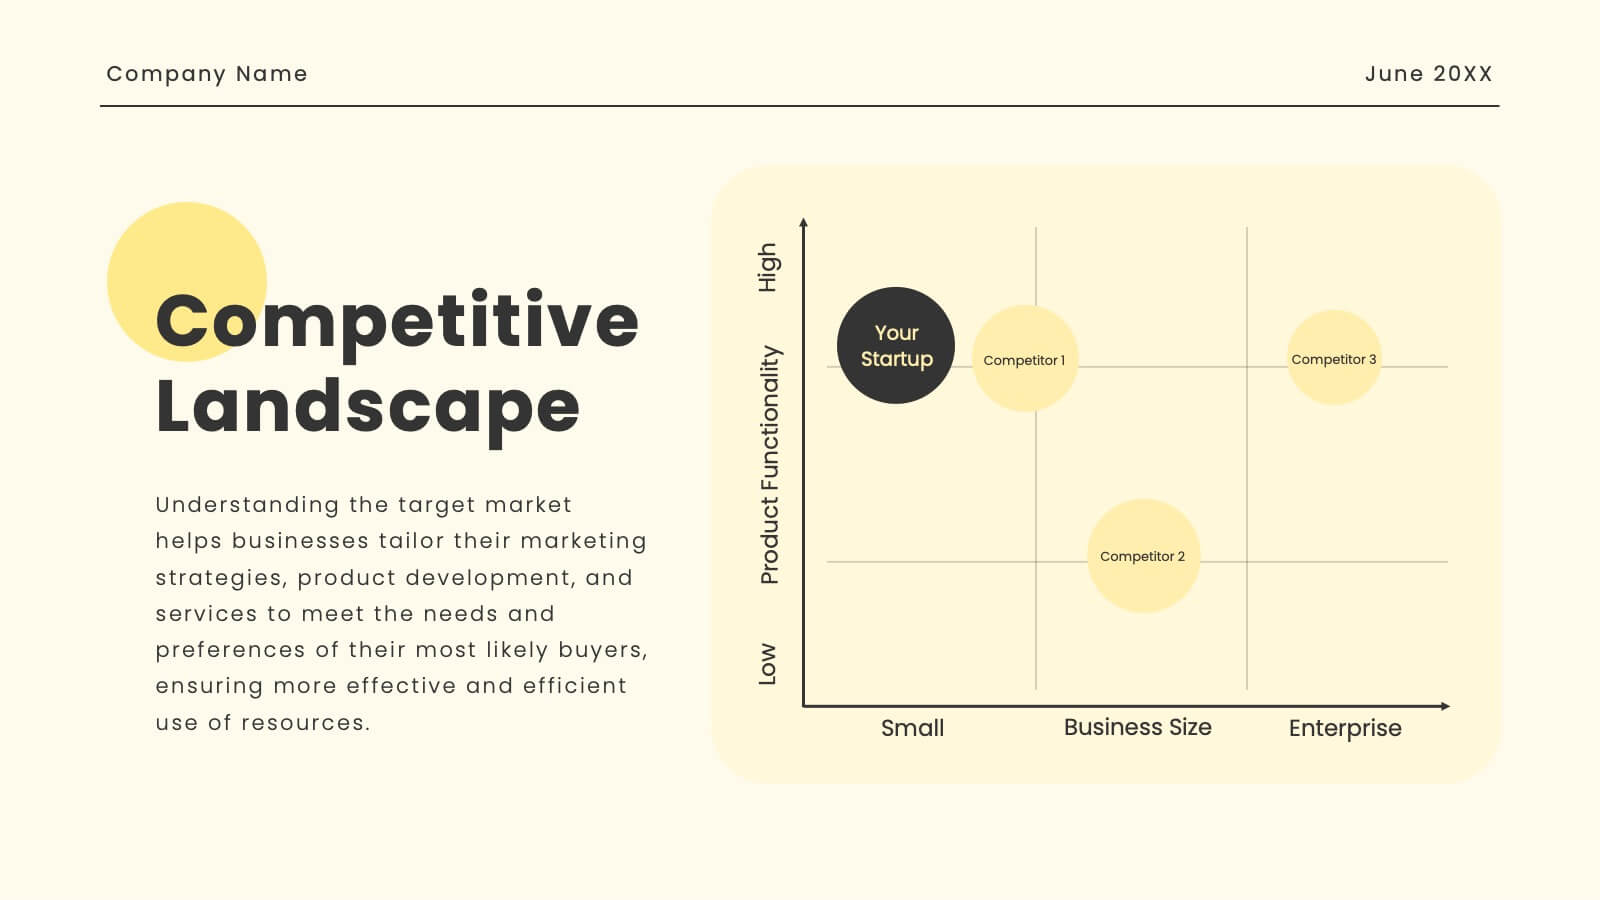
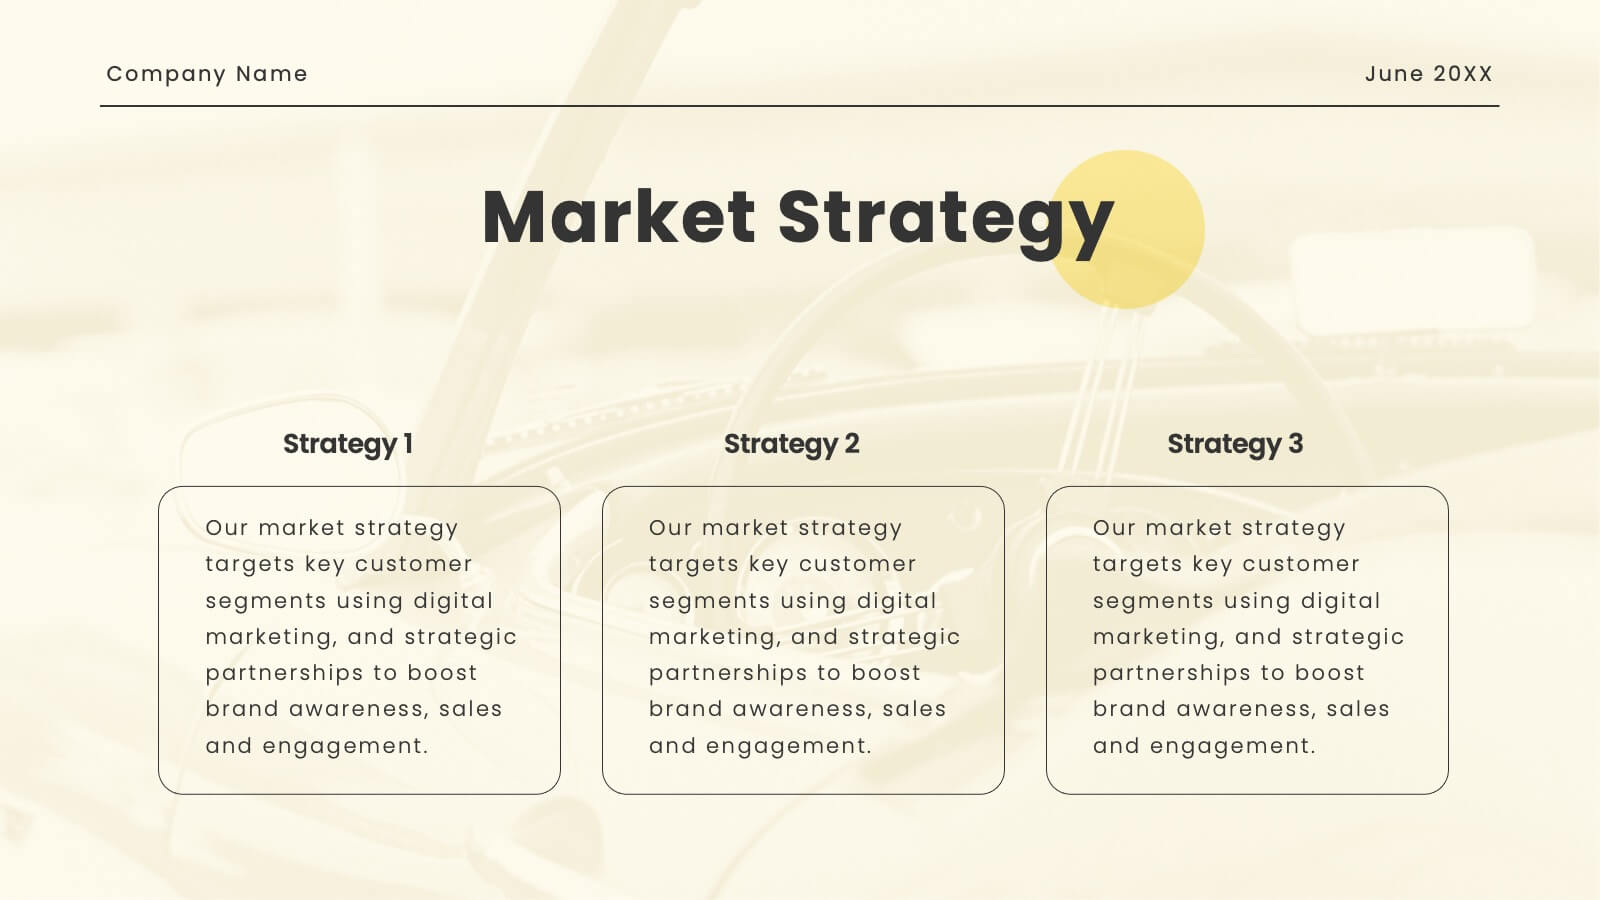
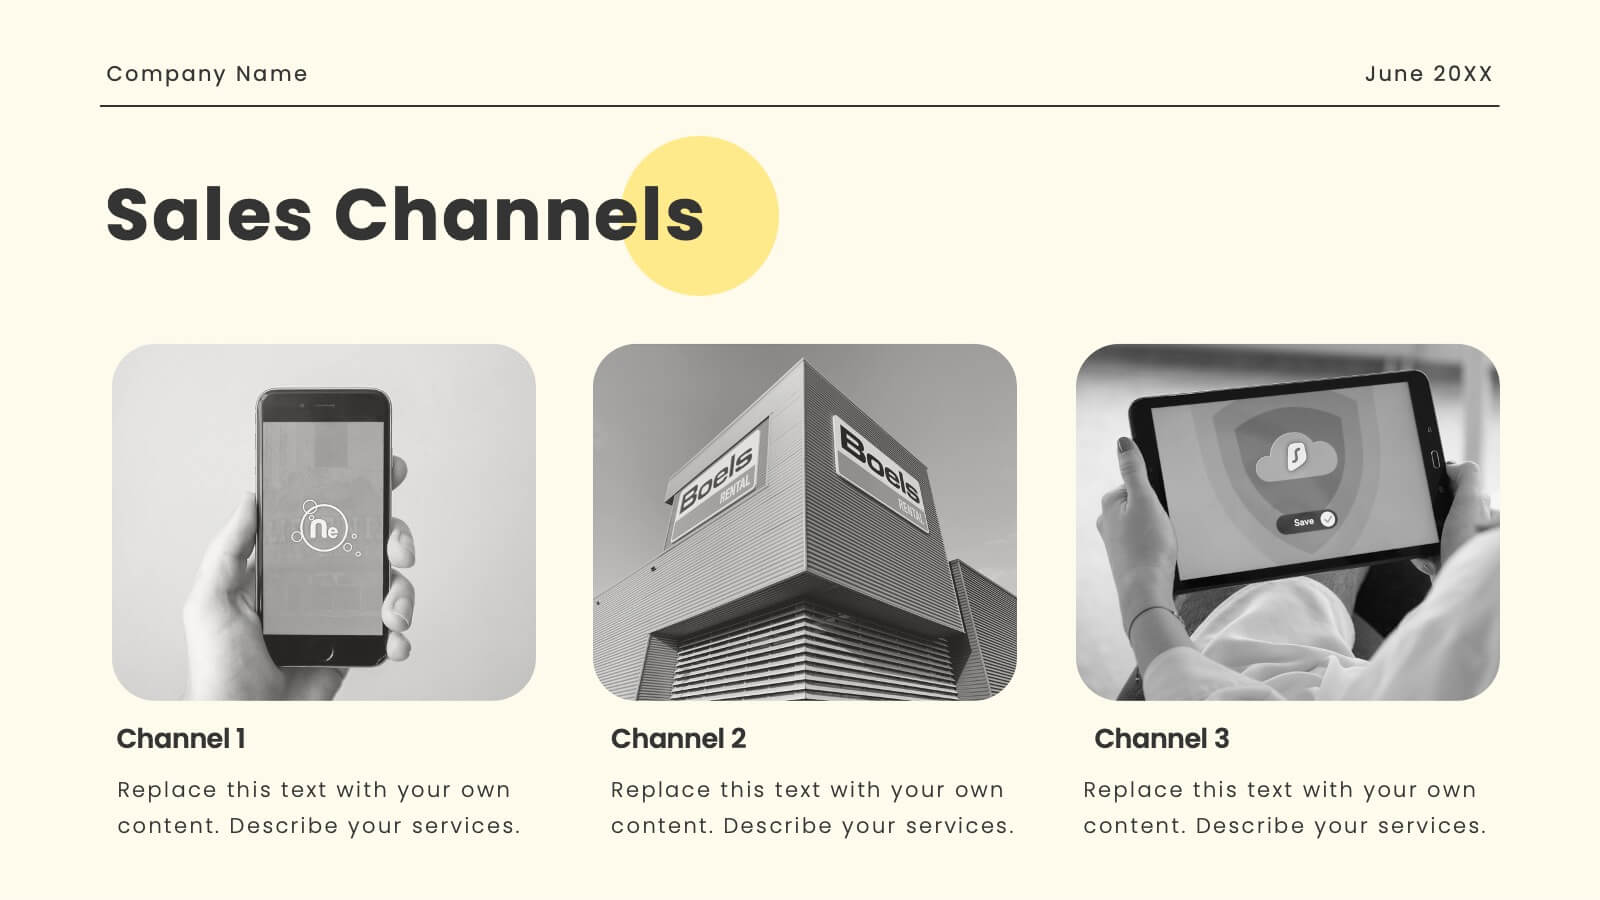
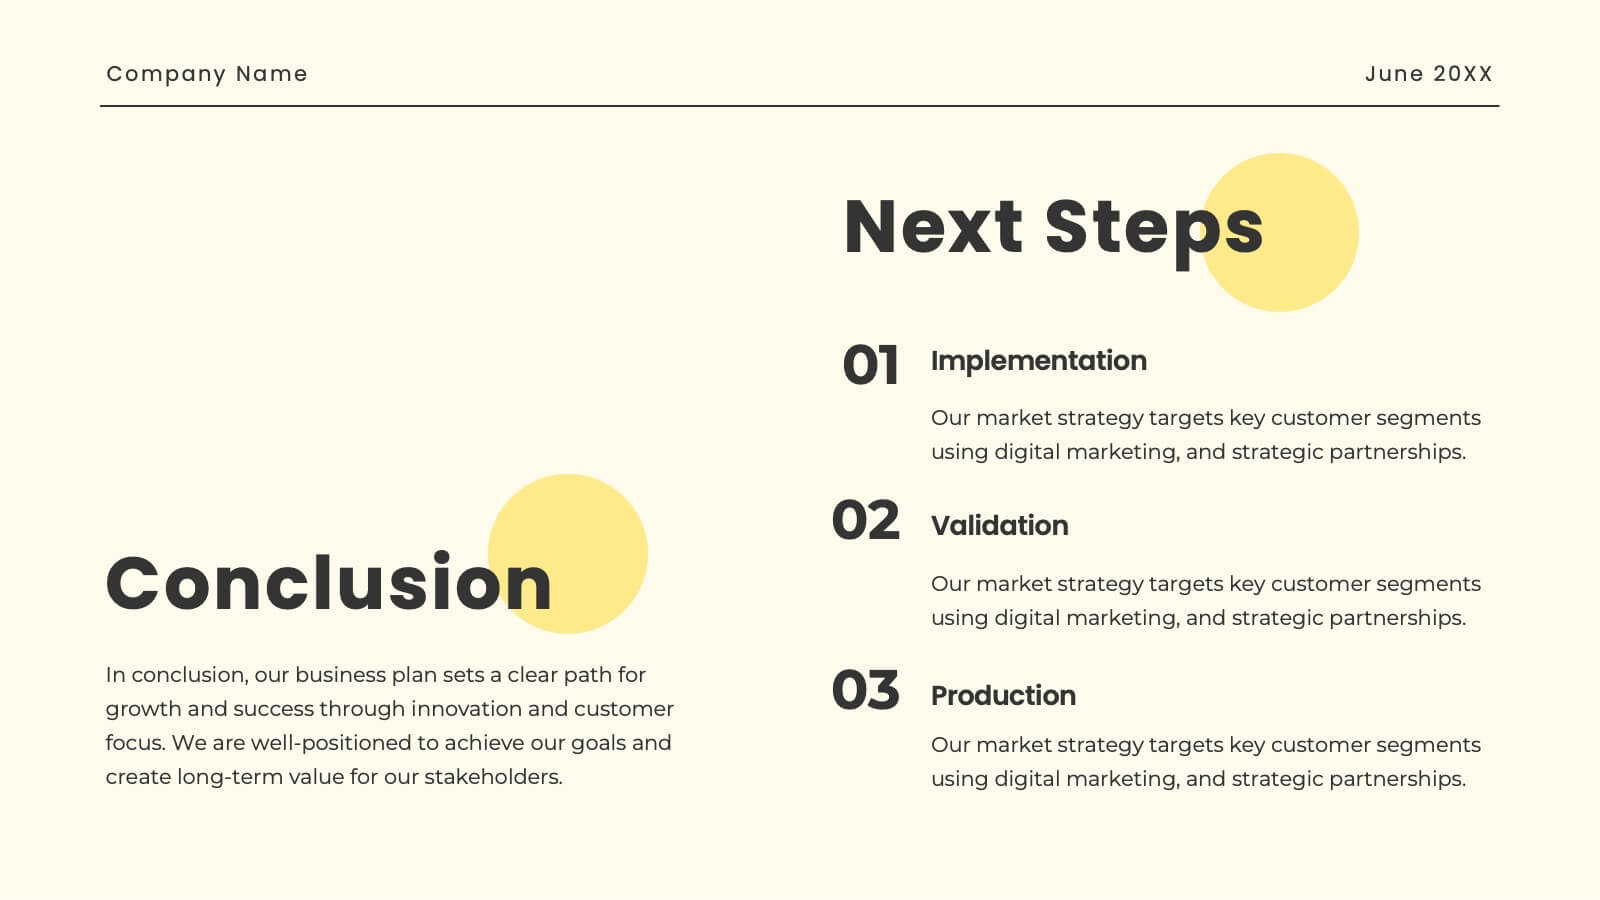
Oasis Startup Business Plan Presentation
Present your corporate business plan with confidence! This template includes sections for company overview, mission, vision, services, target market, and more. Showcase your market strategy, sales channels, growth plan, and financial overview. Perfect for conveying a professional and comprehensive business plan. Compatible with PowerPoint, Keynote, and Google Slides. Impress your audience today!


6 diapositivas
Business Growth and Progress Report Presentation
Visualize business success with clarity using this Business Growth and Progress Report template. This puzzle-style infographic illustrates the interconnected steps of development, making it ideal for performance tracking, quarterly reports, and strategic planning. Fully customizable—adjust colors, labels, and data points to align with your business metrics. Compatible with PowerPoint, Keynote, and Google Slides for effortless integration into your presentations.


5 diapositivas
Strategic Business Pillars Model Presentation
Visualize your core strategies with this vertical pillar infographic slide. Each level represents a key focus area or foundational element essential for business success. Ideal for leadership talks, team alignment, or growth strategies. Fully editable in PowerPoint, Keynote, and Google Slides.


21 diapositivas
Aetherial UX Research Report Presentation
A professional and modern template for UX research presentations. Highlight key elements such as user personas, journey mapping, wireframes, and testing processes. Includes slides for accessibility considerations, design systems, and feedback iteration. Fully customizable and compatible with PowerPoint, Keynote, and Google Slides to deliver impactful insights and research findings.


26 diapositivas
Carson Presentation Template
If you want a futuristic and bold design, this is the presentation template for you. The colors are bold and captivating to the eye. The font goes with technology and security. We designed the template to provide a magnificent structure for information. It's easy to use, resulting in high quality presentations. Since the colors are editable, you can personalize this presentation by adding colors that tie directly back to your company and its image. This template can be used for both personal use as well as professional use. Enhance your details with our Carson template for your next project.


6 diapositivas
Spider Diagram for Concept Mapping
Map complex relationships with ease using the Spider Diagram for Concept Mapping Presentation. This slide features a central radial chart connected to six surrounding nodes—each paired with editable titles, icons, and detailed text sections. Perfect for visualizing project scopes, idea clustering, strategic alignment, or team functions. Customize colors, icons, and text directly in PowerPoint, Keynote, or Google Slides. The clean, professional layout ensures clear communication across all types of presentations.


5 diapositivas
Supply Chain Management Plan Presentation
Streamline your presentation with a sleek and organized design built to illustrate process flow and logistics. Perfect for explaining production stages, delivery systems, or business operations, this visual layout brings clarity and structure to your message. Compatible with PowerPoint, Keynote, and Google Slides for effortless customization and use.


6 diapositivas
7S Framework for Organizational Alignment Presentation
Present a cohesive organizational strategy using the 7S Framework slide. With hexagonal visuals highlighting key elements—Strategy, Structure, Systems, Shared Values, Style, Staff, and Skills—this template simplifies complex alignment concepts. Ideal for leadership, consulting, or HR presentations. Fully editable for PowerPoint, Google Slides, and Keynote to match your brand.


6 diapositivas
Creative Process Infographic
The Creative Process Infographic offers a visually engaging and systematic approach to outlining the steps of a successful project or strategy. This template beautifully segments the process into distinct, color-coded stages, making it ideal for presentations, workshops, or educational materials that aim to simplify and illustrate the progression from concept to completion. Each section is clearly defined, providing a structured pathway that can be customized to detail specific tasks, checkpoints, or goals. This infographic is versatile and fully editable, suitable for Powerpoint, Google Slides, and Keynote, ensuring that it can be adapted to a wide range of topics and audiences.