Office Scenes Infographic Presentation Template
PowerPoint Template and Google Slides Theme


Características
Etiquetas
- Eliminar de favoritos
Plantilla de PowerPoint
1 MB
Plantilla de Google Slides
Enlace externo
Plantilla de Keynote
2 MB
Recomendar
- Eliminar de favoritos
Plantilla de PowerPoint
1 MB
Plantilla de Google Slides
Enlace externo
Plantilla de Keynote
2 MB
6 diapositivas
Innovation Ideas Infographics
Energize your presentations with our Innovation Ideas infographic, designed for full compatibility with Powerpoint, Keynote, and Google Slides. This vibrant and insightful infographic is the perfect addition for innovators, entrepreneurs, and educators looking to foster a culture of creativity and ideation. The infographic provides a visual exploration of the innovation process, from ideation to execution. It highlights key concepts and strategies that stimulate creative thinking and drive innovation within teams and organizations. With a focus on collaborative brainstorming and the incubation of ideas, it serves as a guide to developing groundbreaking concepts. Incorporating this infographic into your slides will help you effectively communicate the dynamics of successful innovation strategies. It’s ideal for workshops, team meetings, and academic courses that cover topics such as design thinking, innovation management, and product development. Use it to inspire your audience and to illustrate a roadmap for transforming ideas into tangible innovations.
- Eliminar de favoritos
Plantilla de PowerPoint
Enlace externo
Plantilla de Google Slides
Enlace externo
Plantilla de Keynote
Enlace externo
15 diapositivas
Business Plan Infographic Presentation
Businesses are important components of a healthy economy and society. They create jobs, drive innovation, encourage entrepreneurship, and contribute to the well-being of society. With this template you can create a clear and effective business Infographic for your pitches, or projects. The design is made to enhance your message and inspire your audience. This template can be used for presenting any business information whether it be data, statistics, facts etc. It is compatible with Powerpoint, keynote and google slides so all the elements are editable, and can be changed to fit your needs.
- Eliminar de favoritos
Plantilla de PowerPoint
4 MB
Plantilla de Google Slides
Enlace externo
Plantilla de Keynote
5 MB
4 diapositivas
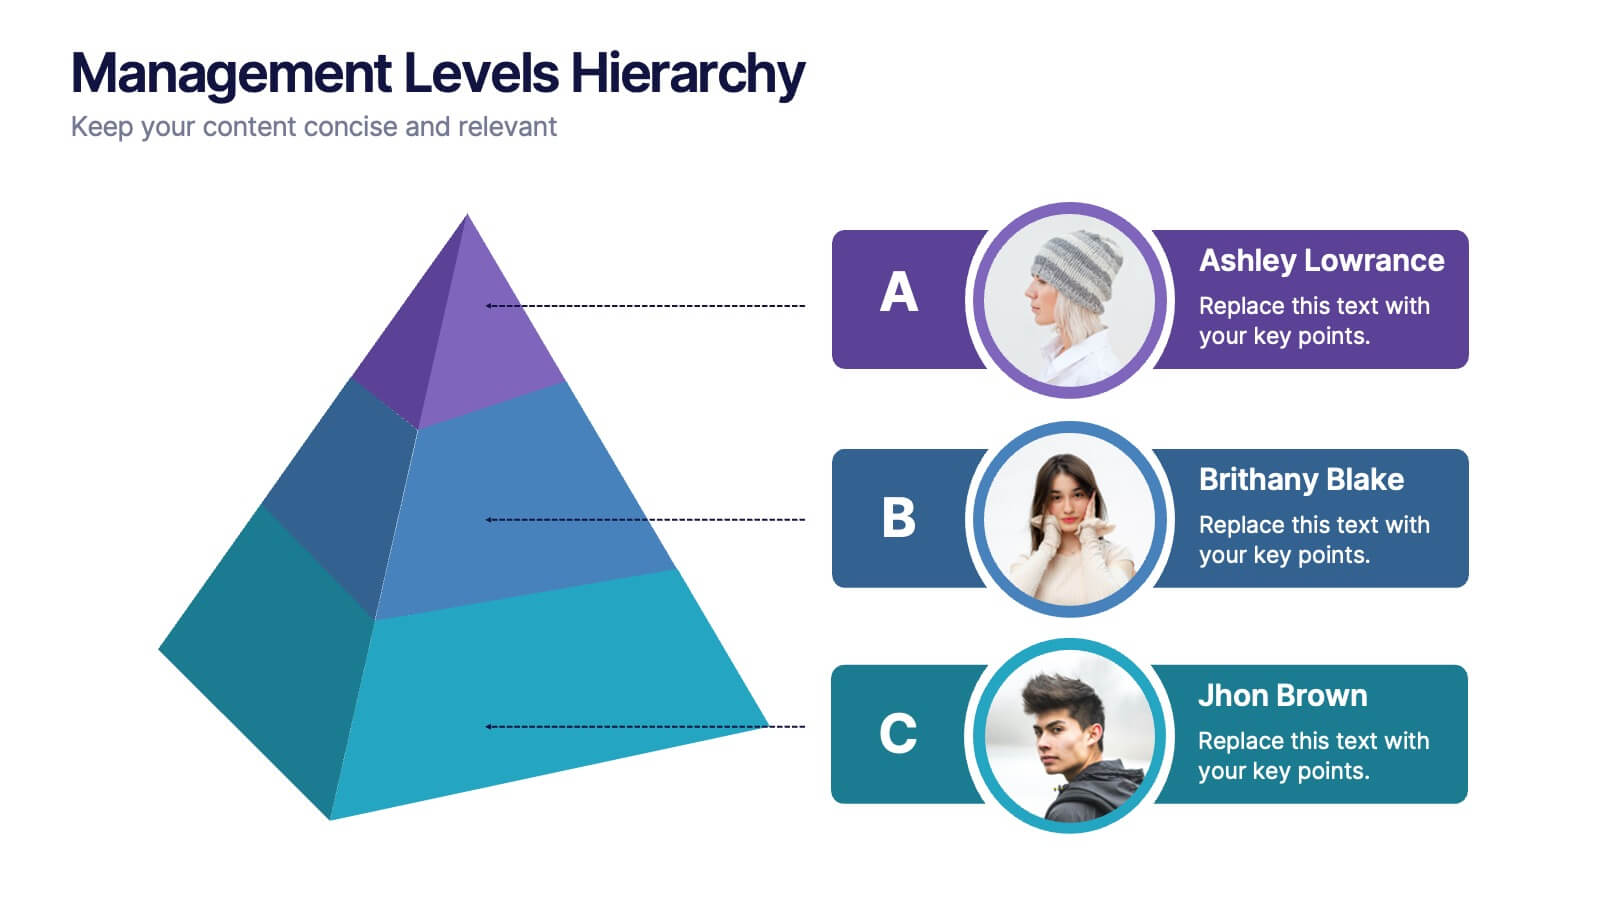
Management Levels Hierarchy
Illustrate your team’s structure using this modern pyramid-style hierarchy chart. Featuring space for names, roles, and profile photos, it’s ideal for highlighting top, middle, and lower-level management. Fully editable in PowerPoint, Keynote, and Google Slides.
- Eliminar de favoritos
Plantilla de PowerPoint
1 MB
Plantilla de Google Slides
Enlace externo
Plantilla de Keynote
1 MB
6 diapositivas
Business Process Checklist Overview Presentation
Simplify your workflow presentations with the Business Process Checklist Overview Presentation. This circular layout is ideal for outlining five sequential or cyclical steps in a business process, featuring icon-labeled checkpoints and editable titles. Each step is visually marked with subtle checkmarks, making it perfect for status tracking, task progression, or implementation plans. Clean, professional, and fully customizable in PowerPoint, Keynote, and Google Slides.
- Eliminar de favoritos
Plantilla de PowerPoint
1 MB
Plantilla de Google Slides
Enlace externo
Plantilla de Keynote
1 MB
4 diapositivas
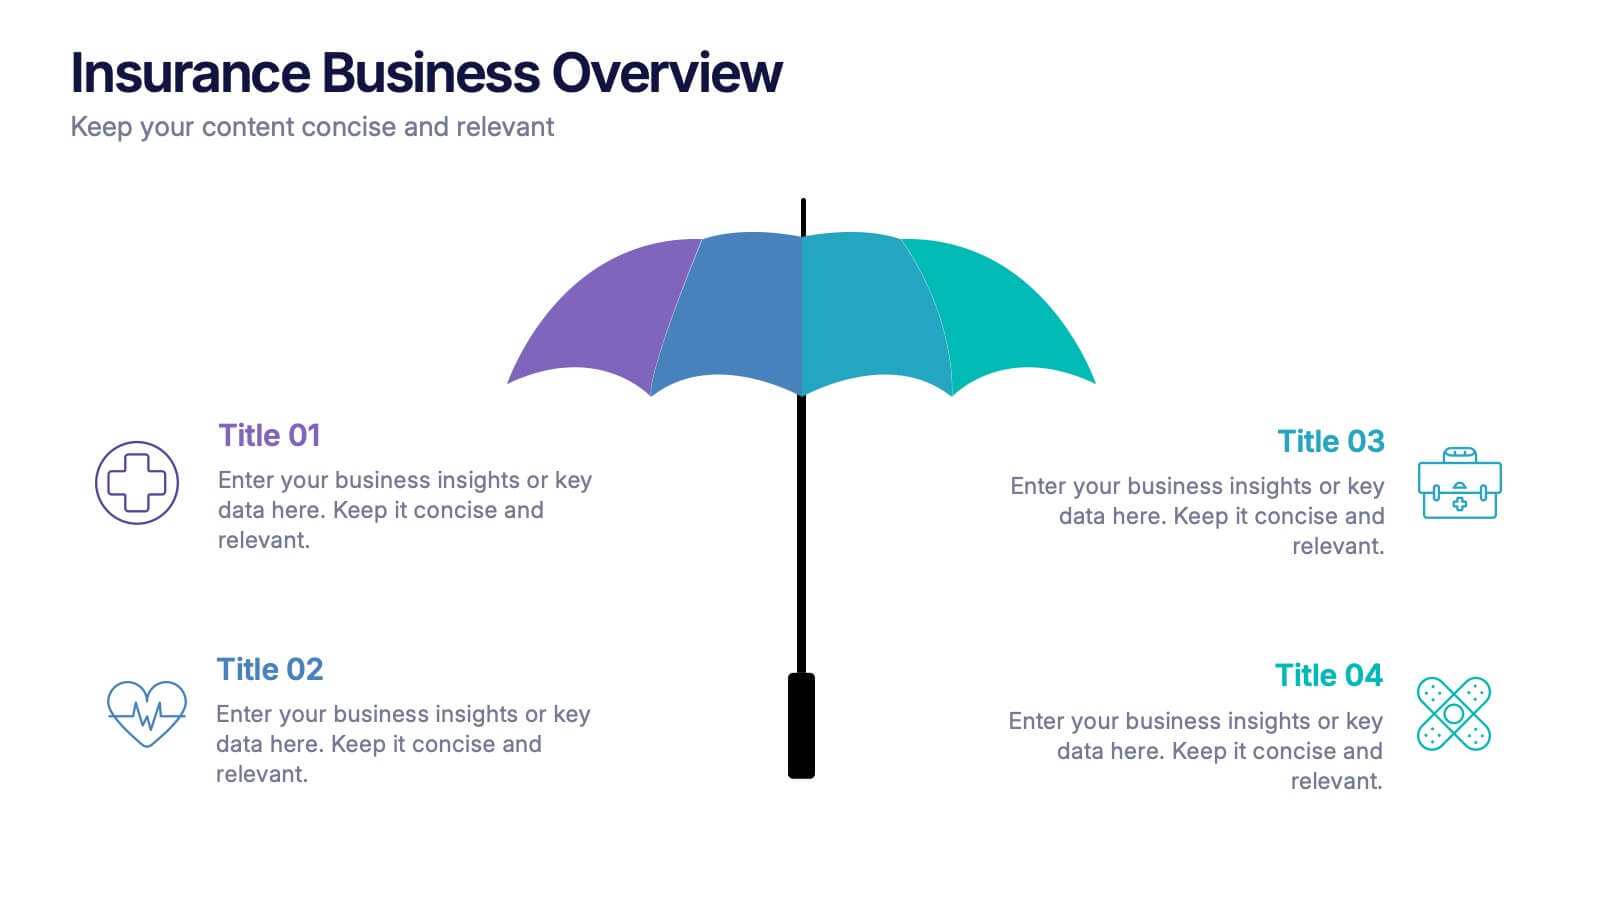
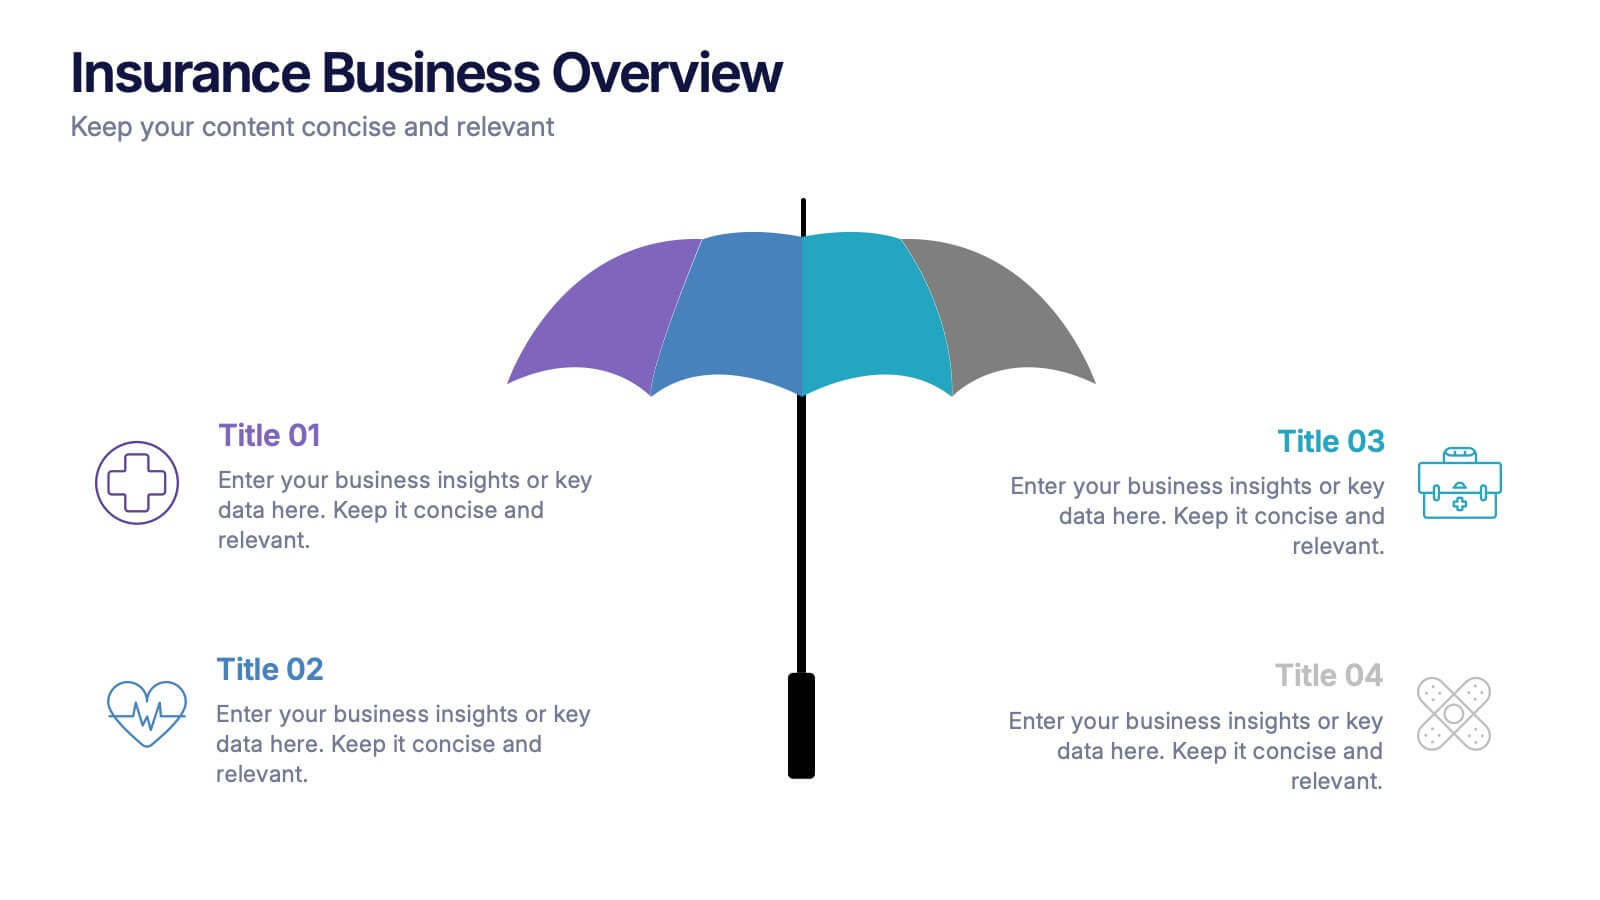
Insurance Business Overview Presentation
Bring clarity and professionalism to your financial presentations with this sleek and modern design. Ideal for outlining key insights, policies, or service breakdowns, it visually communicates business protection and stability. Fully customizable and compatible with PowerPoint, Keynote, and Google Slides for an engaging and polished presentation experience.
- Eliminar de favoritos
Plantilla de PowerPoint
1 MB
Plantilla de Google Slides
Enlace externo
Plantilla de Keynote
2 MB
4 diapositivas
Medical Theme Slides for Healthcare Presentation
Bring clarity and care to your data storytelling with this modern healthcare-themed presentation. Designed for hospitals, clinics, or medical professionals, it helps you present health data, research findings, and patient care insights with professionalism and trust. Fully customizable and compatible with PowerPoint, Keynote, and Google Slides for seamless editing.
- Eliminar de favoritos
Plantilla de PowerPoint
1 MB
Plantilla de Google Slides
Enlace externo
Plantilla de Keynote
1 MB
4 diapositivas
Stakeholder Analysis and Engagement Presentation
Enhance your strategic planning with our Stakeholder Analysis and Engagement Presentation template. Designed to map influence and interest effectively, this tool aids in identifying key stakeholders and tailoring engagement strategies. It’s compatible with PowerPoint, Keynote, and Google Slides, perfect for impactful presentations and workshops.
- Eliminar de favoritos
Plantilla de PowerPoint
1 MB
Plantilla de Google Slides
Enlace externo
Plantilla de Keynote
1 MB
7 diapositivas
Simple Schedule Infographic
Effortlessly structure your time with our simple schedule infographic. Rendered in a clean white canvas, enhanced with dependable blue tones and anchored with timeless black, our template is the epitome of clarity and organization. Equipped with streamlined infographics, universal icons, and adaptable image placeholders, it facilitates easy time management and daily planning. Seamlessly tailored for Powerpoint, Keynote, or Google Slides. A fundamental tool for project managers, event planners, educators, or any professional aiming to efficiently allocate their time. Plan with ease; let every slide bring order to your daily chaos.
- Eliminar de favoritos
Plantilla de PowerPoint
1 MB
Plantilla de Google Slides
Enlace externo
Plantilla de Keynote
2 MB
7 diapositivas
Human Anatomy Infographic Presentation
The Human Anatomy is the study of the structure and organization of the human body. This template is perfect for illustrating the most important aspects of anatomy and physiology in a fun, colorful way. This infographic is perfect for students, teachers, and medical practitioners. With this anatomy presentation, you can show how all organs, bones and tissues are connected together to make up incredible living organisms known as humans. Compatible with Powerpoint, keynote and google slides, this infographic template is a great way to explain each human organ in a simple and informative way.
- Eliminar de favoritos
Plantilla de PowerPoint
1 MB
Plantilla de Google Slides
Enlace externo
Plantilla de Keynote
1 MB
5 diapositivas
Real Estate Requirements Infographics
Real Estate Infographics can be an effective way to convey information about the real estate industry in a visually appealing and simple manner. This infographic template is perfect to showcase market trends, statistics, and data in a clear and concise way, making it easier for your audience to interpret the information. As well as educating and informing your clients, investors, and other stakeholders about various aspects of the real estate market. Overall, these infographic will help you communicate information about the real estate industry and help your clients make informed decisions about buying, selling, or investing in property.
- Eliminar de favoritos
Plantilla de PowerPoint
1 MB
Plantilla de Google Slides
Enlace externo
Plantilla de Keynote
2 MB
7 diapositivas
Project Milestone Tracking Presentation
Efficiently monitor key project milestones with our "Project Milestone Tracking" presentation templates. These visually clear and user-friendly tools are perfect for project managers to showcase task completions, priority levels, due dates, and overall project progress, ensuring that every team member is aligned and informed. Compatible with PowerPoint, Keynote, and Google Slides, these templates streamline project updates and enhance team coordination.
- Eliminar de favoritos
Plantilla de PowerPoint
2 MB
Plantilla de Google Slides
Enlace externo
Plantilla de Keynote
3 MB
7 diapositivas
Europe Countries Map Infographic
This Europe Countries Map infographic template is a versatile presentation tool for showcasing various data across European nations. The template is fully compatible with PowerPoint, Google Slides, and Keynote and features different infographic styles, such as color-coded maps, bar charts, and statistical representations. It is perfect for displaying country-specific information like population size, economic statistics, or any other relevant data. The clear and concise design ensures that viewers can easily interpret the information, making it suitable for educators, students, business professionals, and anyone needing to present European data in an engaging and informative manner.
- Eliminar de favoritos
Plantilla de PowerPoint
1 MB
Plantilla de Google Slides
Enlace externo
Plantilla de Keynote
2 MB
12 diapositivas
Compliance and Policy Management Presentation
Visualize your compliance ecosystem with the Compliance and Policy Management Presentation. Designed around a planetary orbit concept, this slide maps core policies at the center with surrounding regulations and enforcement layers. Each orbit can represent levels of governance, department roles, or regulatory zones—making it ideal for risk teams, auditors, and legal advisors. Fully customizable in PowerPoint, Keynote, and Google Slides for seamless use.
- Eliminar de favoritos
Plantilla de PowerPoint
1 MB
Plantilla de Google Slides
Enlace externo
Plantilla de Keynote
1 MB
5 diapositivas
Scalability Metrics for Business Growth Presentation
Visualize business growth stages with this tiered pyramid-style slide. Each layer highlights key performance metrics with editable percentage labels, perfect for scaling strategies or KPI reports. Simple, structured, and impactful—ideal for business planning, team briefings, or investor updates. Fully customizable in PowerPoint, Keynote, and Google Slides for seamless editing.
- Eliminar de favoritos
Plantilla de PowerPoint
1 MB
Plantilla de Google Slides
Enlace externo
Plantilla de Keynote
1 MB
7 diapositivas
Governance Infographics Presentation Template
Our Governance Infographic is designed to present complex information in an easy-to-understand format that is accessible to a wide audience. This template gives you the opportunity to create an infographic that is easy on the eye, but thorough and detailed enough to make sure all the points are covered. This template includes 7 slides that present a comprehensive framework for monitoring and evaluating a company's governance, risk management, and compliance programs. Packed with great content, this presentation tells the story of your governance system. Get started easily by adding your text!
- Eliminar de favoritos
Plantilla de PowerPoint
1 MB
Plantilla de Google Slides
Enlace externo
Plantilla de Keynote
2 MB
7 diapositivas
Company Structure Infographic
Company structure, often referred to as organizational structure, outlines how a company is organized in terms of hierarchy, roles, responsibilities, and the flow of information. Discover the inner workings of your organization with our Company Structure Infographic. This visually captivating and informative infographic serves as a guide to understanding the hierarchical layout, roles, and relationships within your company. Compatible with Powerpoint, Keynote, and Google Slides. Illustrate the structure levels within the company, showcasing the roles and responsibilities at each level and how they contribute to the company's success.
- Eliminar de favoritos
Plantilla de PowerPoint
1 MB
Plantilla de Google Slides
Enlace externo
Plantilla de Keynote
1 MB
6 diapositivas
End-to-End Value Chain Process Presentation
Visualize every link in your process with the End-to-End Value Chain Process Presentation. This modern chain diagram helps illustrate each stage of your business or production flow—from initial input to final output. It's ideal for strategy, supply chain, and operational planning. Fully editable in PowerPoint, Keynote, Canva, or Google Slides.


