


Características


¿Tienes alguna pregunta?
Recomendar


6 diapositivas
Medical Anatomy Study Presentation
Present complex medical data with the Medical Anatomy Study infographic. Featuring a human body silhouette with key anatomical points and percentage-based insights, this slide is ideal for healthcare presentations, medical research, and educational purposes. Fully editable and compatible with PowerPoint, Keynote, and Google Slides.


5 diapositivas
History in Science Infographics
The history in science refers to the development of scientific knowledge throughout human history. These Infographics can be used to visualize and simplify complex scientific concepts and discoveries in a historical context. This can help students and others interested in science understand the evolution of scientific theories and breakthroughs over time, and how they have shaped our understanding of the world. These infographics use a variety of visual elements, such as timelines, graphs, illustrations, and icons, to tell a compelling story about the history of science. Compatible with Powerpoint, Keynote, and Google Slides.


2 diapositivas
Opening Company Profile Introduction Presentation
Make a bold first impression with the Opening Company Profile Introduction Presentation — a sleek, modern design perfect for business overviews, team intros, or brand missions. Featuring clean typography and a purple accent shape that adds personality without distraction, this layout is ideal for concise, professional messaging. Fully editable and compatible with Canva, PowerPoint, Google Slides, and Keynote.


5 diapositivas
Innovative Concept Pitch Presentation
Present your big ideas with impact using this lightbulb puzzle infographic. Perfect for concept development, product ideation, or startup pitches. The layered segments help structure your content clearly. Fully customizable in PowerPoint, Keynote, and Google Slides—ideal for innovation roadmaps, creative planning, or visualizing business concepts.


10 diapositivas
Social Media Marketing Growth Presentation
Boost your social media strategy with this dynamic infographic template! Perfect for illustrating marketing growth, engagement tactics, and content performance, it features an intuitive flow that simplifies complex data. Ideal for presentations to teams and clients, it’s fully customizable and works seamlessly with PowerPoint, Keynote, and Google Slides.


4 diapositivas
Construction Project Planning
Streamline your workflow and improve clarity with this vibrant project planning wheel designed for construction professionals. This slide helps visualize key phases—such as planning, team coordination, and logistics—using color-coded segments and editable icons. Perfect for architects, contractors, and project managers. Fully customizable in PowerPoint, Keynote, and Google Slides.


7 diapositivas
Data Analysis Process Infographic
Illuminate the intricacies of the data-driven world with our Data Analysis Process Infographic. Set against the crisp backdrop of white and accented with the brilliance of yellow, the growth-centric green, and the depth of blue, our template brings clarity to the complex realm of data analytics. Outfitted with sharp infographics, intuitive icons, and adaptable image placeholders, it translates raw data into actionable insights. Exquisitely crafted for Powerpoint, Keynote, or Google Slides. A crucial tool for data scientists, business analysts, strategists, or any organization looking to harness the power of data. Analyze with precision; let every slide unravel the stories data tells.


8 diapositivas
Business Strategy Alternatives
Present multiple strategic paths with this creative 4-way arrow infographic. Designed to clearly display four different options or directions, it’s ideal for scenario analysis, strategic planning, or decision-making meetings. Each path is paired with an icon and description for easy interpretation. Fully editable in PowerPoint, Keynote, and Google Slides.


20 diapositivas
Kirin Artist Portfolio Template Presentation
Showcase your creative work with style and flair using this sleek portfolio presentation! It covers key sections like featured projects, creative process, collaborations, and client testimonials, ensuring your expertise is communicated effectively. Ideal for freelancers, designers, or agencies, this template is fully compatible with PowerPoint, Keynote, and Google Slides.
4 diapositivas
Objectives and Results Strategy Tracking Presentation
Track progress with clarity using the Objectives and Results Strategy Tracking Presentation. This sleek, minimalist layout helps visualize how each objective connects to measurable outcomes along a strategic path. Ideal for OKR reviews, quarterly goal updates, and performance check-ins. Fully customizable in PowerPoint, Canva, Keynote, and Google Slides.


4 diapositivas
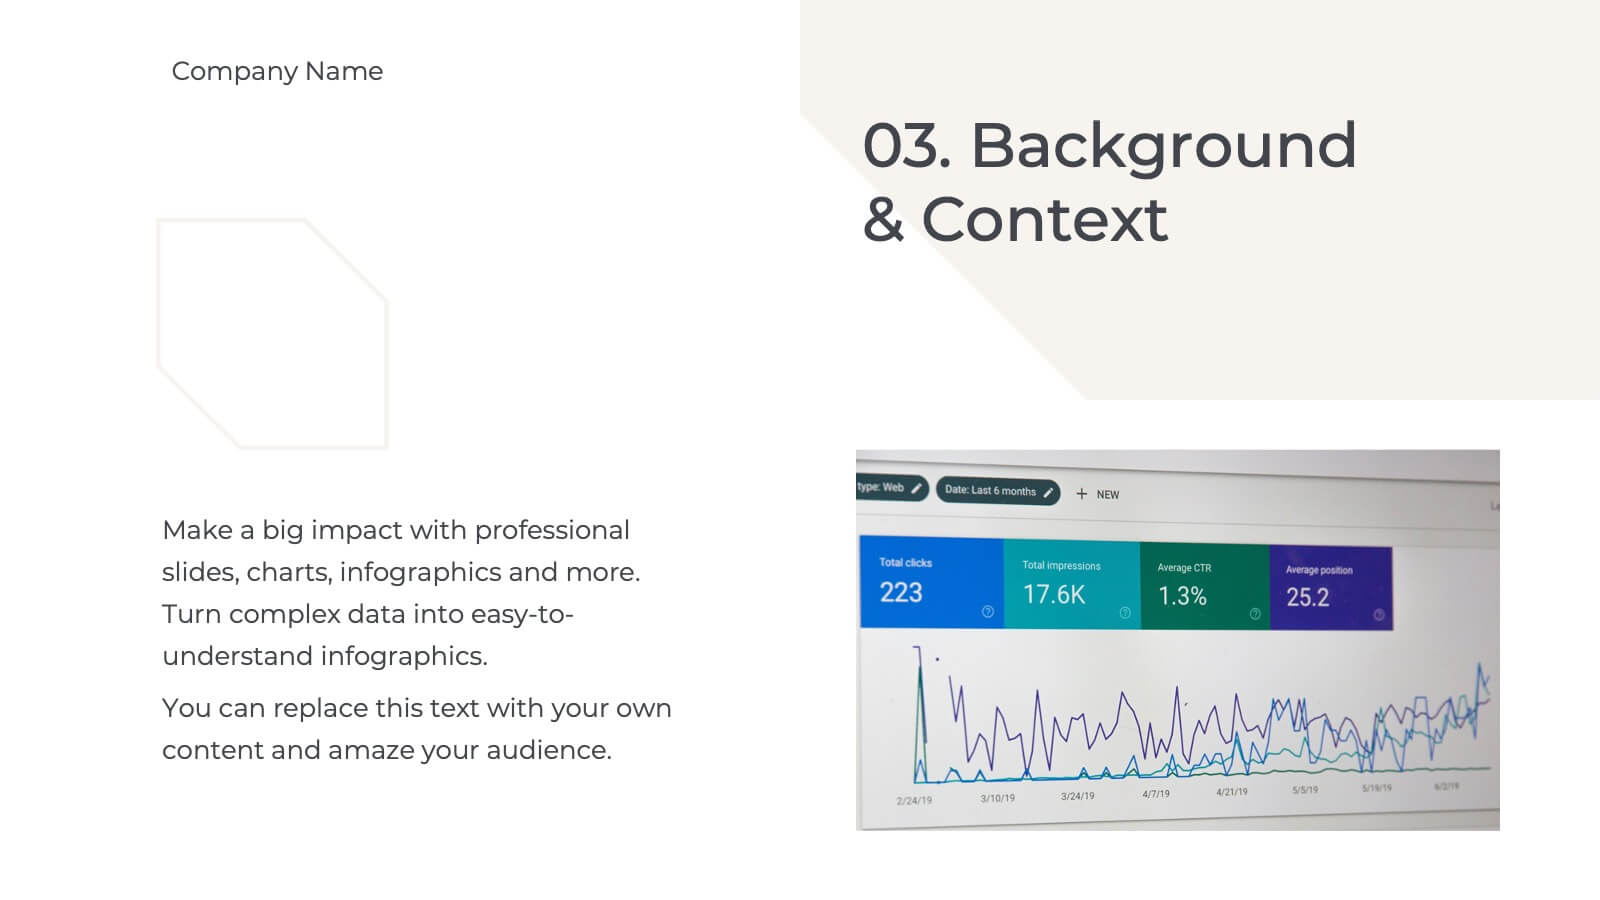
Business Growth in Numbers Presentation
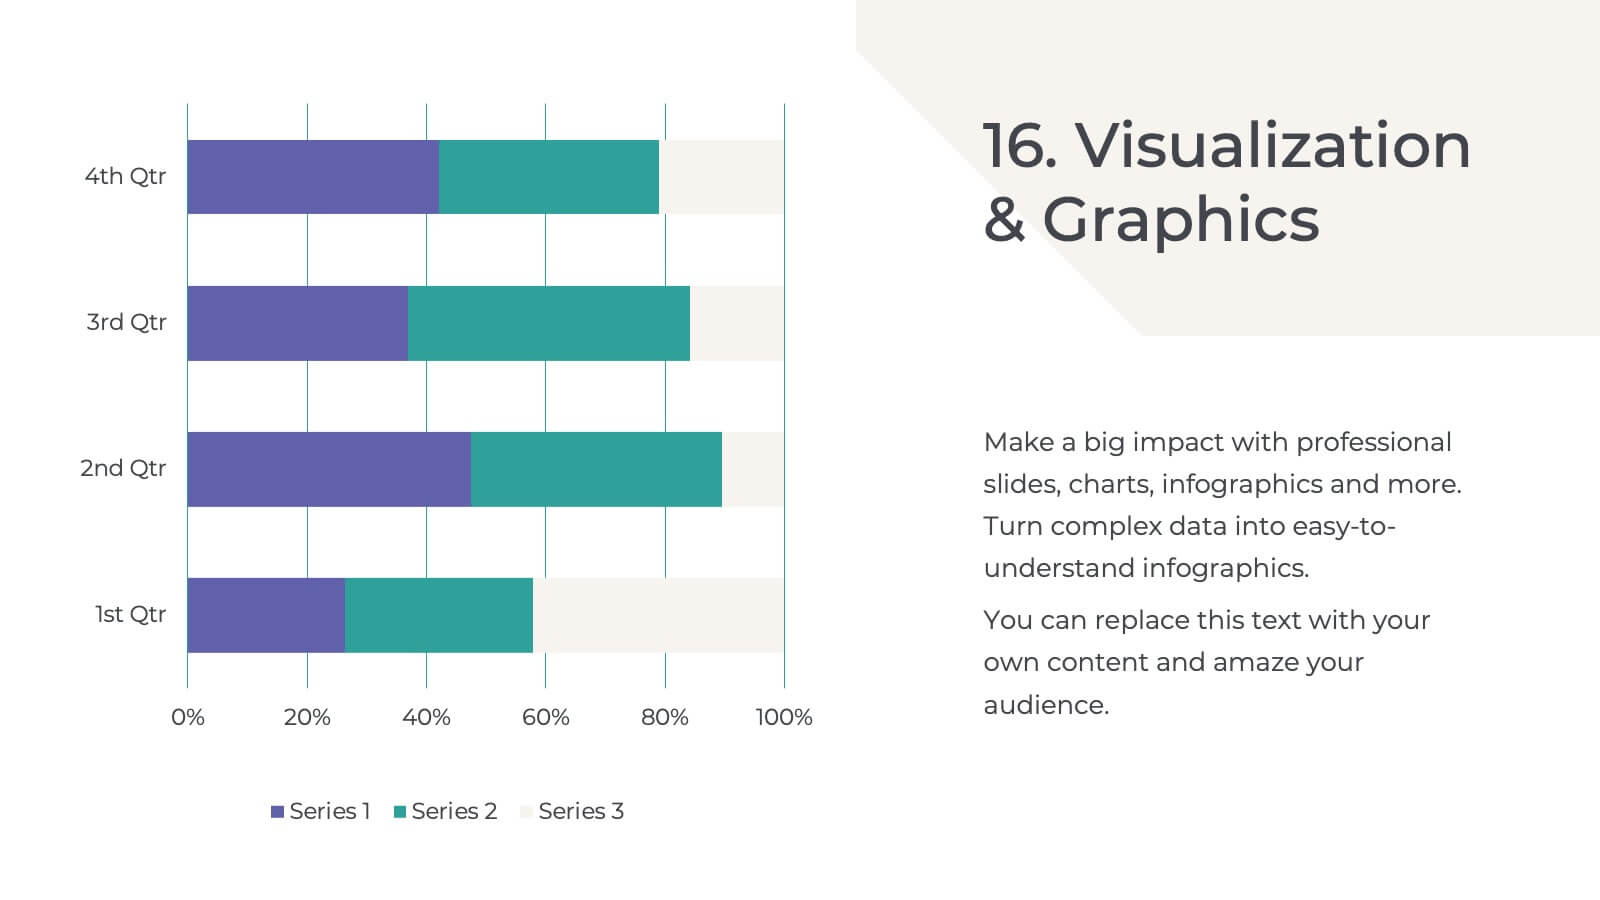
Showcase business performance with the Business Growth in Numbers Presentation template. Designed for sales reports, financial reviews, and market analysis, this template includes visualized statistics, percentage comparisons, and trend graphs to highlight key growth metrics. Fully customizable and compatible with PowerPoint, Keynote, and Google Slides, it ensures clear and compelling data storytelling.


6 diapositivas
Project Table Infographic
A project table is a structured and organized representation of project-related information in a tabular format. This infographic template is designed to list and track various elements of a project, such as tasks, activities, resources, timelines, and statuses. This infographic showcases project-related data in a concise and organized manner. It is an essential tool for project managers and teams to present project progress, timelines, tasks, and key milestones in a clear and easy-to-understand format. The sections provide additional information about the task's purpose, deliverables, and any specific requirements.


26 diapositivas
Cryptocurrency Technology Presentation
The foundation of cryptocurrency technology is the blockchain, cryptocurrency has the potential to transform the way we think about money and financial transactions, and it continues to evolve. With this template present the latest information on cryptocurrency and the emerging blockchain technologies. This features a variety of high-quality slides in many formats. Whether you want them to be edited on Keynote, PowerPoint, or google sheets this template has everything you need to make the most out of your presentation. Get creative and add your own style with this presentation template!


5 diapositivas
Feedback Assessment with Smile Ratings Presentation
Visually capture user sentiment with this Feedback Assessment with Smile Ratings slide. Featuring a curved layout with emoticons ranging from happy to unhappy, it’s ideal for showcasing satisfaction levels, survey results, or evaluation stages. Fully customizable in Canva, PowerPoint, or Google Slides—perfect for reports, workshops, or performance reviews.


7 diapositivas
Business Credit Card Infographic
Navigating business credit cards can seem overwhelming, but with our vibrant infographic, it becomes effortless. Drenched in playful pinks and dynamic colors, this tool is more than just eye-catching—it's a roadmap to the intricate realm of corporate credit. Tailored for everyone from financial educators to seasoned business owners, this infographic offers a clear, concise breakdown of business card essentials, benefits, and best practices. Whether you're presenting, learning, or simply seeking clarity, this resource promises invaluable insights with a dash of flair. Dive in and demystify the world of business credit cards with us!

22 diapositivas
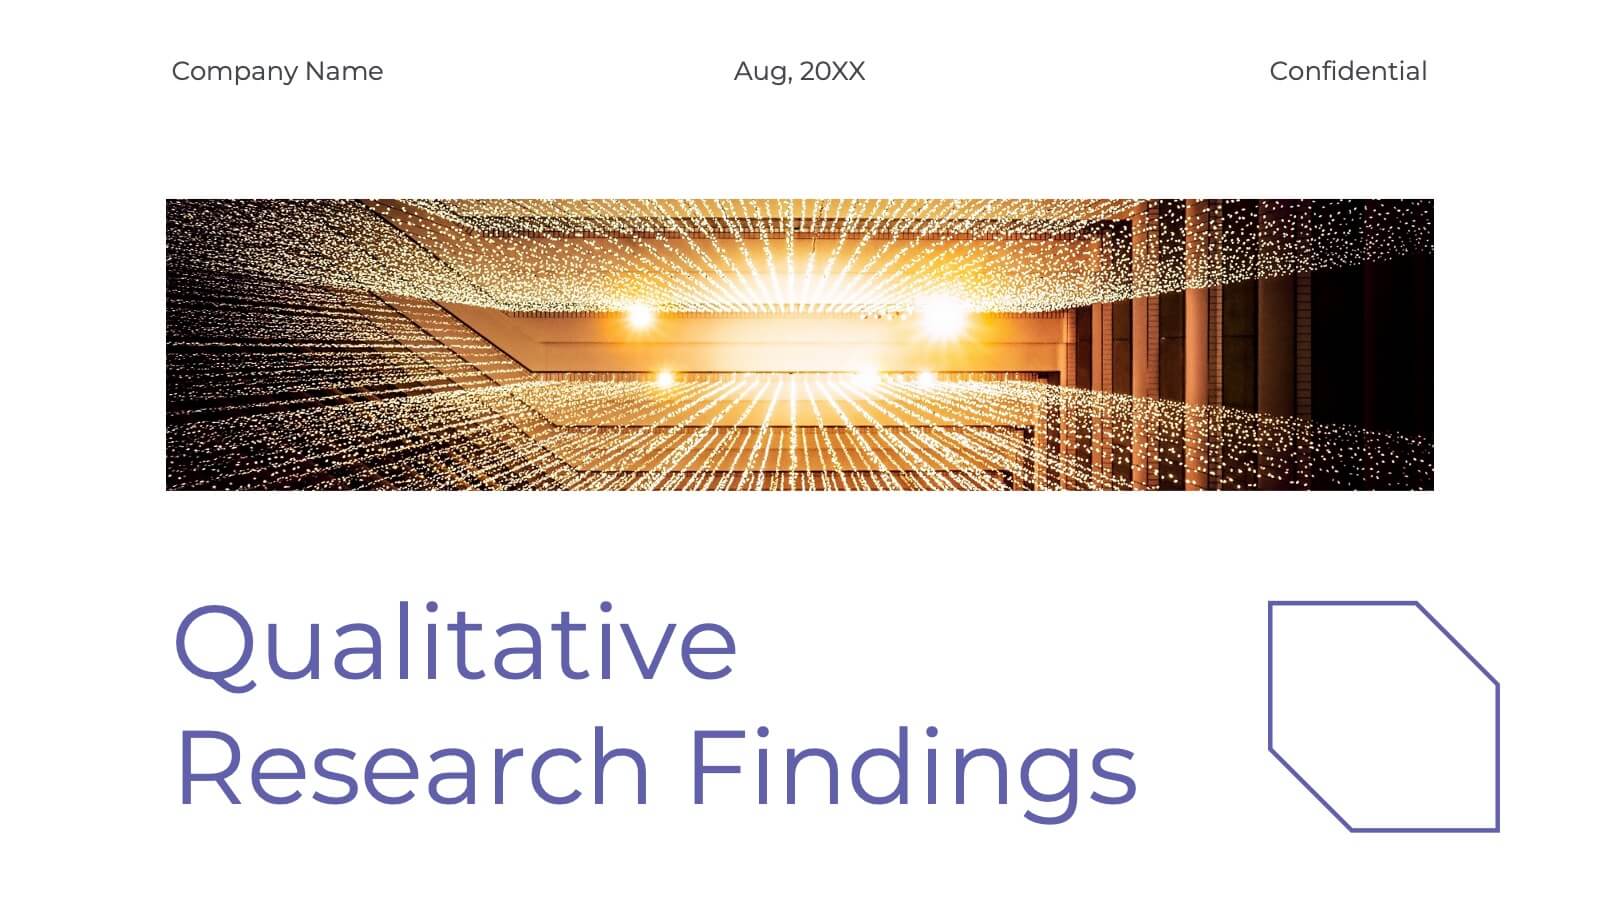
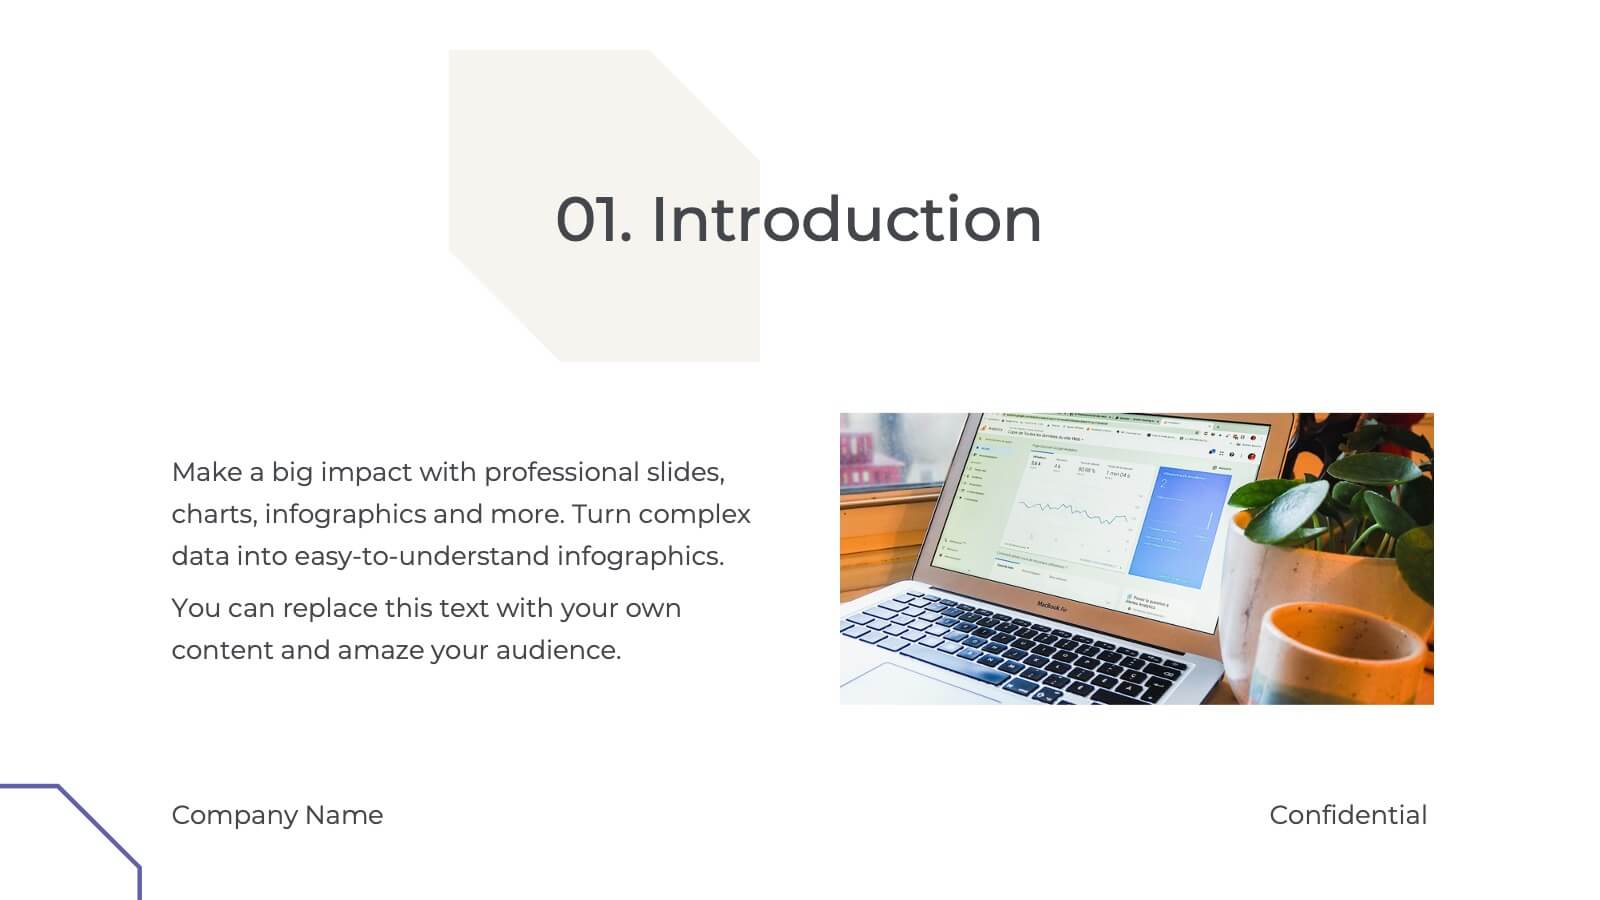
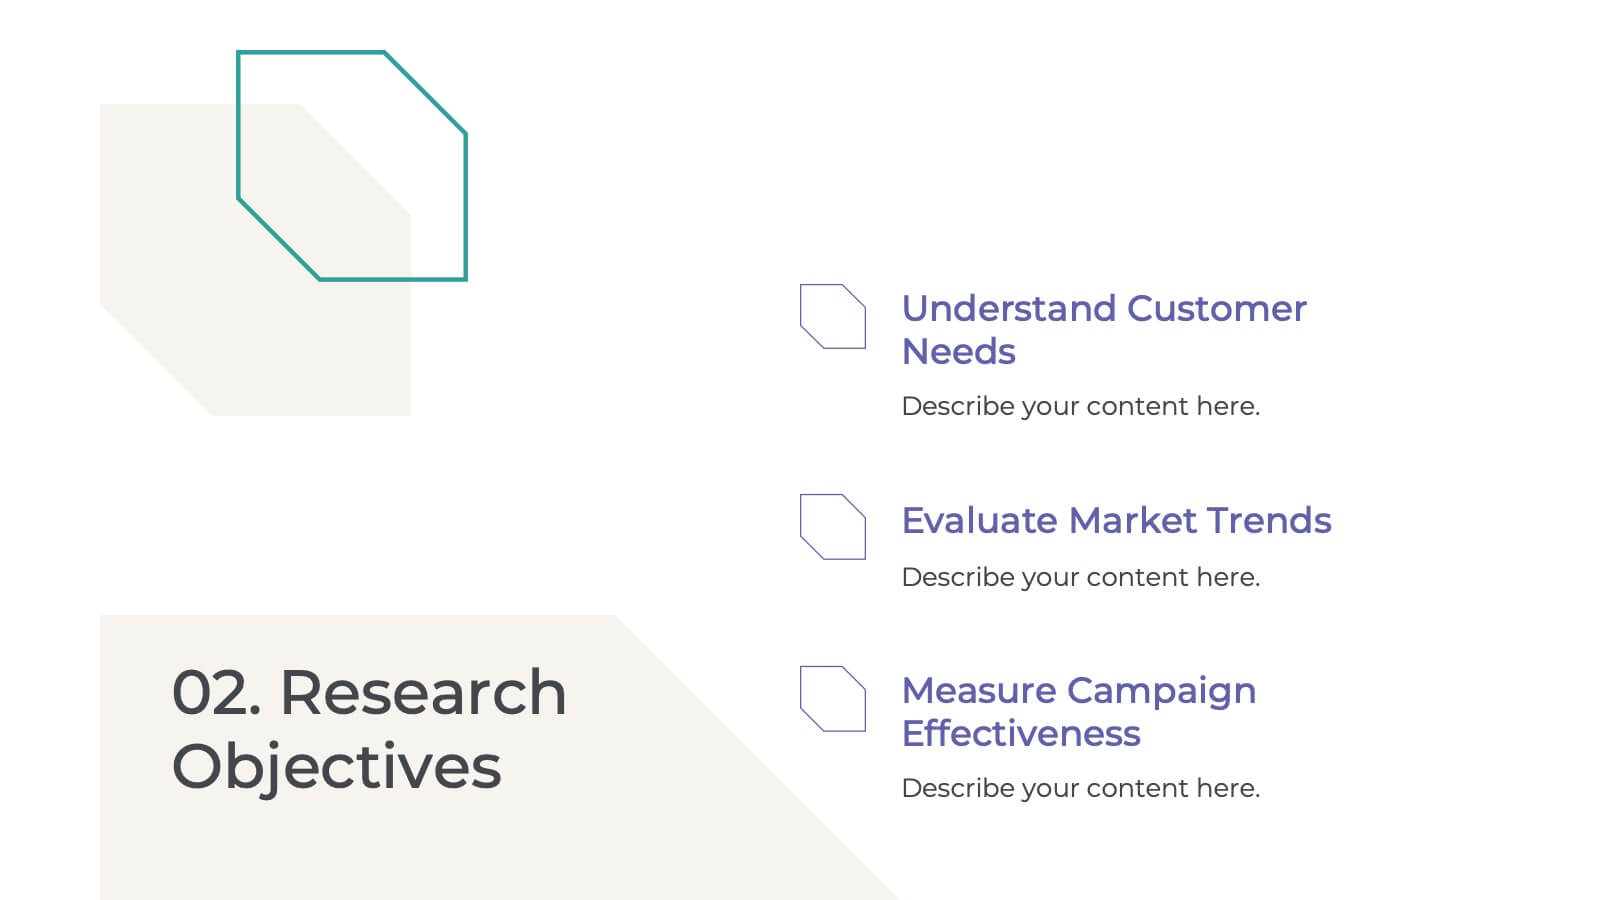
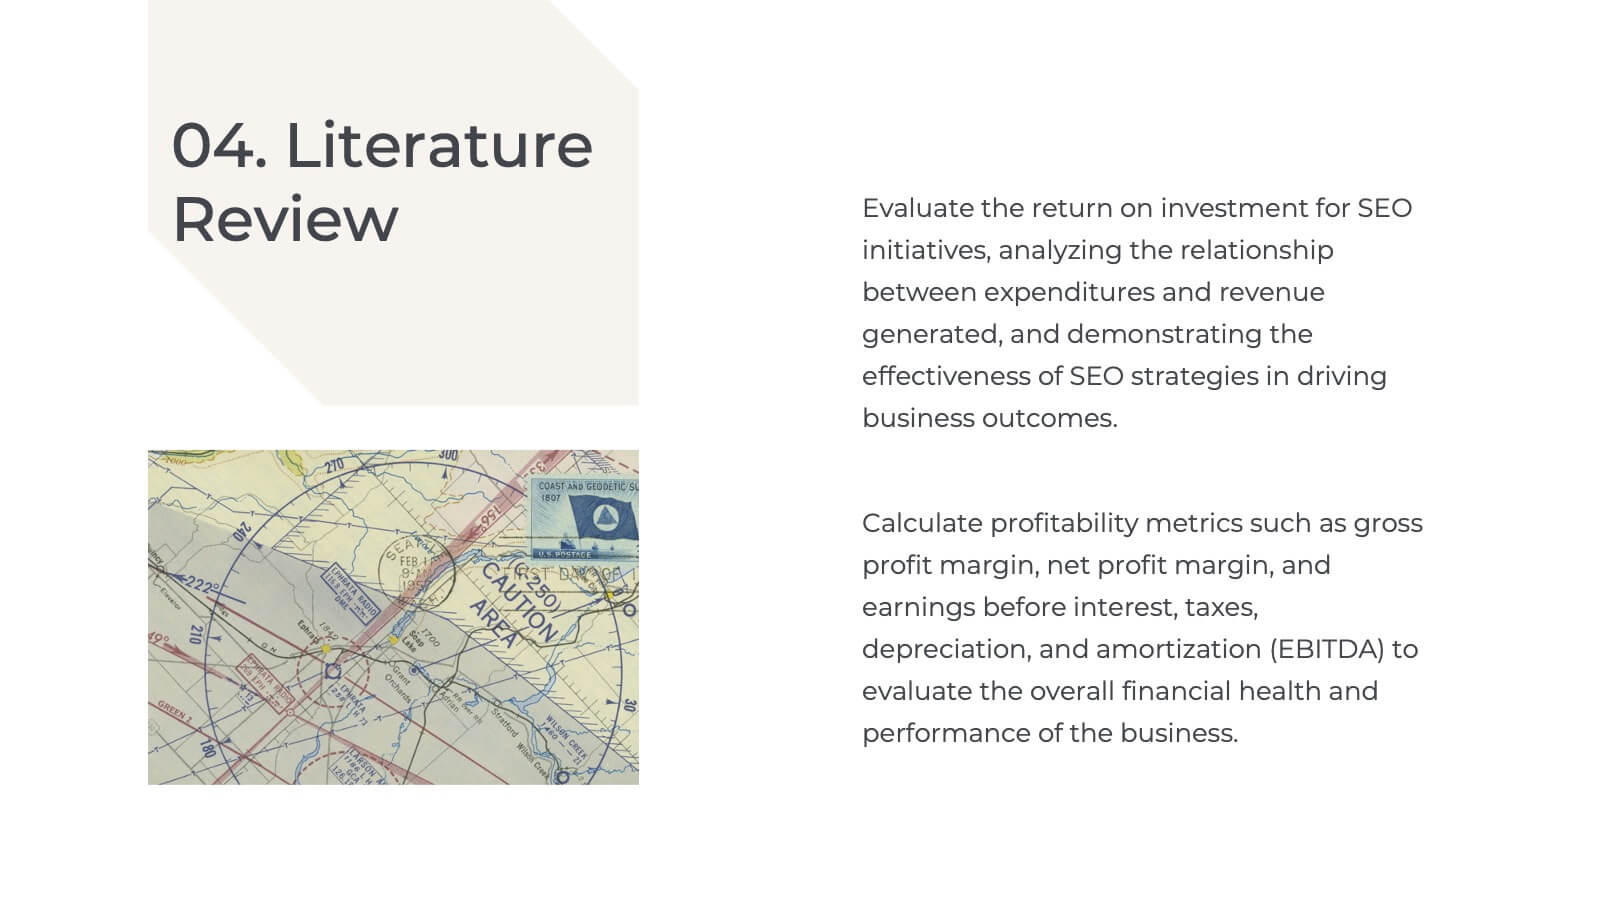
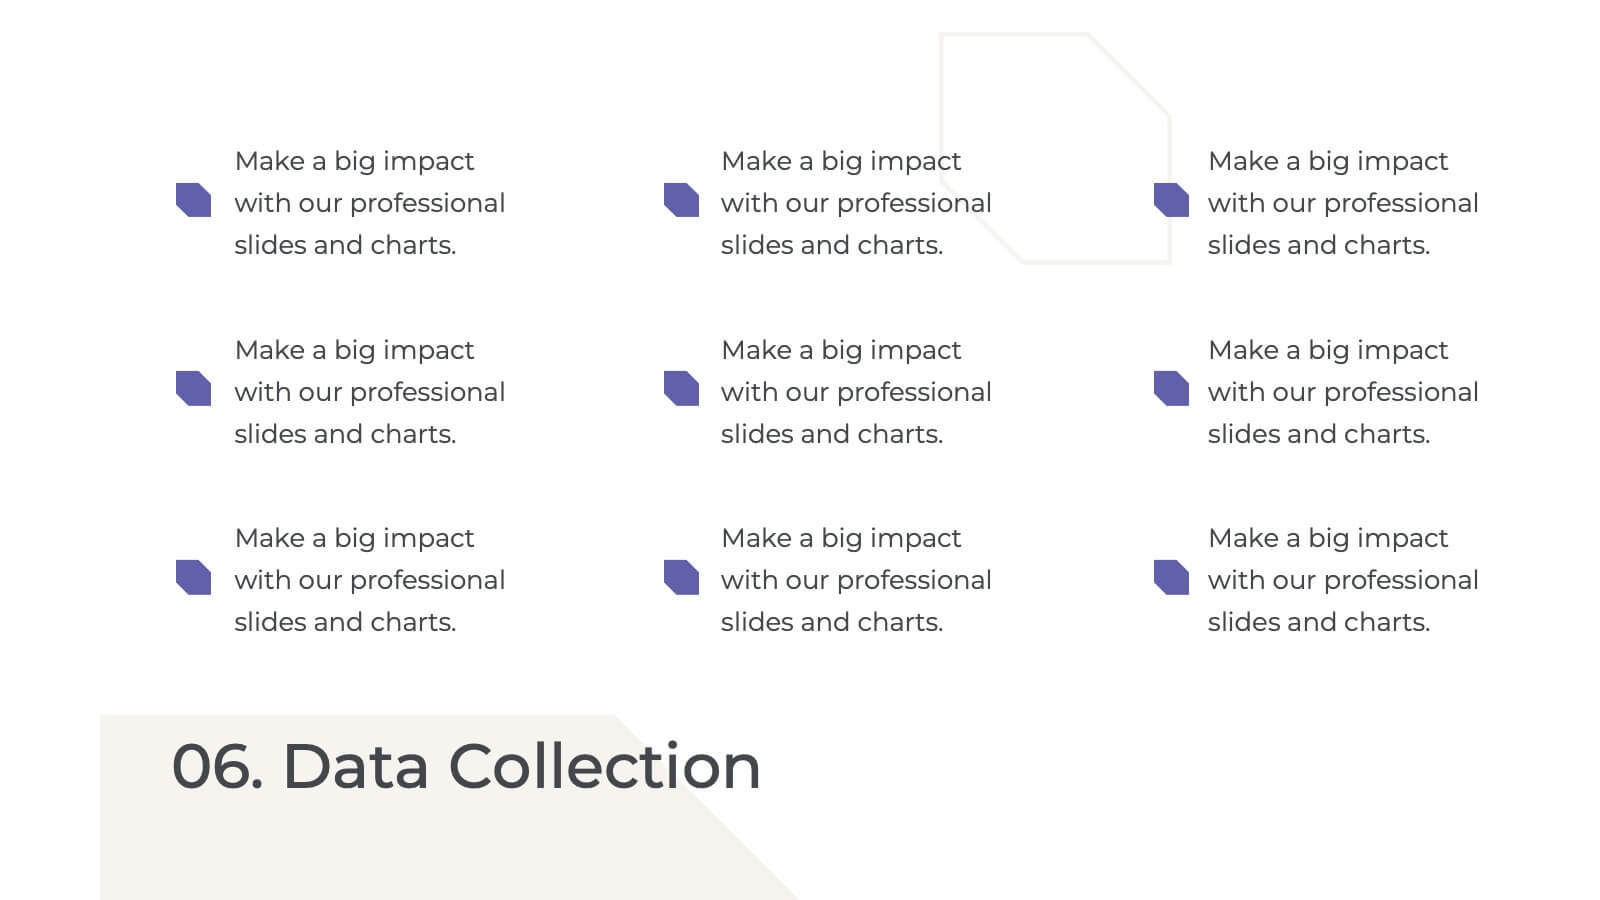
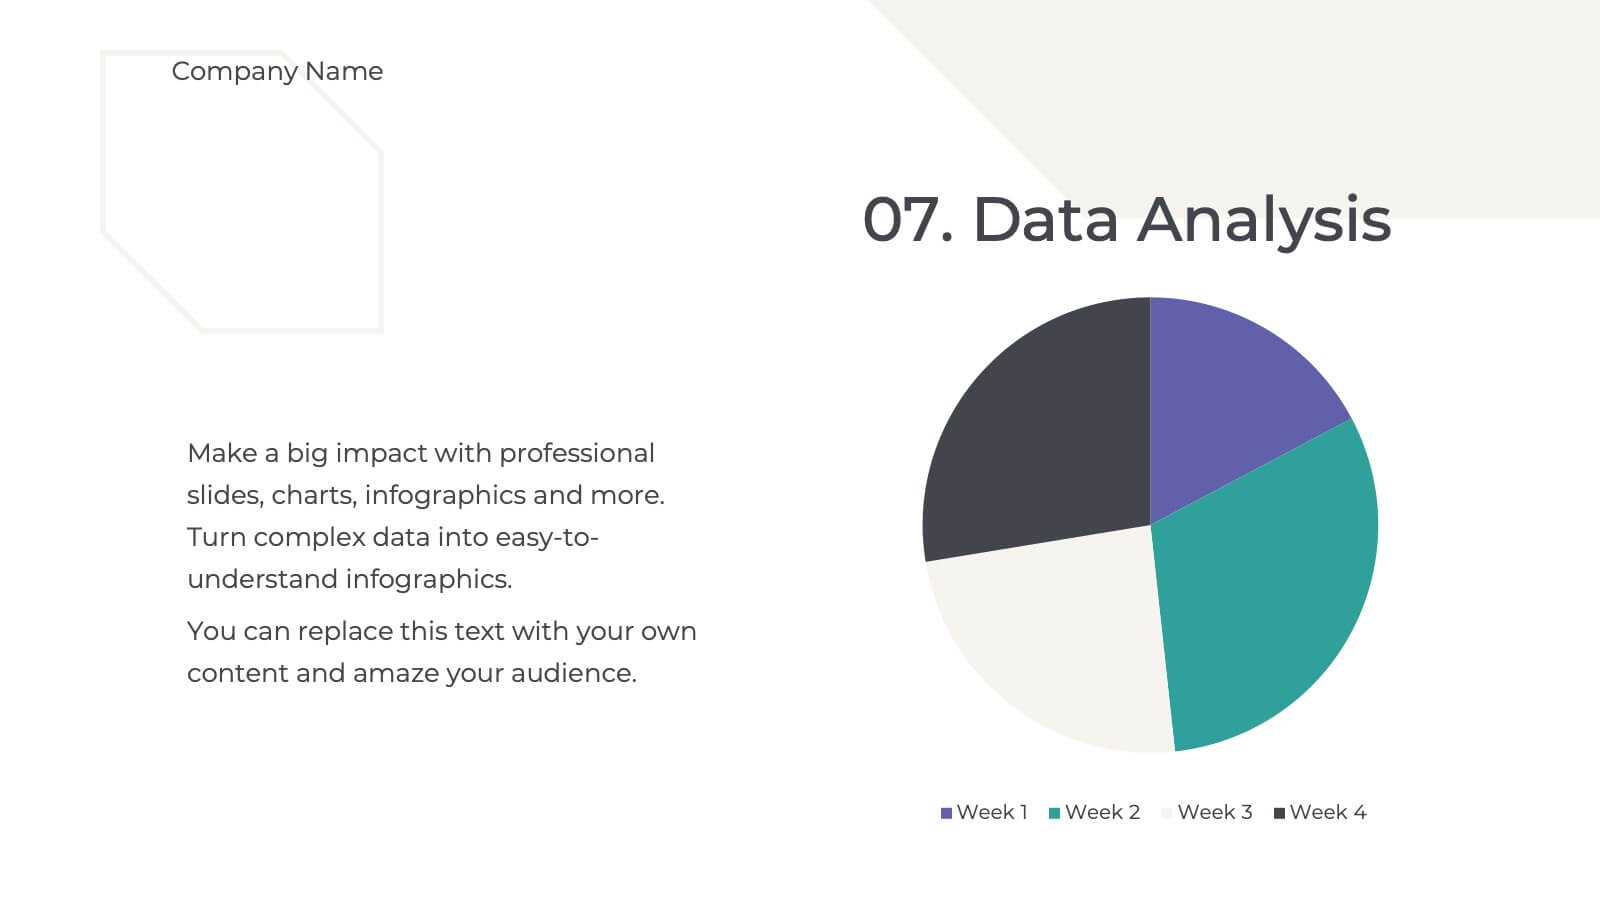
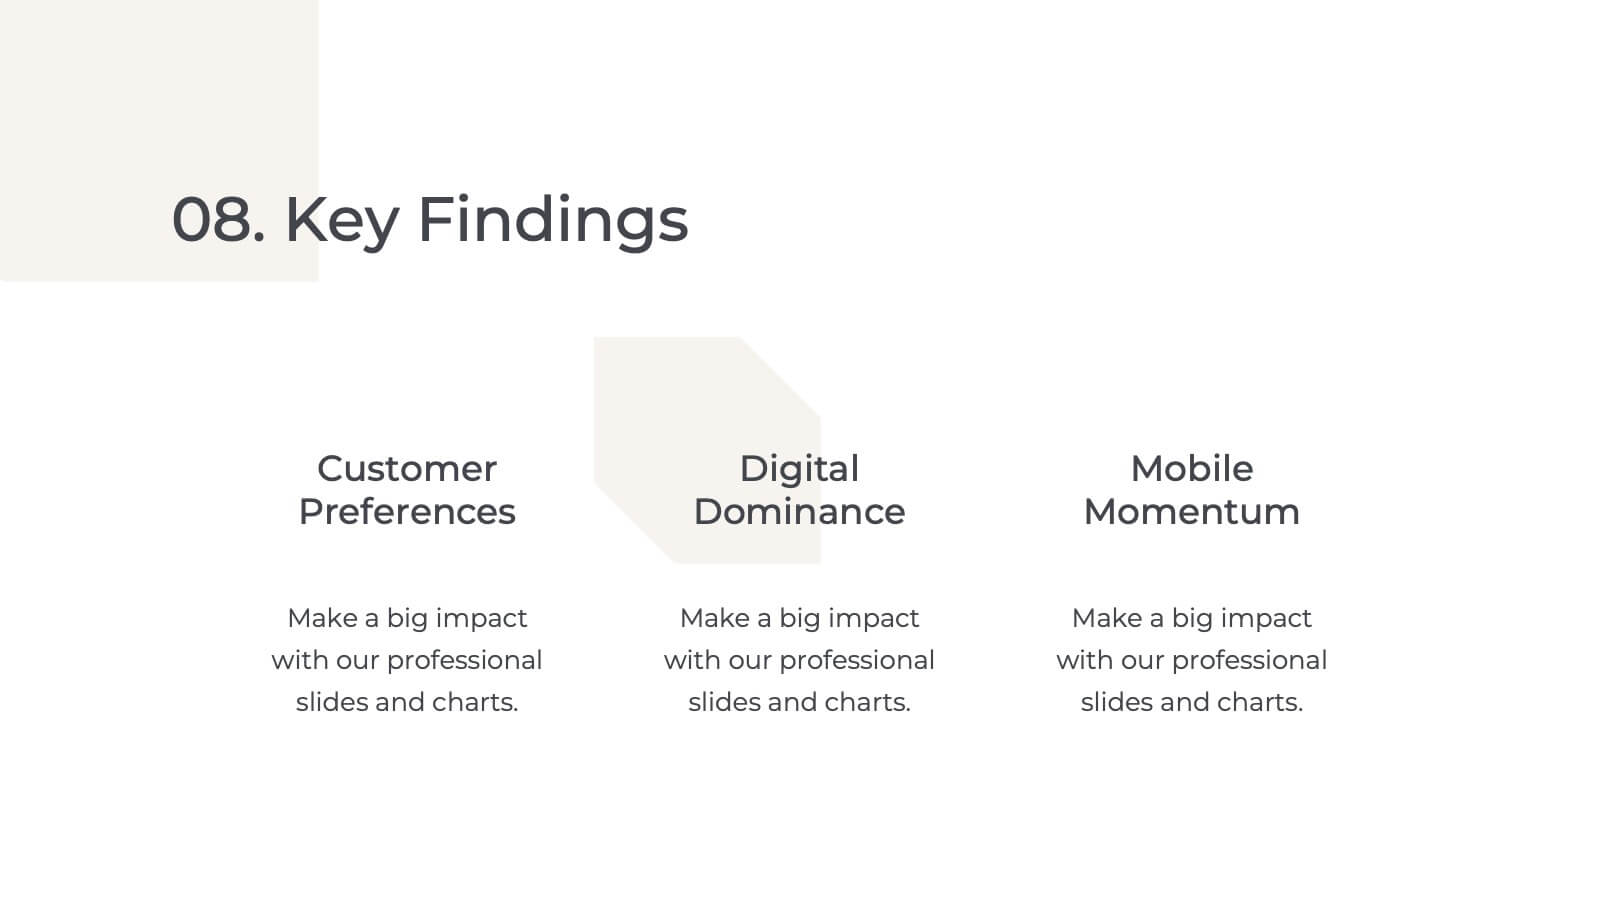
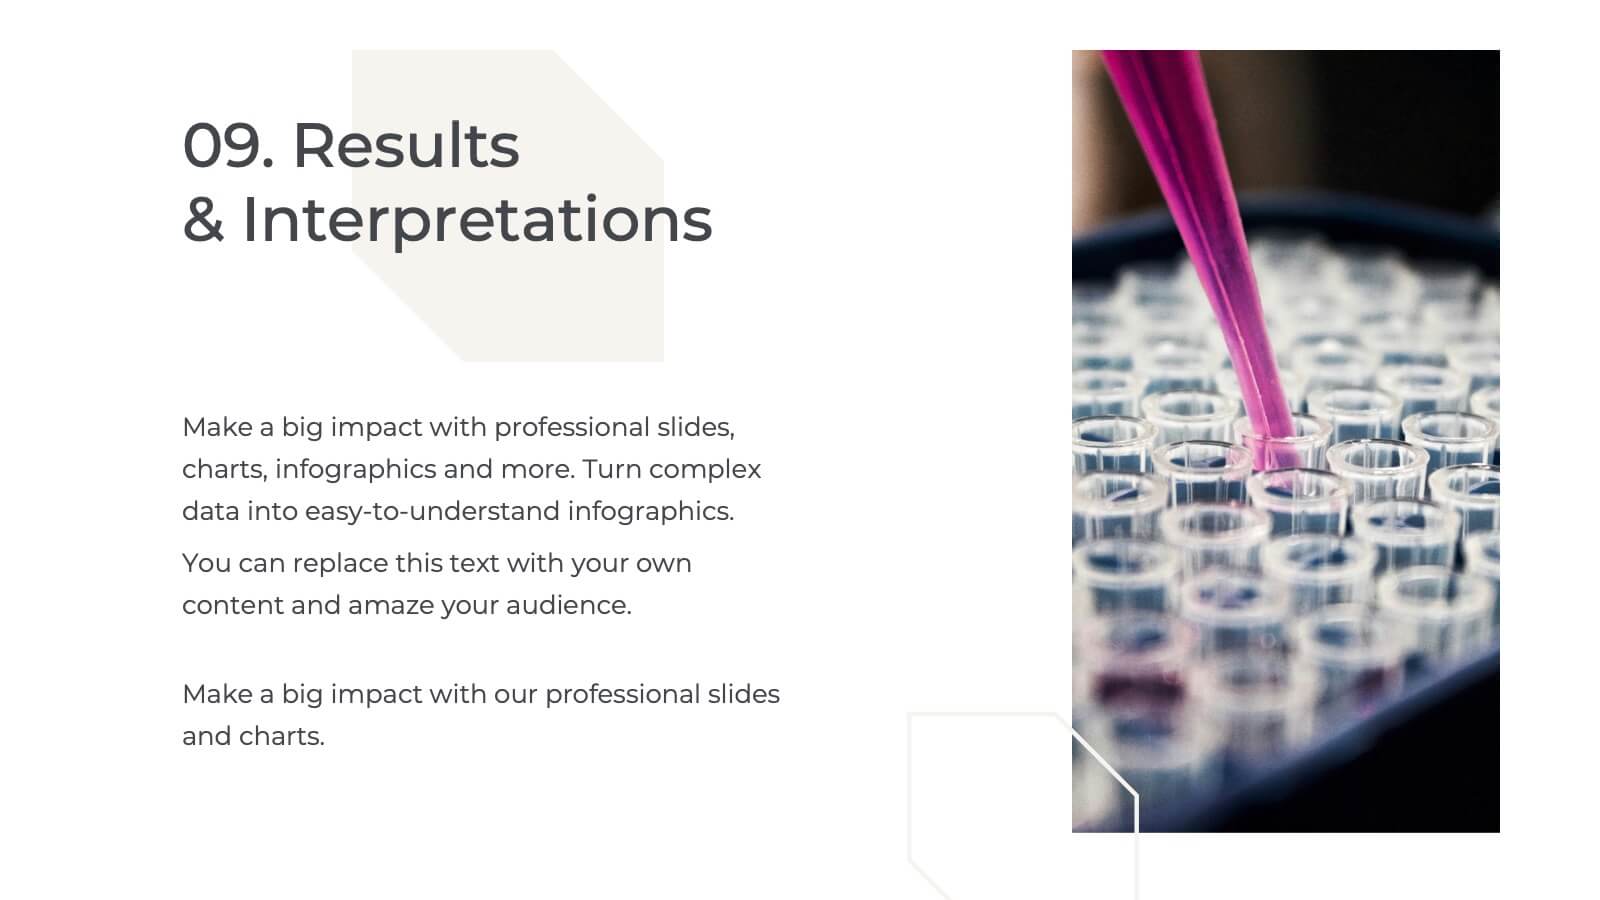
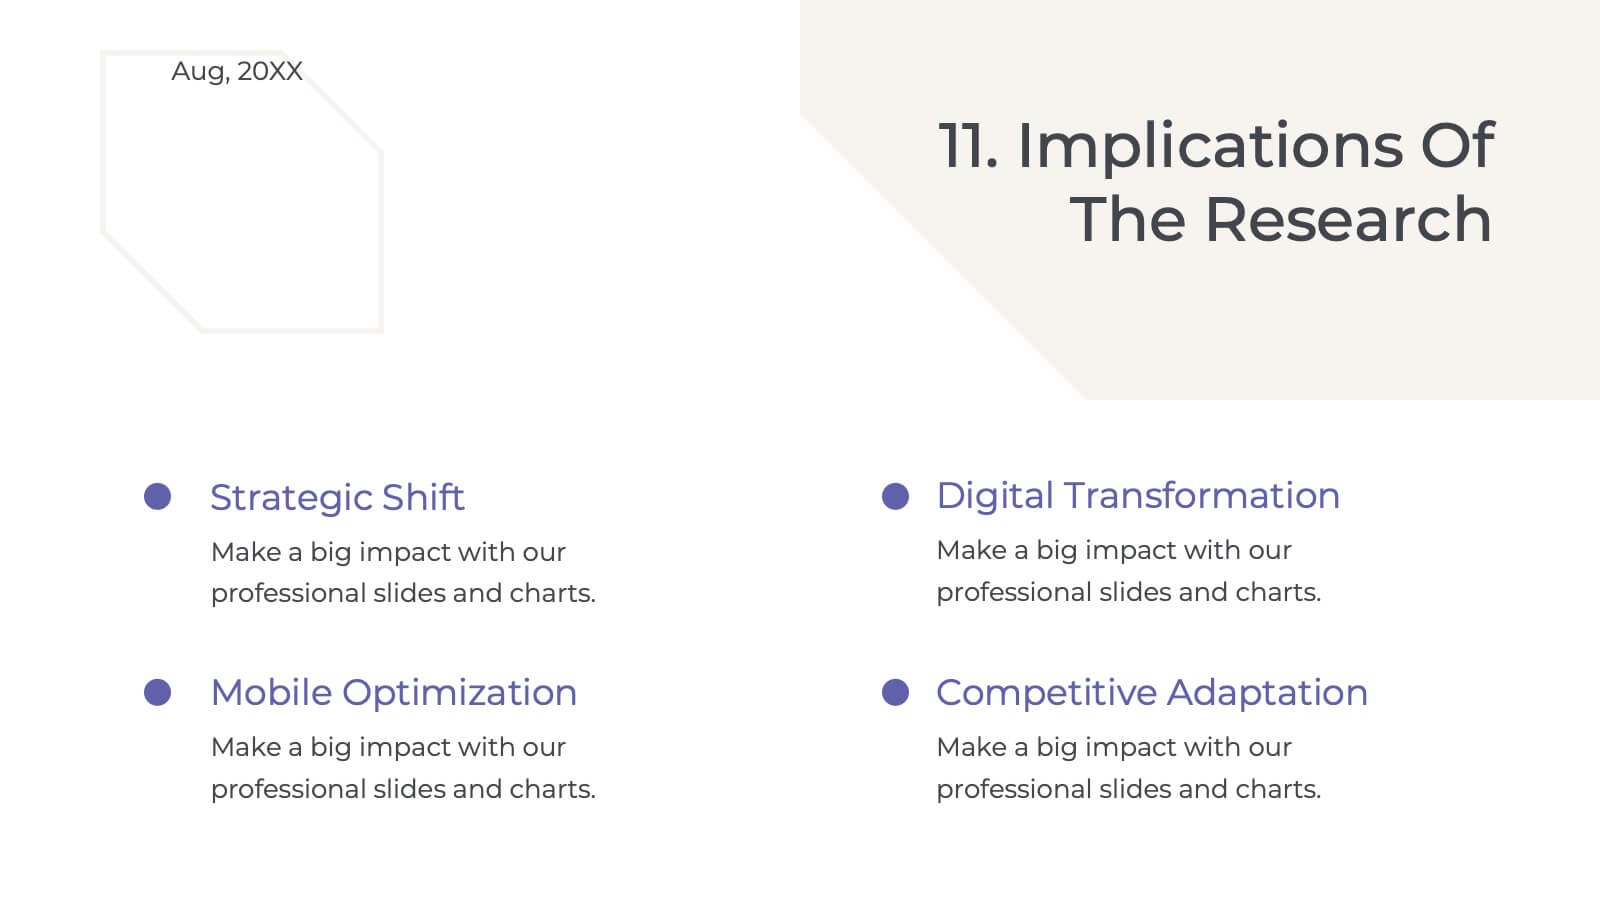
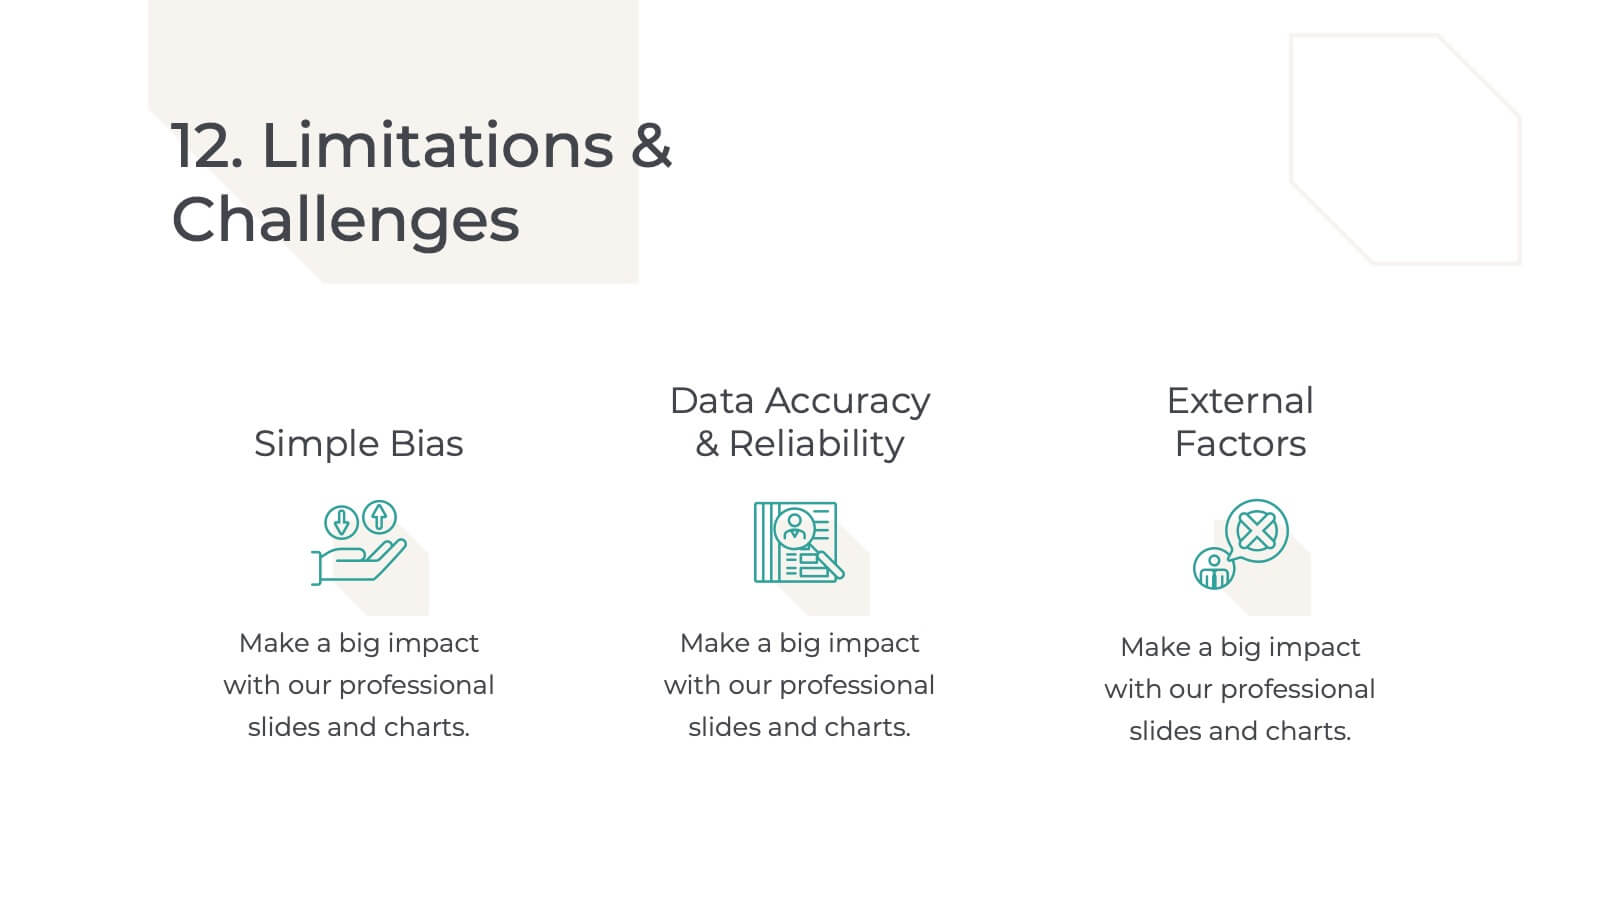
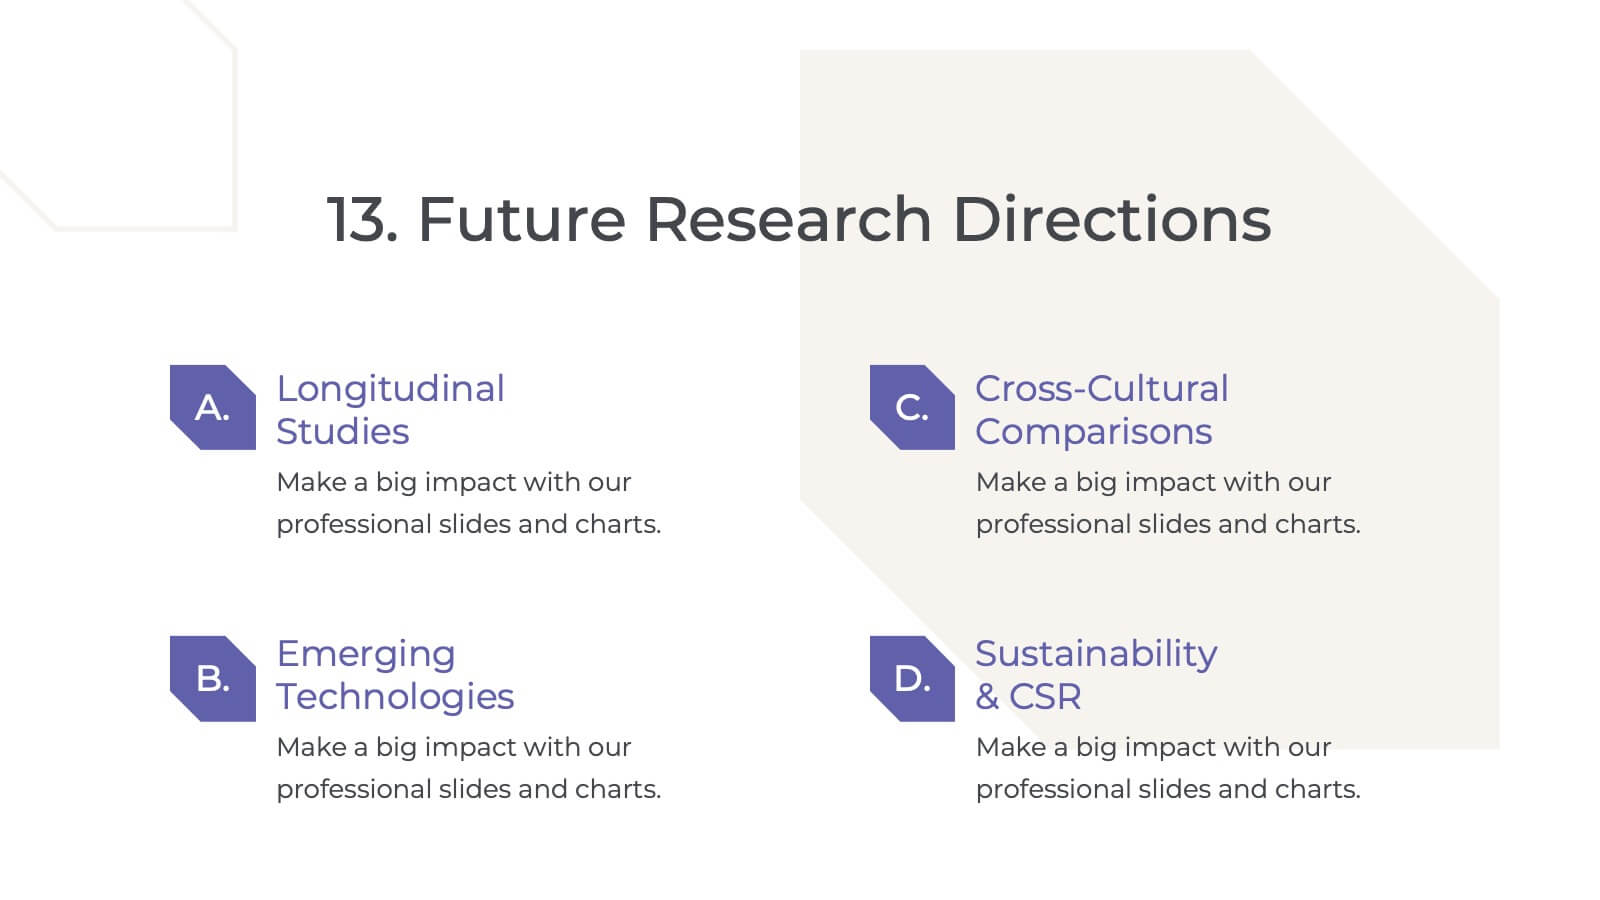
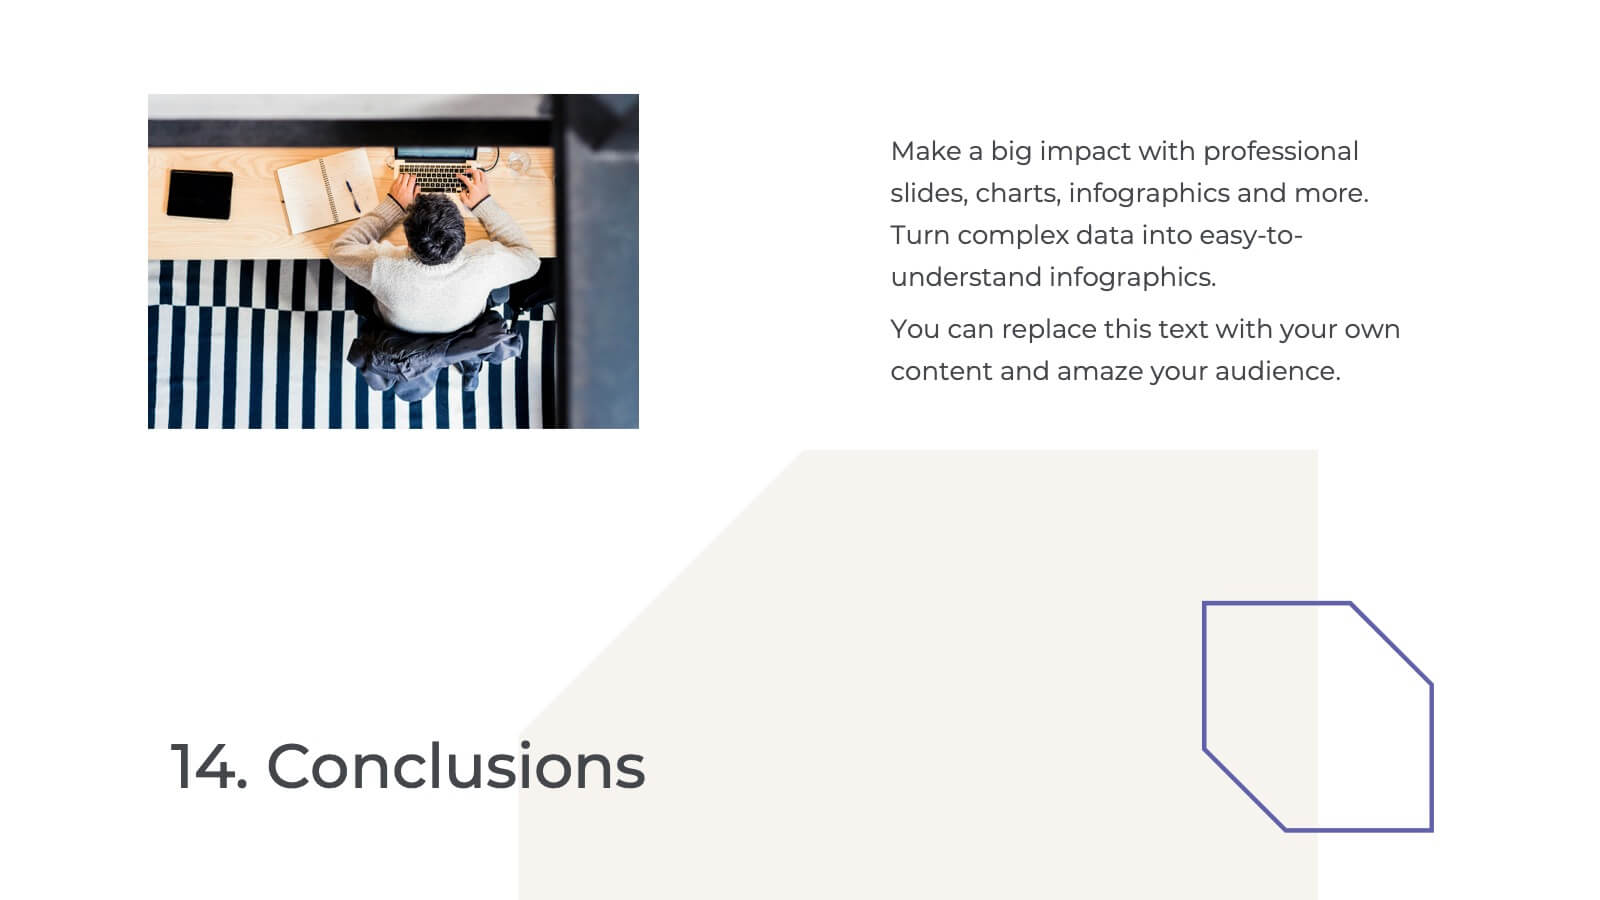
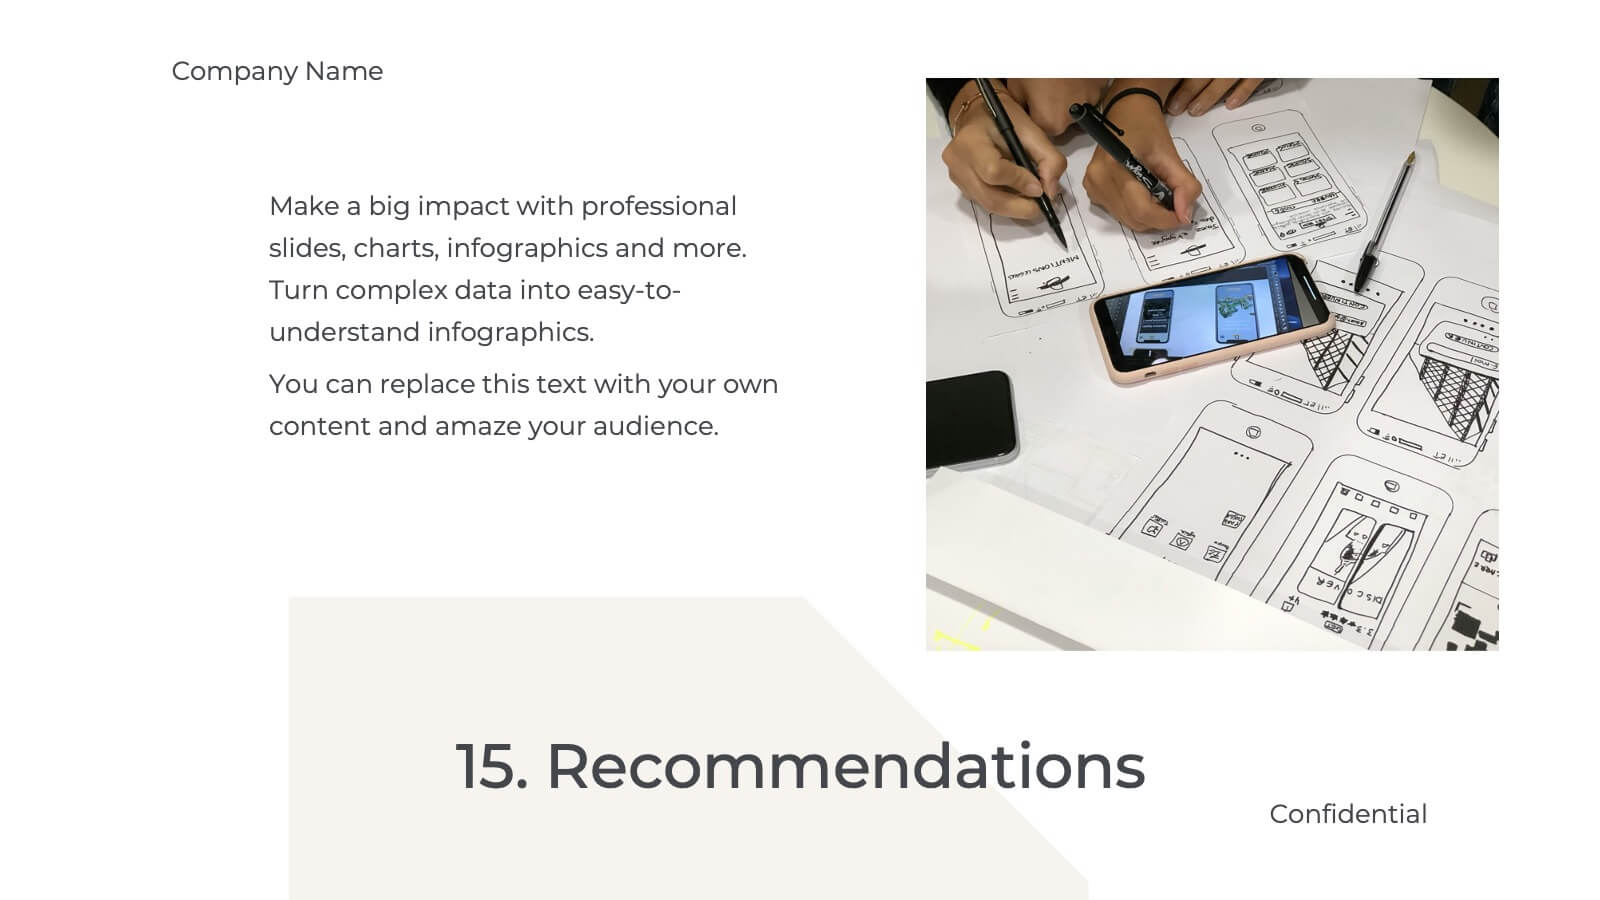
Palladium Qualitative Research Findings Presentation
Present your qualitative research findings effectively with this sleek, professional template. It includes sections for objectives, data analysis, key findings, and recommendations. Ideal for organizing research insights clearly, it's customizable and compatible with PowerPoint, Keynote, and Google Slides, ensuring smooth collaboration and impactful presentations for your audience.


6 diapositivas
Corporate Framework Planning Presentation
Organize and present your strategic plans with this clean corporate framework layout. Ideal for showcasing six key areas of focus, this slide helps communicate business insights, goals, and execution pillars clearly. Fully editable in Canva, PowerPoint, and Google Slides—perfect for business plans, executive meetings, or internal project reviews.