


Características


¿Tienes alguna pregunta?
Recomendar


4 diapositivas
Three-Part Triangle Model Presentation
Show the perfect balance between three core ideas with this dynamic triangular layout. Designed for clarity and structure, it’s ideal for visualizing strategies, models, or relationships in a professional way. Fully editable and compatible with PowerPoint, Keynote, and Google Slides for effortless customization and polished results.


5 diapositivas
Closing Statement with Highlights Presentation
Wrap up your presentation with this clean, step-by-step summary slide. Featuring a rising arrow path and a trophy icon, it’s ideal for showcasing final insights or major achievements. Highlight up to five key points clearly and concisely. Fully customizable in PowerPoint, Keynote, and Google Slides for seamless presentation use.


5 diapositivas
Buyer Persona Strategy Presentation
Enhance Customer Understanding! The Buyer Persona Strategy Presentation template helps analyze customer behaviors, goals, and frustrations to create targeted marketing strategies. Fully editable and compatible with PowerPoint, Keynote, and Google Slides, it’s perfect for marketers and strategists looking to optimize engagement with a modern, professional, and visually compelling layout.


20 diapositivas
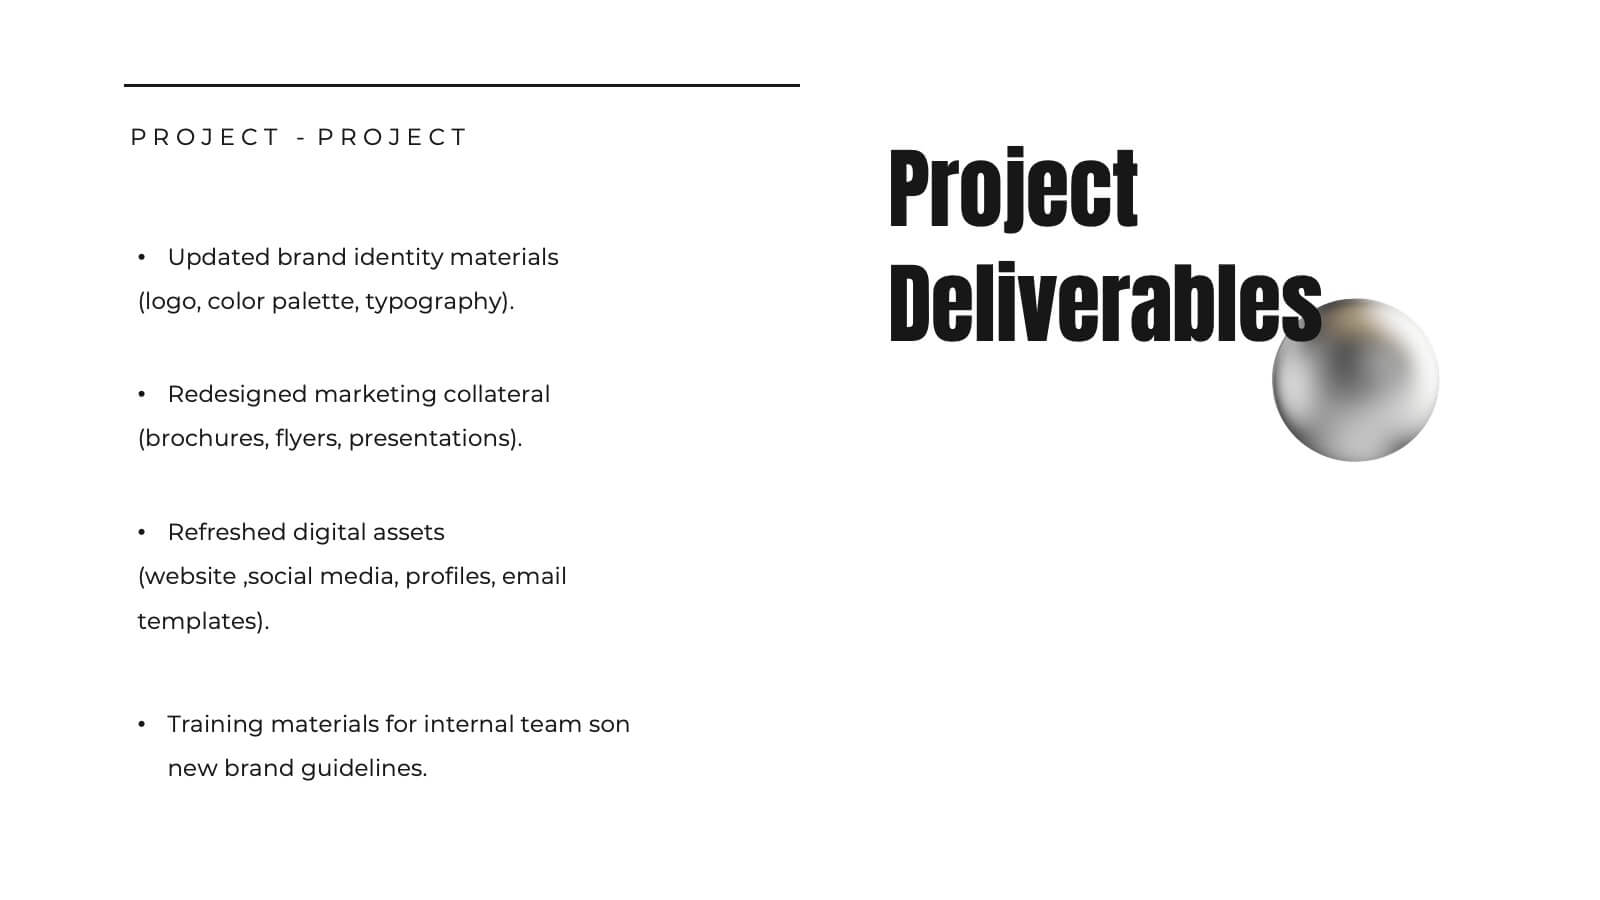
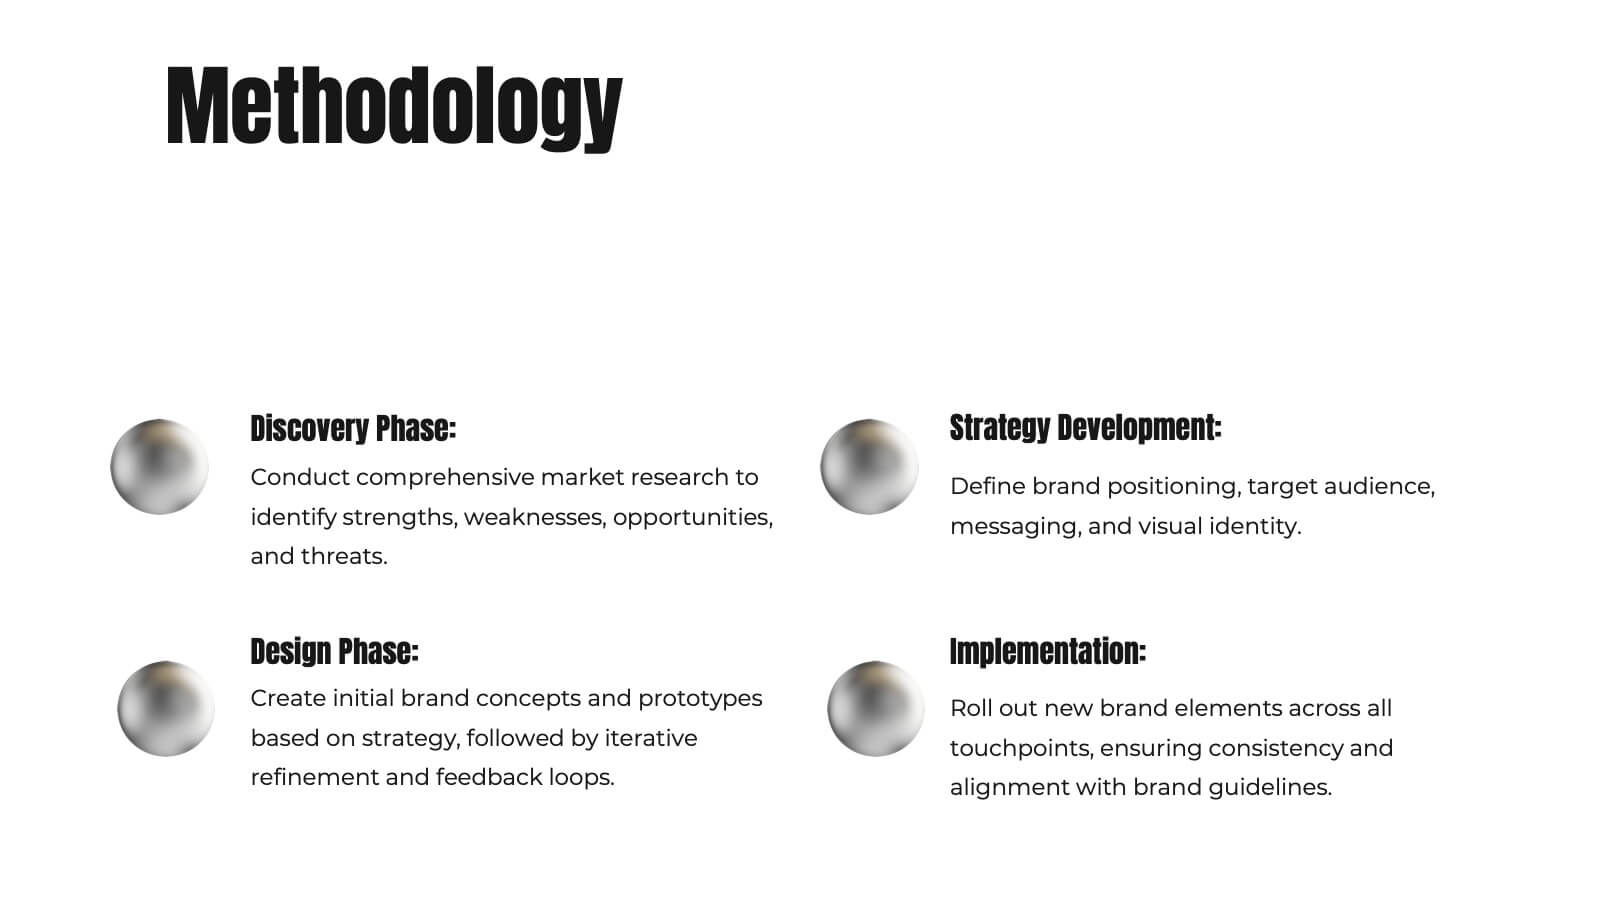
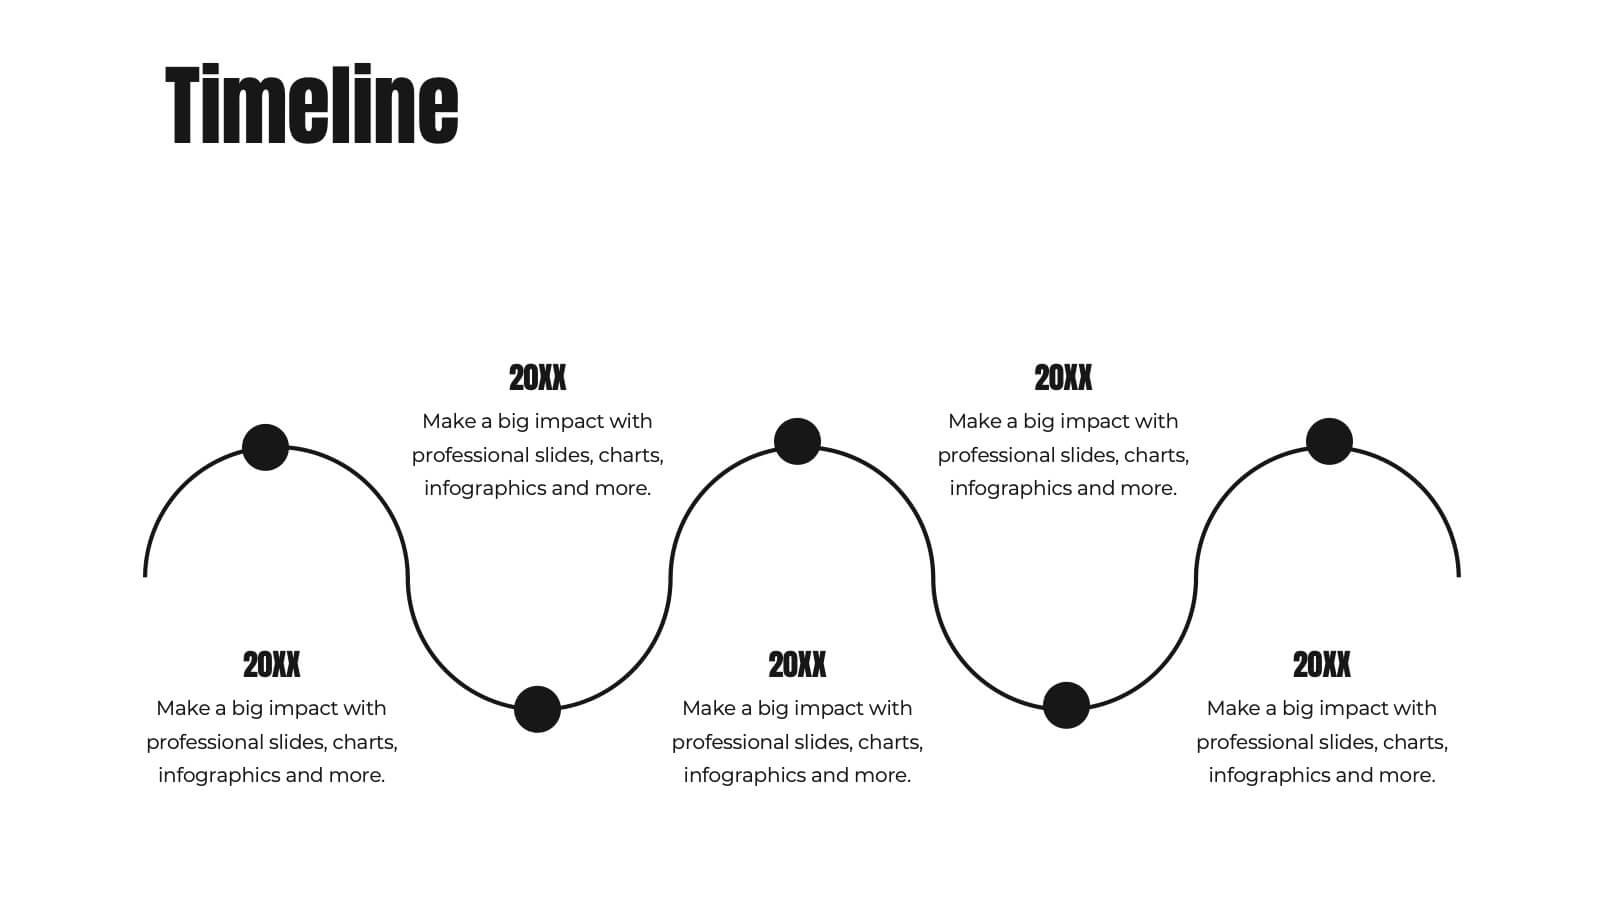
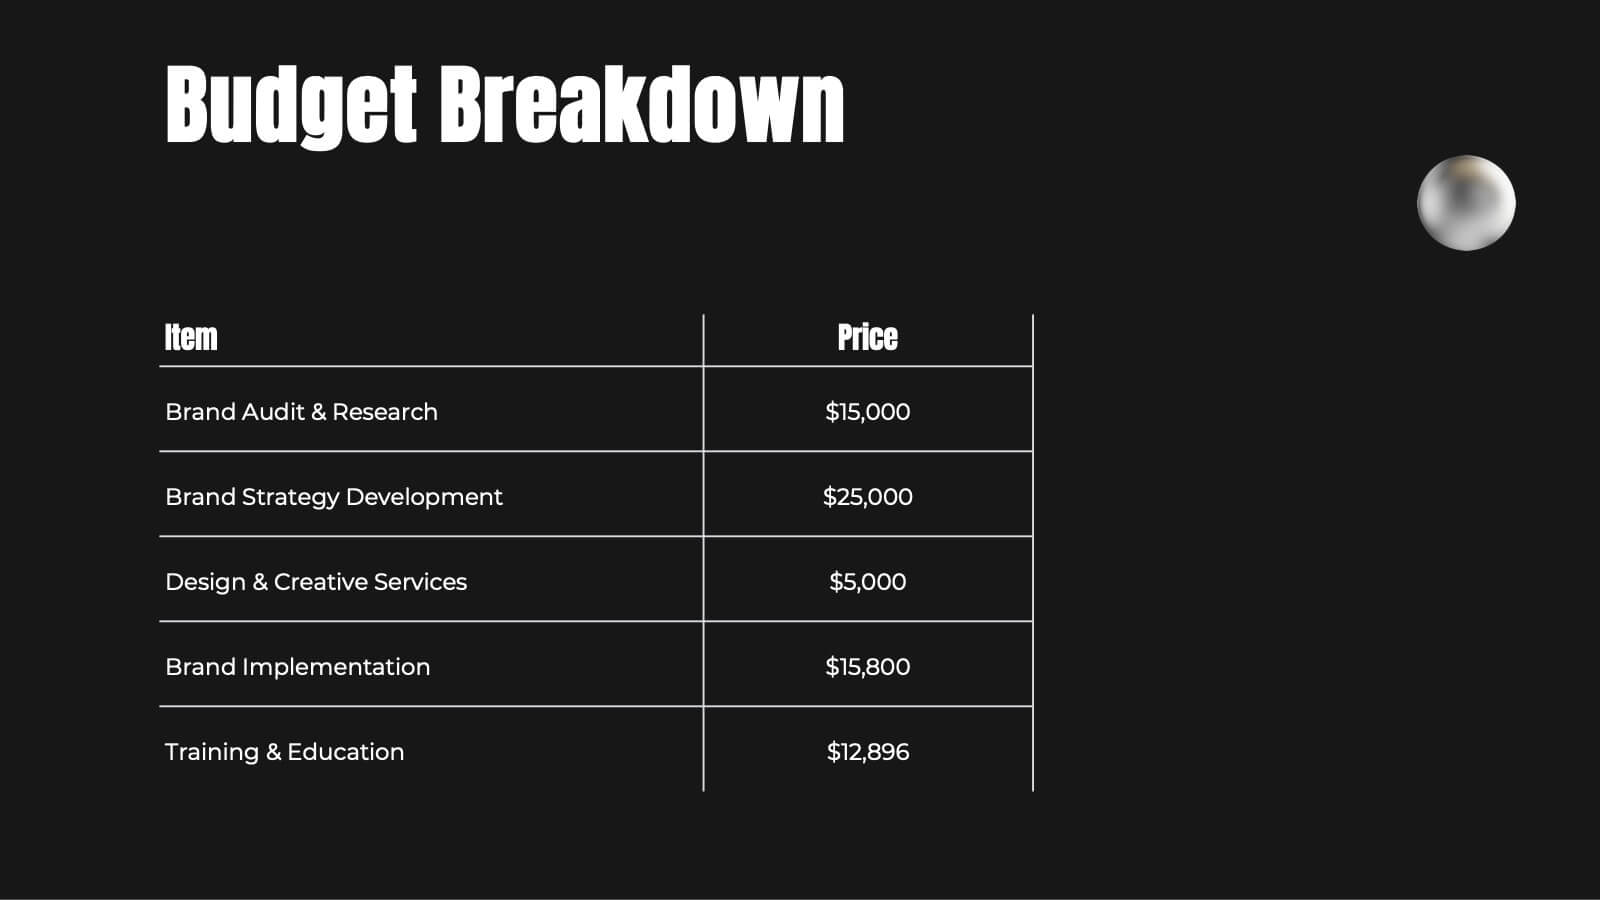
Illumira Design Proposal Presentation
Impress clients with this modern and professional design proposal presentation template. It covers key sections such as project summary, objectives, budget breakdown, and action plans. Fully customizable with clean layouts and engaging visuals, perfect for showcasing your design solutions effectively. Compatible with PowerPoint, Keynote, and Google Slides.


3 diapositivas
Business Project Proposal Pitch Presentation
Win Your Next Big Deal! The Business Project Proposal Pitch Presentation is designed to impress, featuring sleek data visuals, key insights, and a structured layout for persuasive storytelling. Ideal for startups, corporate pitches, and investment proposals, this template is fully customizable and works with PowerPoint, Keynote, and Google Slides for seamless editing.


4 diapositivas
Patient Care Plan and Metrics Presentation
Turn healthcare data into meaningful stories with this modern and professional presentation. Perfect for highlighting patient progress, clinical outcomes, and care efficiency, it balances visuals and data for clarity and impact. Easy to edit and fully compatible with PowerPoint, Keynote, and Google Slides for smooth customization.


4 diapositivas
Segmented Metrics Pie Chart Overview Presentation
Present your performance data with precision using the Segmented Metrics Pie Chart Overview Presentation. This clean and modern slide design features a donut-style pie chart divided into clearly marked percentage segments, ideal for showcasing metric distribution, KPI breakdowns, or analytical summaries. Each slice is color-coded and paired with editable labels and icons, making complex data easy to digest at a glance. Perfect for business reviews, dashboards, or investor updates. Fully compatible with PowerPoint, Keynote, and Google Slides for effortless customization.


6 diapositivas
Funding Request Project Proposal
Visually communicate your project's financial needs using this tiered Funding Request Project Proposal slide. With a stacked layout ideal for outlining budget categories or funding stages, it’s perfect for grant applications, investor decks, or internal pitches. Fully customizable in PowerPoint, Keynote, and Google Slides.


4 diapositivas
Social Campaign Planning Presentation
Bring clarity to your outreach goals with a bold, funnel-style layout that makes every campaign step easy to visualize. This presentation helps you outline stages, objectives, and audience actions in a clean, structured format ideal for marketing teams. Fully editable and compatible with PowerPoint, Keynote, and Google Slides.


4 diapositivas
Real Estate Market Trends
Present housing data and property growth insights with this ascending building chart layout. Perfect for realtors, investors, and market analysts, this template helps visualize real estate performance over time. Fully editable in PowerPoint, Keynote, and Google Slides.


21 diapositivas
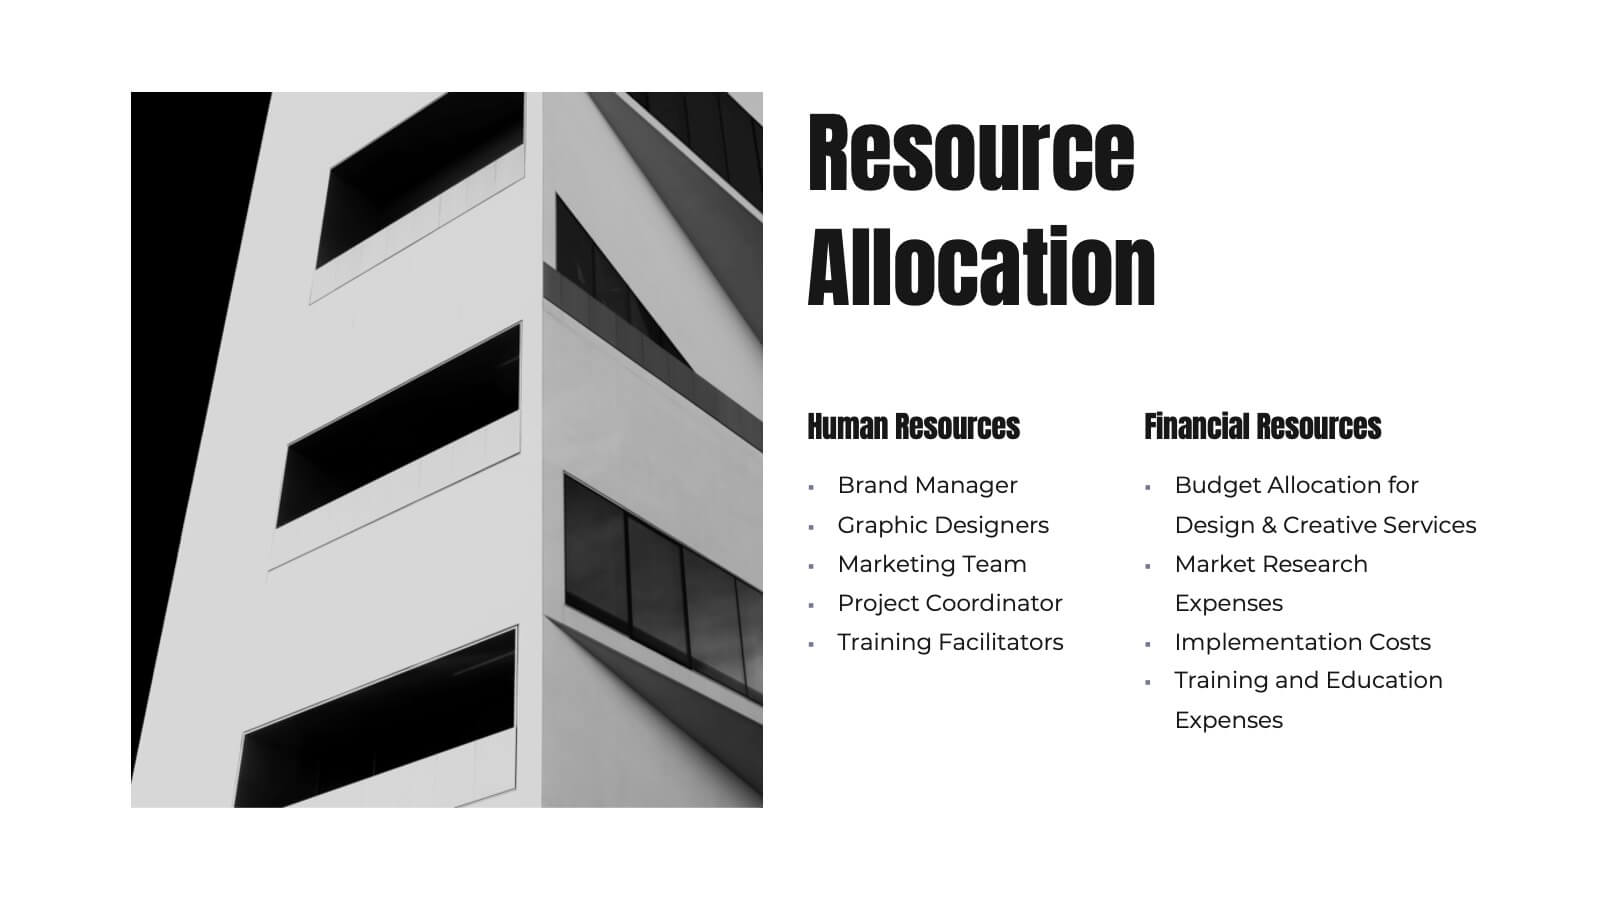
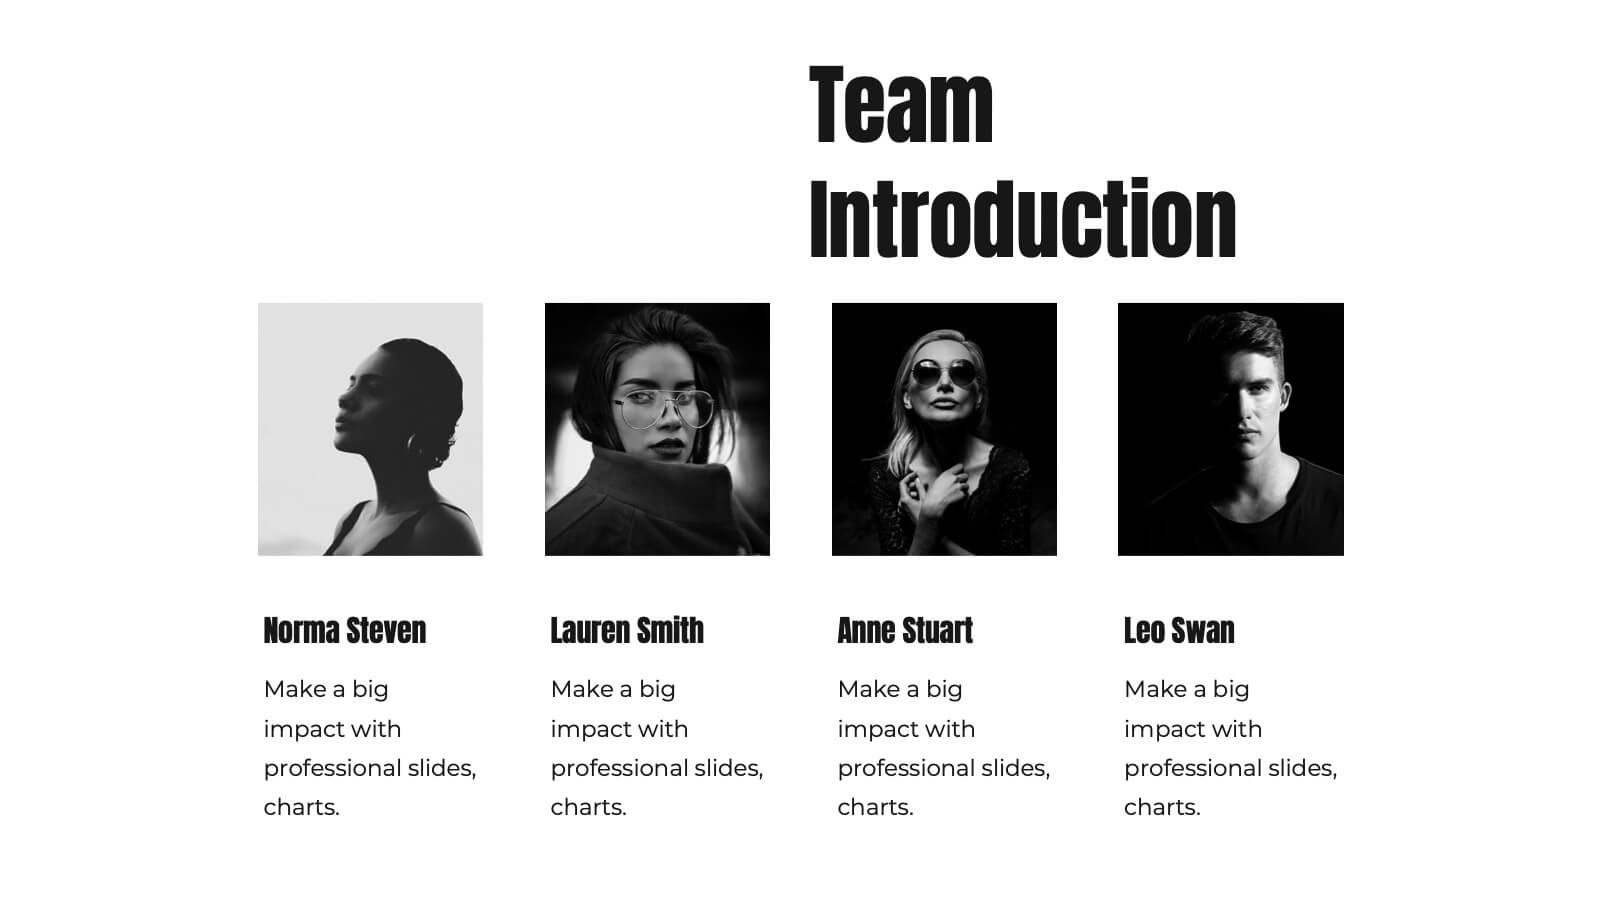
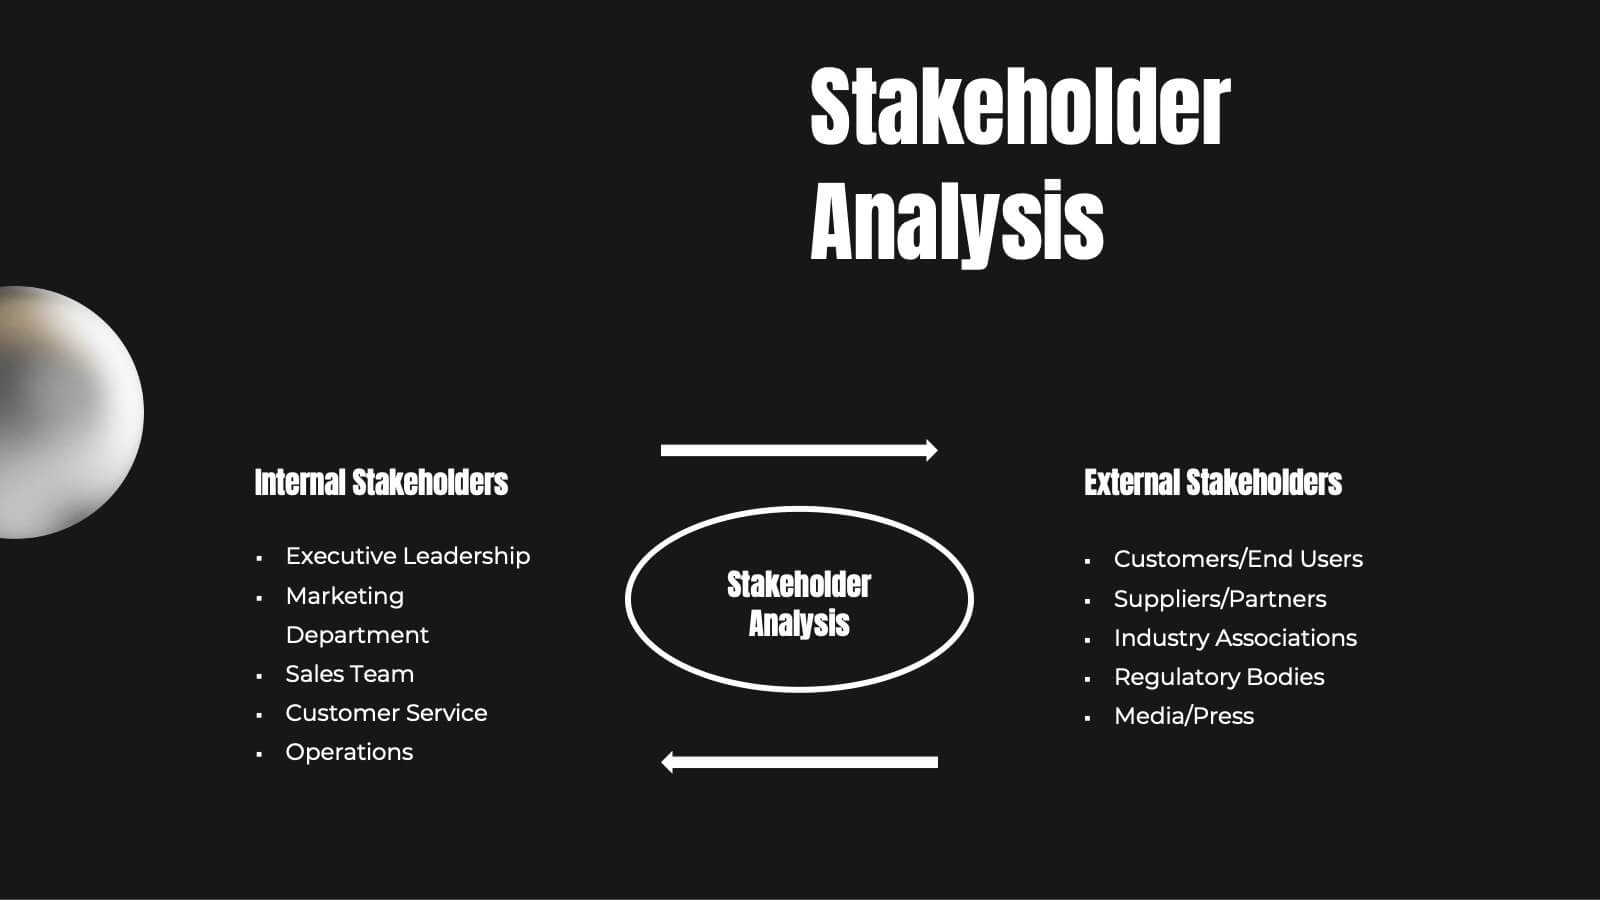
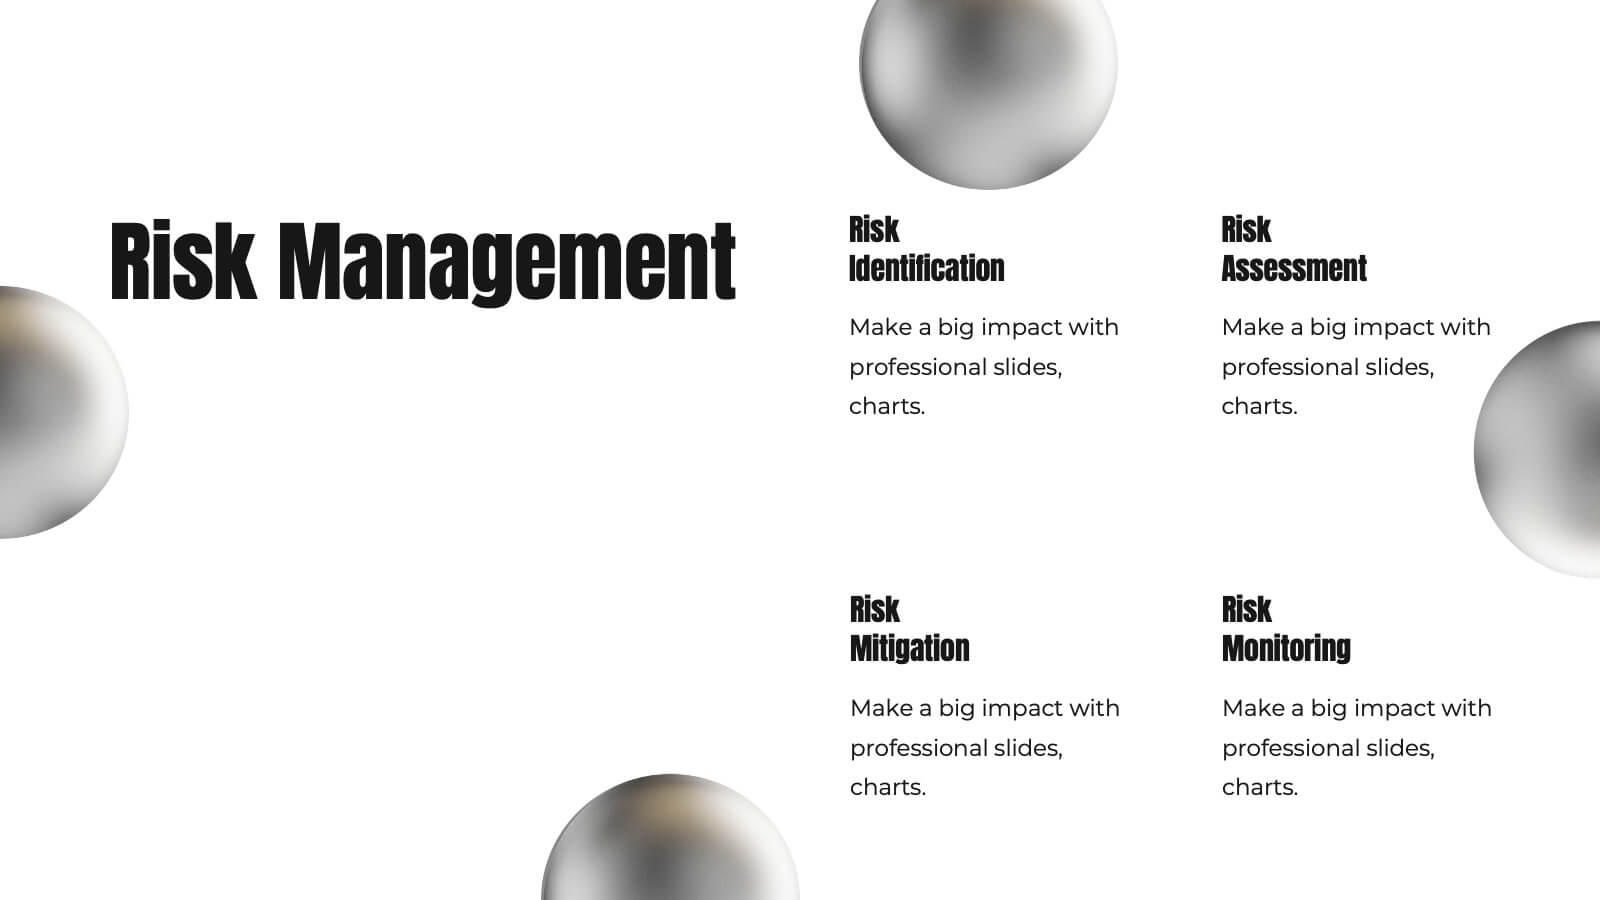
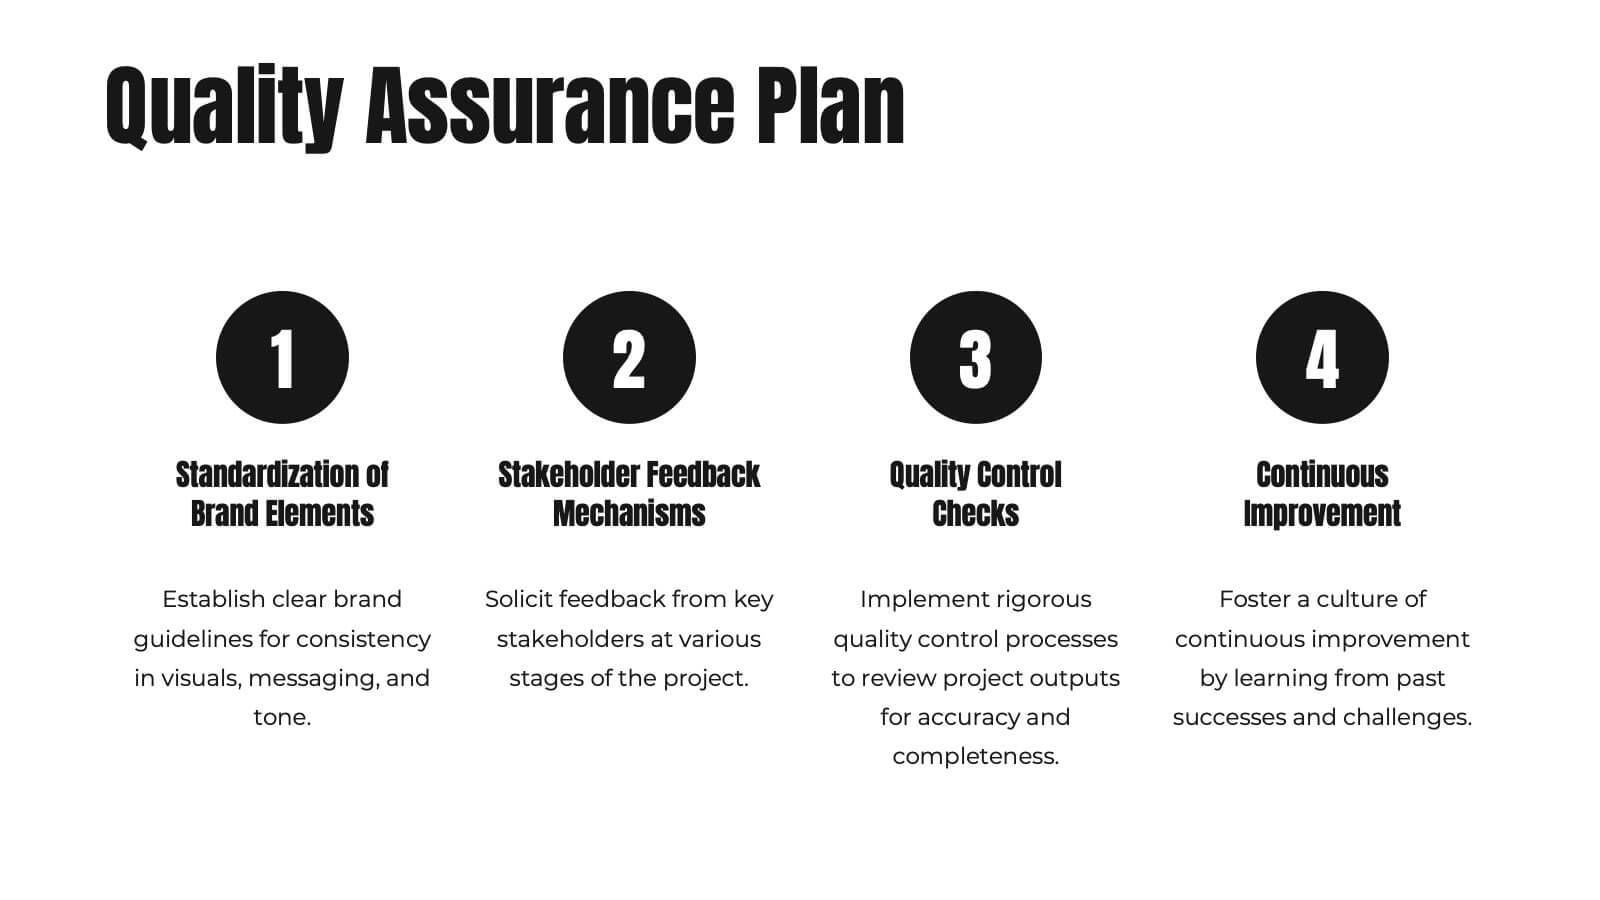
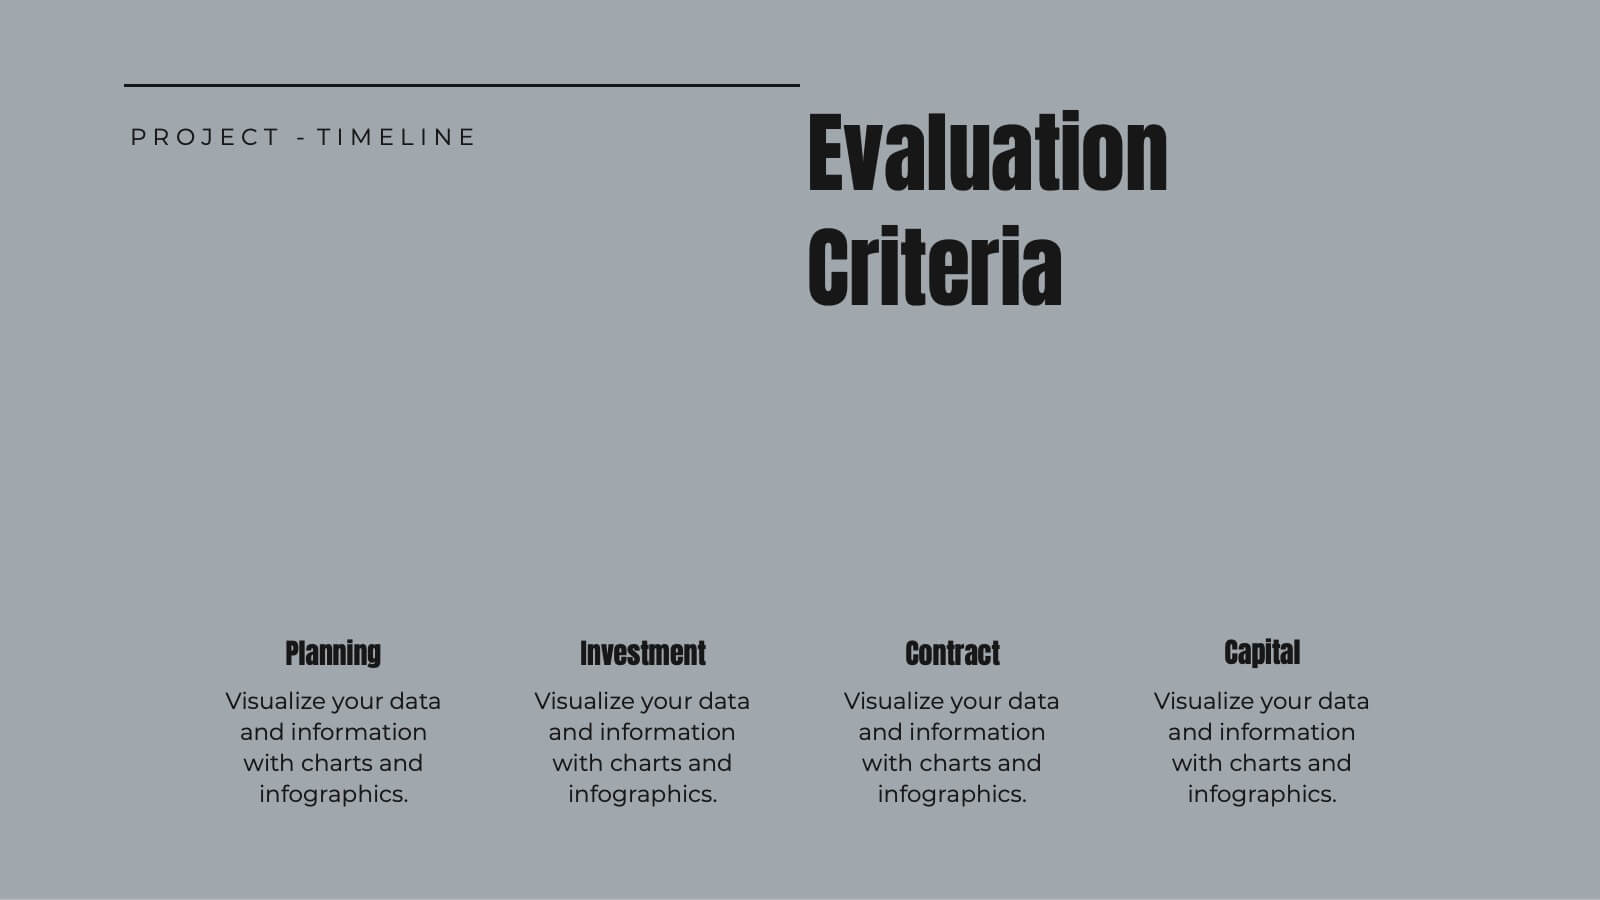
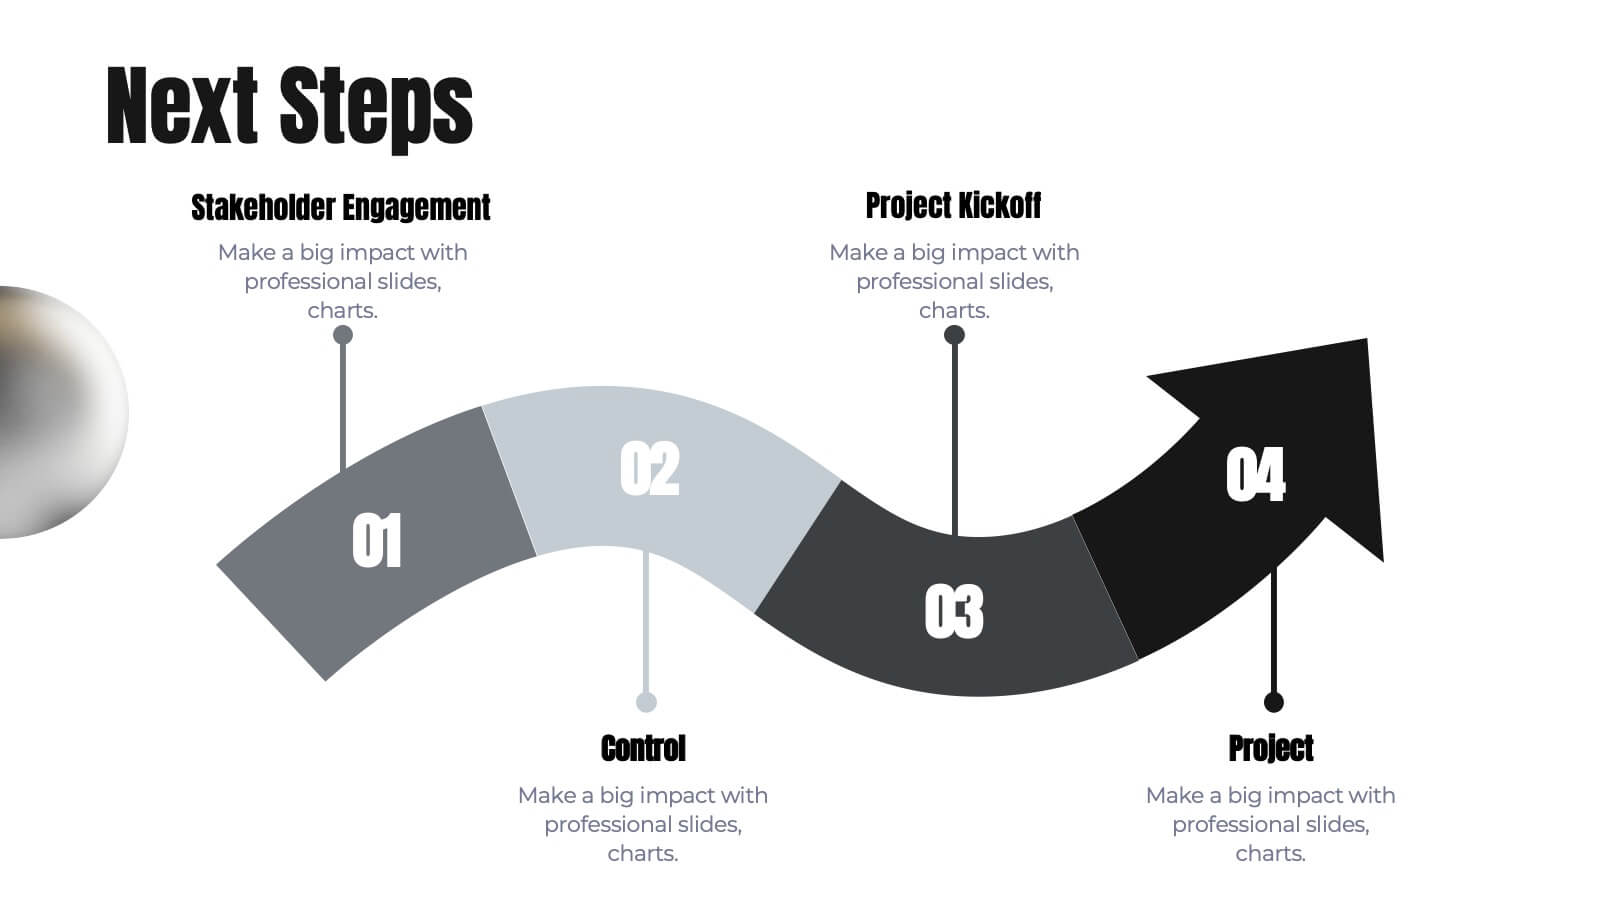
Janus Project Timeline Presentation
Craft a seamless project plan with this sleek and professional presentation template! Designed to guide you through every step, from project overview and scope of work to risk management and resource allocation, this template covers all the essentials. It's perfect for keeping your team on track with clear deliverables, timelines, and evaluation criteria. Compatible with PowerPoint, Keynote, and Google Slides for effortless presentations.


7 diapositivas
Funnel Web Infographic
Maximize your insights with our funnel web infographic. This template is a highly informative tool designed to help you illustrate and understand various processes, from sales pipelines to user engagement funnels. This funnel infographic is all about presenting data in an engaging, easy-to-digest manner. Ideal for marketing professionals, business strategists, and anyone looking to visualize multi-step processes. Compatible with Powerpoint, Keynote, and Google Slides. You can add a vibrant yet professional color scheme to ensure attention of information. Present your data in a visually captivating way!


10 diapositivas
Customer Conversion Funnel Presentation
Optimize your customer journey presentations with our "Customer Conversion Funnel Presentation" template. This infographic elegantly depicts the conversion process across distinct stages, using a funnel design that visually narrows from awareness to action. Each segment is clearly labeled, simplifying the task of presenting strategies to enhance each phase of the customer experience. Ideal for marketers, sales teams, and strategists, this template helps clarify customer behavior and improve conversion rates. It’s a vital tool for any business focused on customer engagement and optimization. Fully compatible with PowerPoint, Keynote, and Google Slides, this template is crucial for effective communication and strategic planning.


6 diapositivas
Expert Tables Of Content Infographics
The "Expert Tables of Content" infographic template is a sophisticated and structured tool, designed to enhance presentations in PowerPoint, Keynote, and Google Slides. This template is ideal for authors, researchers, and professionals who need to present detailed content or reports in a clear and accessible format. This template efficiently organizes complex information into an easy-to-navigate format, showcasing chapters, sections, and key topics. It's tailored to highlight the depth and breadth of your content, making it an essential tool for academic presentations, business reports, or any comprehensive document requiring a detailed table of contents. The "Expert Tables of Content" infographic template revolutionizes the way we present complex information, perfectly crafted for PowerPoint, Keynote, and Google Slides. This template is a game-changer for authors, educators, and professionals aiming to captivate their audience with a well-structured and accessible presentation of their rich content. Designed to turn any extensive material into an engaging journey, this template masterfully organizes chapters, sections, and pivotal topics. It's an invaluable asset for transforming detailed reports, comprehensive academic papers, or sprawling creative works into a visually appealing and easily navigable format. With a design that's as striking as it is functional, the template boasts a color scheme that balances professionalism with vibrancy. T....


20 diapositivas
Vivid Product Development Plan Presentation
Develop your product with confidence using this detailed product development plan template! Perfect for outlining features, market analysis, and competitive advantages. Ideal for product managers and teams. Compatible with PowerPoint, Keynote, and Google Slides, this template ensures your plan is clear, professional, and comprehensive. Achieve product success today!


4 diapositivas
Startup Business Plan Executive Overview Presentation
Present your startup vision with this bold, rocket-themed executive overview template. Perfect for outlining growth strategies, milestones, and launch plans, it combines vibrant visuals with a clean layout. Fully editable in Canva, PowerPoint, and Google Slides, it’s ideal for inspiring investors and stakeholders with a clear, professional business roadmap.


5 diapositivas
Strategic Inquiry Mapping Presentation
Bring your ideas to life with a fresh visual flow that maps key questions into action. This strategic template helps you organize complex inquiries across five stages—from insights and communication to analysis and execution. Fully editable and easy to use in PowerPoint, Keynote, and Google Slides for clear visual storytelling.