


Características


¿Tienes alguna pregunta?
Recomendar


4 diapositivas
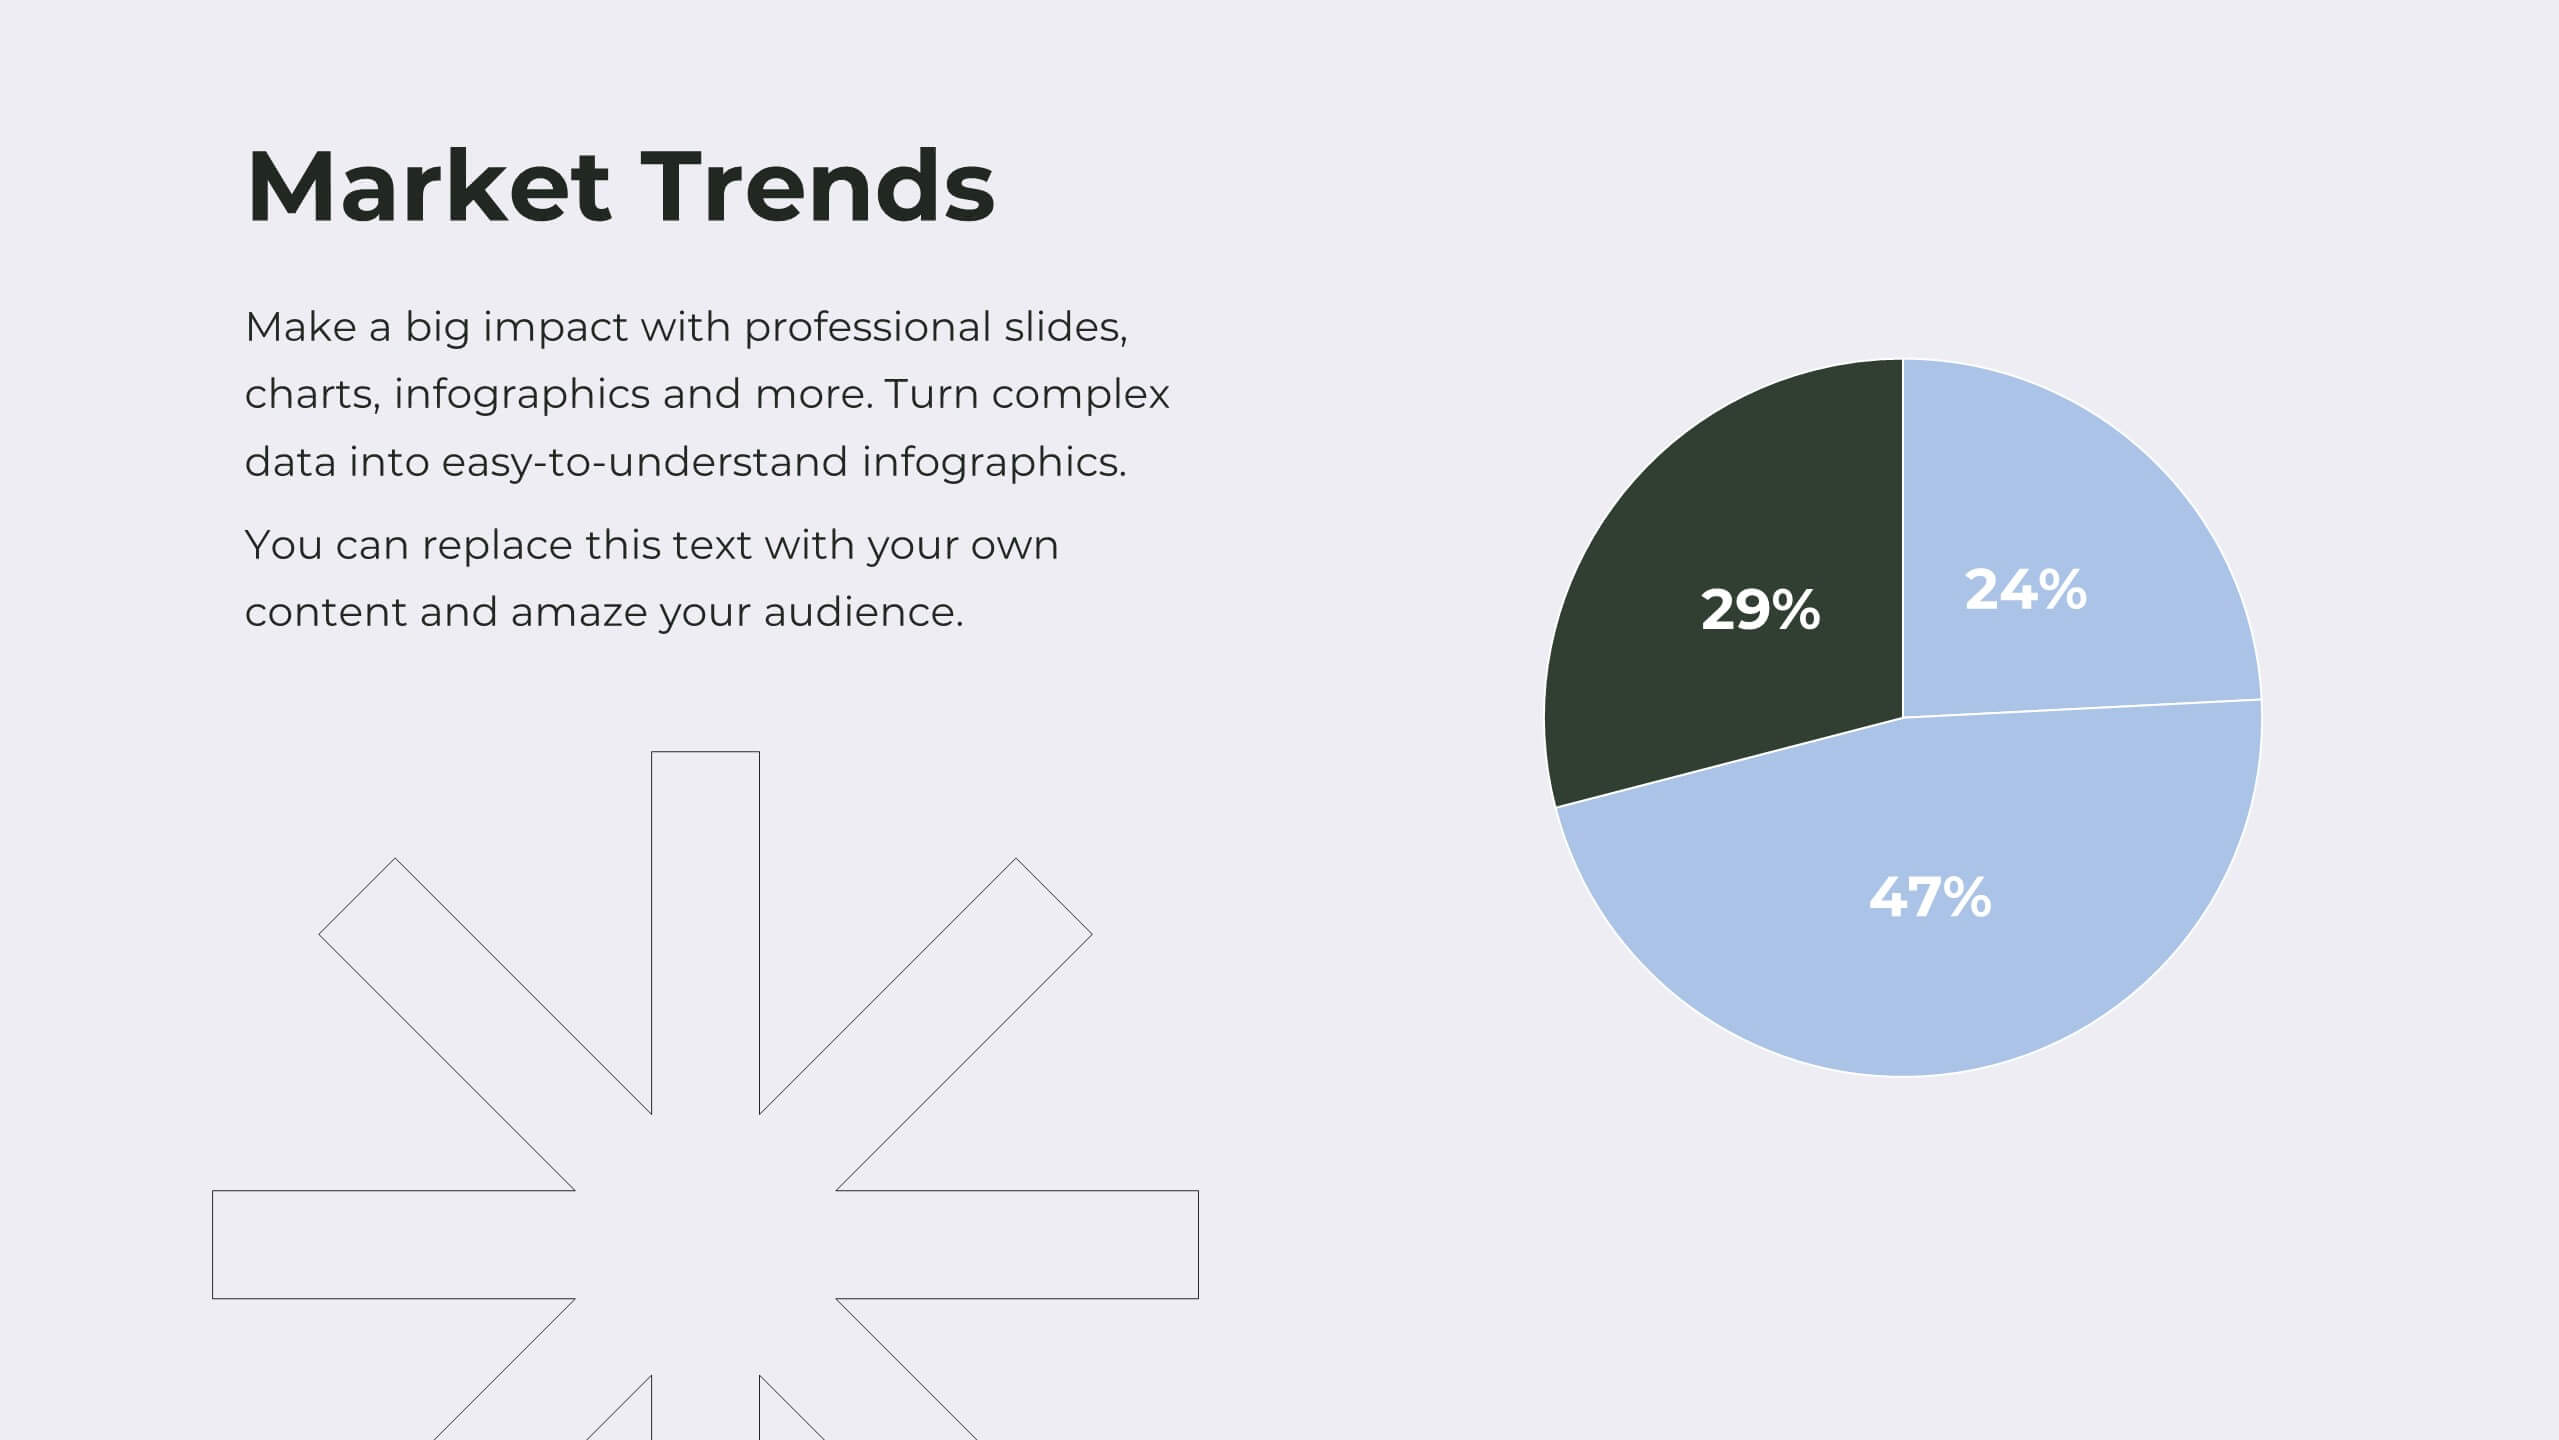
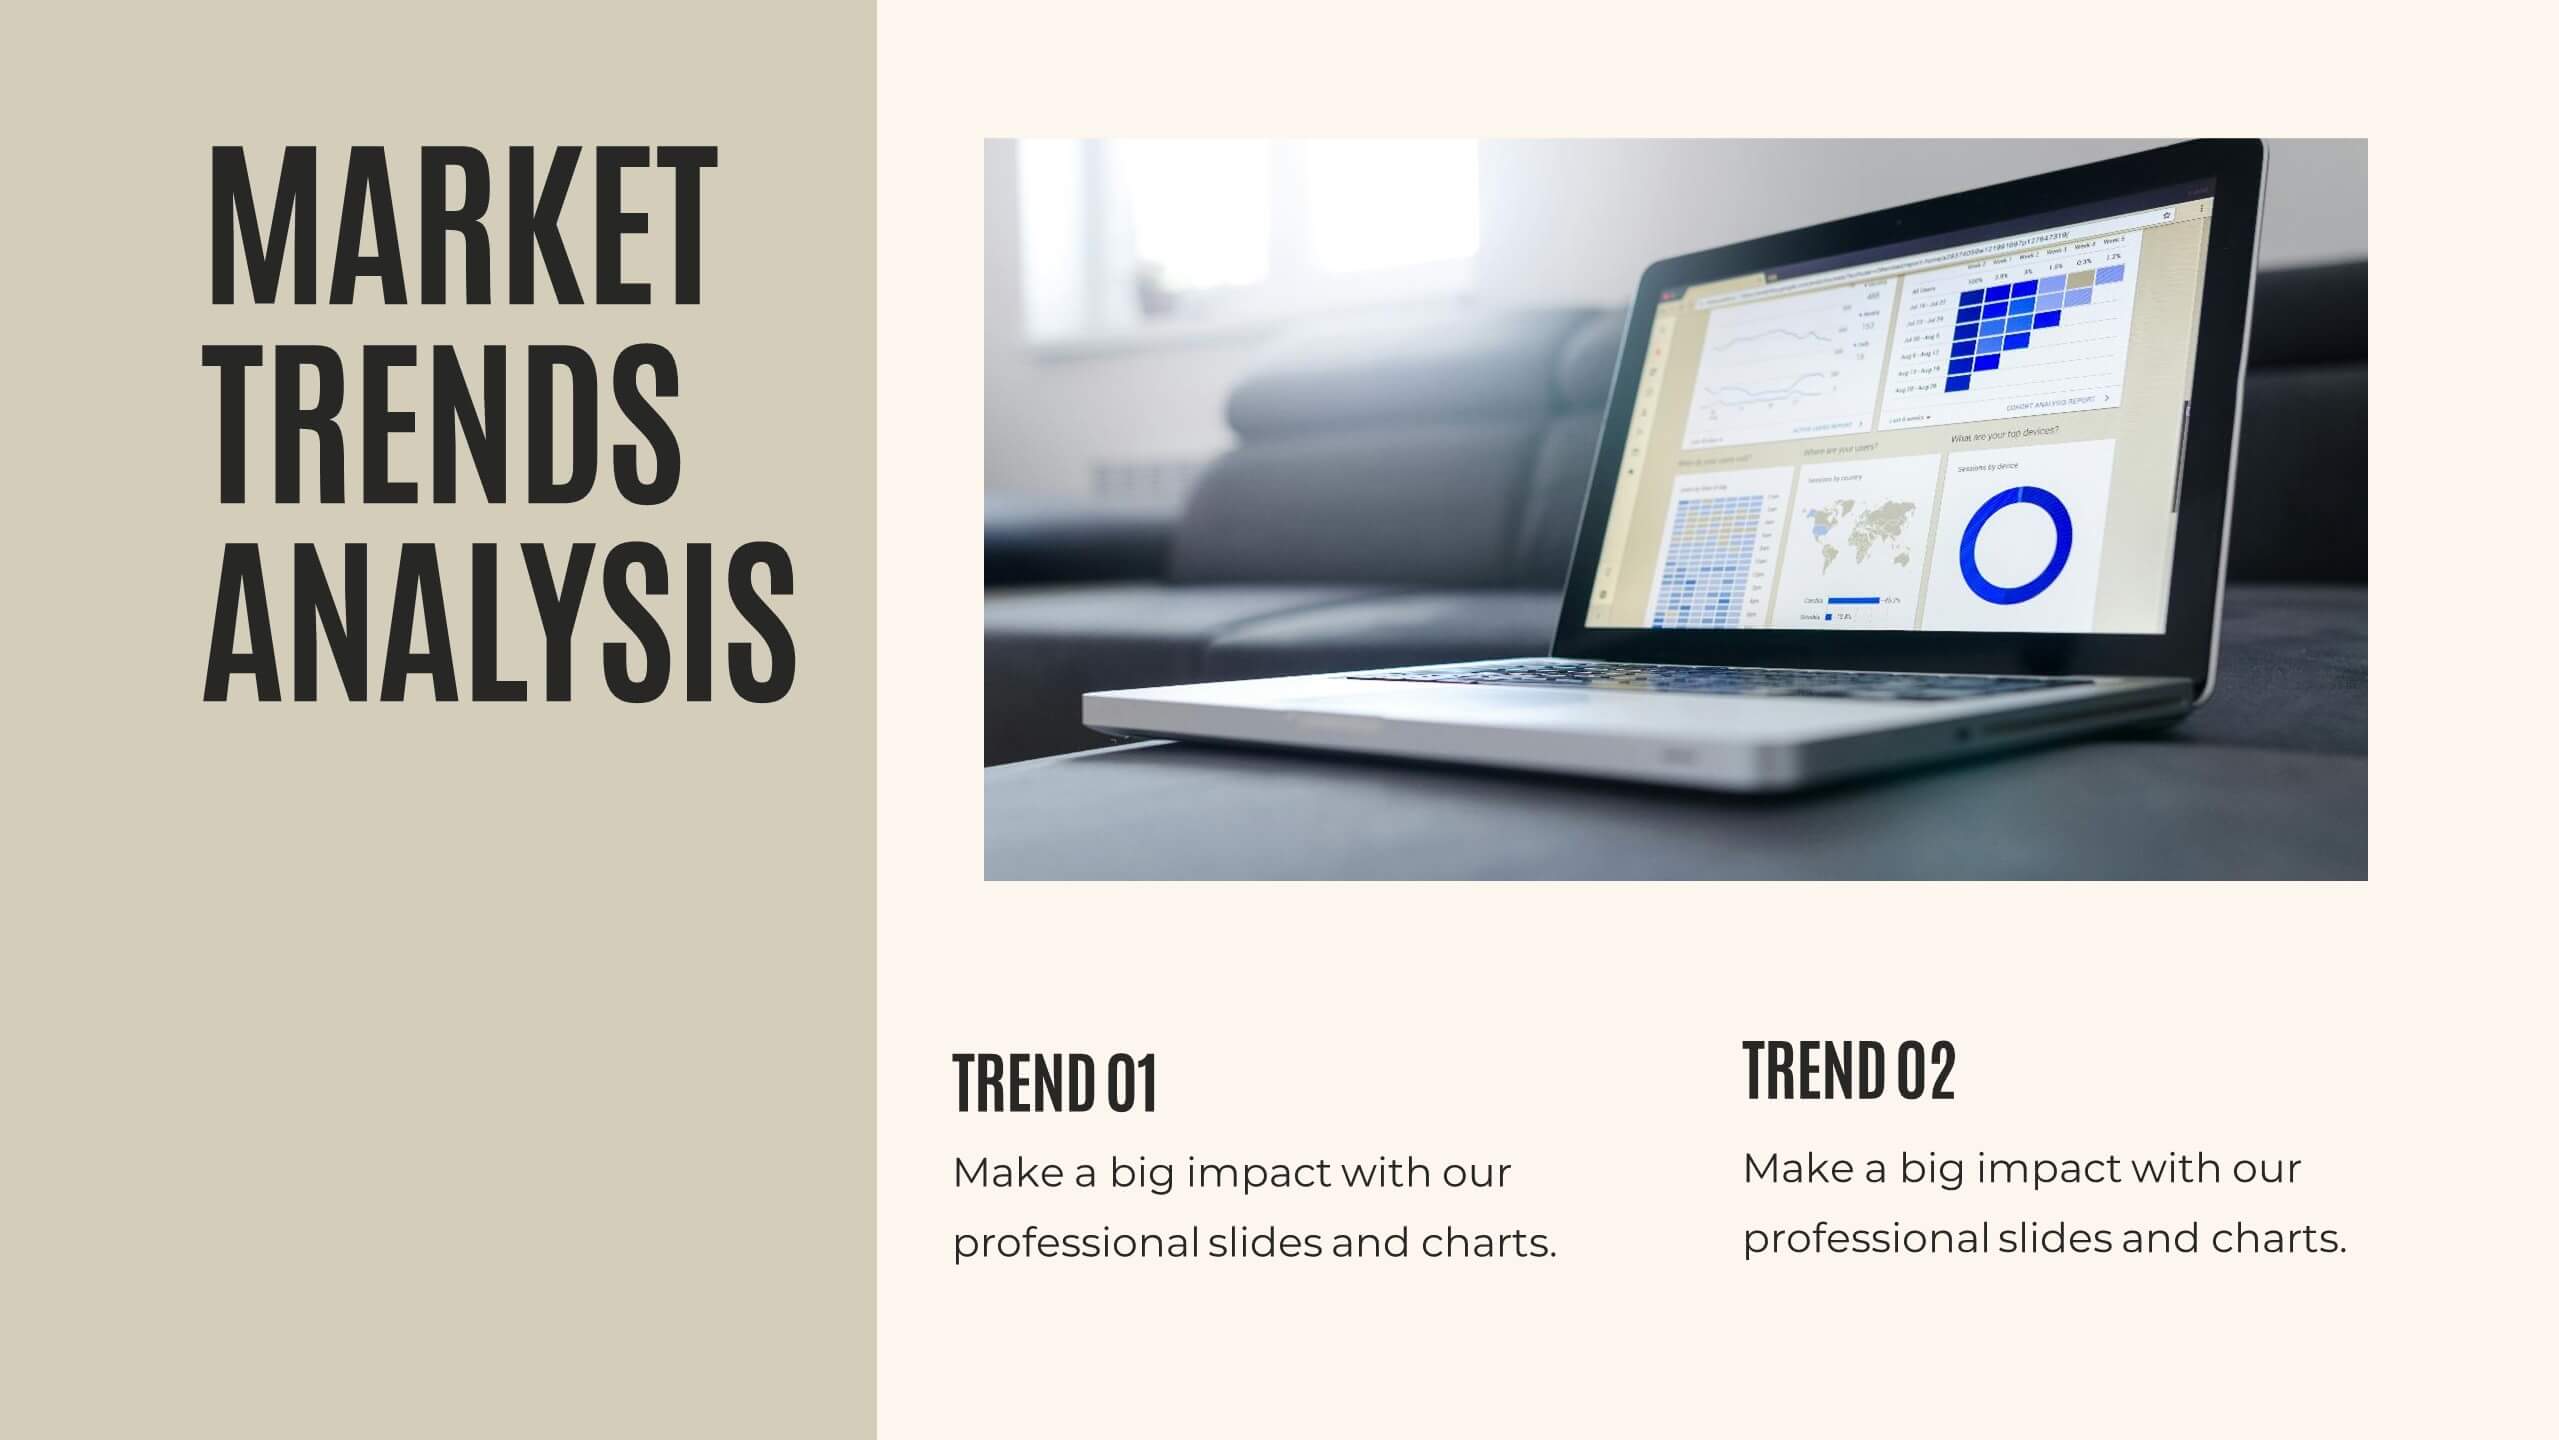
Agricultural Market Trends Presentation
Highlight industry insights with this Agricultural Market Trends presentation template, featuring tractor and landscape graphics for a modern, rural-inspired look. Perfect for market reports, crop production analysis, or agribusiness proposals. Fully editable in Canva, PowerPoint, and Google Slides, allowing you to customize icons, text, and colors to match your brand.
4 diapositivas
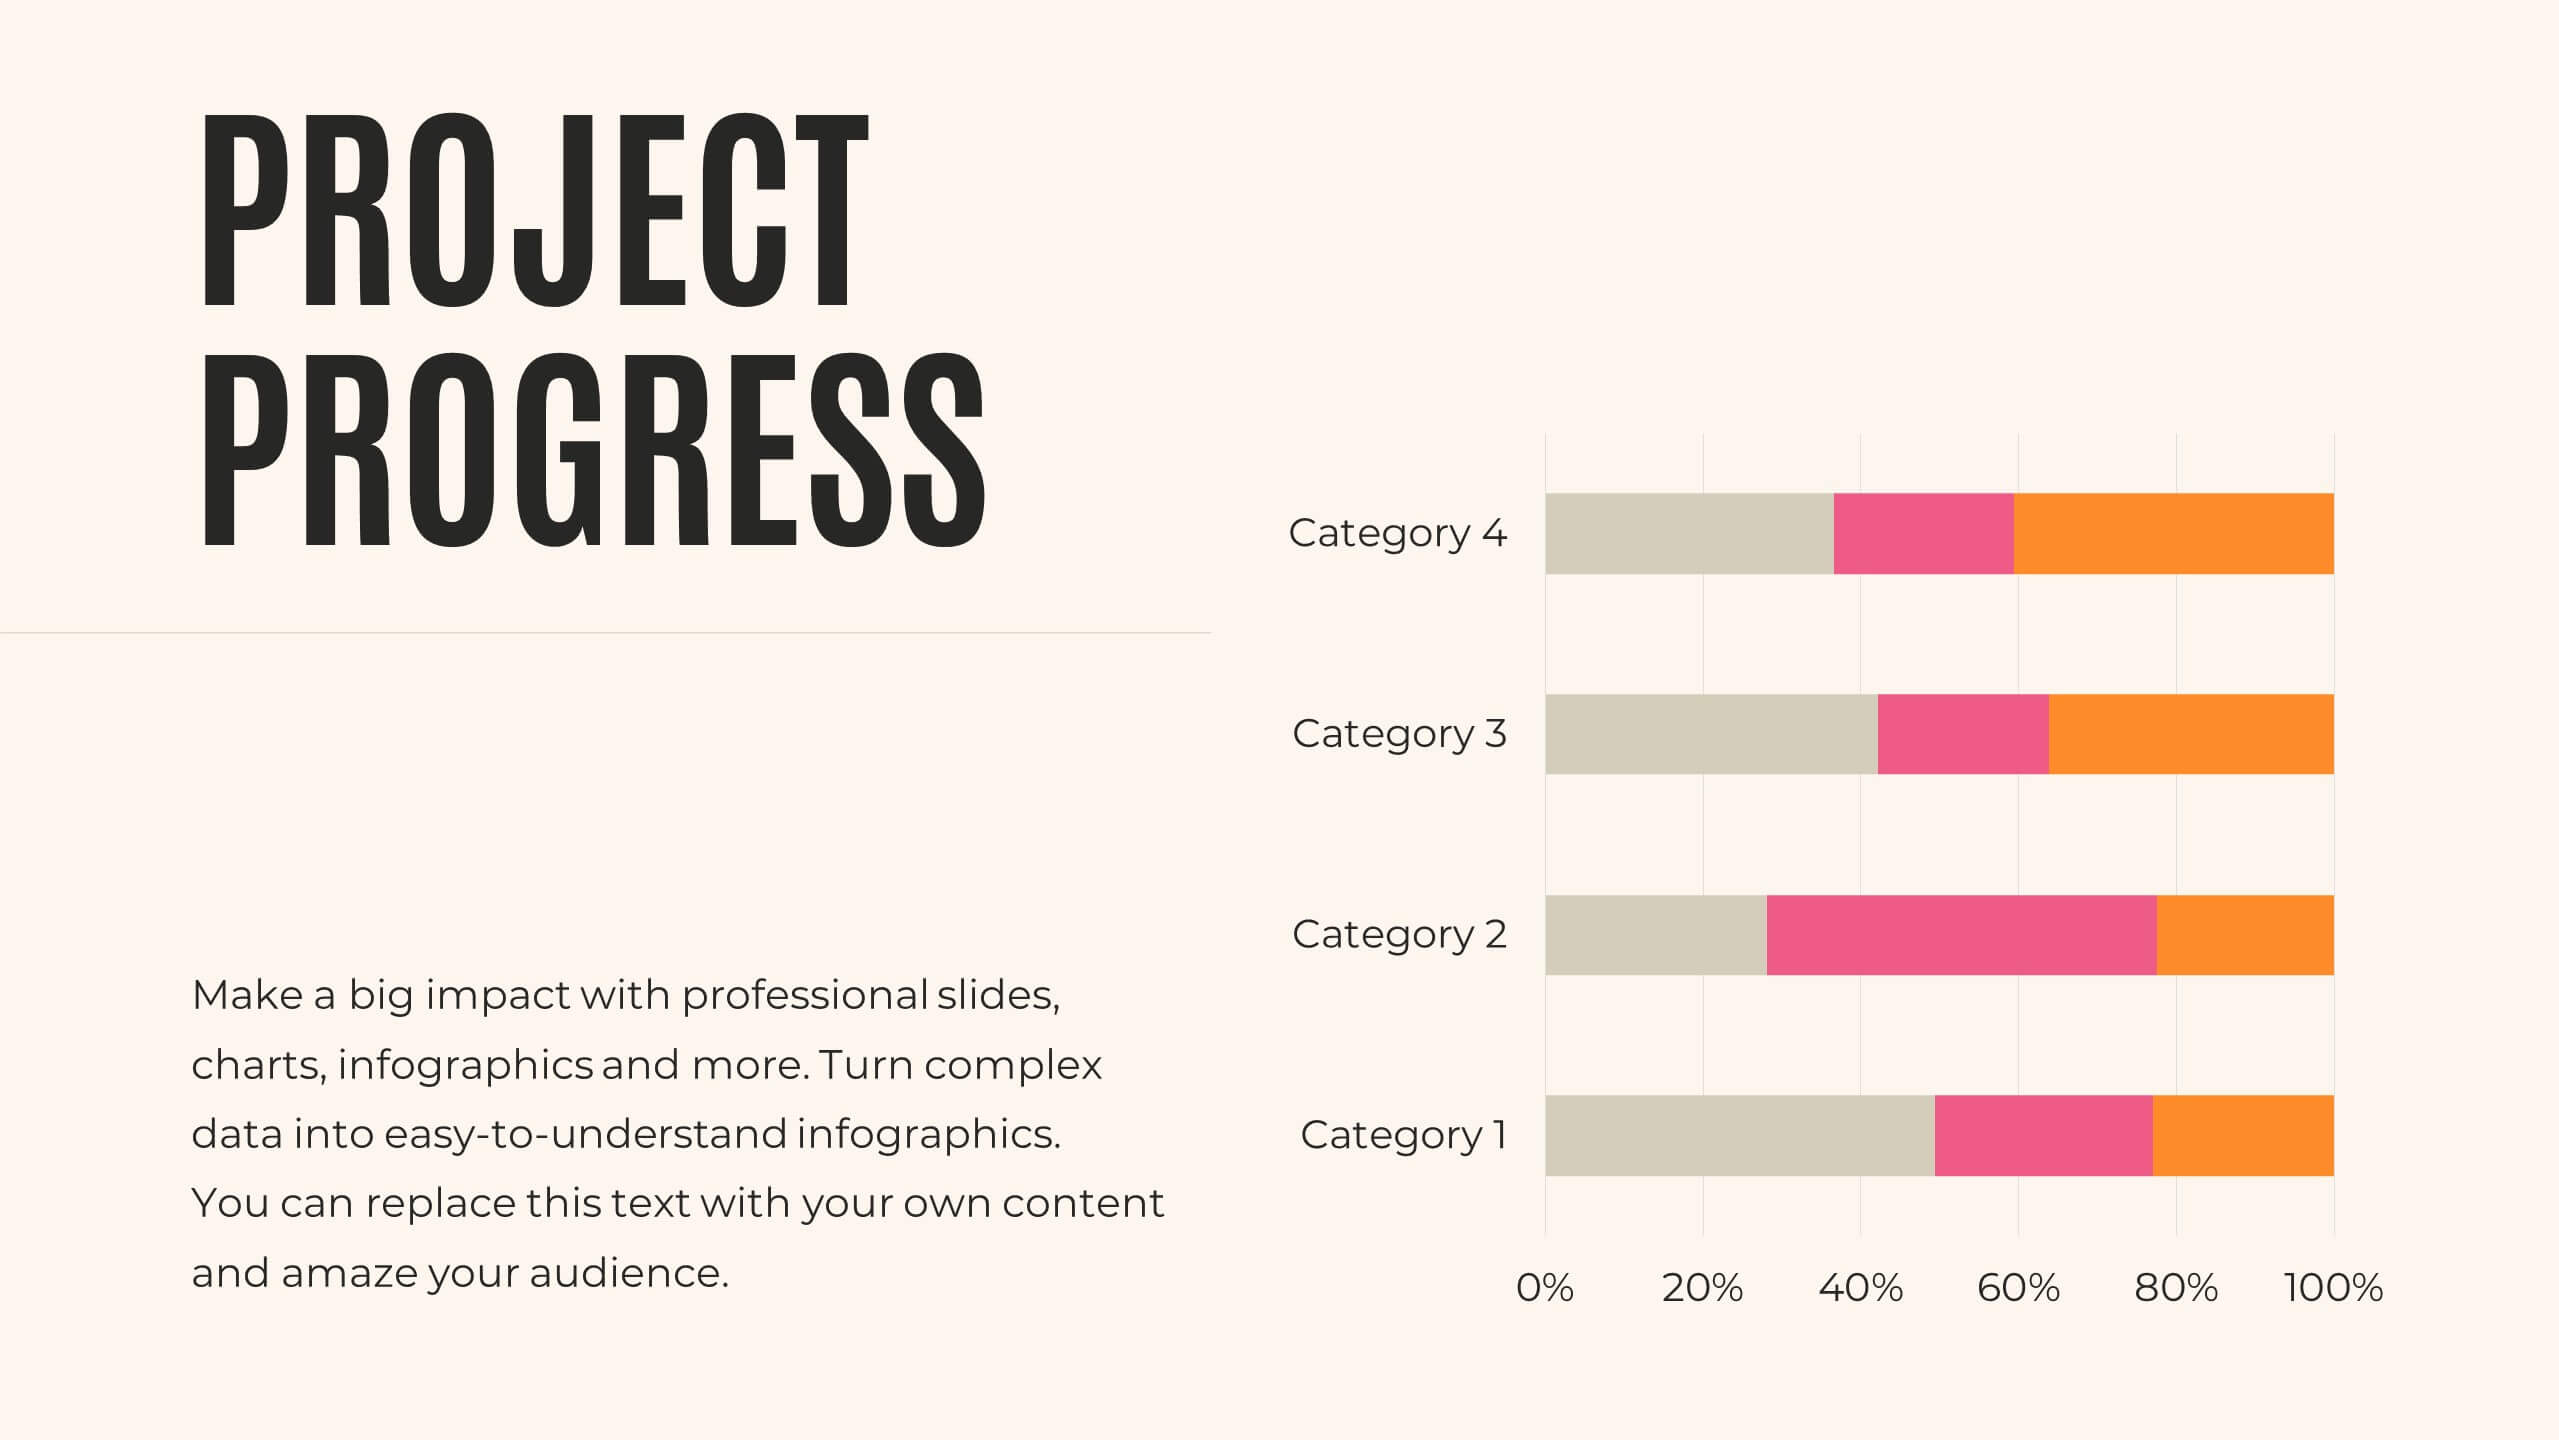
Team Performance and Progress Tracker Presentation
Track momentum, highlight achievements, and visualize team success with this clean performance tracker layout. Featuring gauge meters and progress bars, this slide makes it easy to present productivity metrics, goal progress, or task completion at a glance. Fully editable and compatible with PowerPoint, Keynote, and Google Slides.


5 diapositivas
Target Market and Audience Segmentation Presentation
Identify and engage your ideal audience with the Target Market and Audience Segmentation presentation. This clear, timeline-style infographic uses a bullseye layout to highlight key market segments and their progression. Ideal for marketing strategies, customer profiling, and campaign planning. Fully customizable in Canva, PowerPoint, and Google Slides.


4 diapositivas
Legal Overview and Policy Summary Presentation
Present legal insights with clarity using the Legal Overview and Policy Summary Presentation. This scale-themed design is ideal for outlining compliance, governance, or internal policies. Each section is visually balanced to reflect fairness and structure. Fully editable for use in PowerPoint, Keynote, and Google Slides.


6 diapositivas
Real Estate and Building Development
Visualize the complete property development process with this modern, keyhole-inspired presentation design. Ideal for real estate developers, architects, and construction planners, this slide clearly outlines six project stages—from concept to completion—using bold icons and a radial layout. Editable in PowerPoint, Keynote, and Google Slides.


6 diapositivas
Customer Value Proposition Framework Presentation
Clarify your business offering with the Customer Value Proposition Framework Presentation. This template is designed to help you align your products or services with customer needs through a side-by-side visual of the Value Proposition Canvas. Highlight pain points, customer gains, and how your solution uniquely addresses them. Fully customizable in PowerPoint, Keynote, and Google Slides. Perfect for marketers, product managers, and strategic planning teams.


23 diapositivas
Blade Corporate Strategy Proposal Presentation
Prepare to captivate your audience with the Blade Corporate Strategy Proposal template! This sleek and modern design is perfect for professionals looking to present their strategic objectives with clarity and impact. The template features a balanced color palette of blue and white, exuding professionalism while ensuring your content stands out. From analyzing the current landscape to outlining key challenges and growth opportunities, each slide is meticulously crafted to convey your strategic vision effectively. The clean layout ensures that complex data, such as SWOT analysis, performance metrics, and competitive analysis, is easily digestible. With dedicated sections for team roles, resource allocation, and timelines, this template helps you guide your audience through every step of your strategic plan. Fully compatible with PowerPoint, Keynote, and Google Slides, the Blade template is your go-to choice for delivering presentations that resonate with decision-makers and stakeholders alike.


6 diapositivas
Learning Models and Instructional Design Presentation
Present educational strategies with clarity using the Learning Models and Instructional Design Presentation. This wavy, multi-step visual helps illustrate instructional stages, e-learning workflows, or training models with ease. Ideal for educators, coaches, and corporate trainers. Fully editable in PowerPoint, Keynote, Canva, and Google Slides.

22 diapositivas
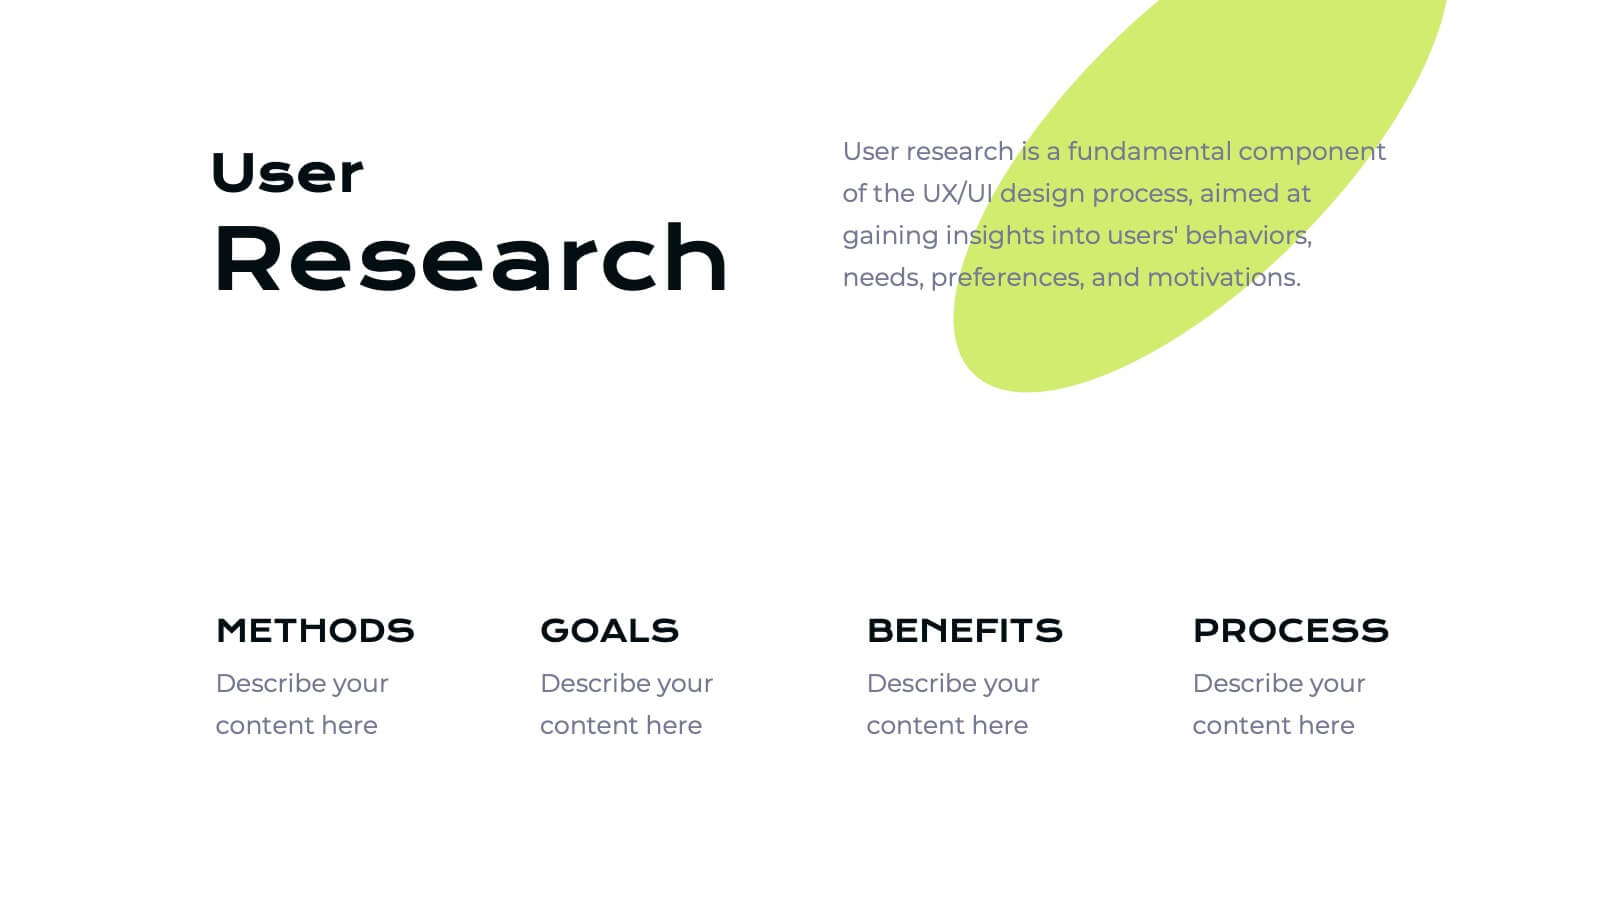
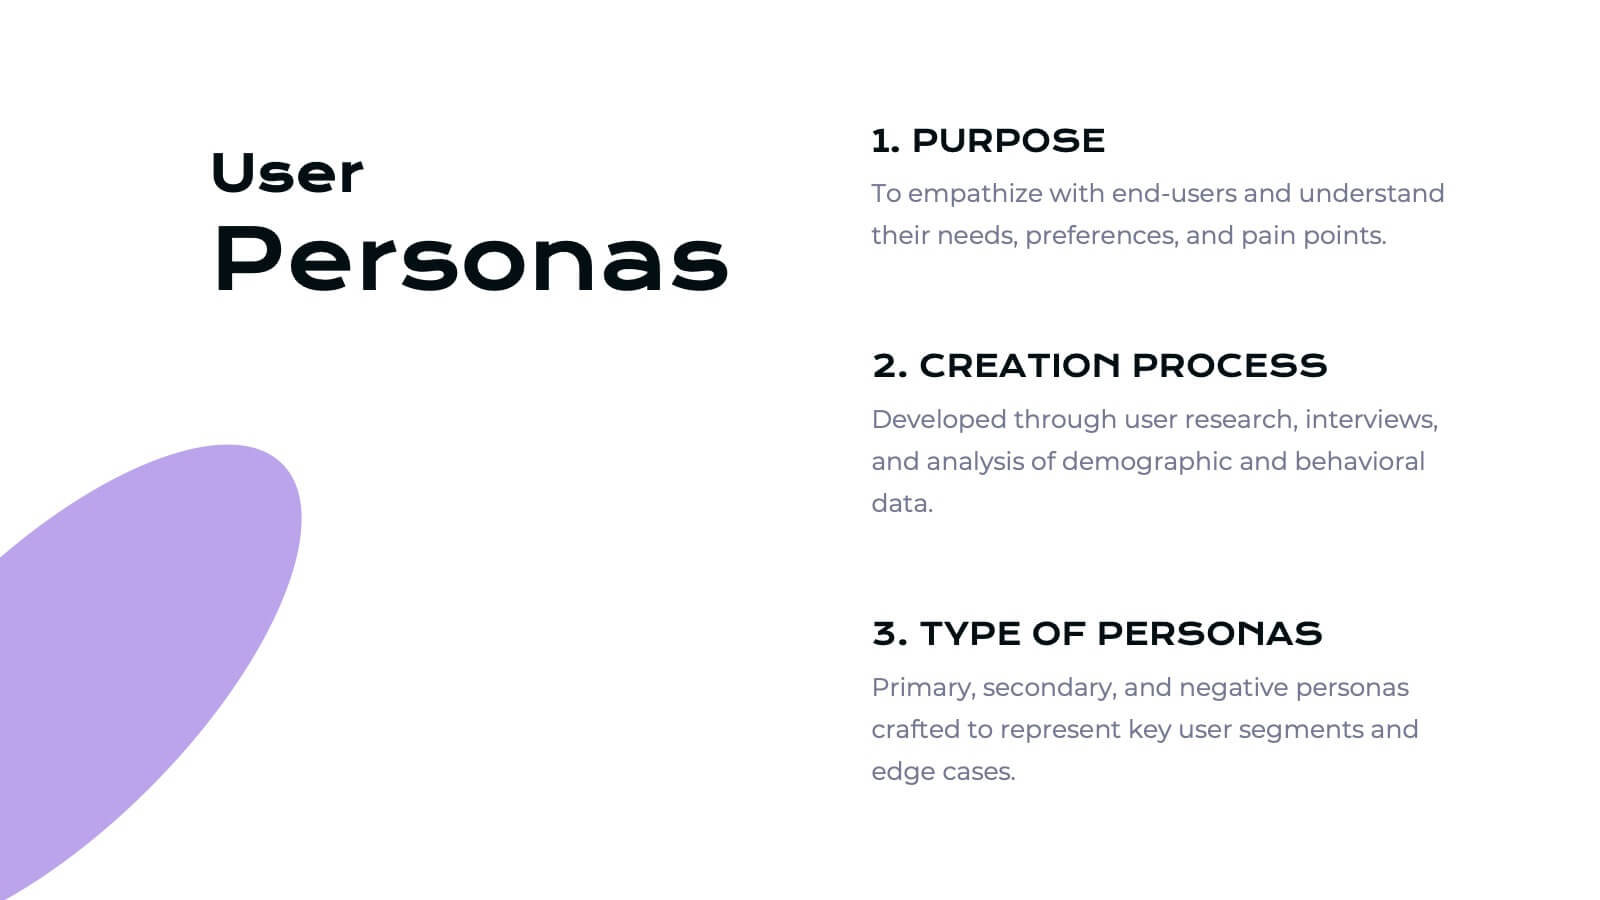
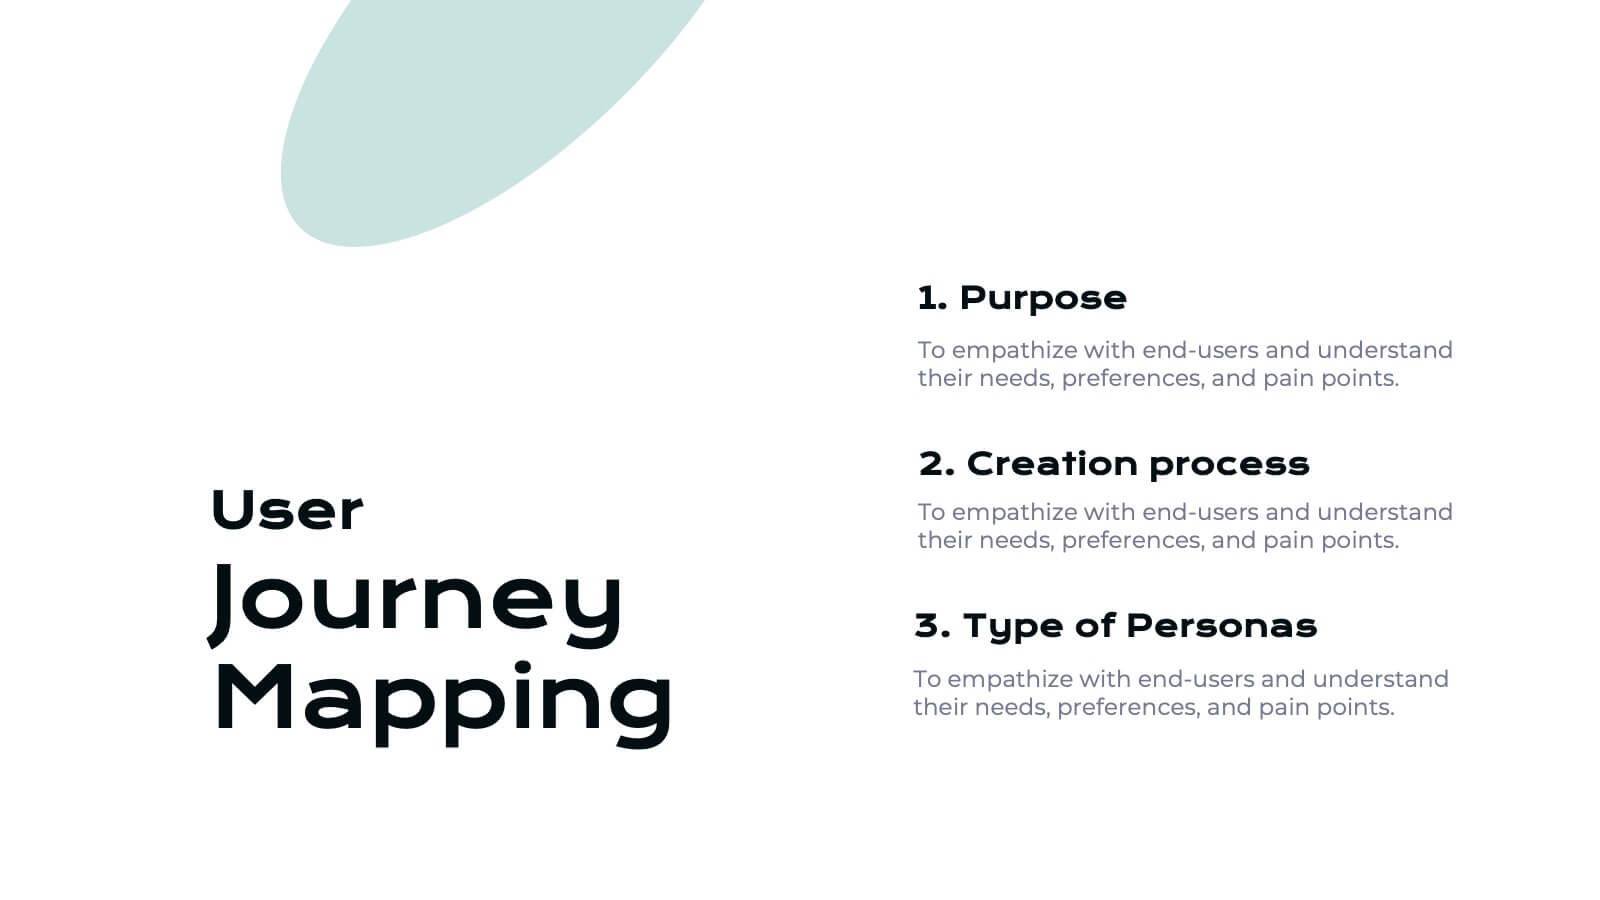
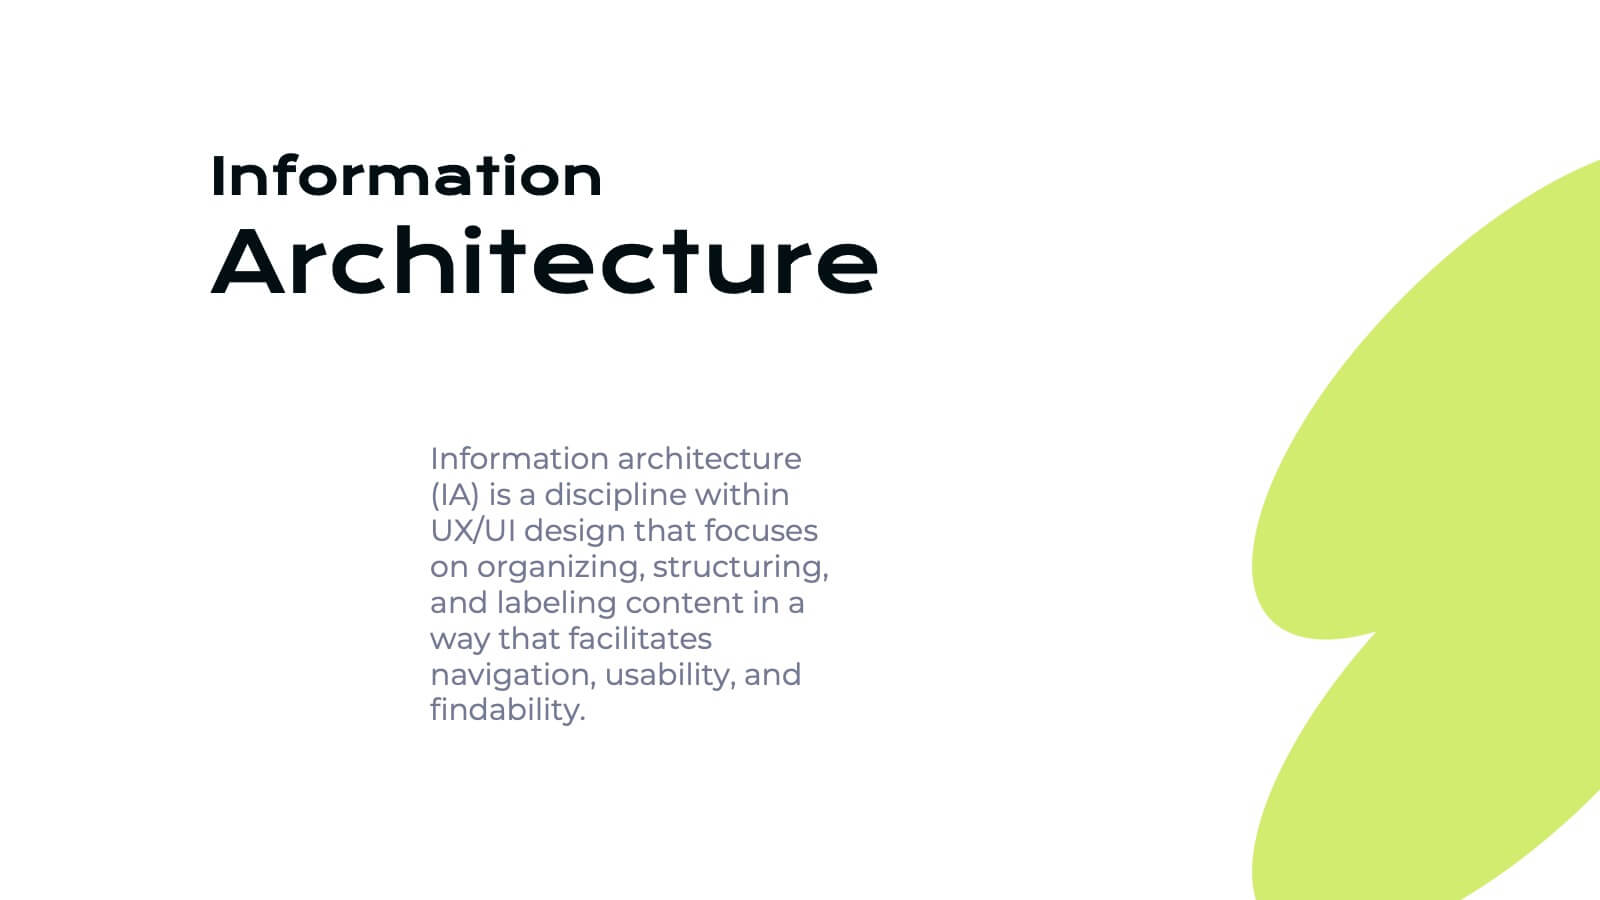
Ifrit User Experience Proposal Presentation
Unleash the power of great design with this fiery Ifrit-inspired presentation, perfect for delivering your user experience proposal! This template lets you showcase your UX strategies, research, and design process in a visually striking and well-organized format. Impress stakeholders with every slide. Compatible with PowerPoint, Keynote, and Google Slides.


6 diapositivas
Geographic Asia Overview Template Presentation
Discover insights across Asia with a clean, professional layout that brings your regional data to life. Perfect for showcasing demographics, market distribution, or geographic highlights, this visual map design ensures clarity and impact in every slide. Fully compatible with PowerPoint, Keynote, and Google Slides for effortless editing and presentation.


5 diapositivas
Sprint Planning and Agile Cycle Overview Presentation
Break down agile sprints with this clean, circular cycle layout. Ideal for scrum teams and product managers to illustrate sprint planning, task flow, and iterative progress. Includes five key stages with icon support. Fully customizable in PowerPoint, Keynote, and Google Slides for agile ceremonies, planning sessions, or team training.


8 diapositivas
Card Services Comparison Layout Presentation
Highlight key differences in financial products with this Card Services Comparison Layout Presentation. Featuring a sleek smartphone-centered design, this template allows you to clearly compare up to three card types or financial service features. Perfect for fintech presentations, banking pitches, or product feature breakdowns. Fully customizable in PowerPoint, Keynote, and Google Slides.


6 diapositivas
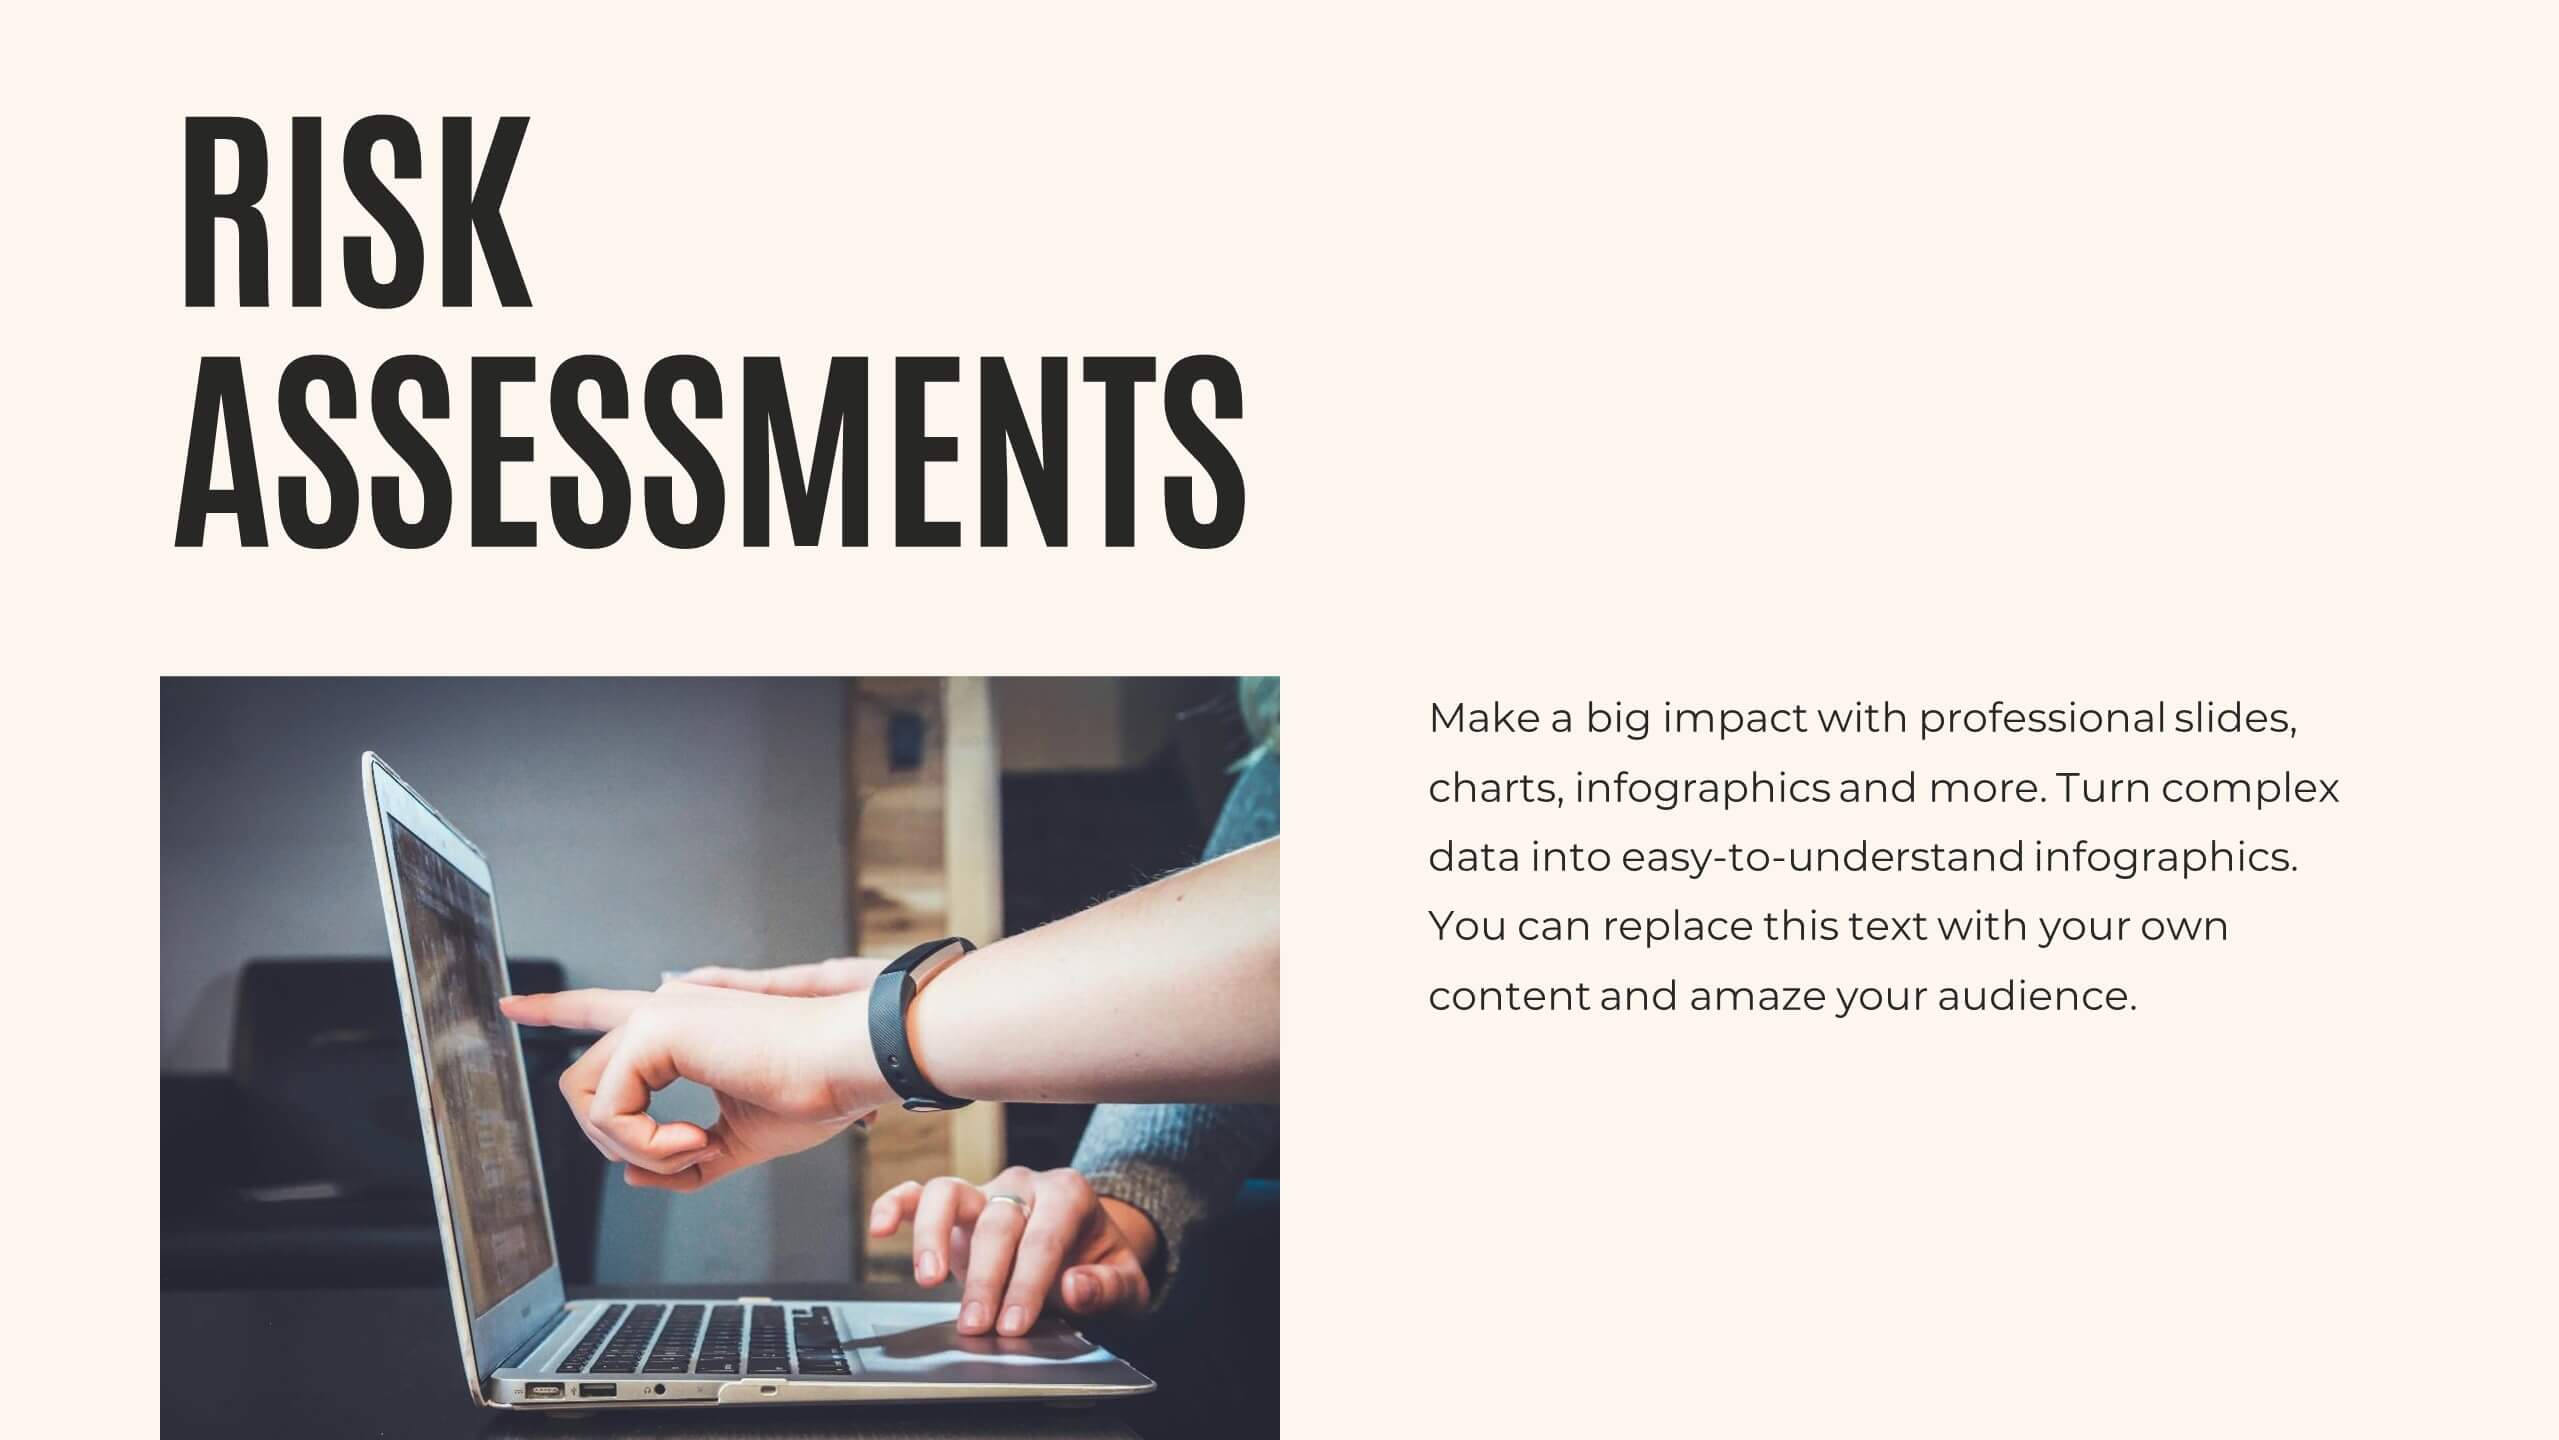
Quality Control Six Sigma Process Presentation
Bring clarity and energy to your workflow with this clean visual guide that outlines each phase of a structured improvement cycle. It helps communicate steps, responsibilities, and progress in a polished, professional way your audience can follow instantly. Fully compatible with PowerPoint, Keynote, and Google Slides.


21 diapositivas
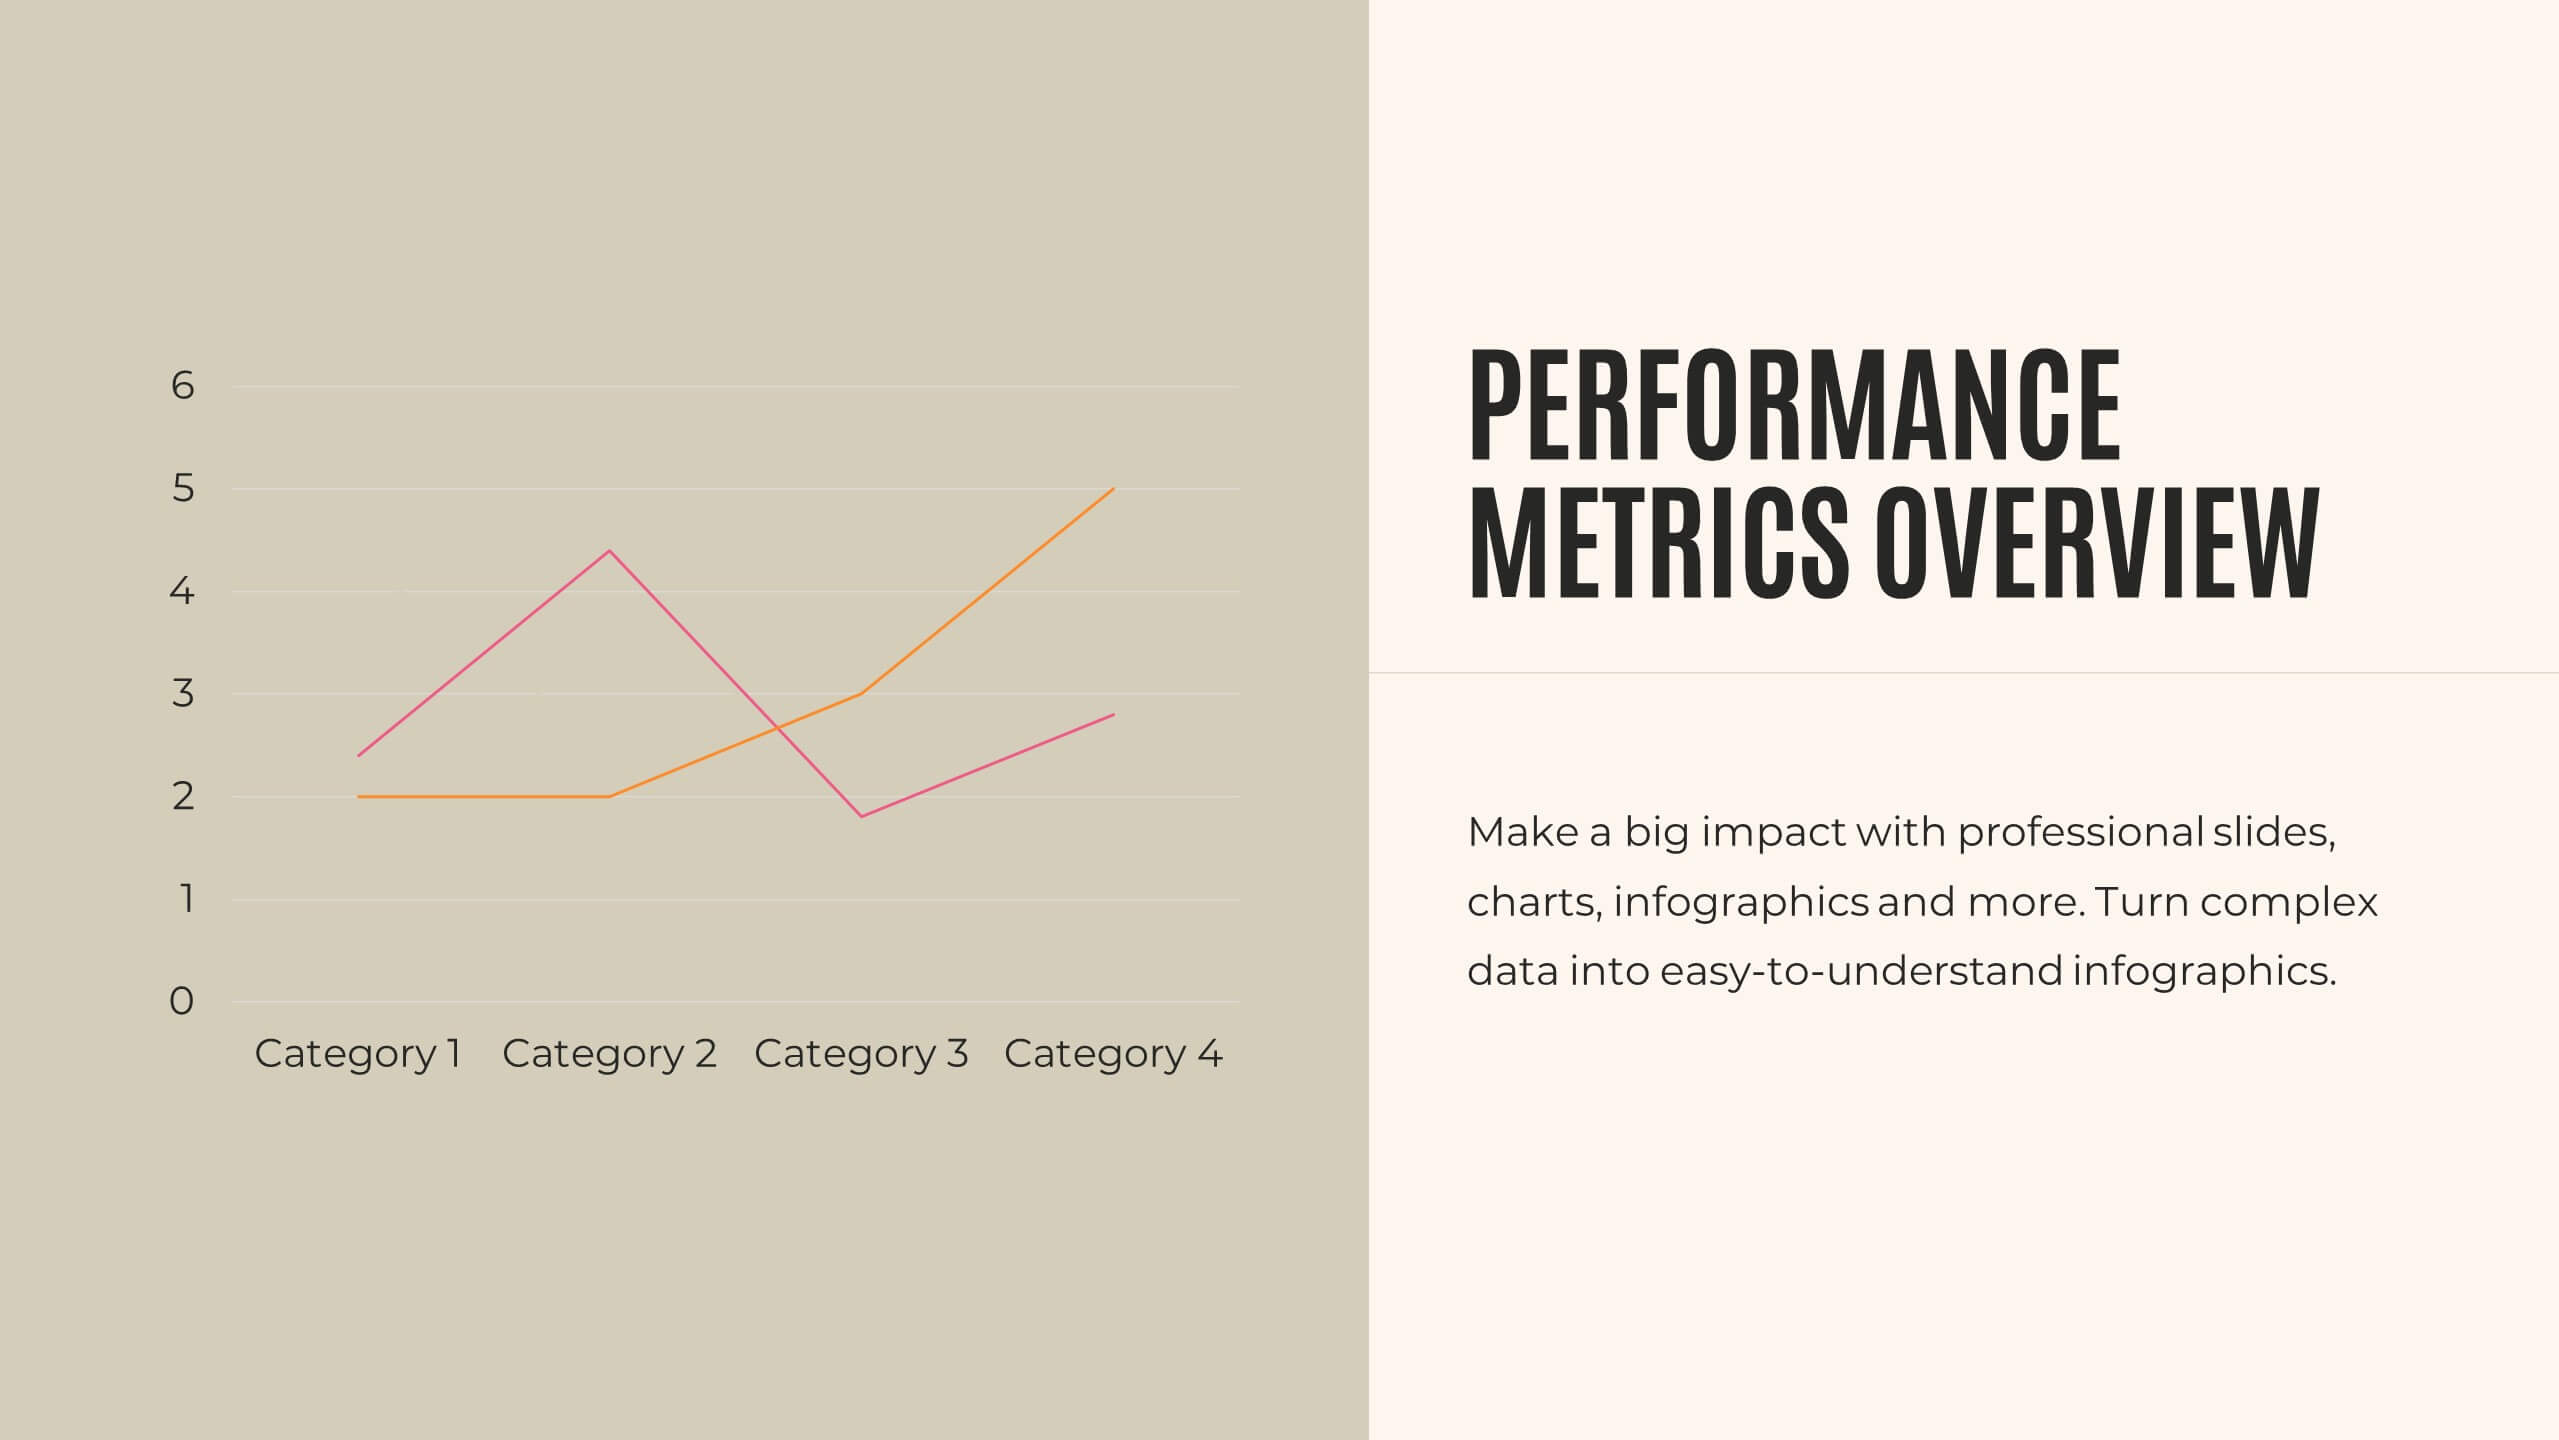
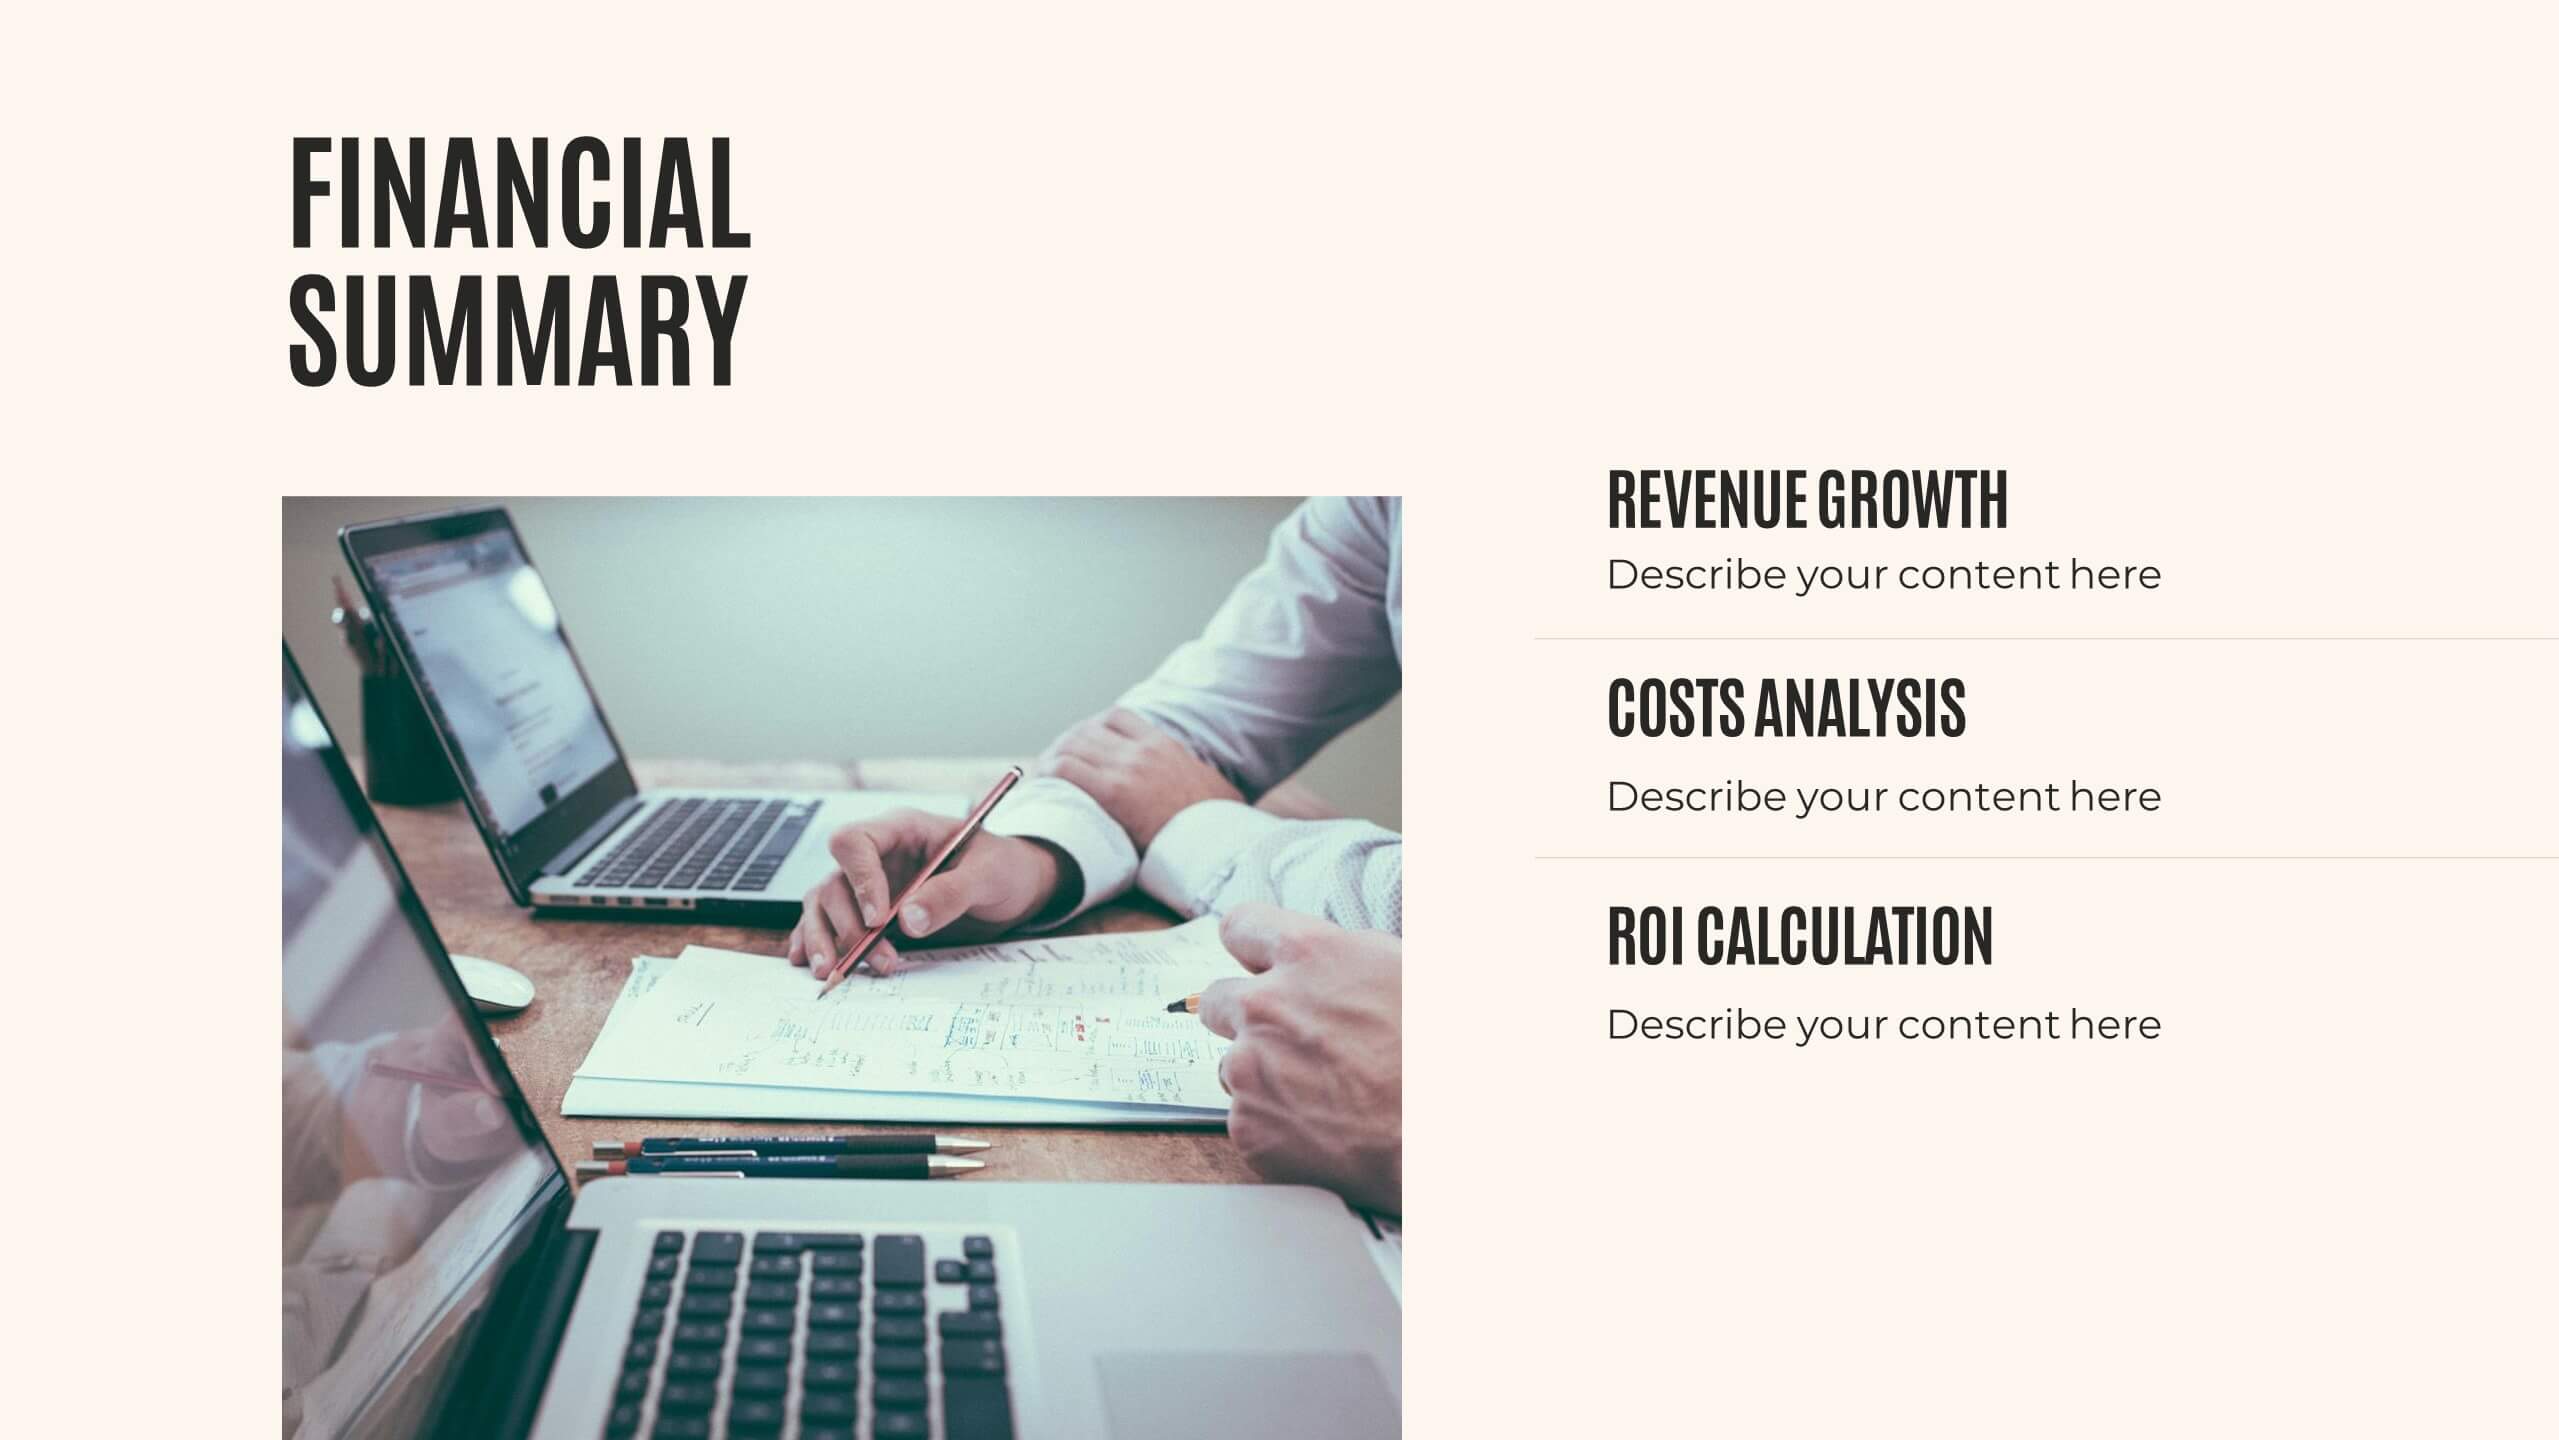
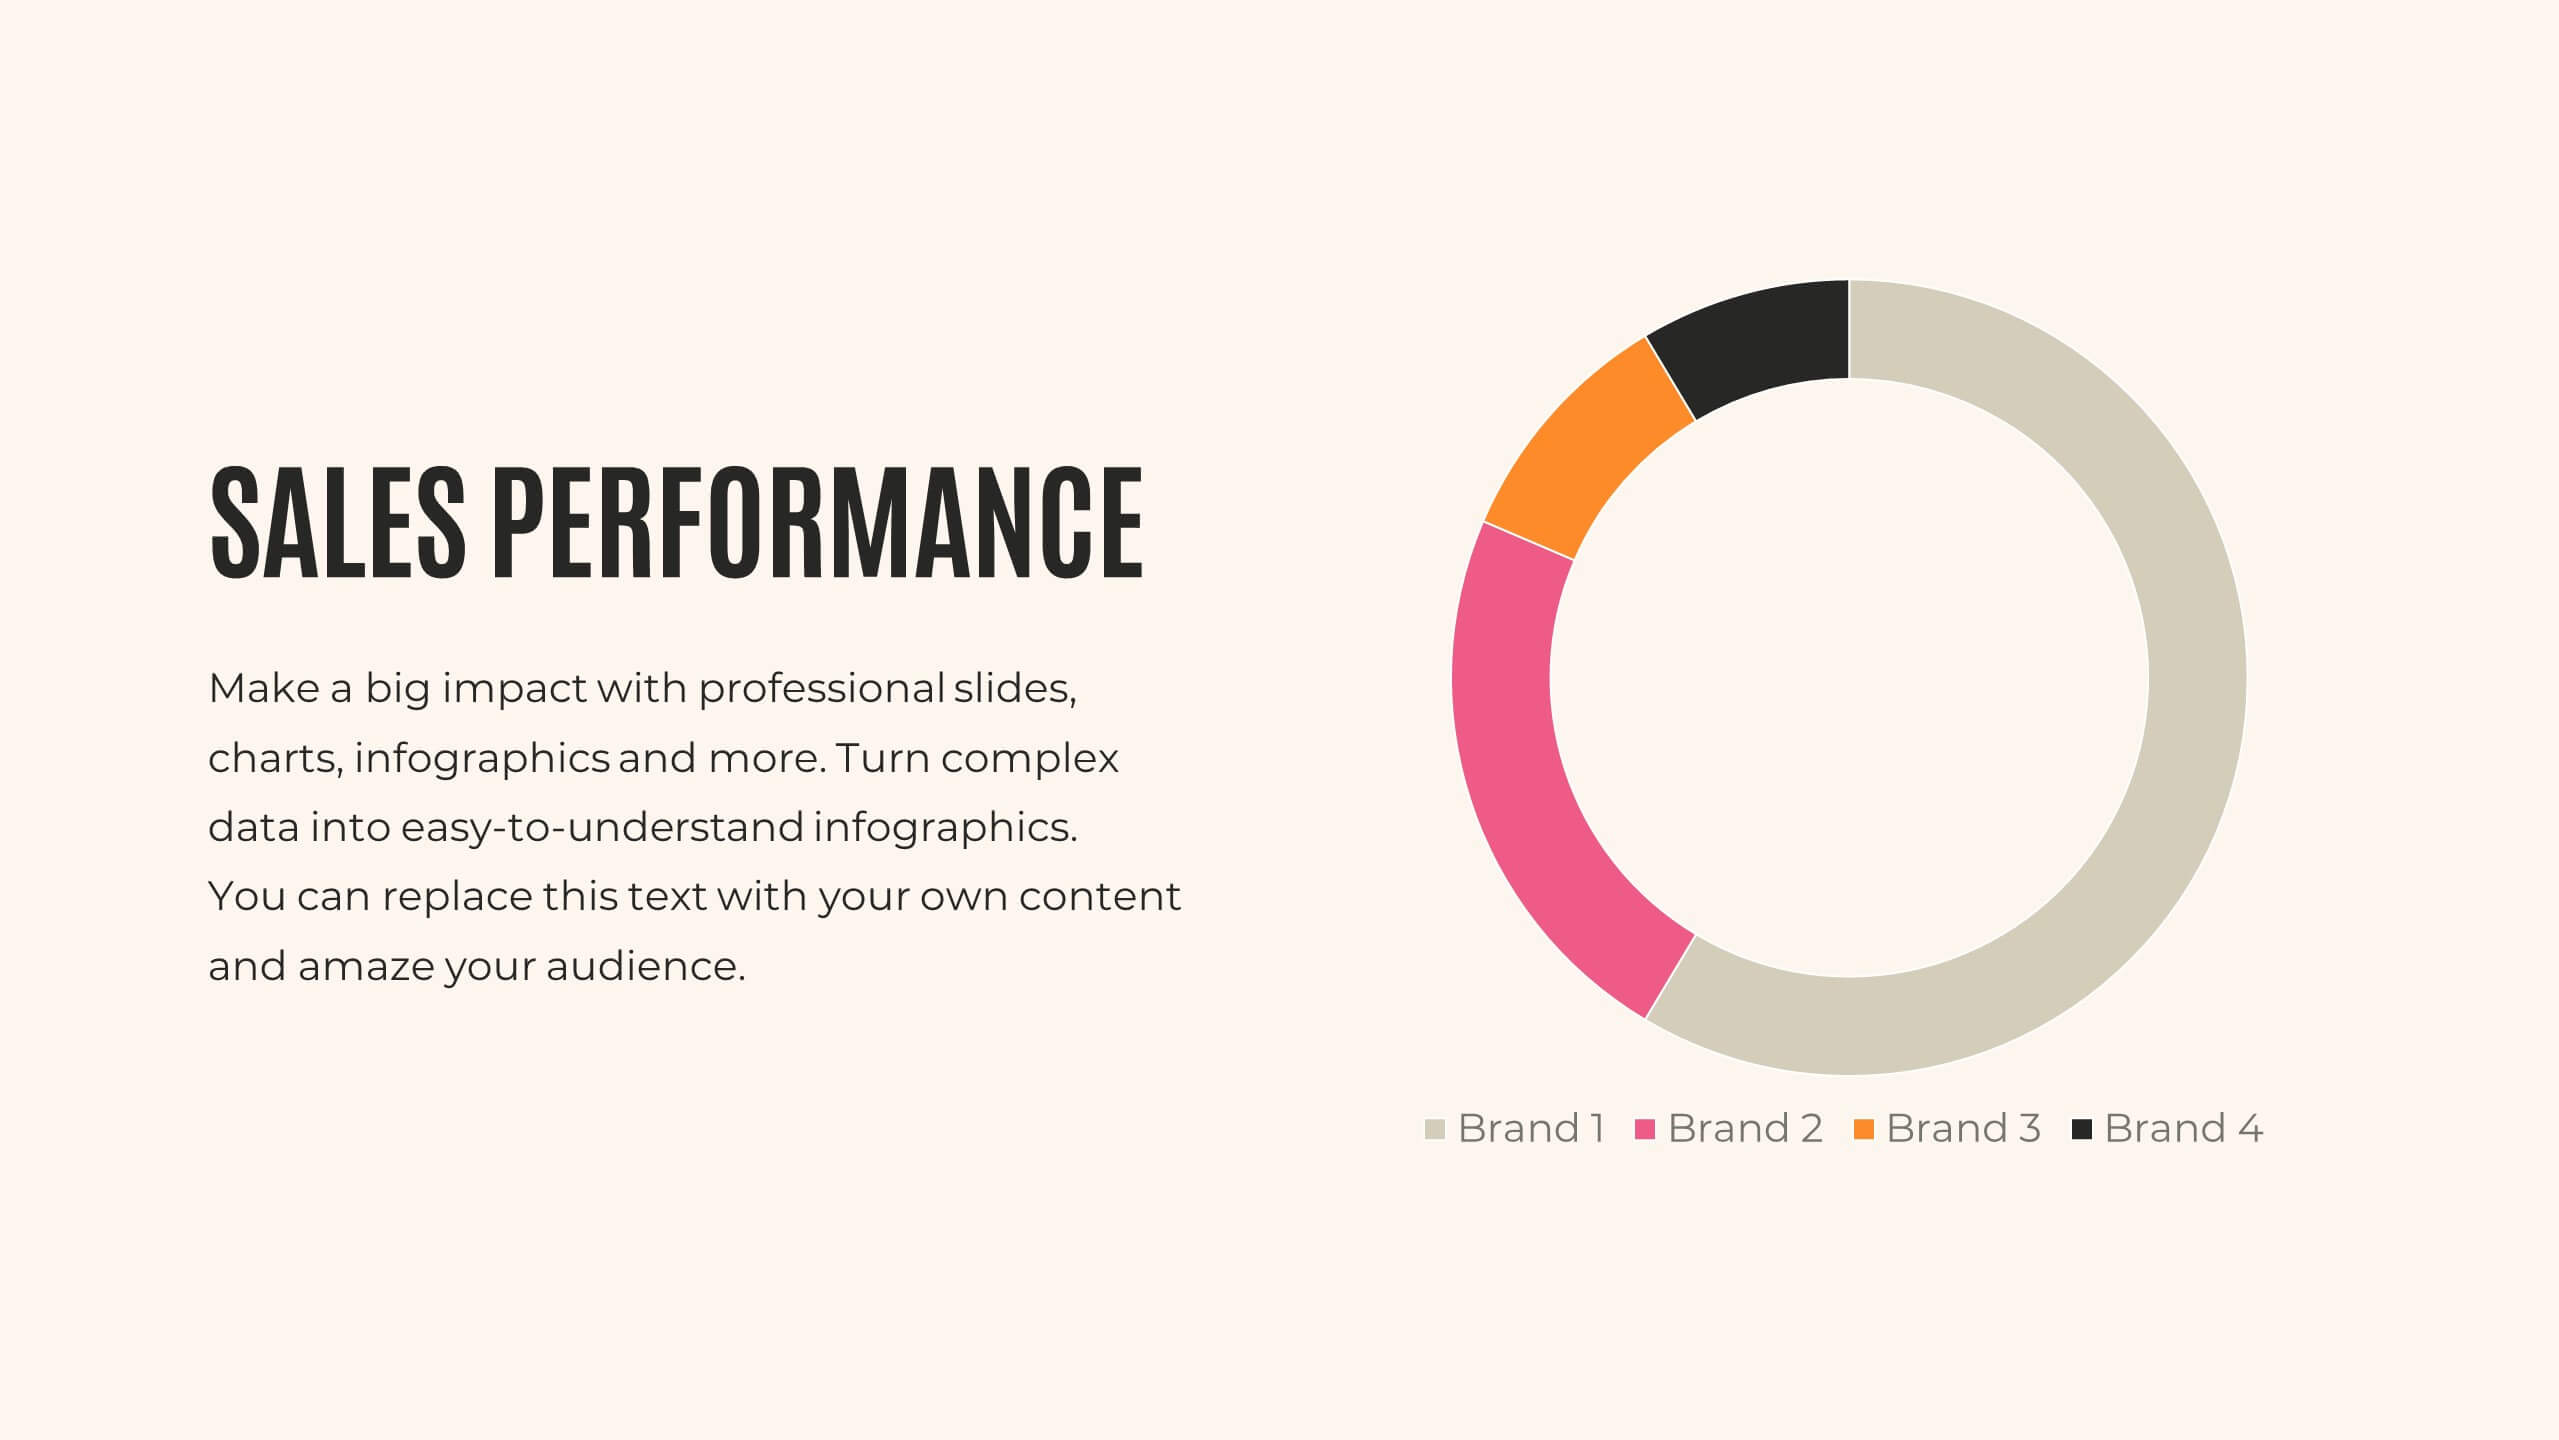
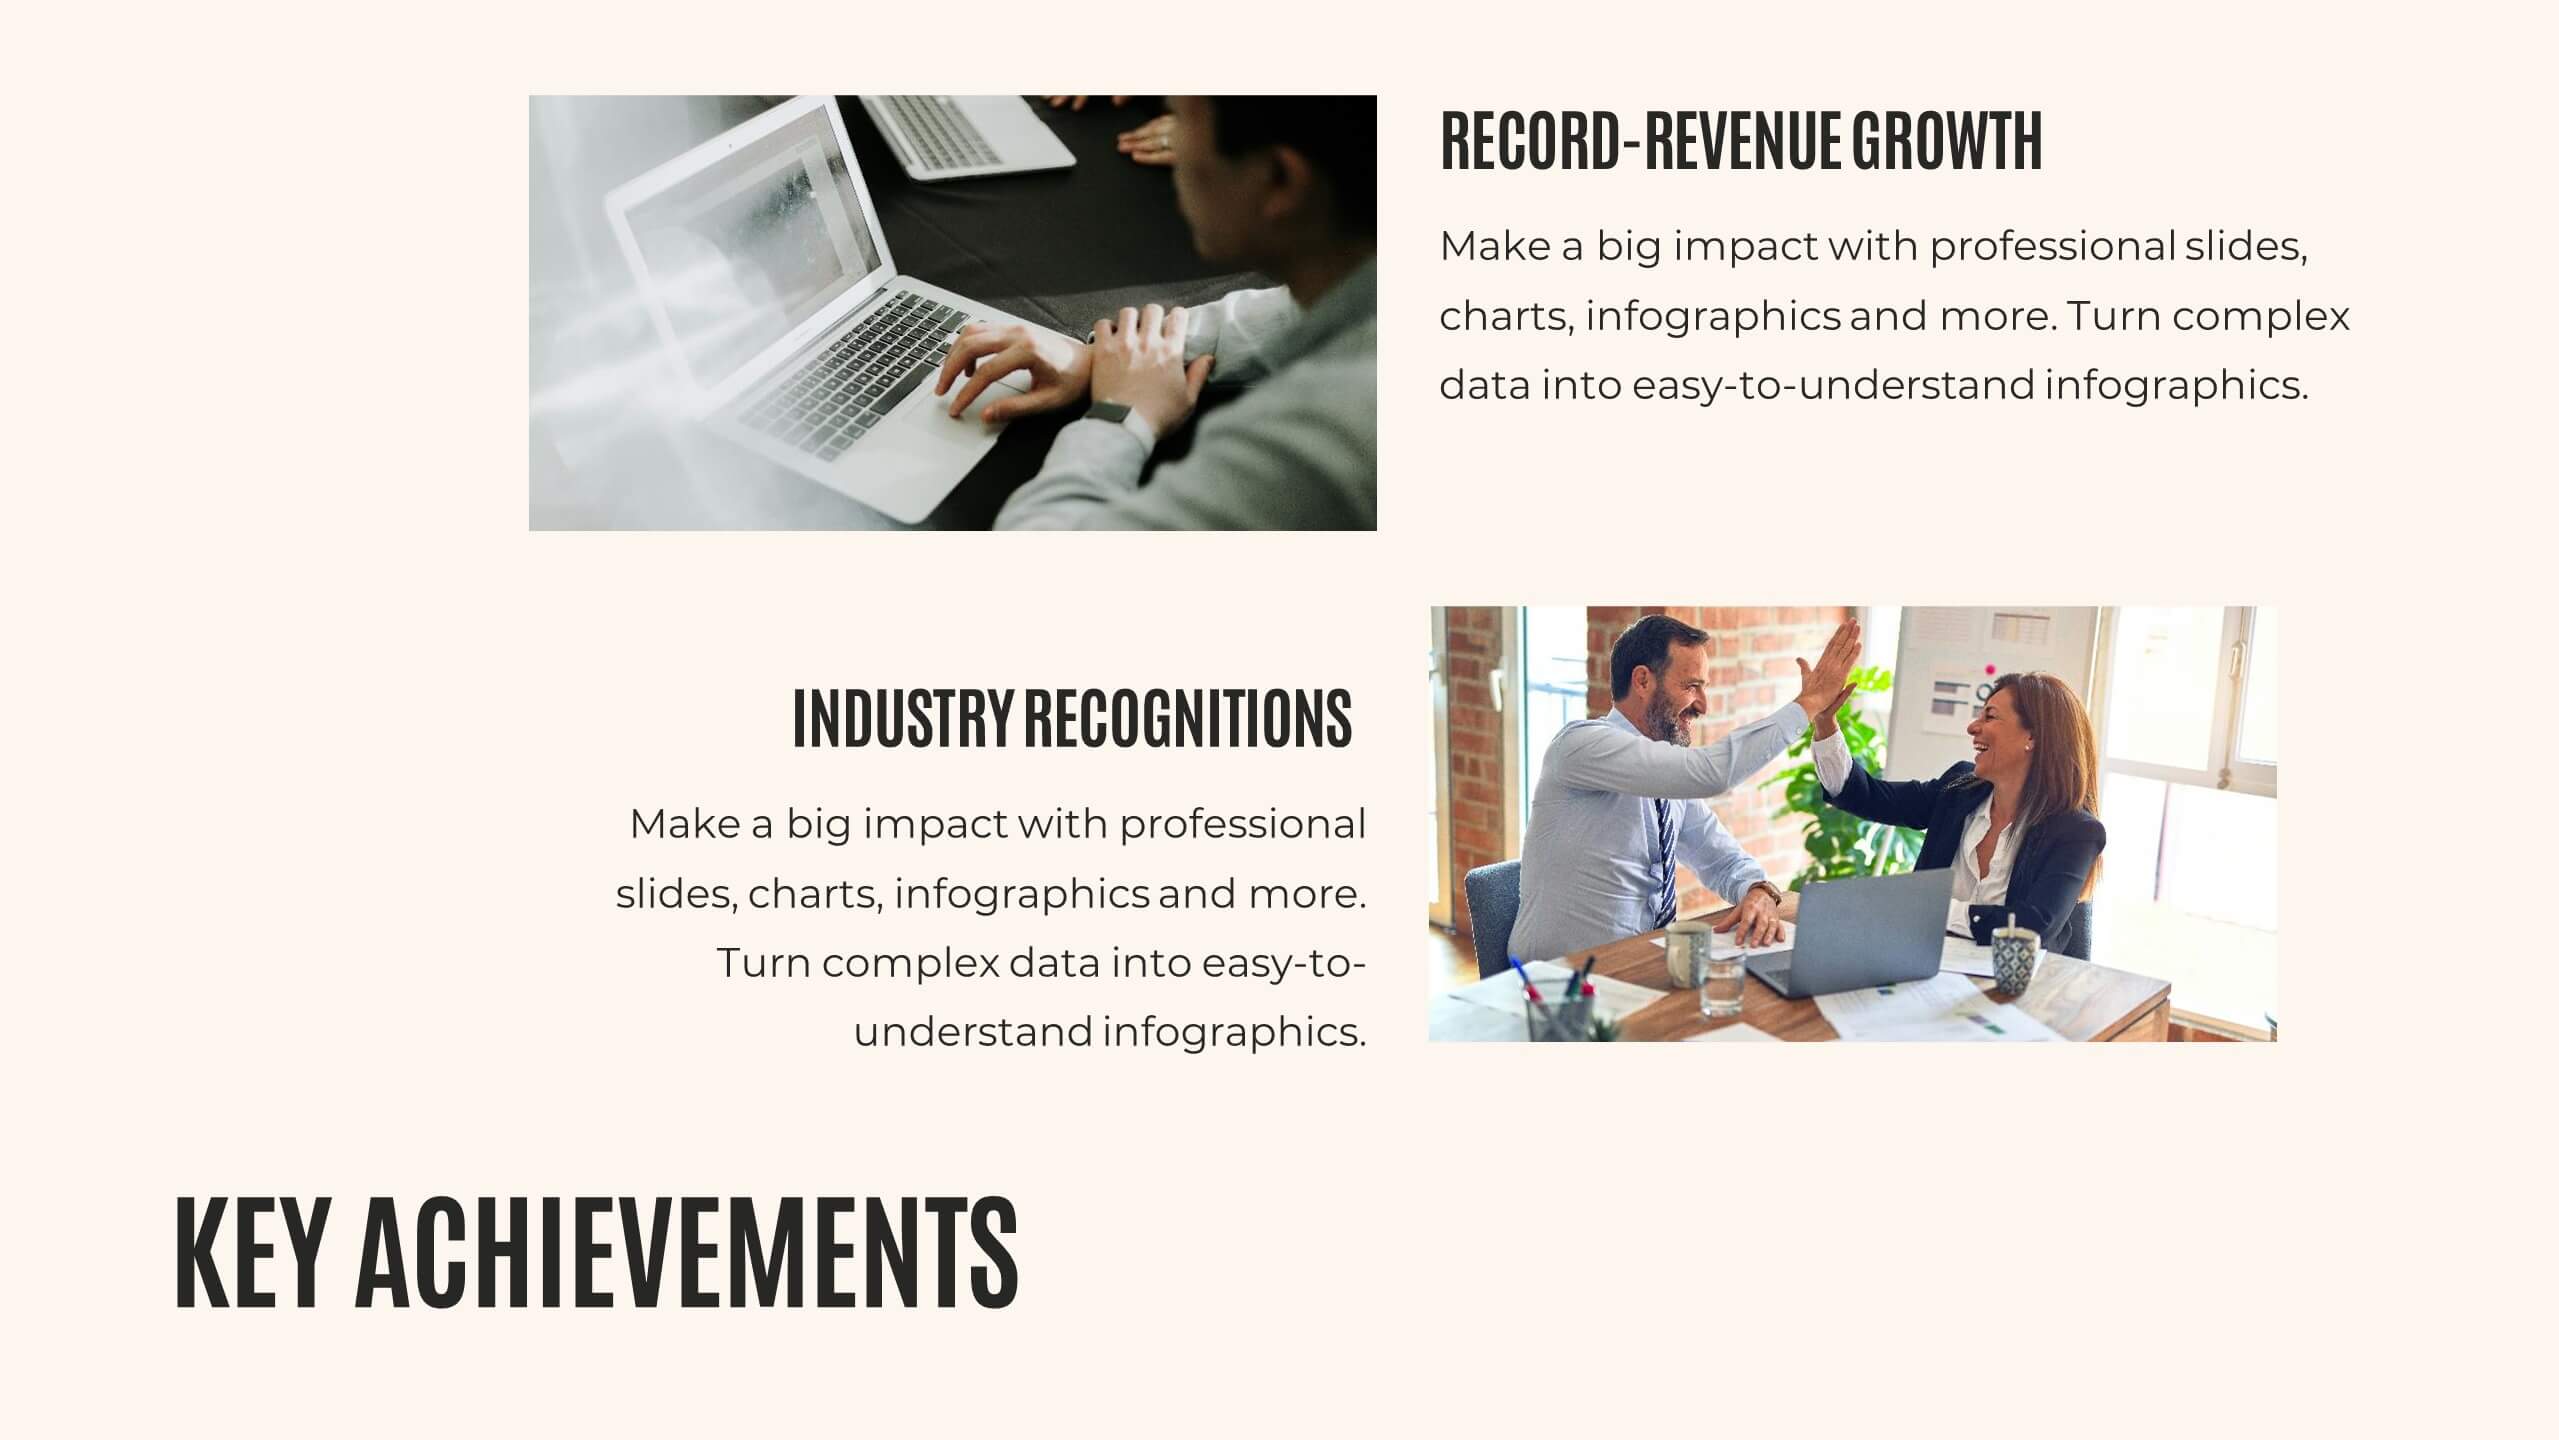
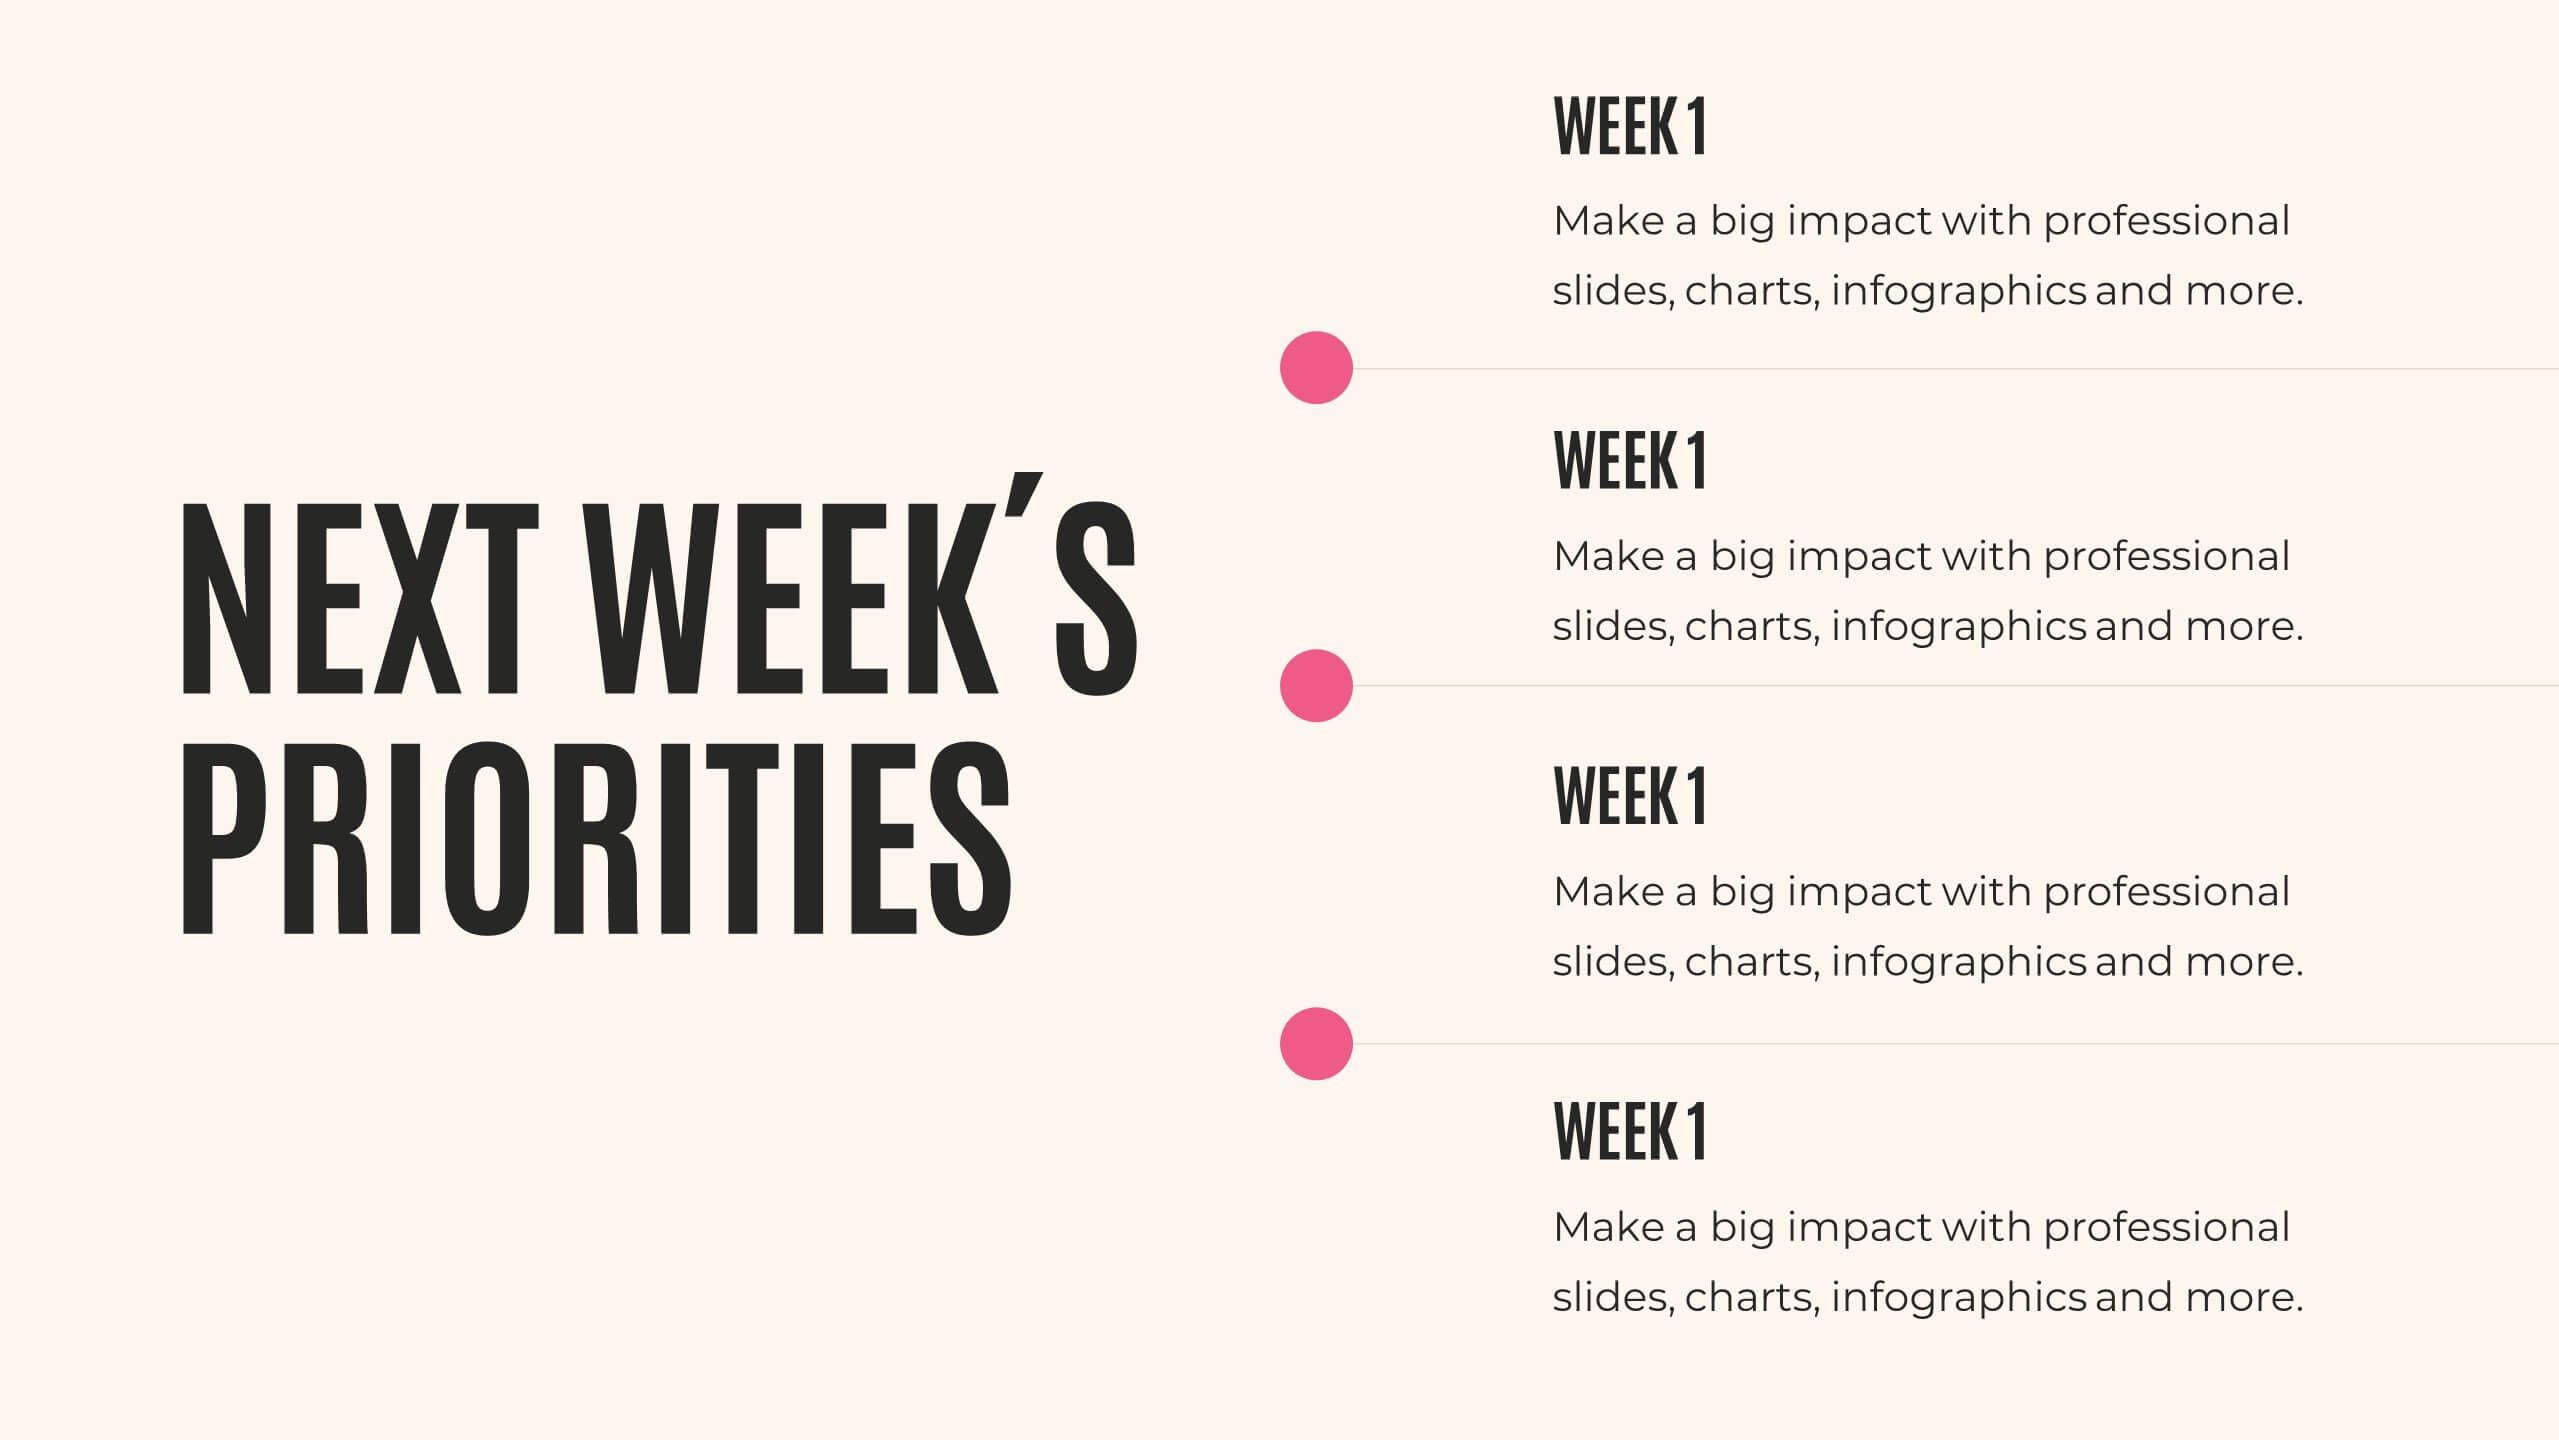
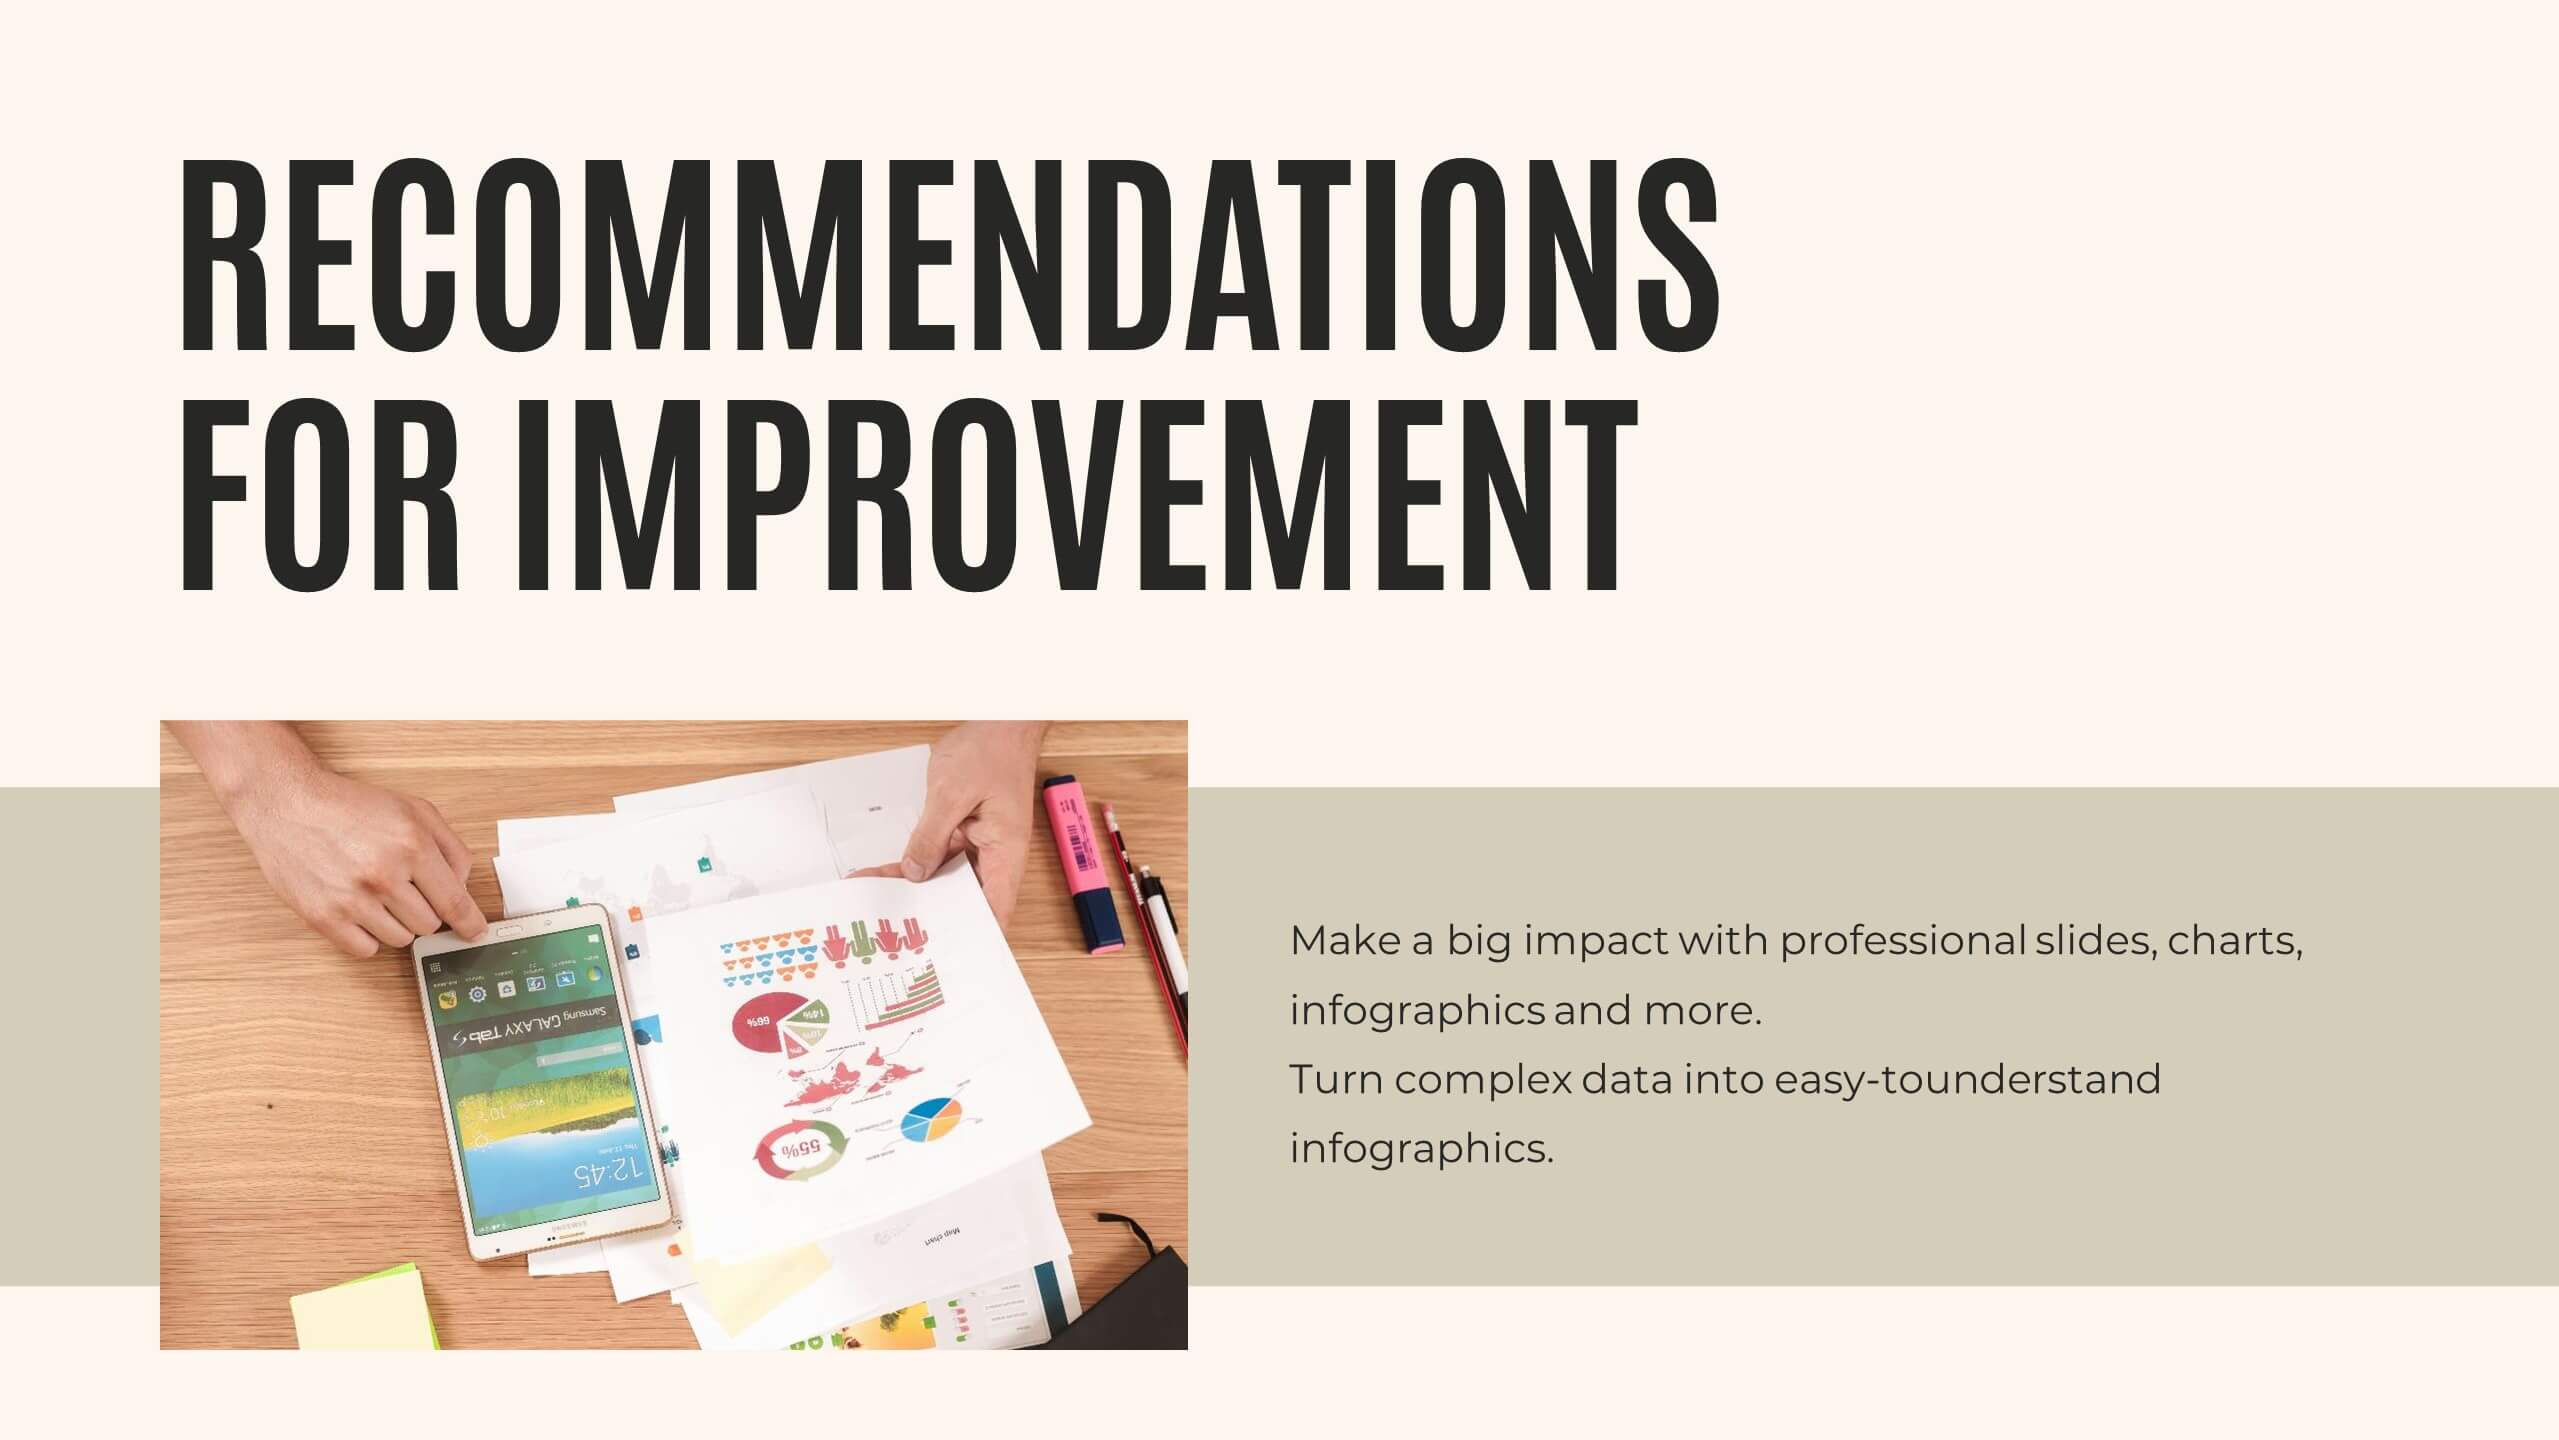
Journey Annual Report Presentation
Present your annual report with clarity and impact! This template covers agenda, key highlights, financial summary, sales performance, and project progress. Ideal for detailing achievements, insights, and future priorities. Compatible with PowerPoint, Keynote, and Google Slides, it ensures your data is visually compelling and easy to understand. Showcase your success effortlessly!


2 diapositivas
Professional Thank You Closing Slide Presentation
Make your last impression count with a clean, modern closing slide that wraps up your presentation in style. This template is designed to help you leave a professional mark while displaying contact info, brand visuals, or a thank-you note. Fully compatible with PowerPoint, Keynote, and Google Slides for flexible use.


7 diapositivas
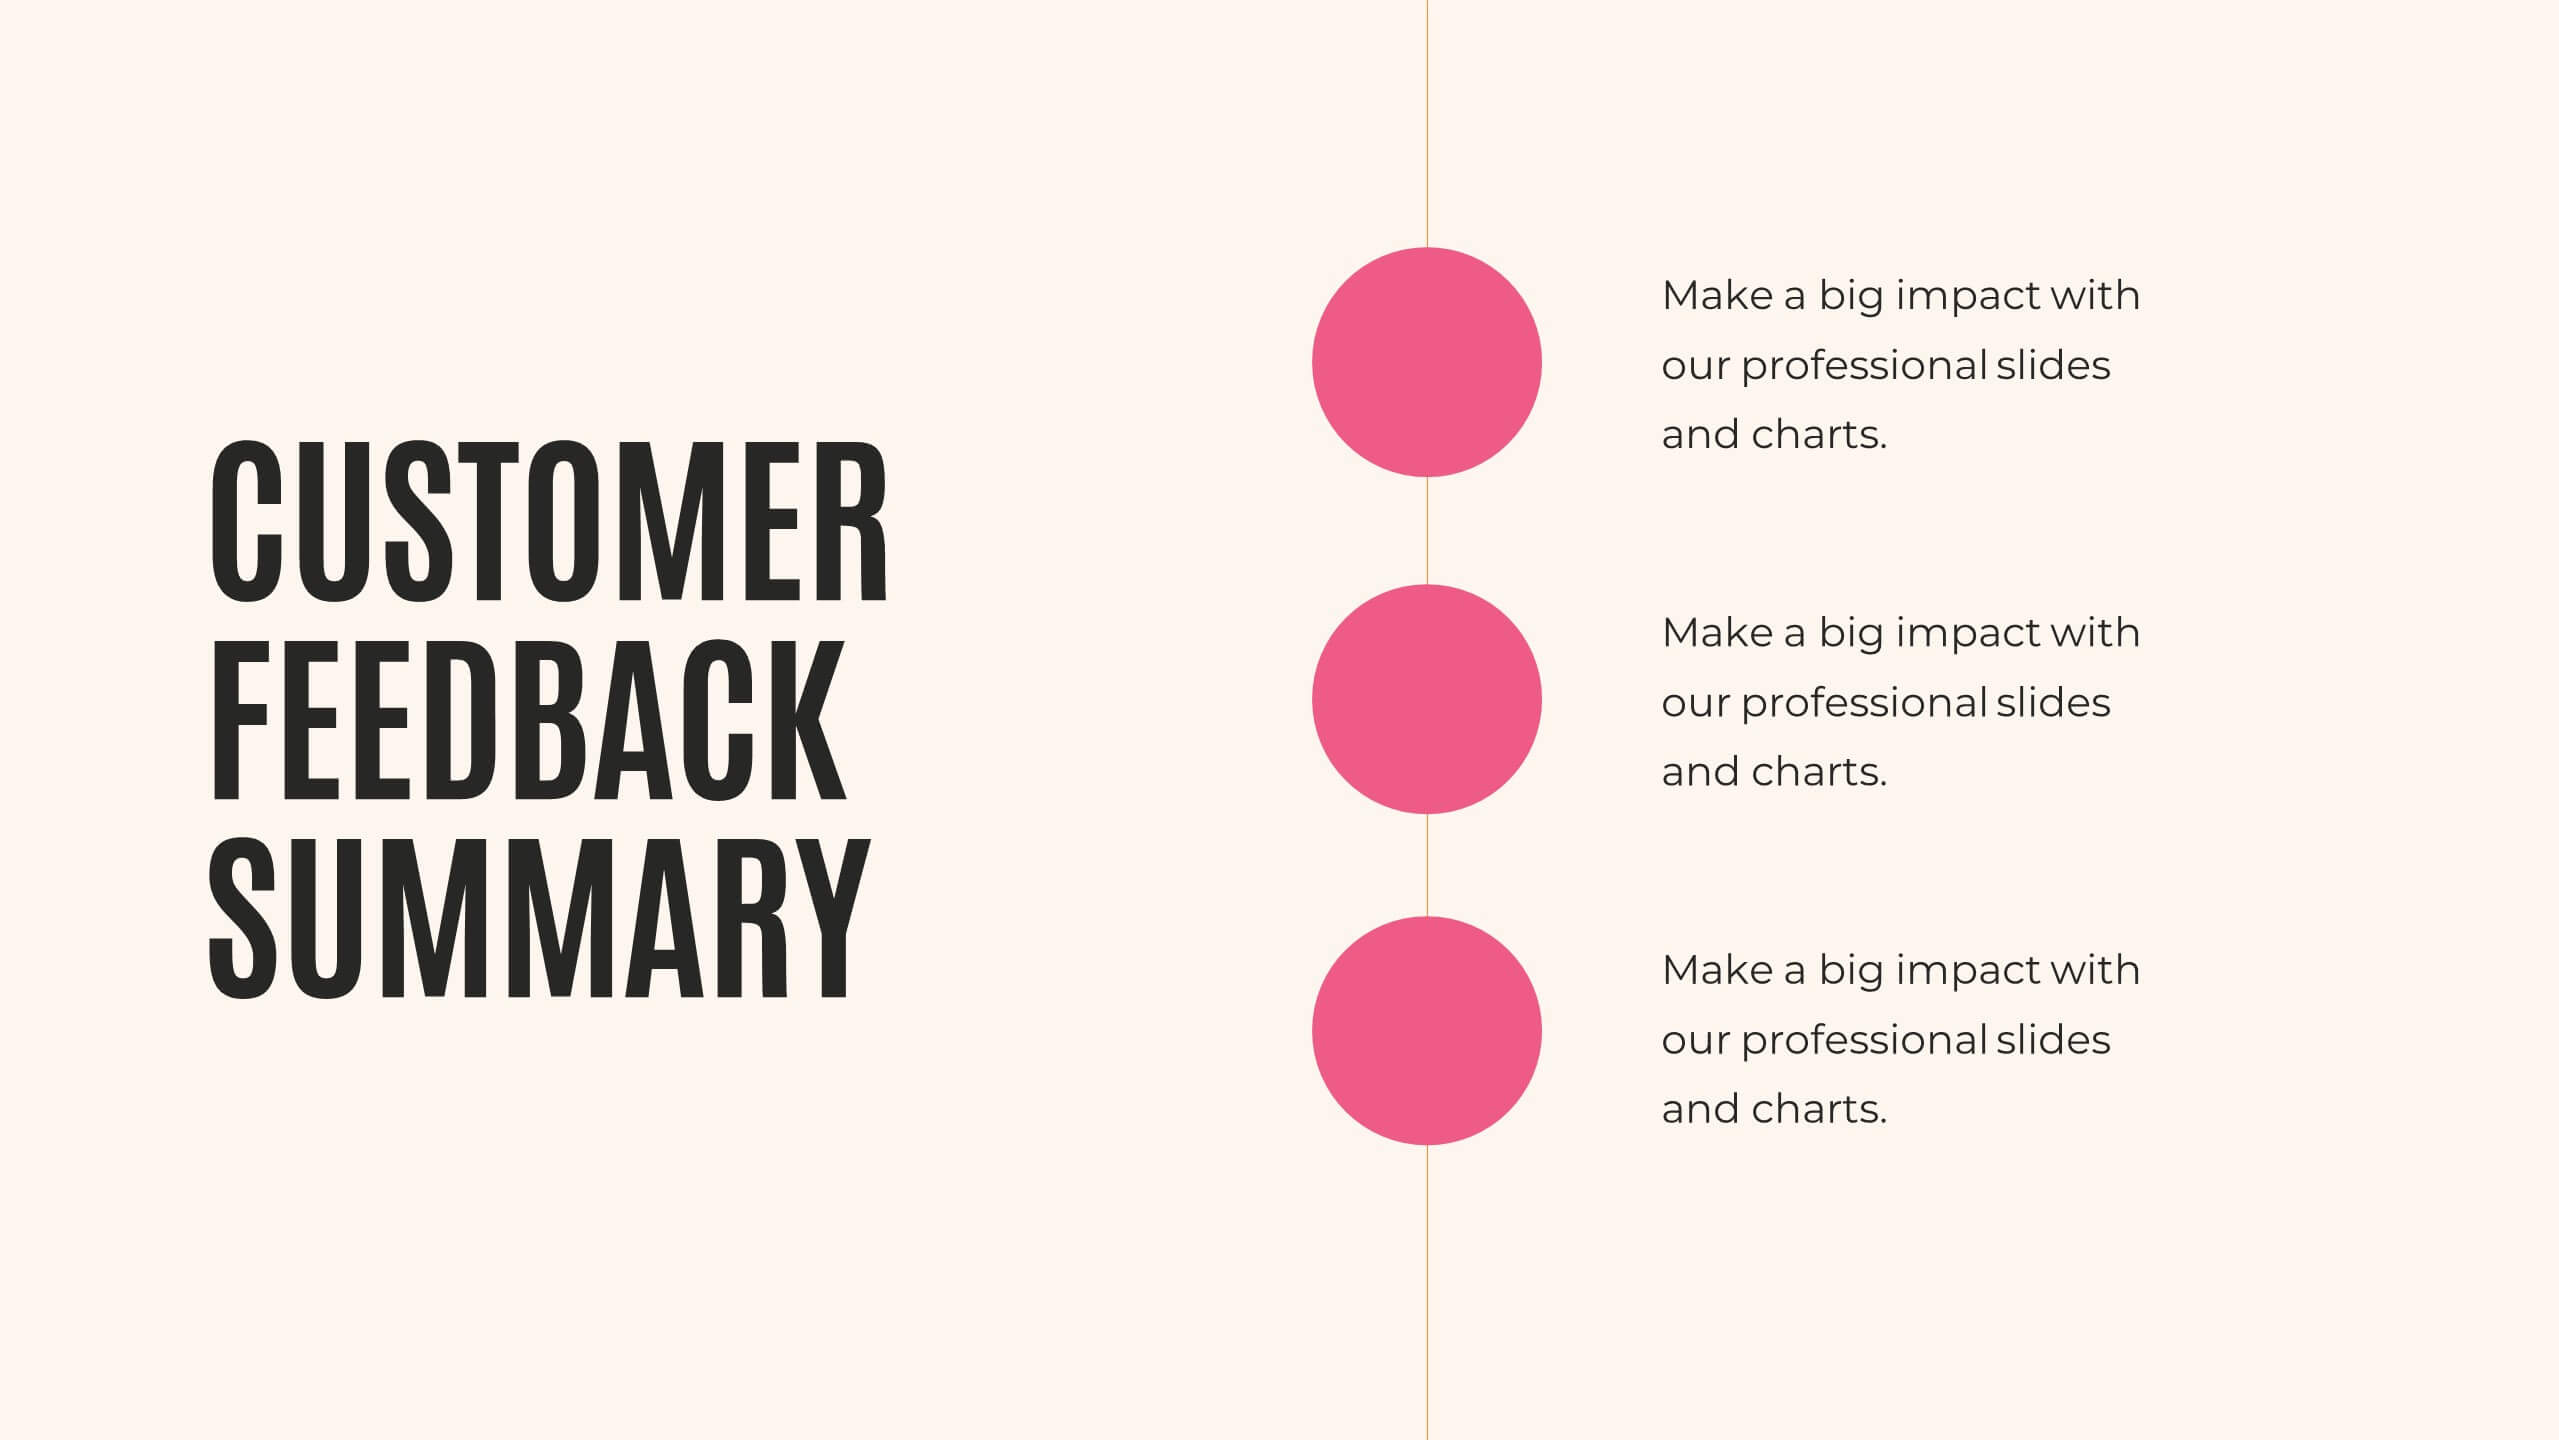
Lifecycle Stages in Customer Experience Presentation
Showcase the full customer journey with this Lifecycle Stages in Customer Experience presentation. Featuring a sleek infinity loop layout, this slide is ideal for visualizing cyclical engagement stages—like acquisition, onboarding, retention, and advocacy. Clean design and labeled touchpoints help convey insights clearly. Fully compatible with PowerPoint, Canva, and Google Slides.


4 diapositivas
Customer Segment Breakdown Presentation
Bring clarity to your audience with a dynamic visual that highlights who your customers truly are and how each segment connects. This presentation helps you map behaviors, priorities, and shared traits in a clean, intuitive layout for smarter marketing and strategy decisions. Fully compatible with PowerPoint, Keynote, and Google Slides.