


Características


¿Tienes alguna pregunta?
Recomendar


6 diapositivas
Sales Team Infographic
The series presented showcases various slide templates tailored for enhancing sales team strategies and communication. Each slide is crafted to assist sales professionals in detailing team structures, sales goals, performance metrics, and strategic initiatives effectively. Utilizing vibrant color blocks and streamlined design elements, these templates make complex sales data approachable and engaging, facilitating clear and impactful presentations. The collection is designed with adaptability in mind, incorporating elements that can be easily customized to fit different team needs and company branding. These include comparative layouts for benchmarking, timeline formats for showcasing sales cycles, and diagrammatic representations for visualizing sales processes and results. Perfect for internal meetings, sales training sessions, and stakeholder presentations, these templates serve as essential tools for sales leaders to convey their team’s progress, celebrate wins, and strategize for future sales endeavors.


7 diapositivas
Mind Map Project Infographic
A mind map is a visual representation of information, ideas, or concepts arranged around a central topic or theme. This template is a powerful brainstorming and organizational tool that helps individuals or teams visually connect related ideas, explore new connections, and see the bigger picture. This diagram organizes information around a central theme or idea, with branches extending outwards to represent related concepts or tasks. This infographic is perfect for for capturing ideas, and presenting complex information in a structured and easily manner. This template is customizable and compatible with Powerpoint, Keynote, and Google Slides.


7 diapositivas
Customer Journey Stages Infographic Presentation
A Customer Journey consists of a series of interactions that occur over time between your company and the customer. Our template uses a colorful color scheme and style to present a customer journey. This communicates how the customer moves through their process. The layout allows you to customize each text box with your own text. The stages are color coded, making it easy for you to identify them. This template is designed to provide the most up-to-date research and analytical data so you can effectively engage and connect with your audience. Capture your customer's journey with this template!


7 diapositivas
SWOT Analysis Infographic Presentation Template
SWOT analysis is a strategic tool that's usually done to help you determine your company's strengths and weaknesses, as well as opportunities and threats that could affect your company's future. With this template you can visually present the results of a SWOT analysis. They are used too quickly and easily communicate the key findings of the analysis to stakeholders, such as investors and employees. This templates infographics typically include four quadrants, each representing one of the SWOT elements. Use this template to make an easy-to-read infographic of your company's success factors.


6 diapositivas
1-Page Executive Summary Slide Presentation
Bring clarity to complex updates in a single, colorful layout designed to keep your audience engaged from start to finish. This clean and modern slide breaks down key messages into six distinct points, making it easy to showcase progress, milestones, or strategies. Fully compatible with PowerPoint, Keynote, and Google Slides.


7 diapositivas
Framework Documentation Infographic
A framework infographic presents a framework for organizing and understanding complex information, to provide an overview of the key elements and relationships between them. This template is designed to break down your large amounts of information into smaller, more manageable parts. This infographic can be used in fields such as business, marketing, and strategy, as well as in education and research. Use it to explain complex concepts, theories, and models, and to provide a visual representation of how elements fit together. This can take a variety of forms, including flowcharts and diagrams.


6 diapositivas
Company Hierarchy Infographics
Effectively illustrate your company's hierarchy with our Company Hierarchy infographic template. This template is fully compatible with popular presentation software like PowerPoint, Keynote, and Google Slides, allowing you to easily customize it to showcase your organization's structure and reporting relationships. The Company Hierarchy infographic template offers a visually engaging platform to depict the different levels of leadership, departments, and roles within your company. Whether you're an HR professional, manager, or business leader, this template provides a user-friendly canvas to create informative presentations and organizational charts. Optimize your communication of your company's hierarchy with this SEO-optimized Company Hierarchy infographic template, thoughtfully designed for clarity and ease of use. Customize it to showcase leadership teams, reporting lines, and the key responsibilities of each role, ensuring that your audience gains a comprehensive understanding of your organization's structure. Start crafting your personalized infographic today to effectively communicate your company's hierarchy.


5 diapositivas
Customer Profile and Persona Insights Presentation
Showcase your target audience with style using this modern persona insights deck. Highlight demographics, traits, and behaviors through visual cards and editable text placeholders. Perfect for marketing strategy, user research, or campaign planning. Fully customizable in PowerPoint, Keynote, and Google Slides to align with your branding and presentation needs.


6 diapositivas
Bubble Mapping Strategy Presentation
Turn your ideas into a clear visual roadmap that captures every connection and concept in one glance. This professional presentation helps organize strategies, goals, and processes through an easy-to-follow bubble map layout. Fully customizable and compatible with PowerPoint, Keynote, and Google Slides for seamless editing and presentation.


8 diapositivas
Building Planning and Architecture Strategy Presentation
Bring structure and vision to your development plans with the Building Planning and Architecture Strategy Presentation. This visual template showcases an illustrated construction scene paired with four key planning pillars—ideal for presenting design phases, zoning steps, or project milestones. Fully customizable in PowerPoint, Keynote, and Google Slides.


6 diapositivas
End-to-End Value Chain Process Presentation
Visualize every link in your process with the End-to-End Value Chain Process Presentation. This modern chain diagram helps illustrate each stage of your business or production flow—from initial input to final output. It's ideal for strategy, supply chain, and operational planning. Fully editable in PowerPoint, Keynote, Canva, or Google Slides.


7 diapositivas
Product Innovation Infographic
Illuminate the path to creativity with our Product Innovation infographic, specifically designed for Powerpoint, Keynote, and Google Slides. This engaging infographic is an excellent resource for professionals seeking to present the innovation process in an accessible format. The eye-catching design breaks down complex ideas into digestible segments, perfect for sparking discussions on product development and creative brainstorming sessions. Our Product Innovation infographic is a versatile tool, offering a visual representation of the stages of innovation. It's ideal for educators, business leaders, and entrepreneurs who aim to inspire and educate their audience on the intricacies of innovative thinking. Each element of the infographic is crafted to encourage audience engagement, making it easier to convey the nuances of product innovation strategies. Compatibility with major presentation platforms ensures that this infographic can be seamlessly integrated into your slide deck. Use it to enhance your message and captivate your audience with a clear visual journey through the innovation process. Add this infographic to your presentation toolkit to bring your vision of innovation to life.


26 diapositivas
Austin Presentation Template
Sports photography captures the essence of sports and its participants by conveying a strong image. The photographer needs to carefully plan the timing of taking these photos. The Austin Template is perfect for displaying information about your products and services. Vivid and bold colors draw your audience's attention, while the creative sections provide all the relevant details. With an appealing layout and stylish design, you can present yourself in the best light possible. This template will give your site the professional look it deserves, and be sure to stand out to your clients.


20 diapositivas
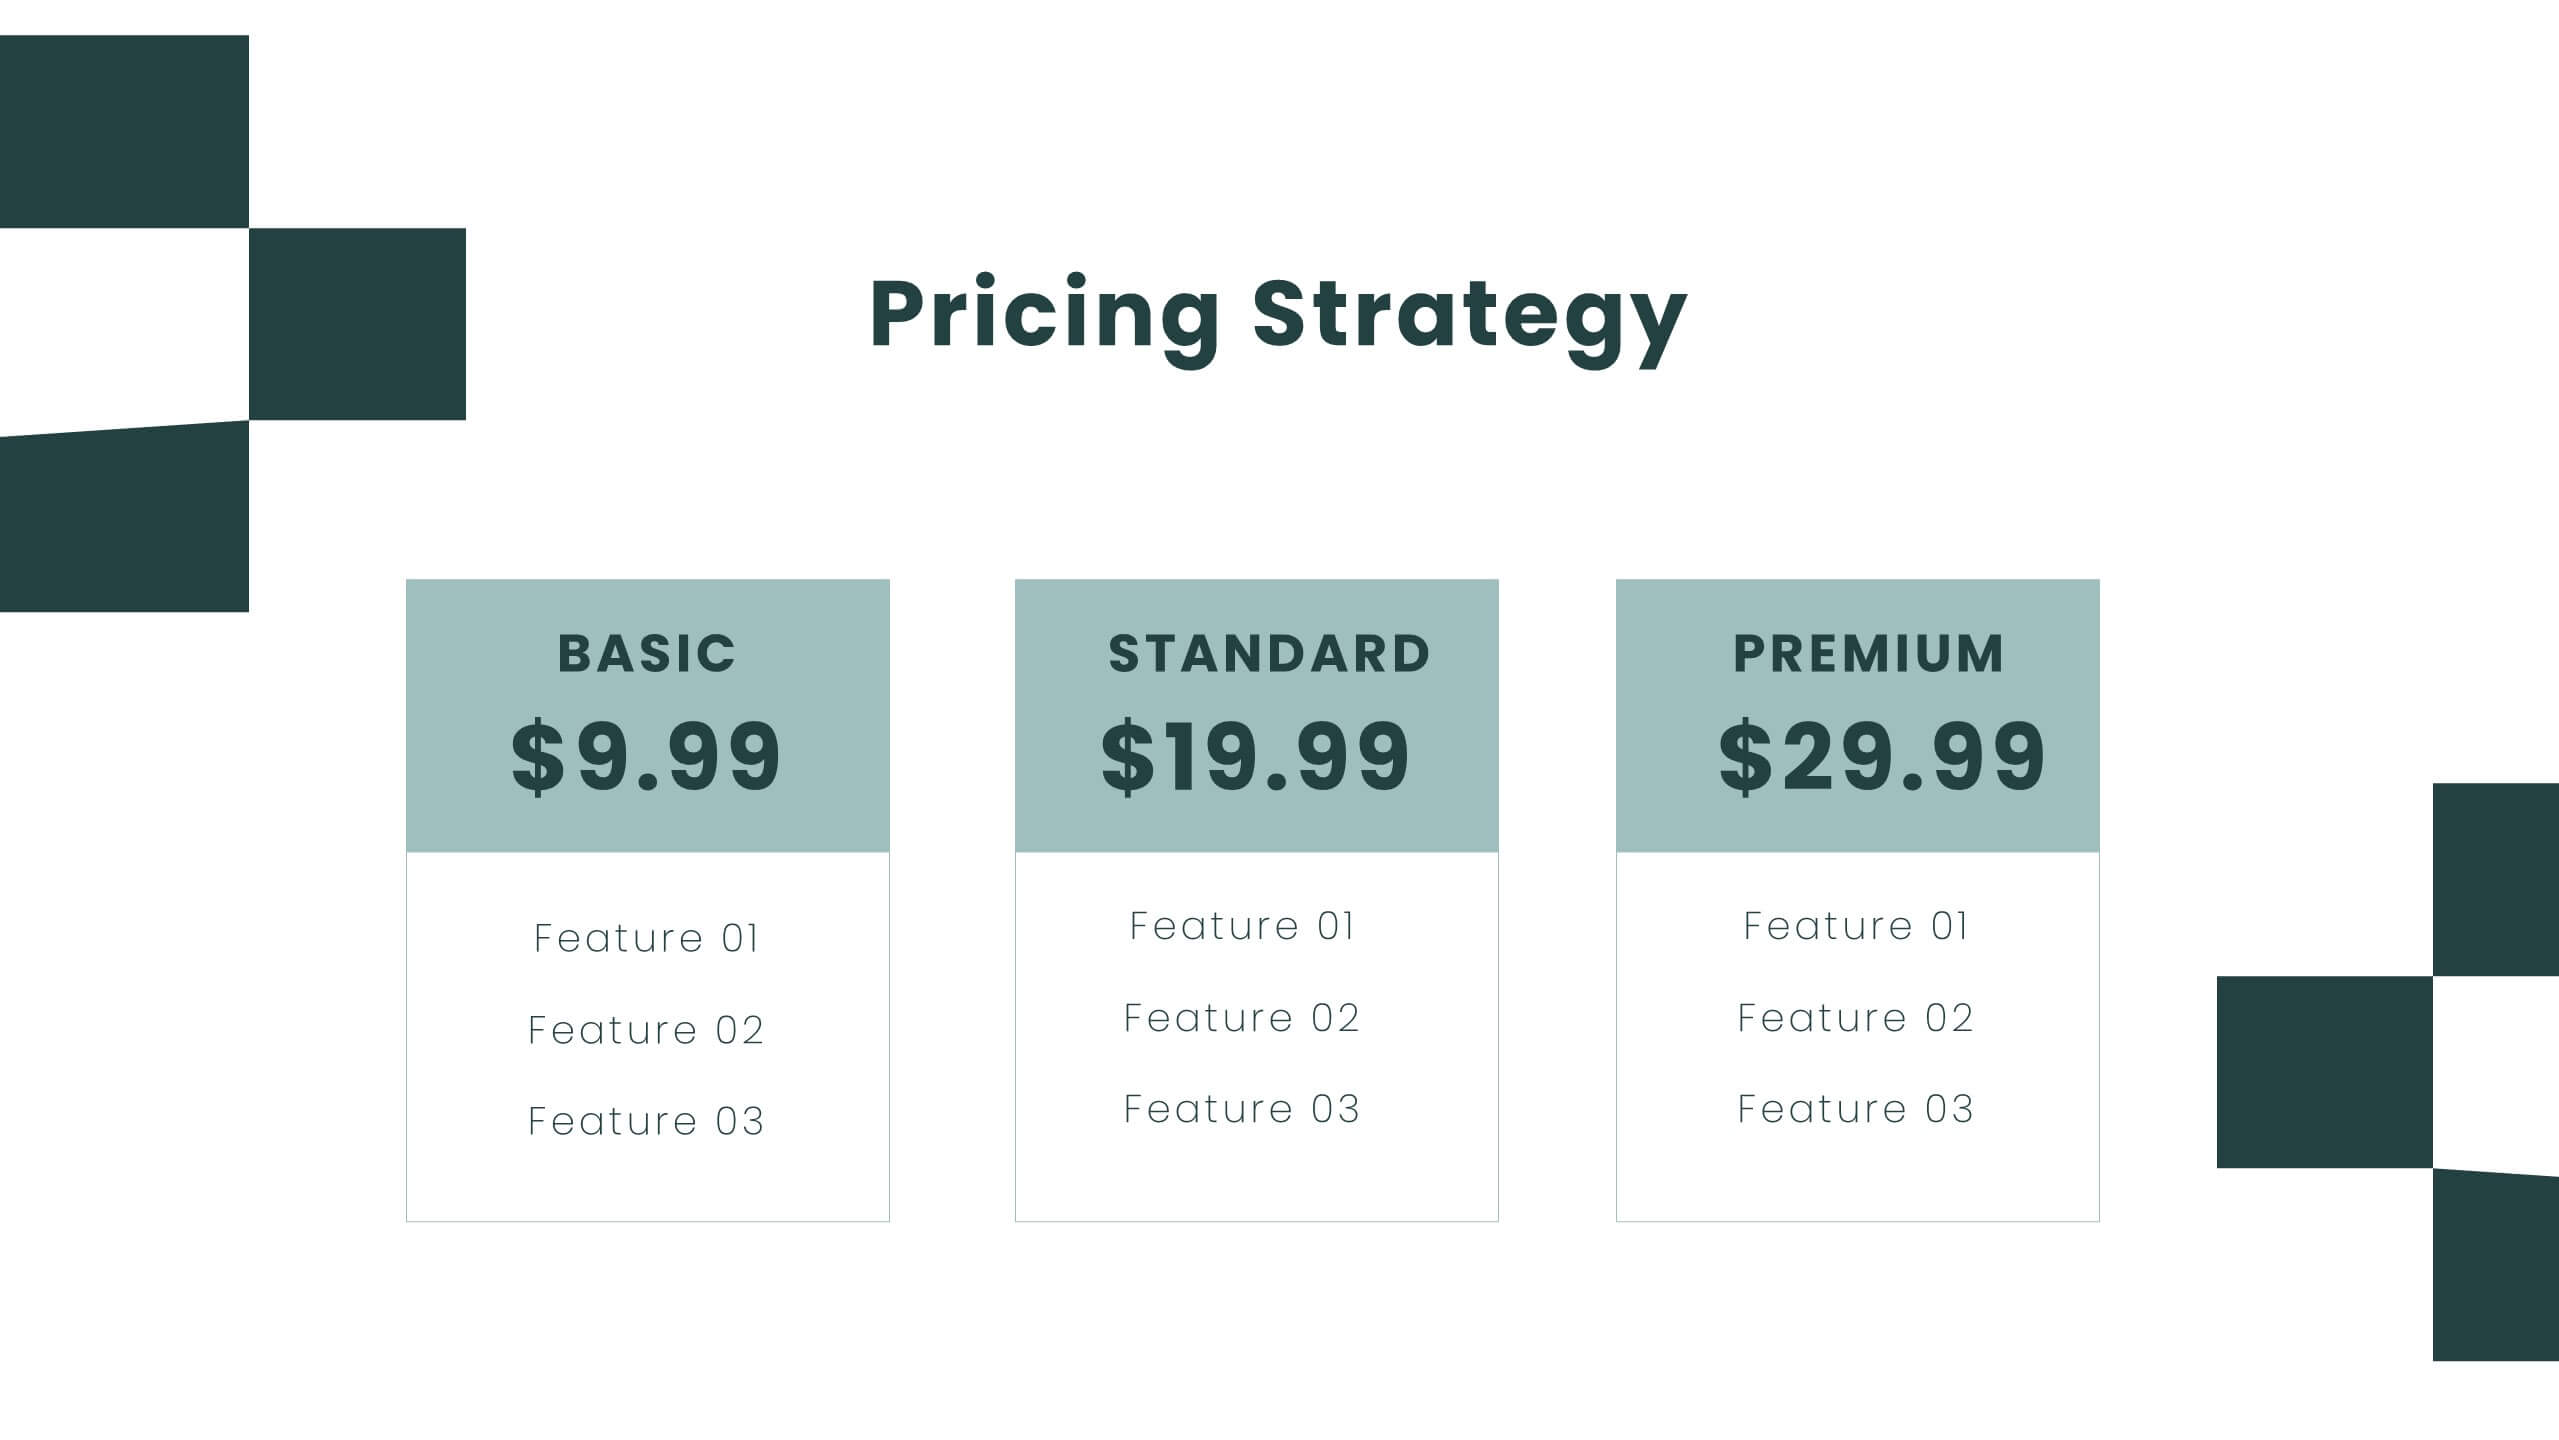
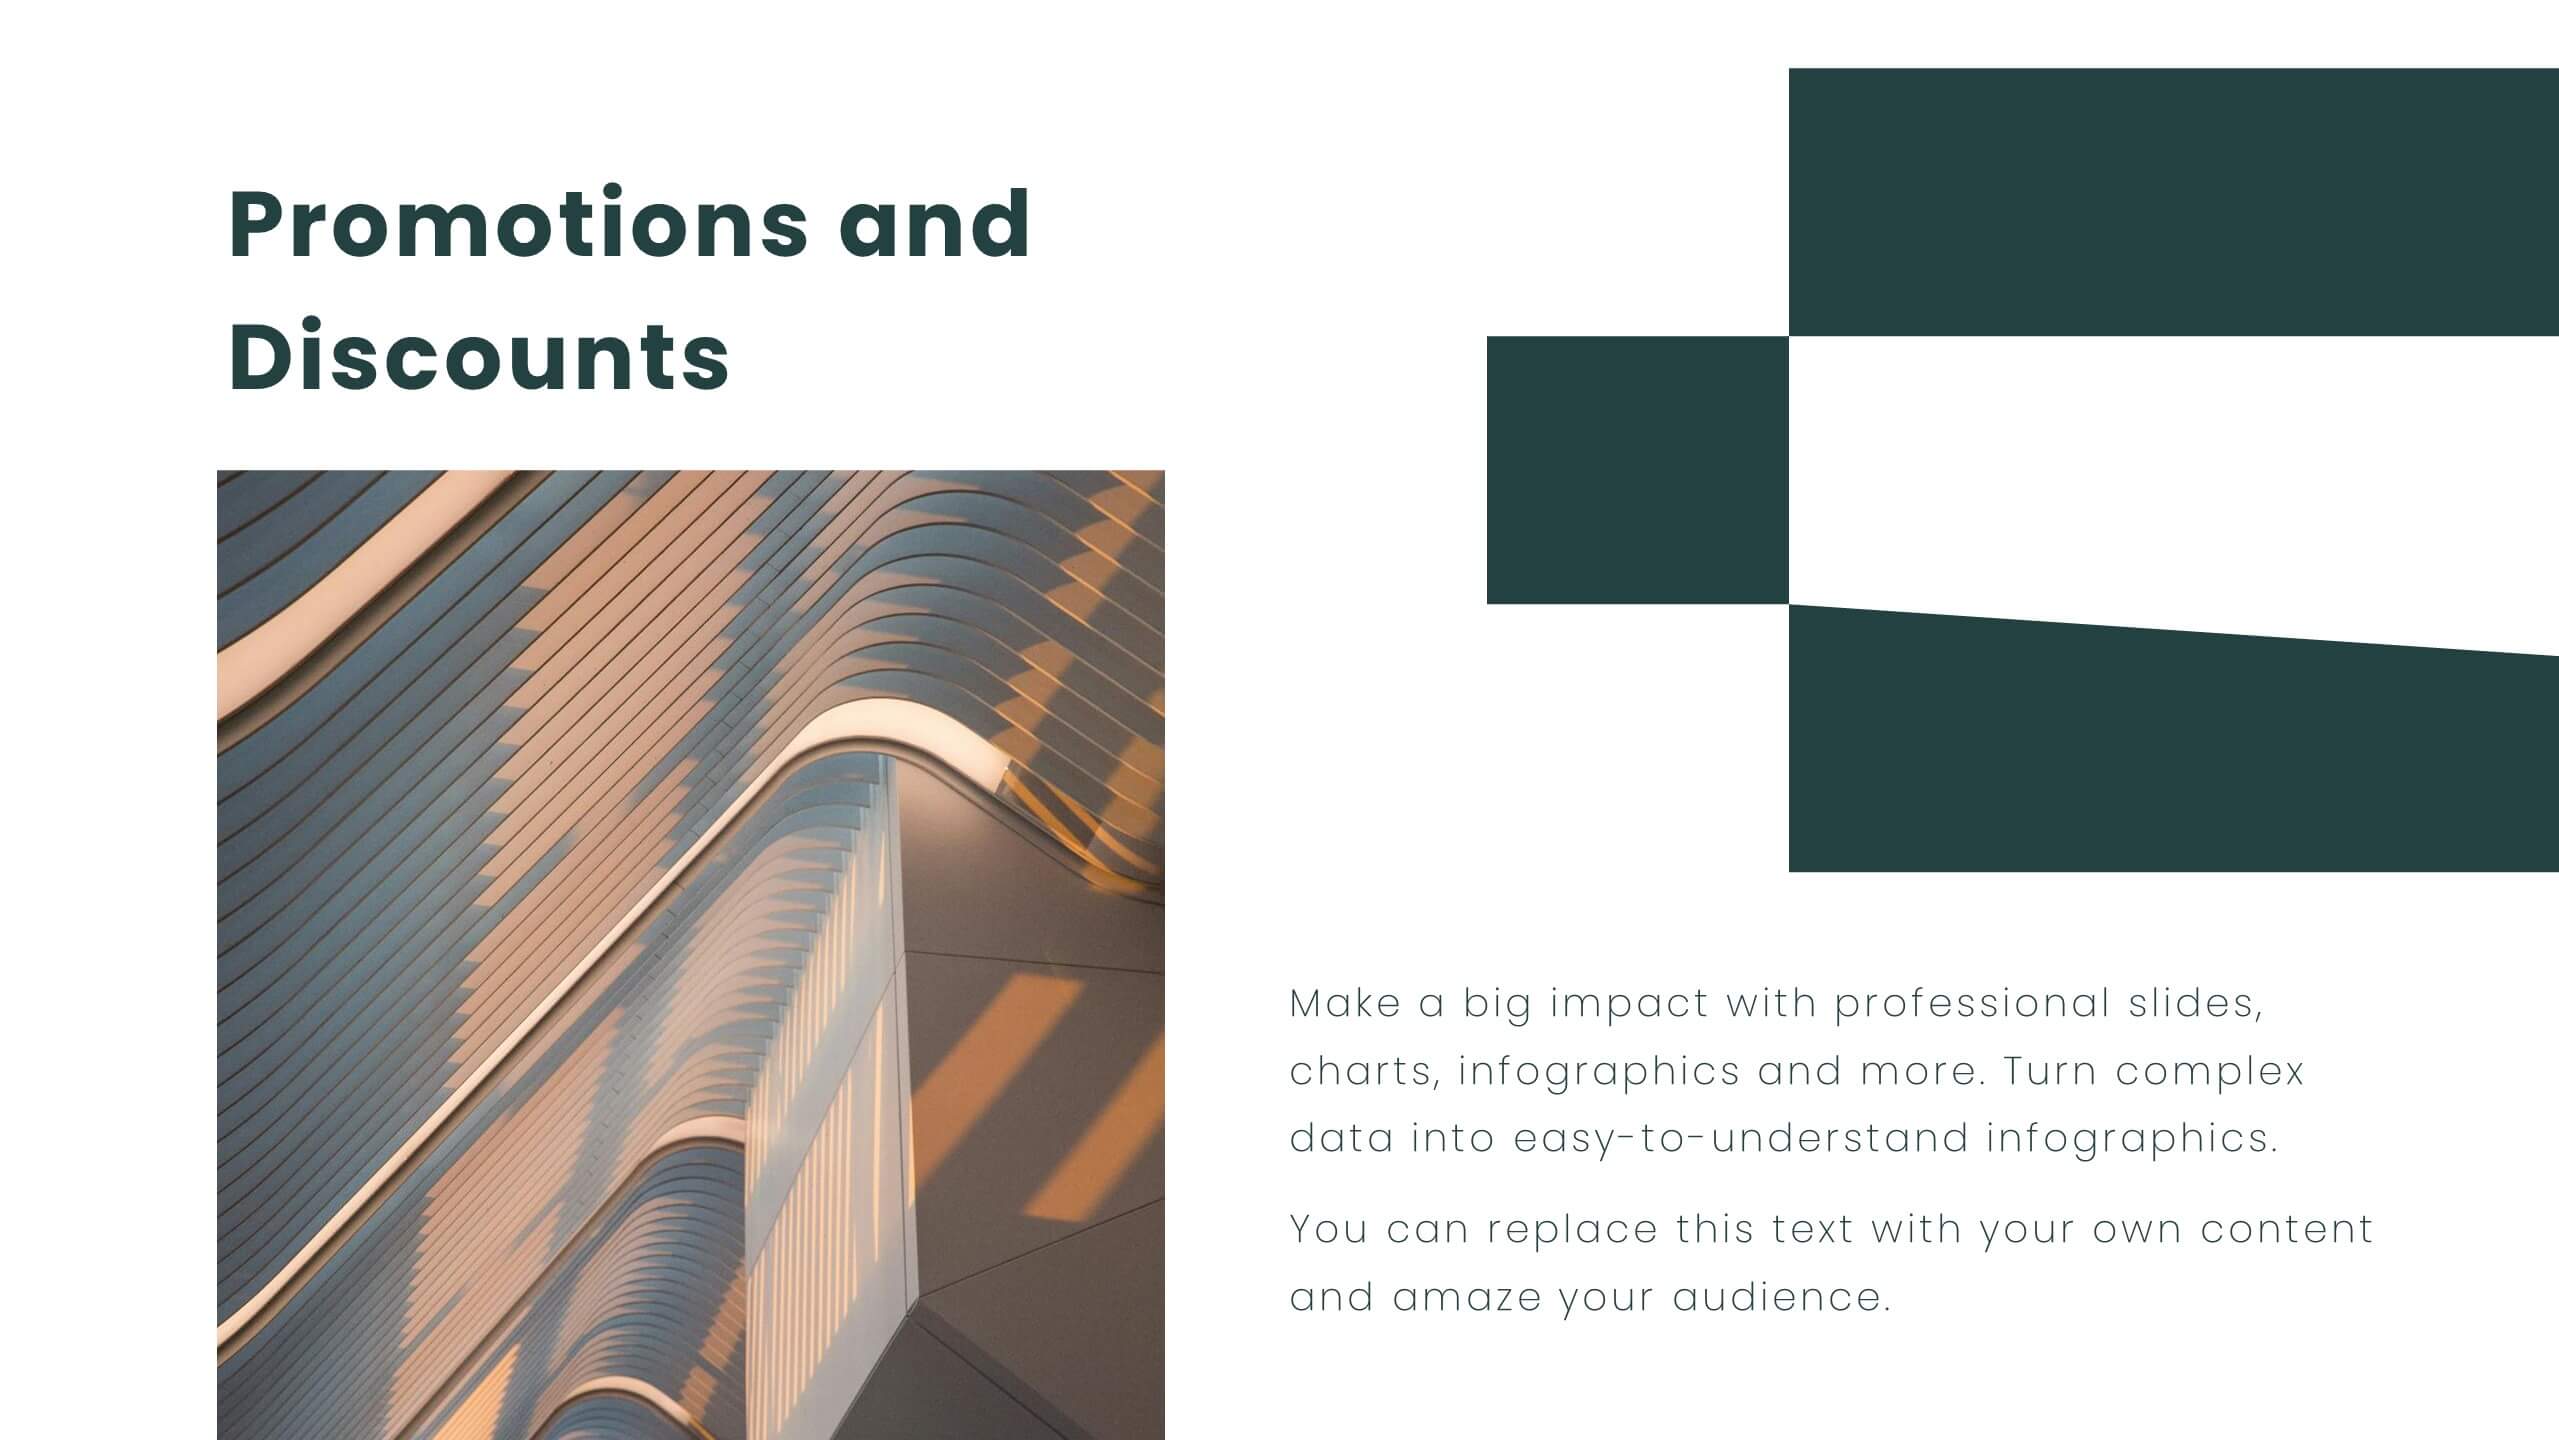
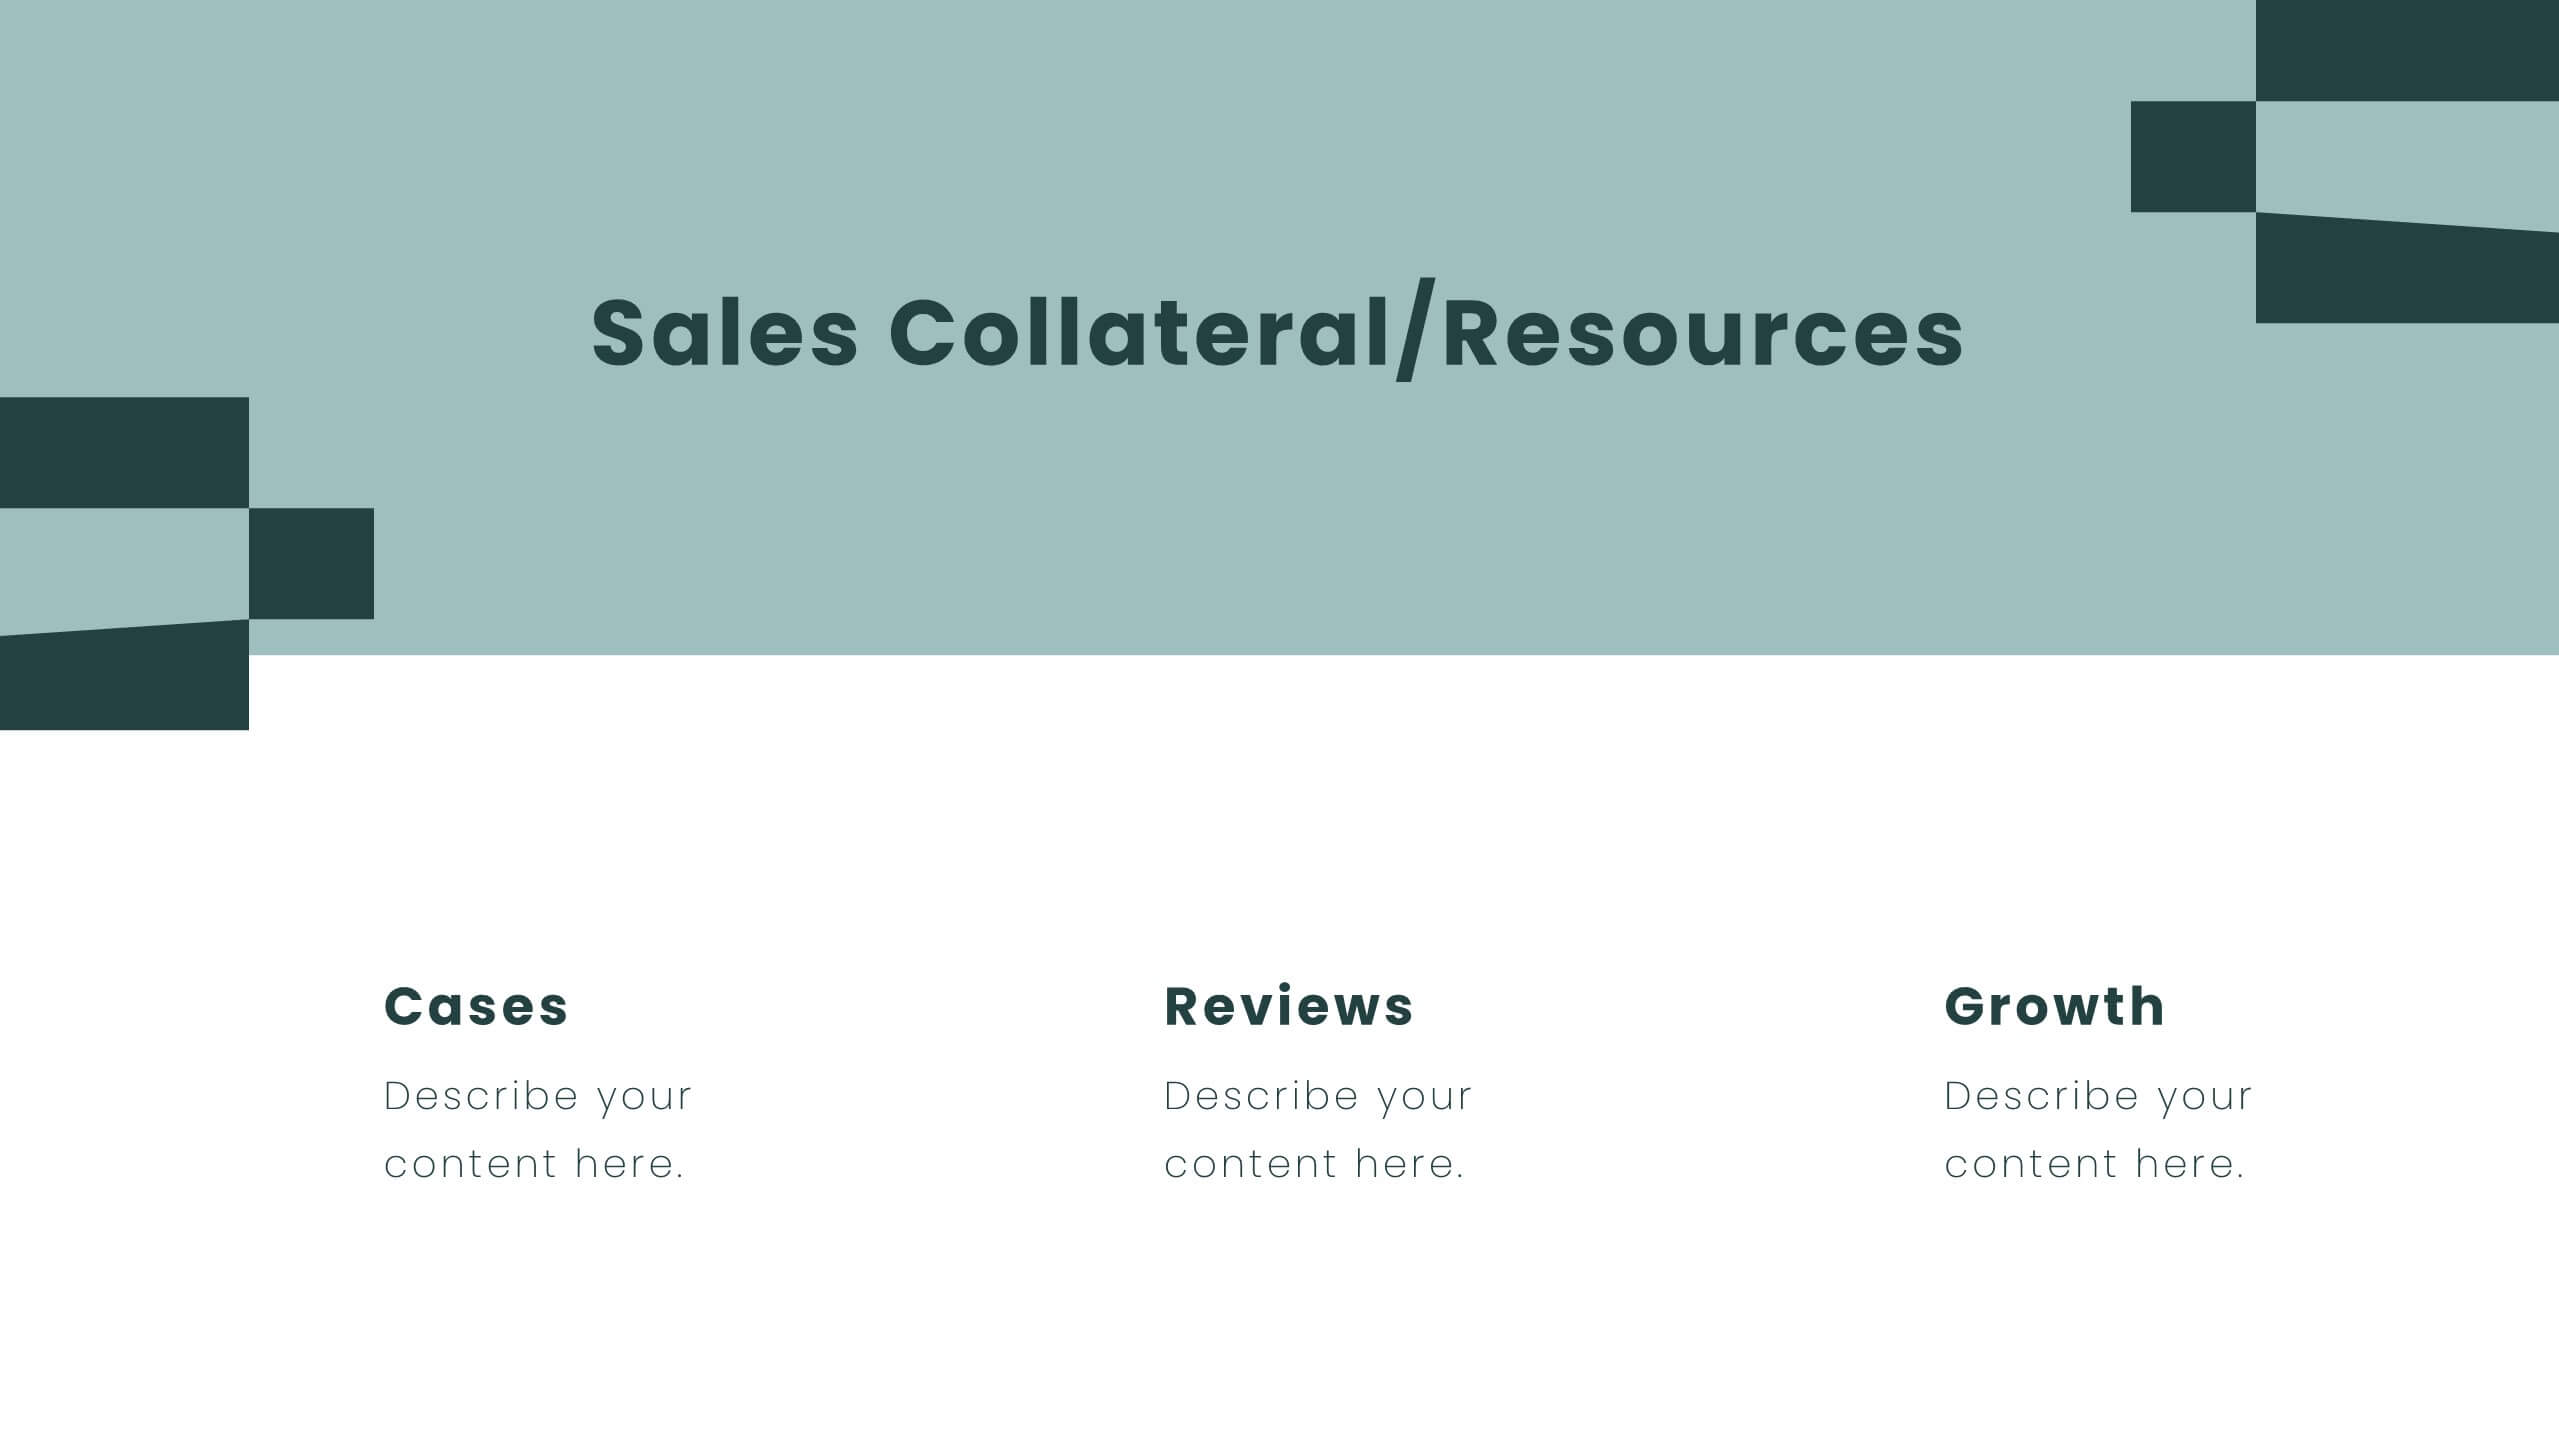
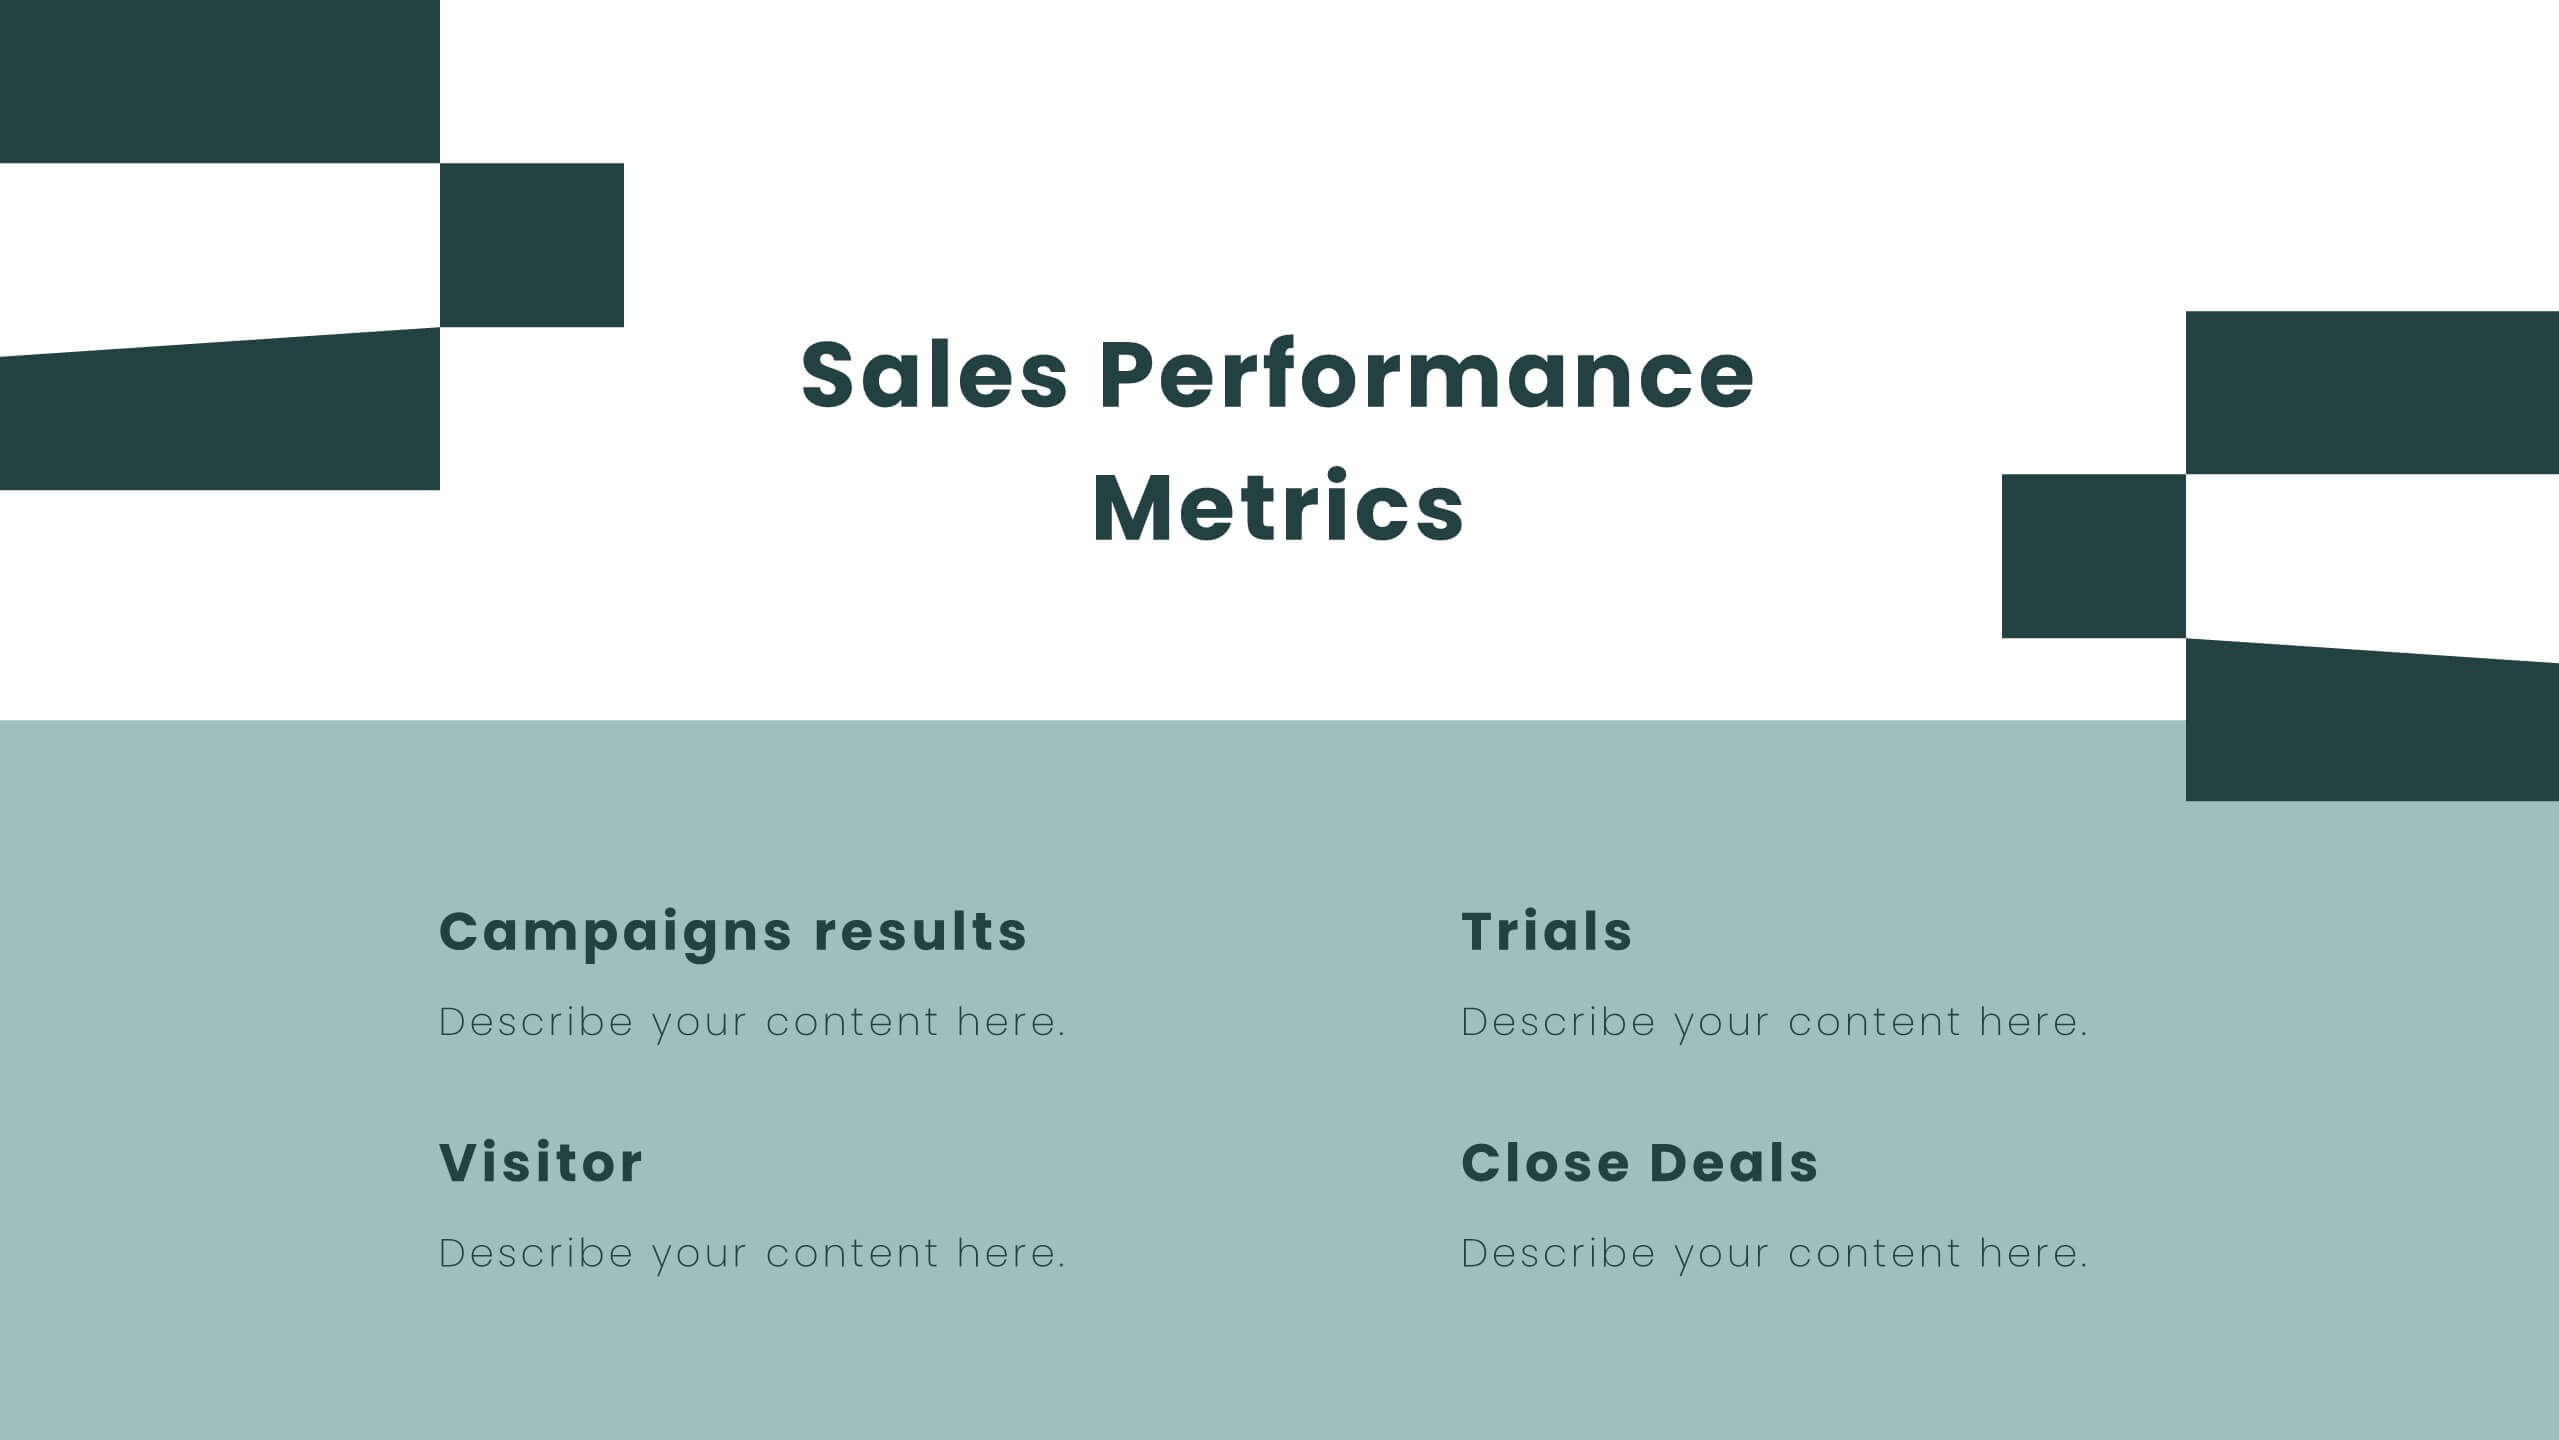
Radiant Sales Proposal Presentation
Elevate your pitch with this polished sales proposal template! Perfect for presenting company overviews, product/service details, and pricing strategies, it includes slides for competitive analysis and customer testimonials. Impress your audience with clear visuals and structured content. Compatible with PowerPoint, Keynote, and Google Slides for seamless presentations on any platform.
5 diapositivas
Team Achievements and Output Tracking Presentation
Celebrate success and monitor progress with the Team Achievements and Output Tracking presentation template. Designed with visual medal icons and color-coded team figures, this layout is perfect for highlighting milestones, recognizing contributors, and tracking output performance. Fully editable and compatible with PowerPoint, Keynote, and Google Slides.


6 diapositivas
Project Scope and Expansion Scale Presentation
Display growth areas and operational coverage with this segmented radial chart. Ideal for showcasing project reach, departmental impact, or phase distributions, each section includes editable icons and labels. Perfect for strategy updates, expansion pitches, or status reporting. Fully customizable in PowerPoint, Keynote, and Google Slides for professional presentations.


5 diapositivas
Sub-Saharan Africa Region Presentation
Showcase regional insights with a sleek, professional map highlighting key areas across Africa’s southern nations. Ideal for presenting economic data, development initiatives, or regional comparisons, this layout balances clarity with visual impact. Fully compatible with PowerPoint, Keynote, and Google Slides for smooth editing and impactful presentations.