


Características


¿Tienes alguna pregunta?
Recomendar


26 diapositivas
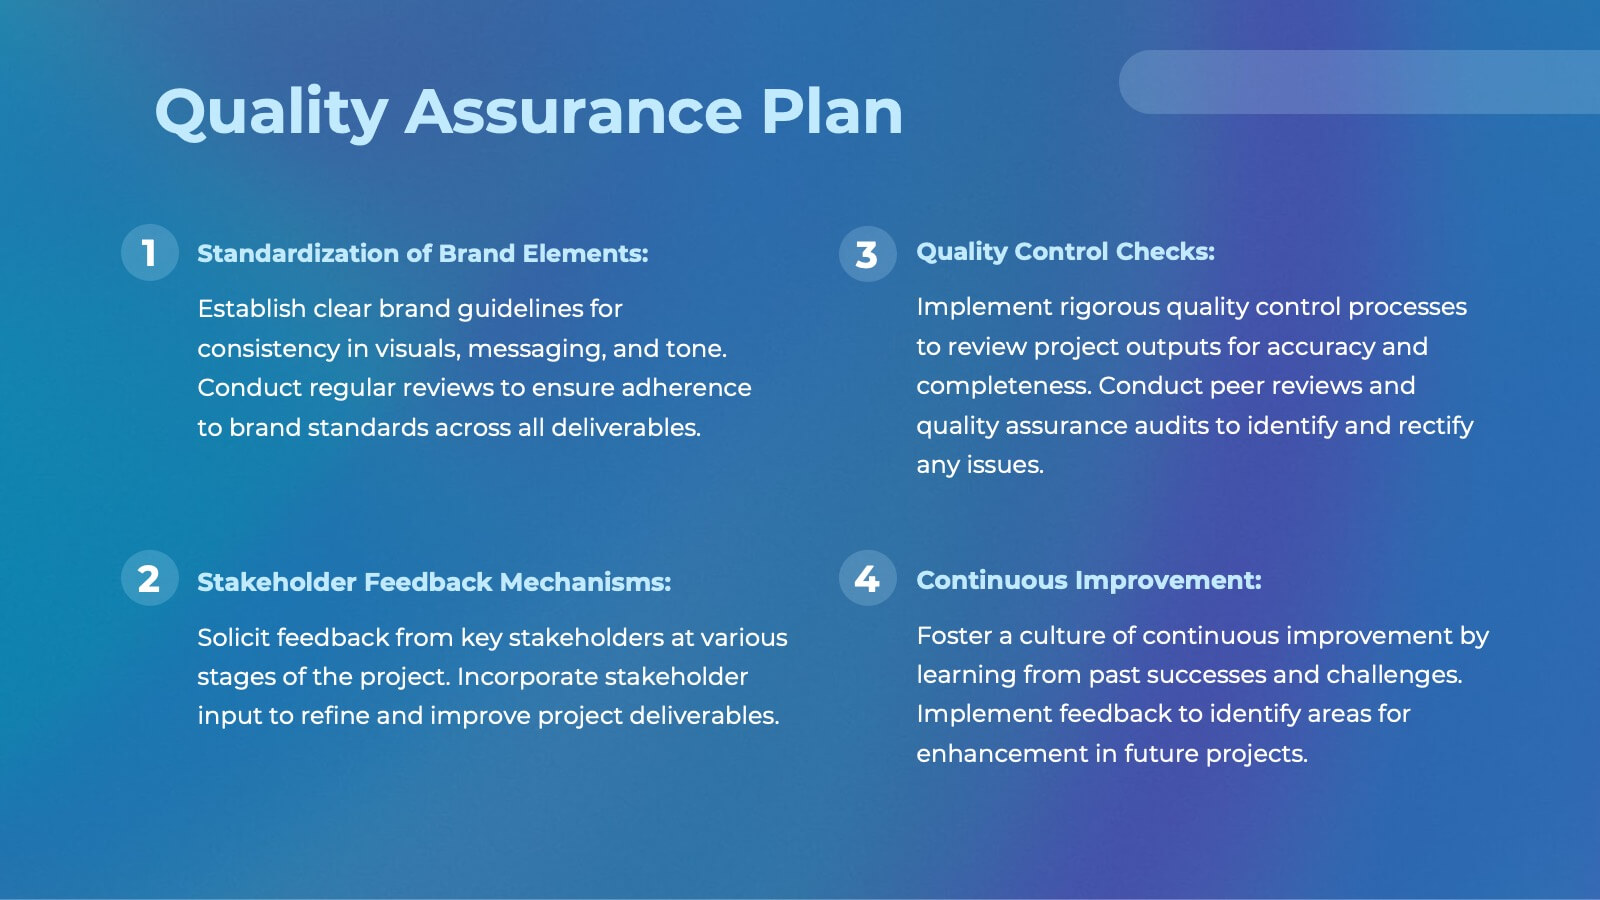
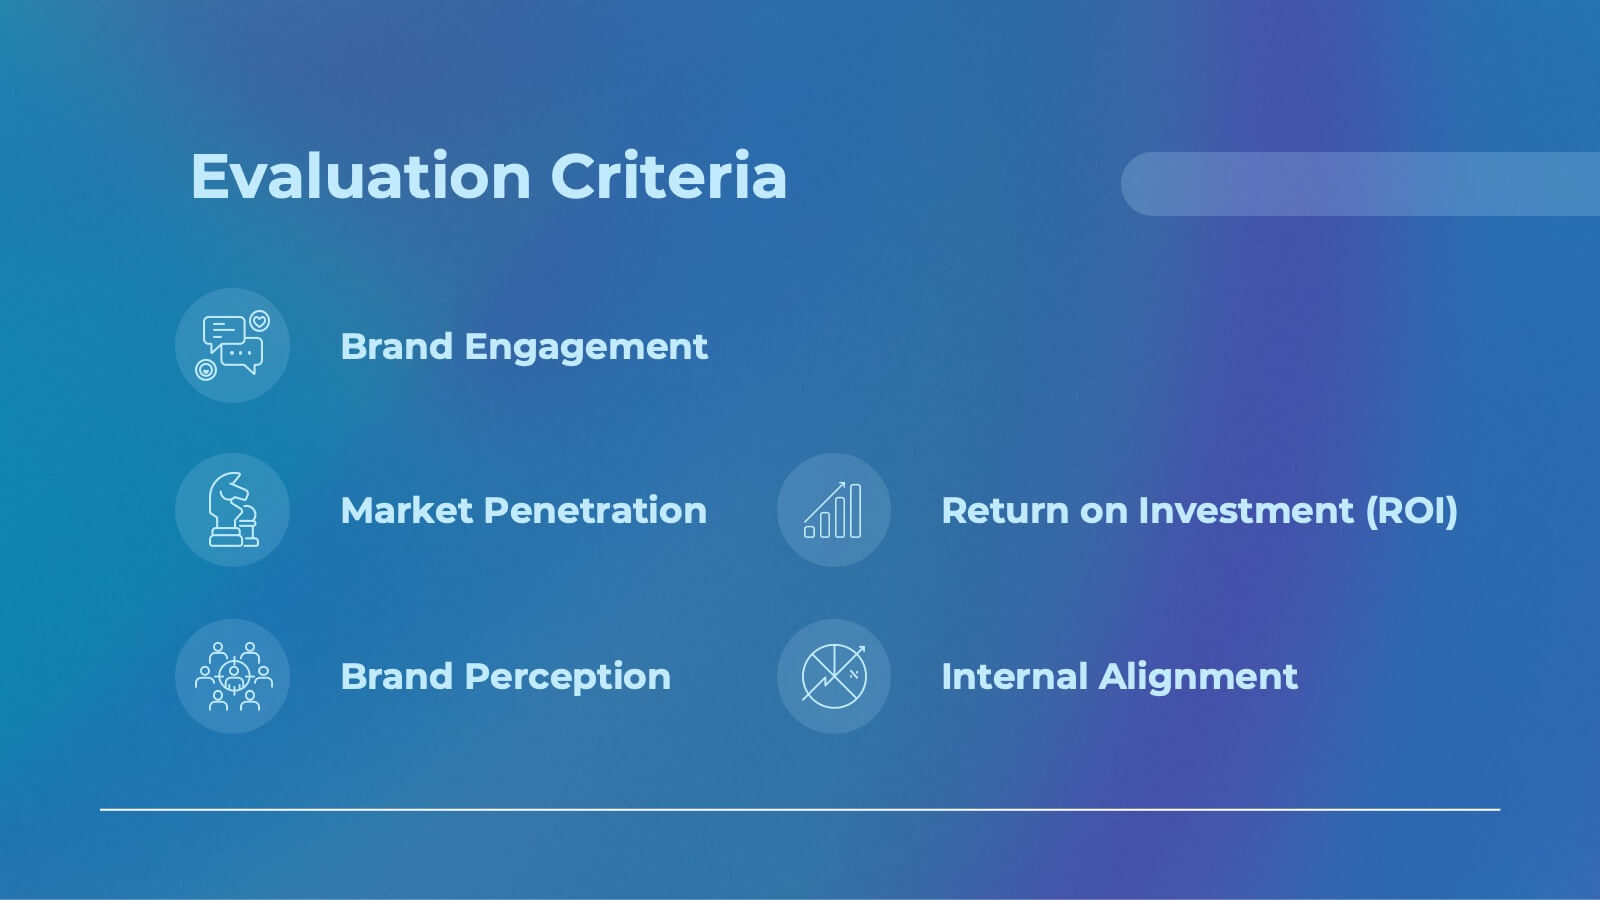
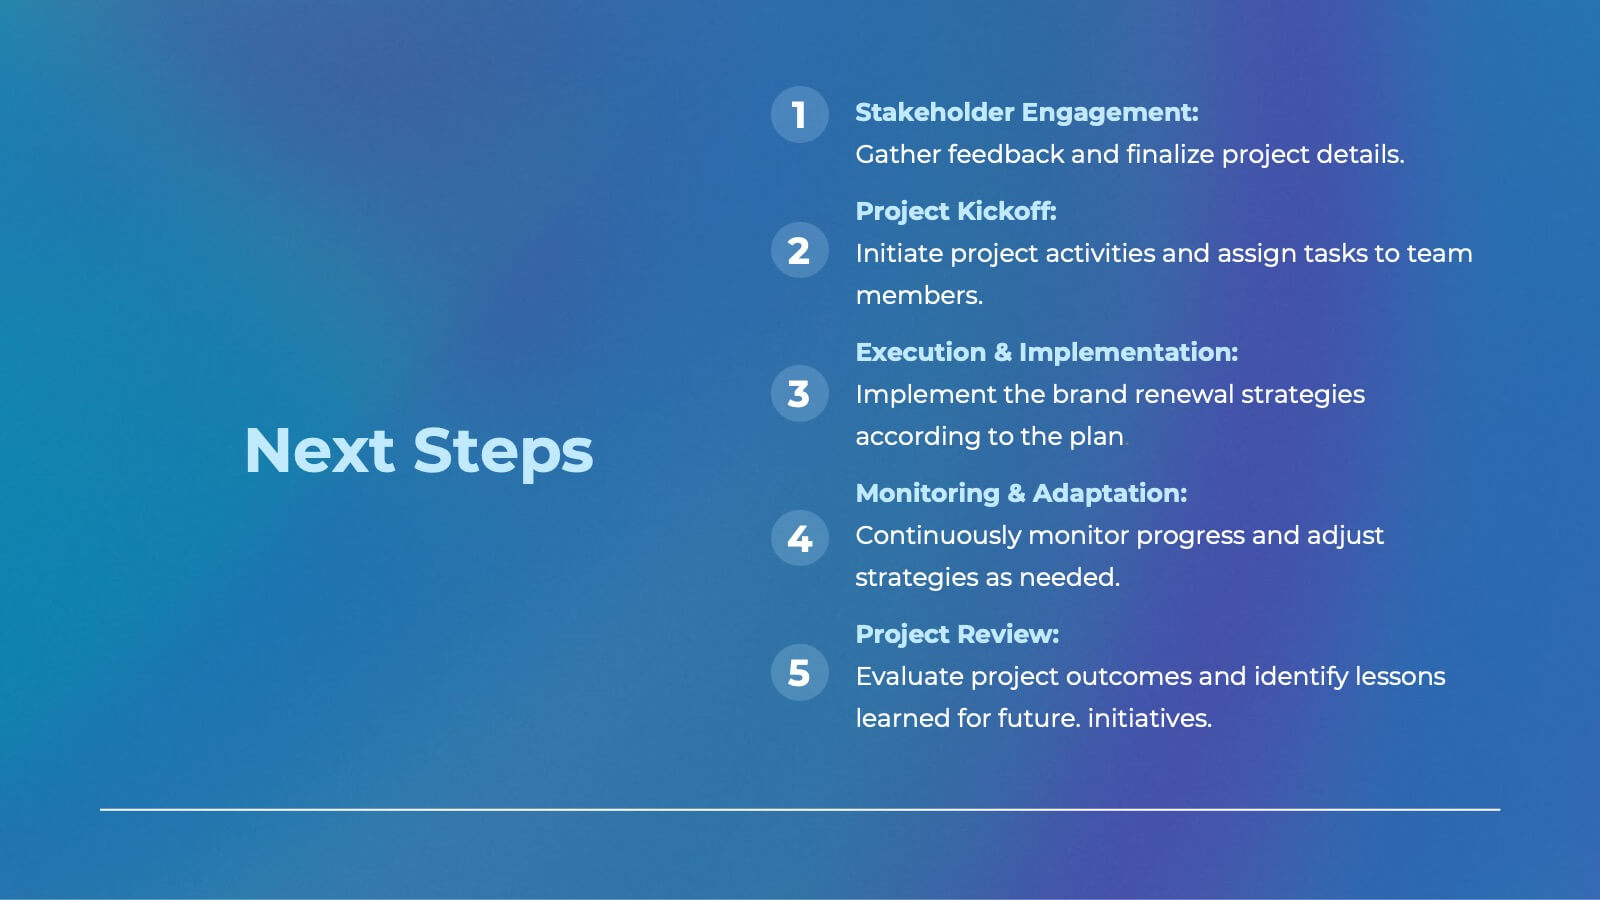
Dante Presentation Template
Featuring our new Dante Sportswear template this is a great way to present your products and ideas in an attractive, easy-to-read and easily understanding presentation. It includes all the elements you need to create a marketing presentation with style that will stand out. This template has plenty of space for displaying statistics and other data with images that complement your product/service information. You can use this template for valuable sportswear content or information to educate or entertain your audience. This template is fully and easily editable in powerpoint as well!


4 diapositivas
Minimal Title Page Variations Presentation
Highlight key ideas with style using the Minimal Title Page Variations Presentation. These clean and colorful layouts feature bold numbers, pastel text boxes, and abstract 3D artwork to instantly draw attention. Perfect for agendas, summaries, or content previews. Includes multiple layout options and is fully editable in PowerPoint, Keynote, and Google Slides.


4 diapositivas
Innovative Business Solution Strategy
Present fresh, impactful ideas with this innovative business solution strategy slide. Featuring a creative lightbulb design, this template helps you showcase strategic solutions, key initiatives, or breakthrough concepts in a visually organized way. Perfect for startups, innovation workshops, and business growth meetings. Fully editable and compatible with PowerPoint, Keynote, and Google Slides.


6 diapositivas
Roles and Responsibilities for Teams Presentation
Clearly outline team functions with this roles and responsibilities presentation. Highlight up to five individual positions using intuitive icons and clean visual layouts. Perfect for onboarding, team structuring, or project assignments. Fully editable in PowerPoint, Keynote, and Google Slides—ideal for aligning expectations and improving team collaboration across departments or initiatives.


7 diapositivas
Liability Insurance Infographic
Liability insurance is a type of insurance that provides coverage and protection to individuals and businesses against the risk of being sued and held legally liable for injuries, damages, or losses caused to other individuals or entities. This template is your roadmap to understanding the vital realm of liability insurance, a shield against unexpected financial risks. Compatible with Powerpoint, Keynote, and Google Slides. It lays out the crucial aspects of liability insurance in a clear and engaging manner, ensuring you're well-equipped to protect yourself or your business.


6 diapositivas
Business People Services Infographic
"Business People Services" refers to a range of professional services and solutions offered to individuals and organizations to help them succeed in the business world. This infographic template is a visual representation of various services tailored to meet the needs of business professionals. This template aims to provide a quick overview of these services and their benefits. The purpose of this infographic is to convey important information in an engaging format. Use concise text, relevant visuals, and a logical structure to make it easy for business professionals to understand and benefit from your data presented.


21 diapositivas
Phoenix Design Portfolio Presentation
Elevate your design presentations with this stylish, contemporary template. Perfect for showcasing design portfolios, concept development, and project timelines, it features a modern layout with vibrant colors. Highlight key elements like color palettes, textures, and design processes to captivate your audience. Compatible with PowerPoint, Keynote, and Google Slides, it ensures seamless presentations on any platform.


7 diapositivas
Global Ecology Infographic
Global ecology is the scientific study of ecosystems and the relationships between organisms and their environment on a global scale. This infographic template is structured to provide a comprehensive understanding of global ecology while encouraging action to protect our planet. Fully customizable and compatible with Powerpoint, Keynote, and Google Slides. Feel free to customize, add visuals, and design as per your needs and preferences. This infographic allows you to create educational and impactful visuals that communicate the importance of preserving and nurturing our planet's delicate ecosystems.


6 diapositivas
Product and Service Options
Clearly compare your offerings with this side-by-side product vs. service infographic. Perfect for illustrating feature breakdowns, pros and cons, or key differentiators between two business models. With six customizable points and modern icons, this layout is ideal for sales decks, marketing pitches, or strategy presentations. Fully editable in PowerPoint, Keynote, and Google Slides.


6 diapositivas
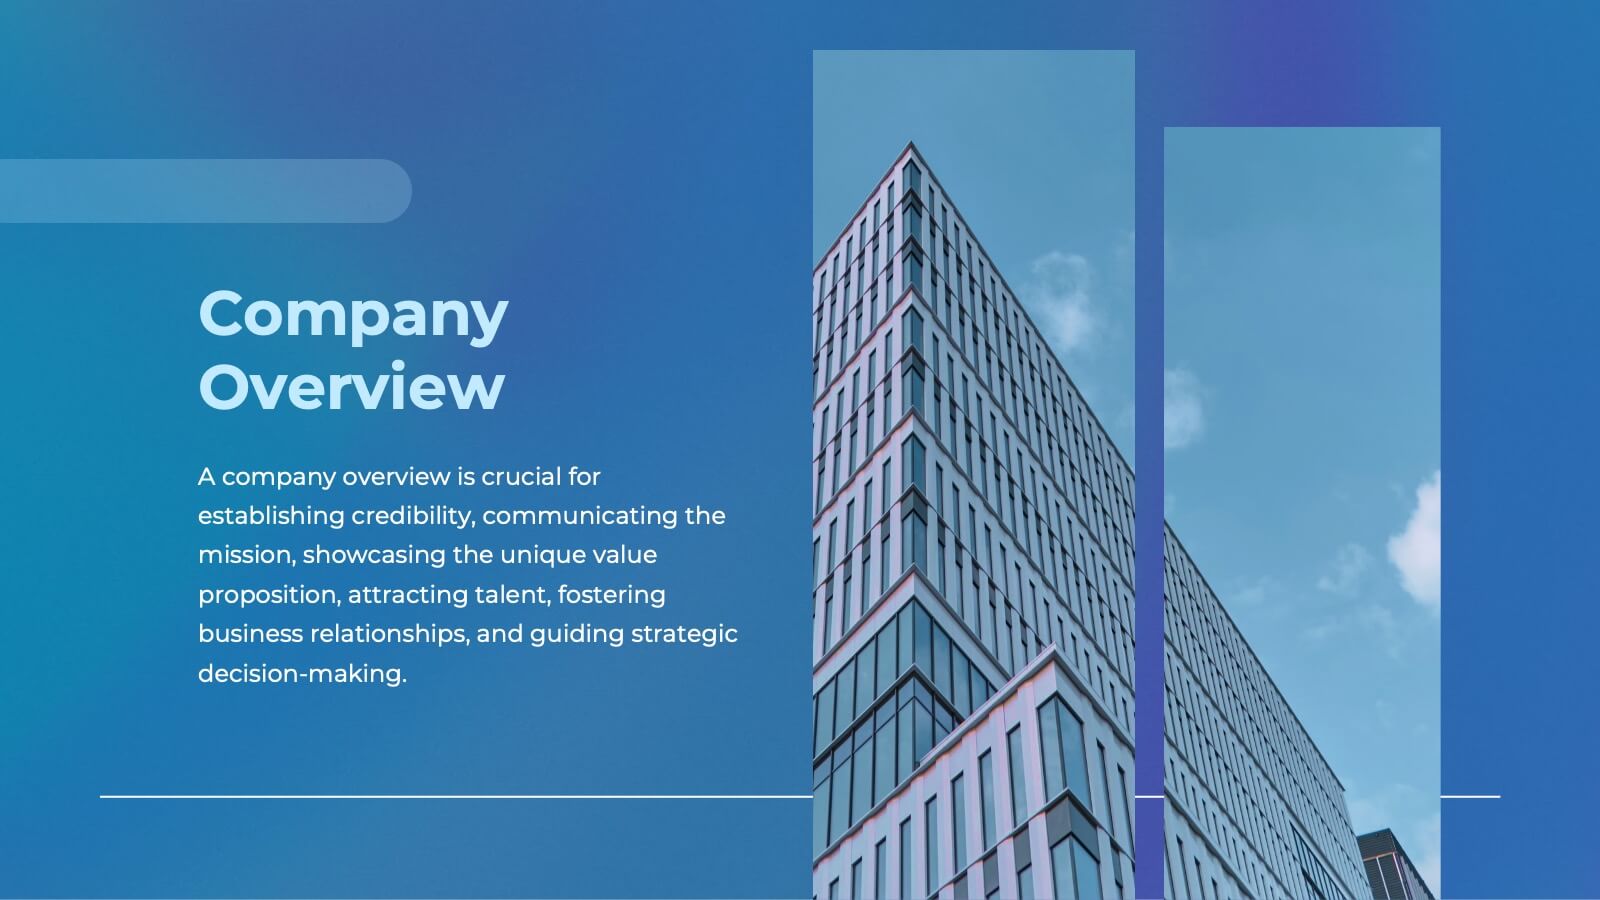
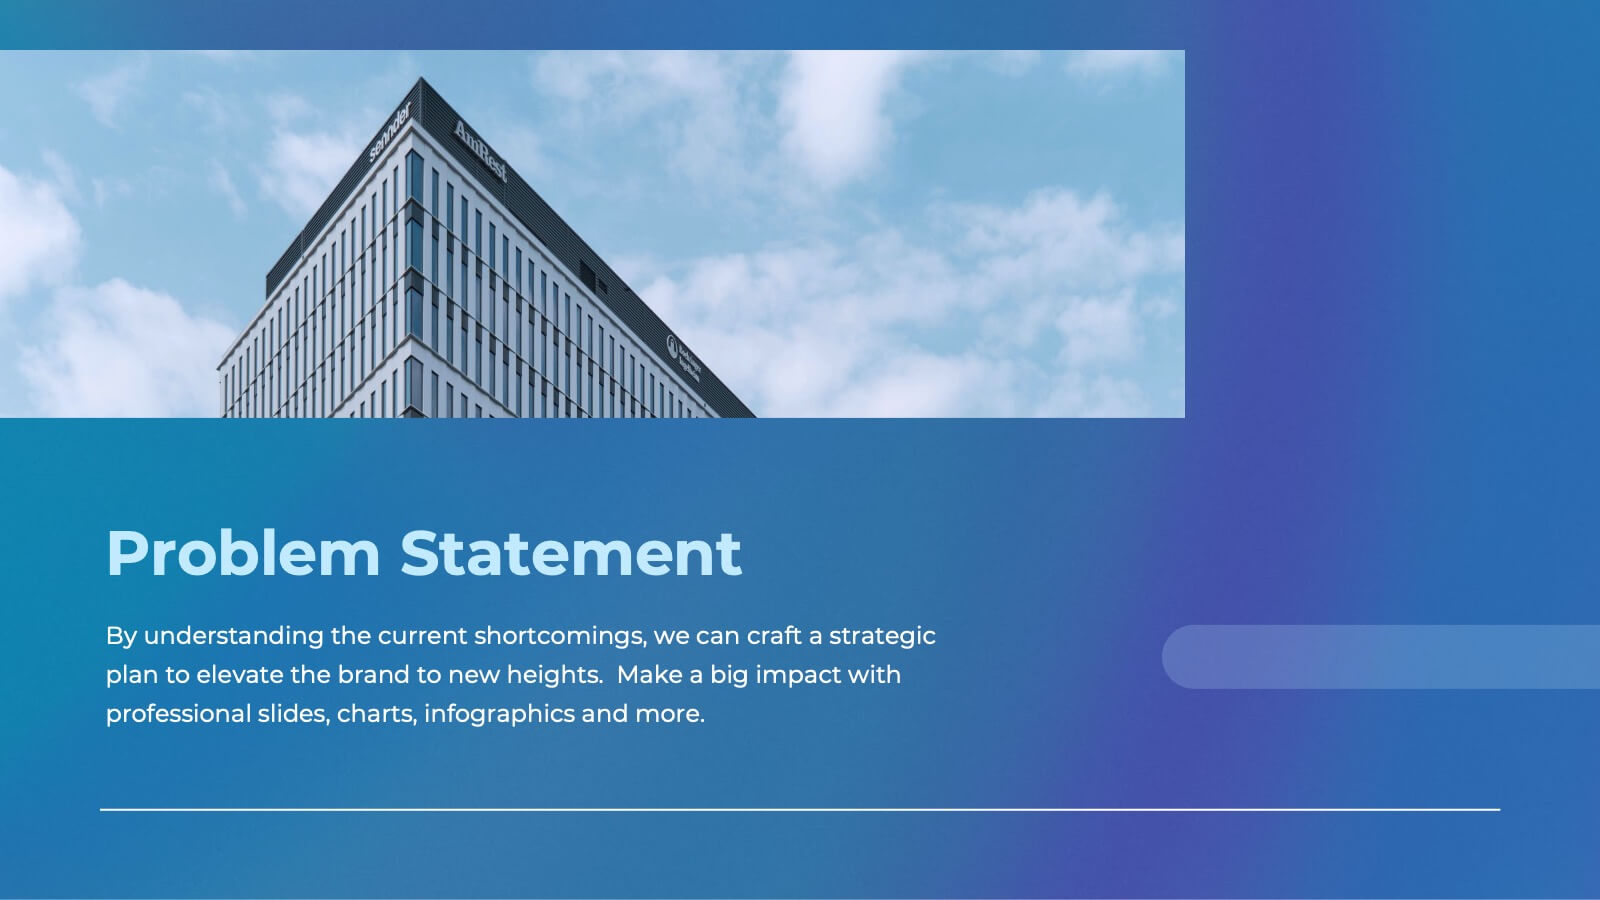
Business Project Proposal Template
Showcase your strategy with clarity and confidence using this sleek Business Project Proposal slide. Designed to highlight three core ideas or phases, it's perfect for pitching initiatives, presenting goals, or structuring deliverables. Compatible with PowerPoint, Google Slides, and Keynote for seamless editing and customization.


6 diapositivas
Business Growth with TAM SAM SOM Framework
Fuel your next big idea with a clear, structured breakdown of market potential. This easy-to-follow visual helps explain the TAM, SAM, and SOM layers of business growth—ideal for investors, strategy teams, or product managers. Fully editable in PowerPoint, Keynote, and Google Slides for fast, seamless presentation design.


4 diapositivas
Empathy Mapping for Product Development Presentation
Strengthen user understanding with the Empathy Mapping for Product Development Presentation. This template helps teams visualize what users think, feel, say, and do—essential for creating intuitive products and experiences. Ideal for design sprints, UX workshops, and product planning sessions. Fully editable in PowerPoint, Keynote, Canva, and Google Slides.


5 diapositivas
Process Improvement Infographics
Introducing our Process Improvement Infographics, these are visual representations of the steps involved in enhancing the efficiency of a process. This template is designed to help businesses identify bottlenecks and areas of improvement in their operations. These infographics consist of vertically arranged sections or columns that outline the different stages of the process improvement journey. Each section provides a brief explanation of the stage along with relevant icons, illustrations, or diagrams to enhance understanding. The layout is designed to showcase the sequential flow of activities involved in the improvement process.


7 diapositivas
Job Objective Infographic Presentation
A Job Objective is an introduction that summarizes an individual's career goals and objectives. This Template is designed to create a visual experience with a focus of solving your objectives, showcasing your expertise and individuality. Use this infographic to help you visually communicate your knowledge and skills with a powerful presentation. Highlight your experience, skills and key achievements. You can edit the graphics, photos, data and text in this template so that it fits your needs perfectly. All you have to do is just download this template in PowerPoint, Keynote, or Google Slides.


10 diapositivas
SWOT-Based Competitive Analysis Presentation
Identify your competitive edge with a clear, structured approach! This SWOT-based analysis template helps businesses assess strengths, weaknesses, opportunities, and threats in a visually engaging format. Perfect for strategic planning, it ensures clarity and impact in every presentation. Fully customizable and compatible with PowerPoint, Keynote, and Google Slides.


21 diapositivas
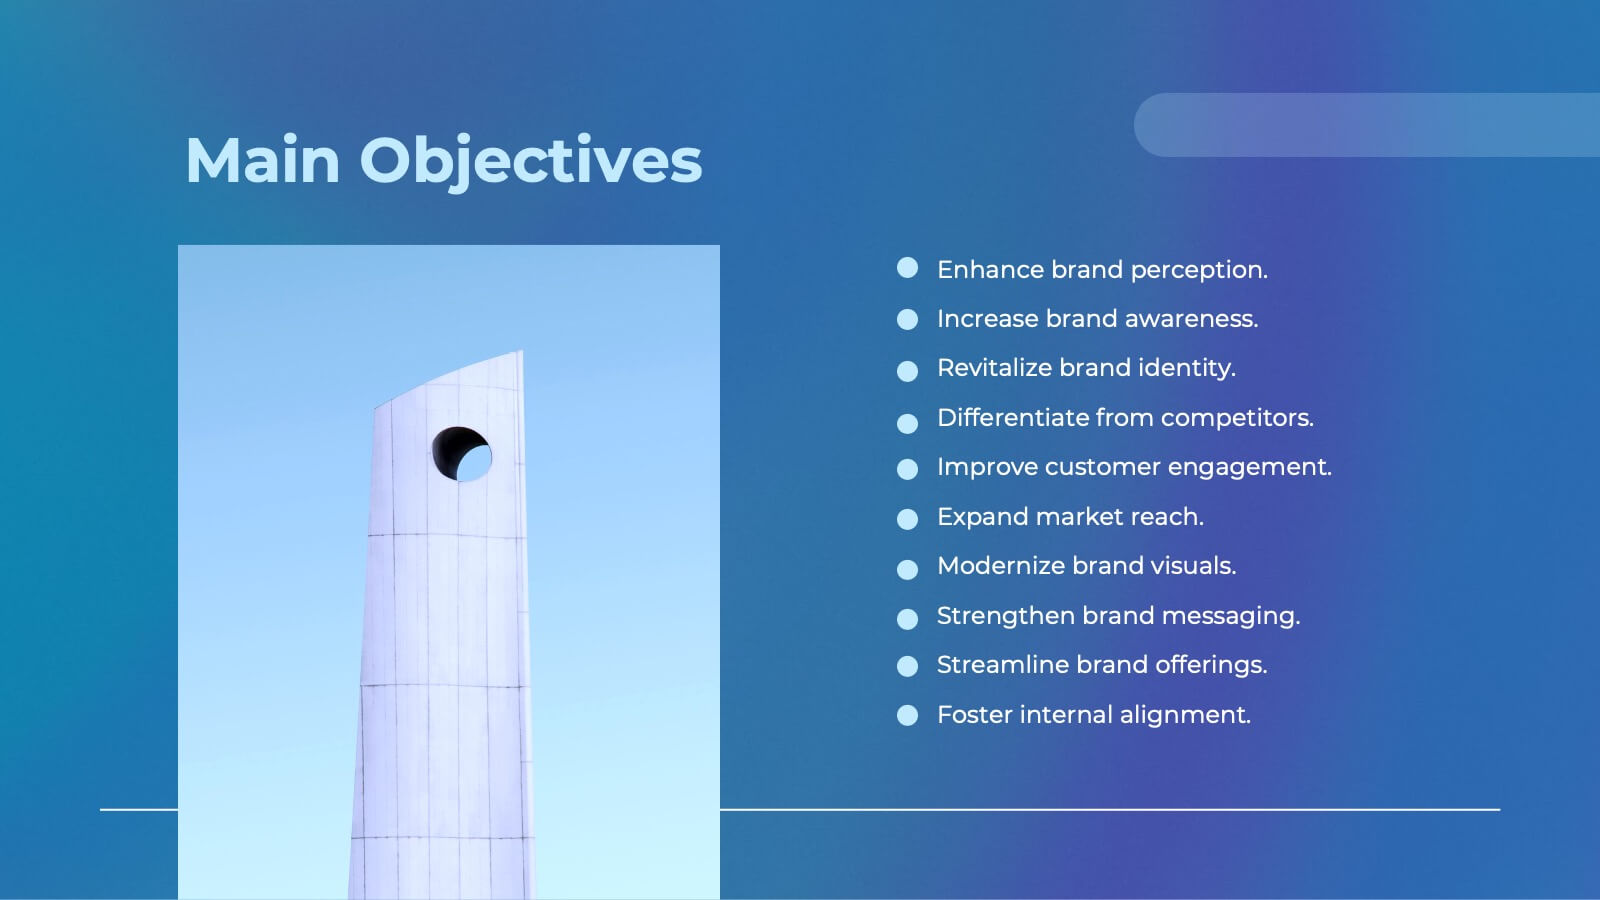
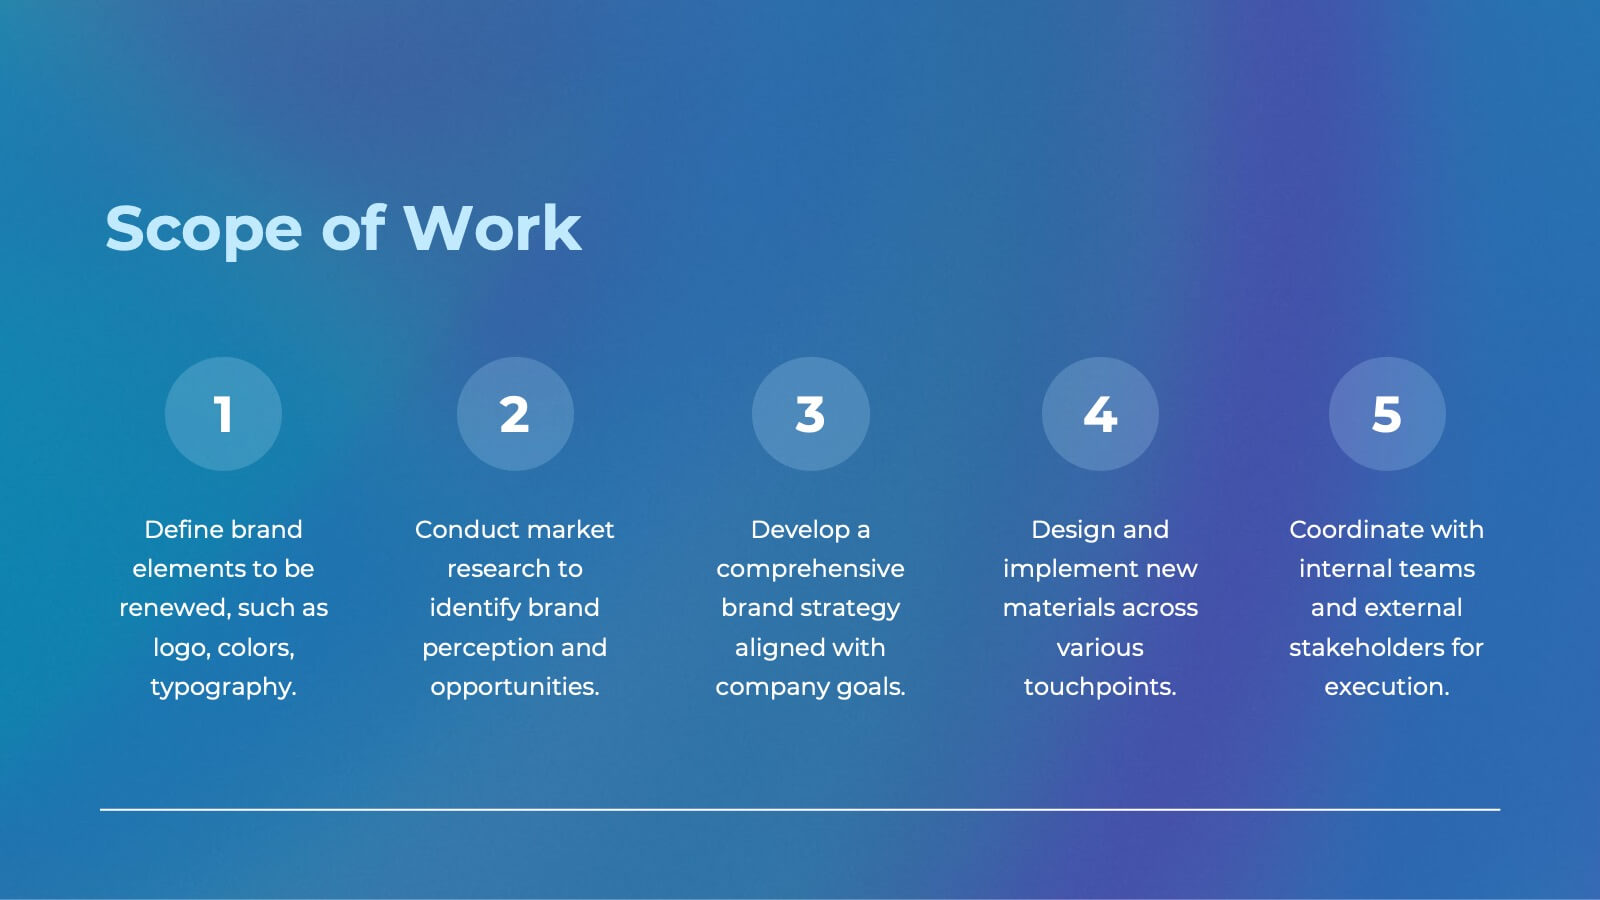
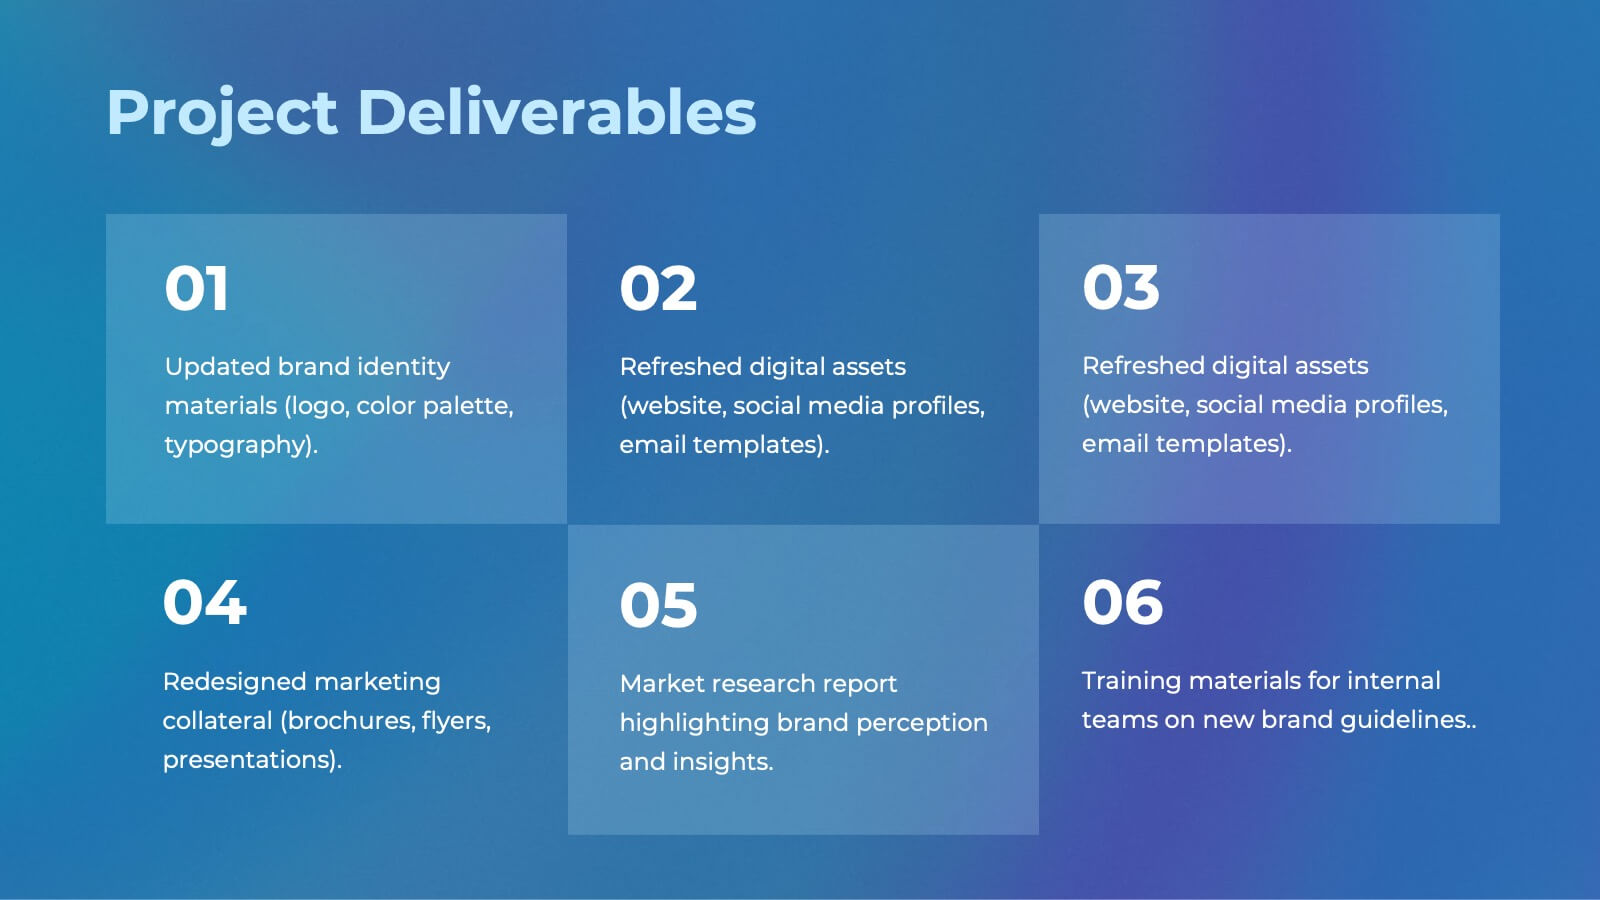
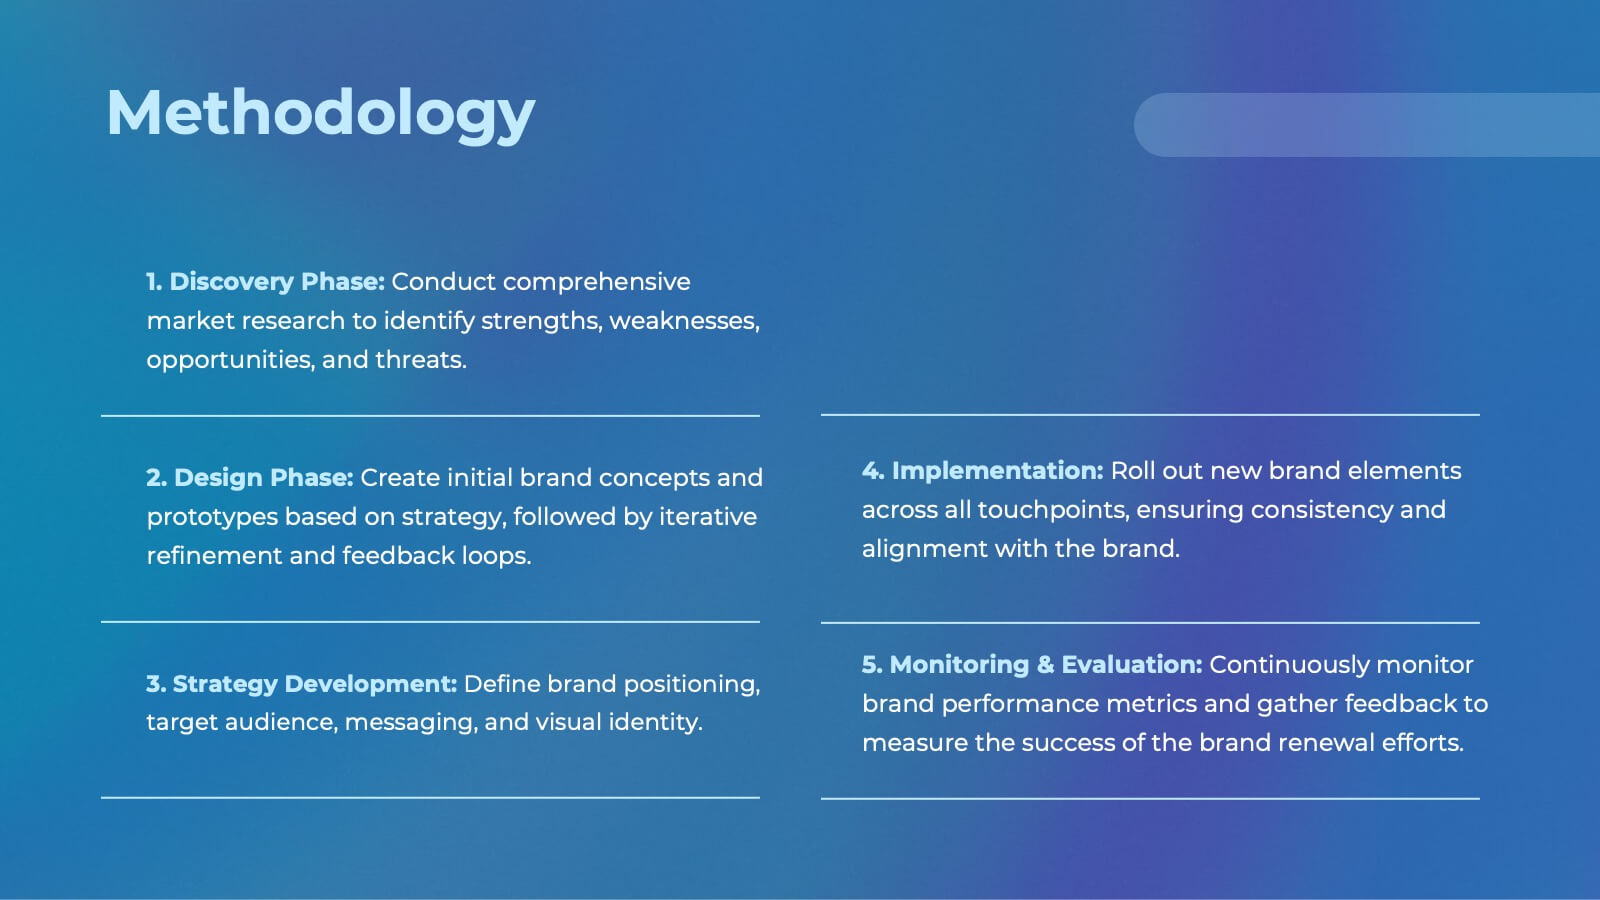
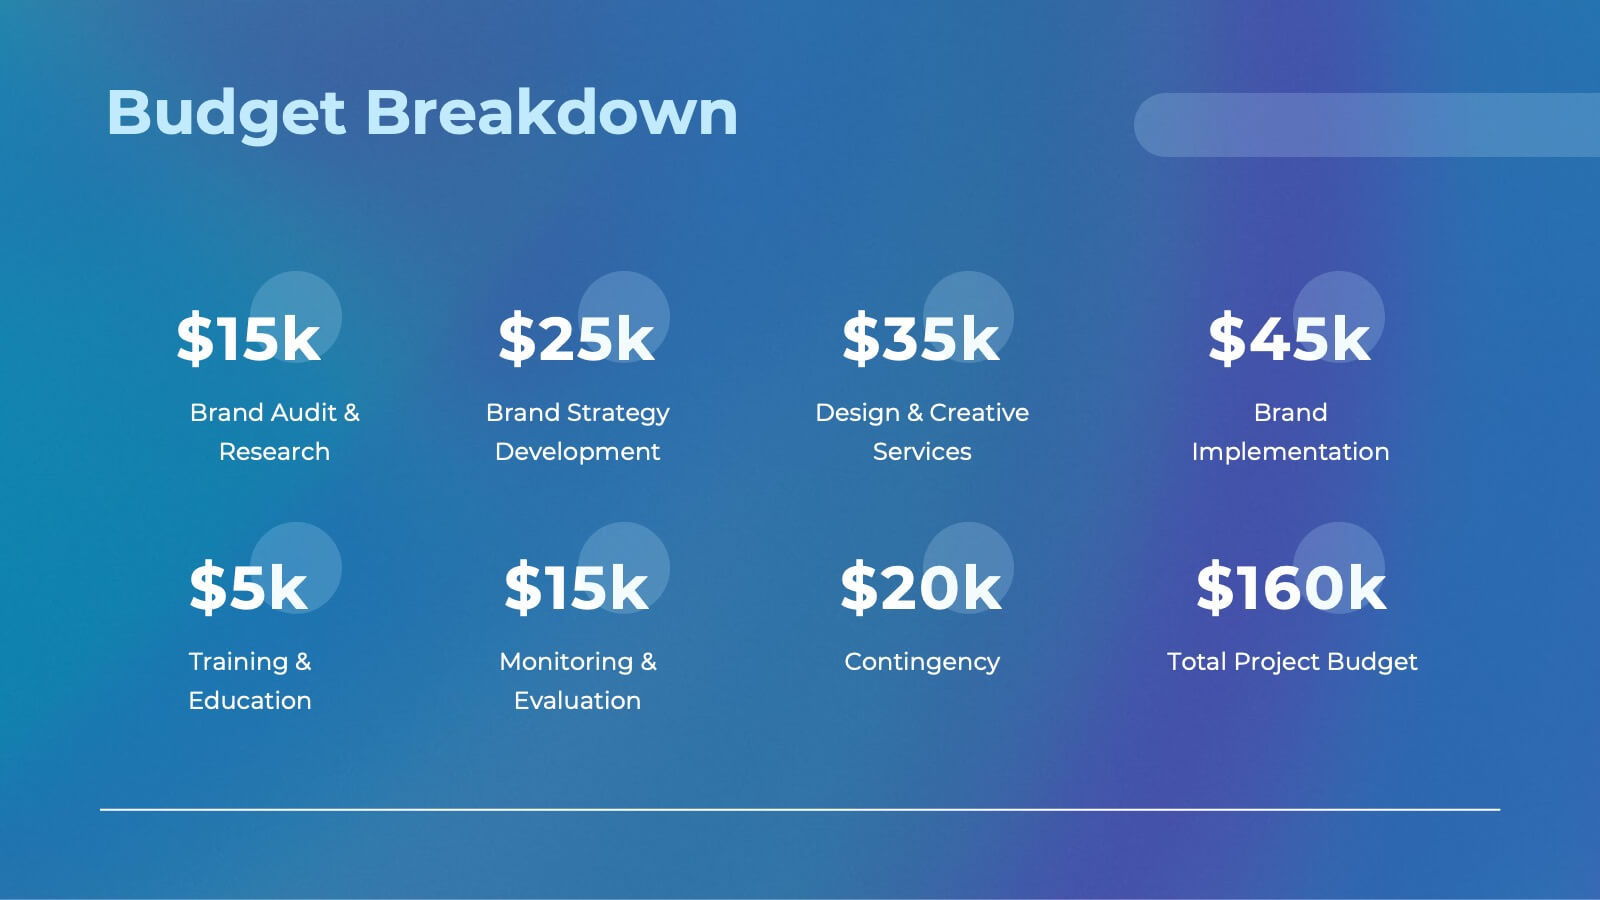
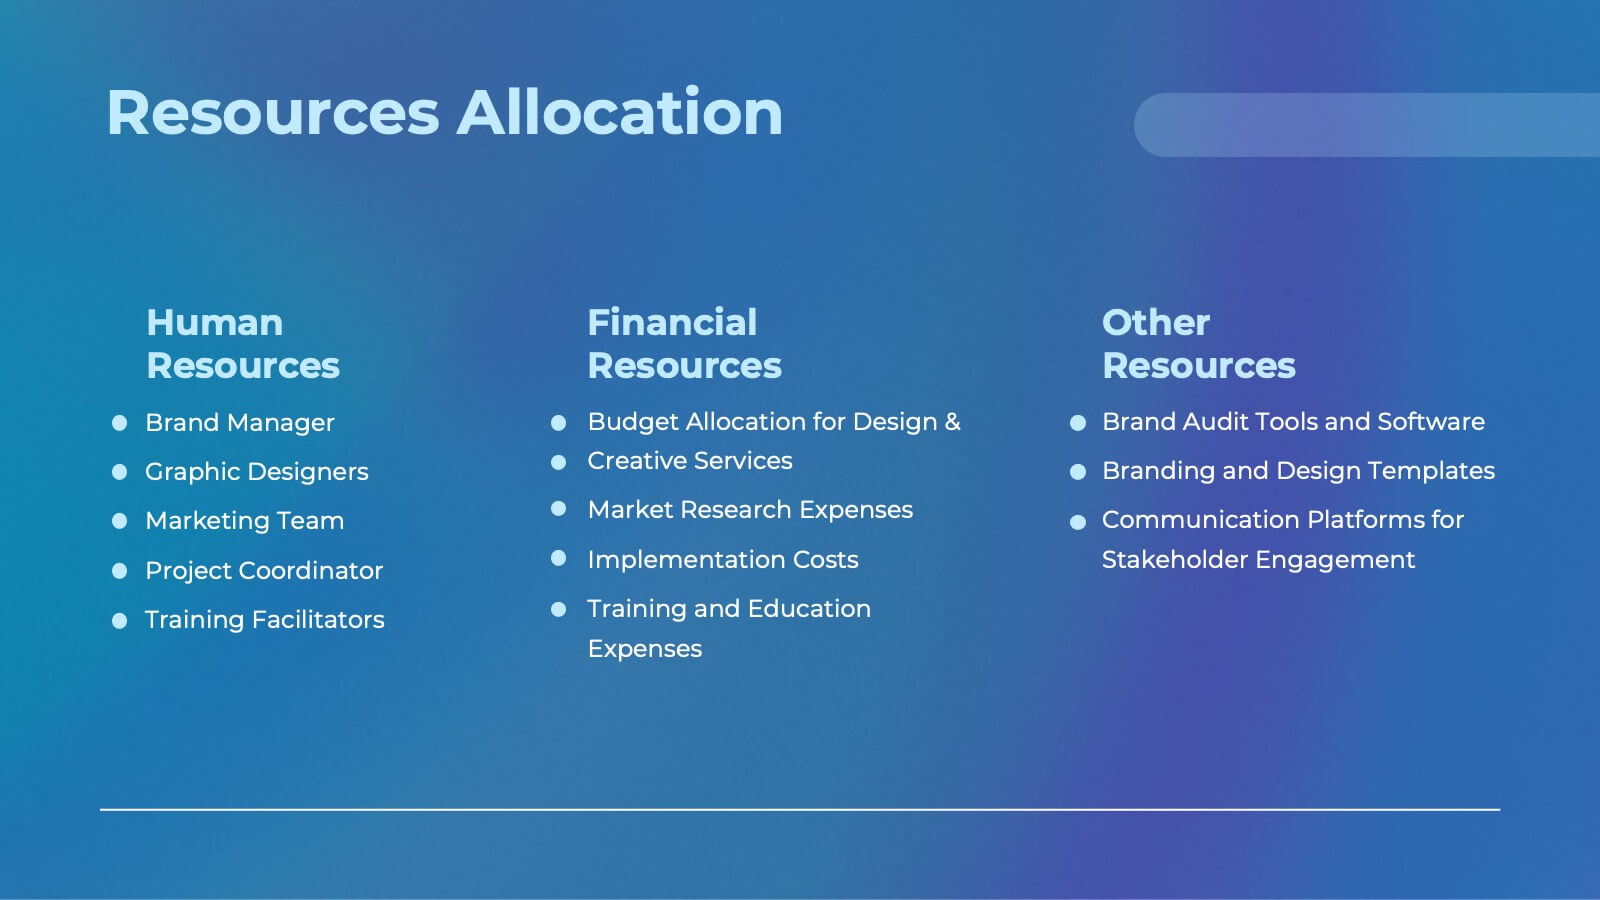
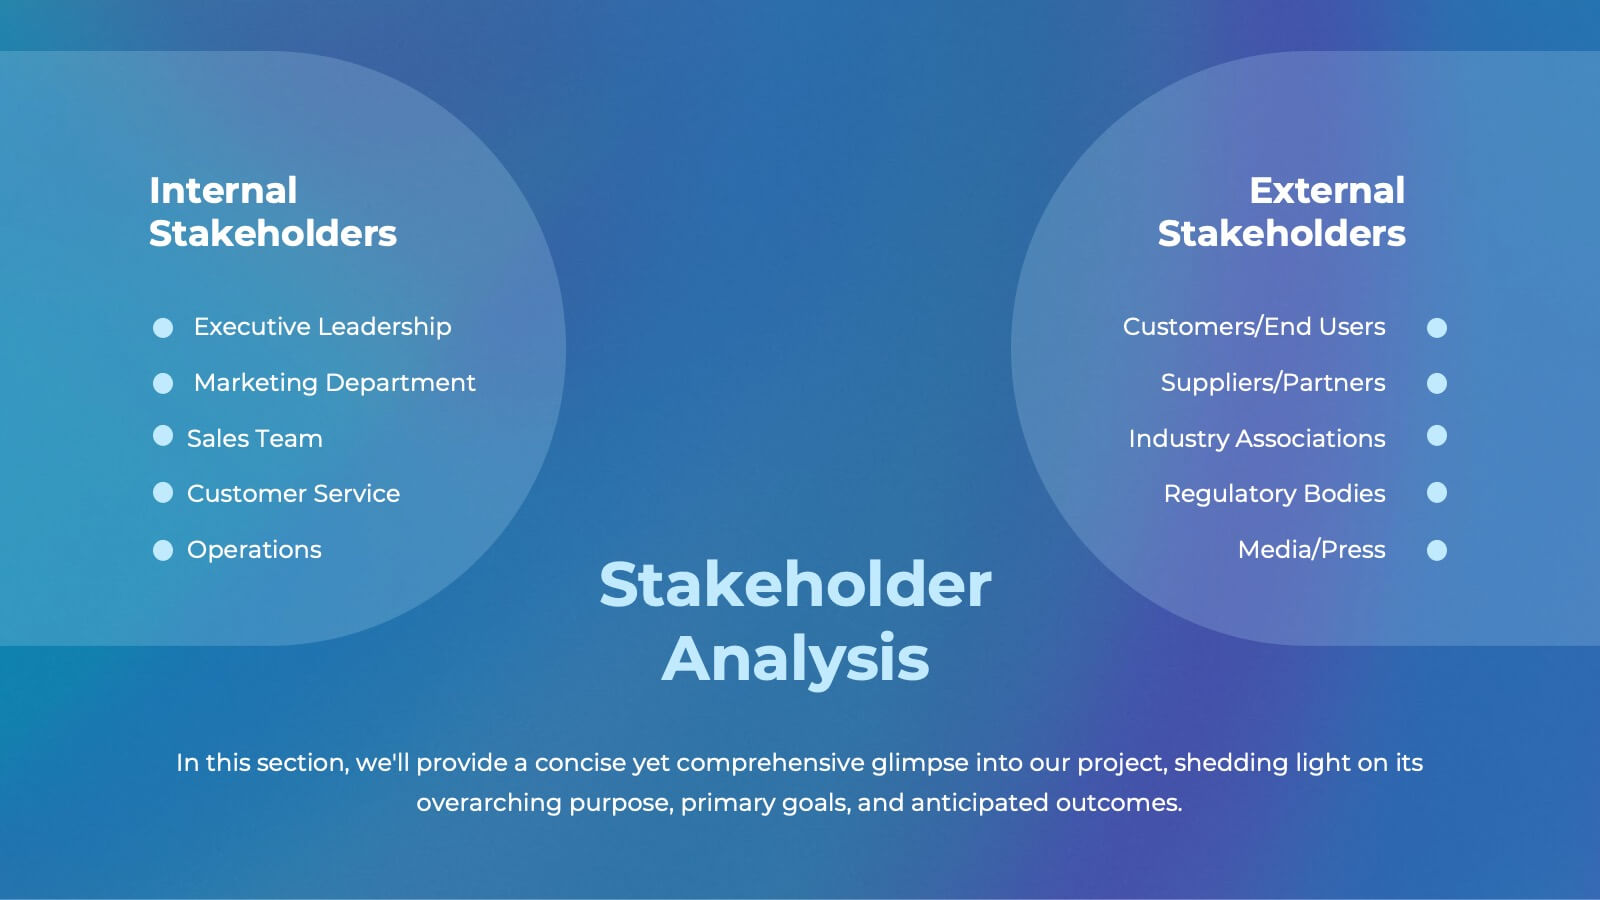
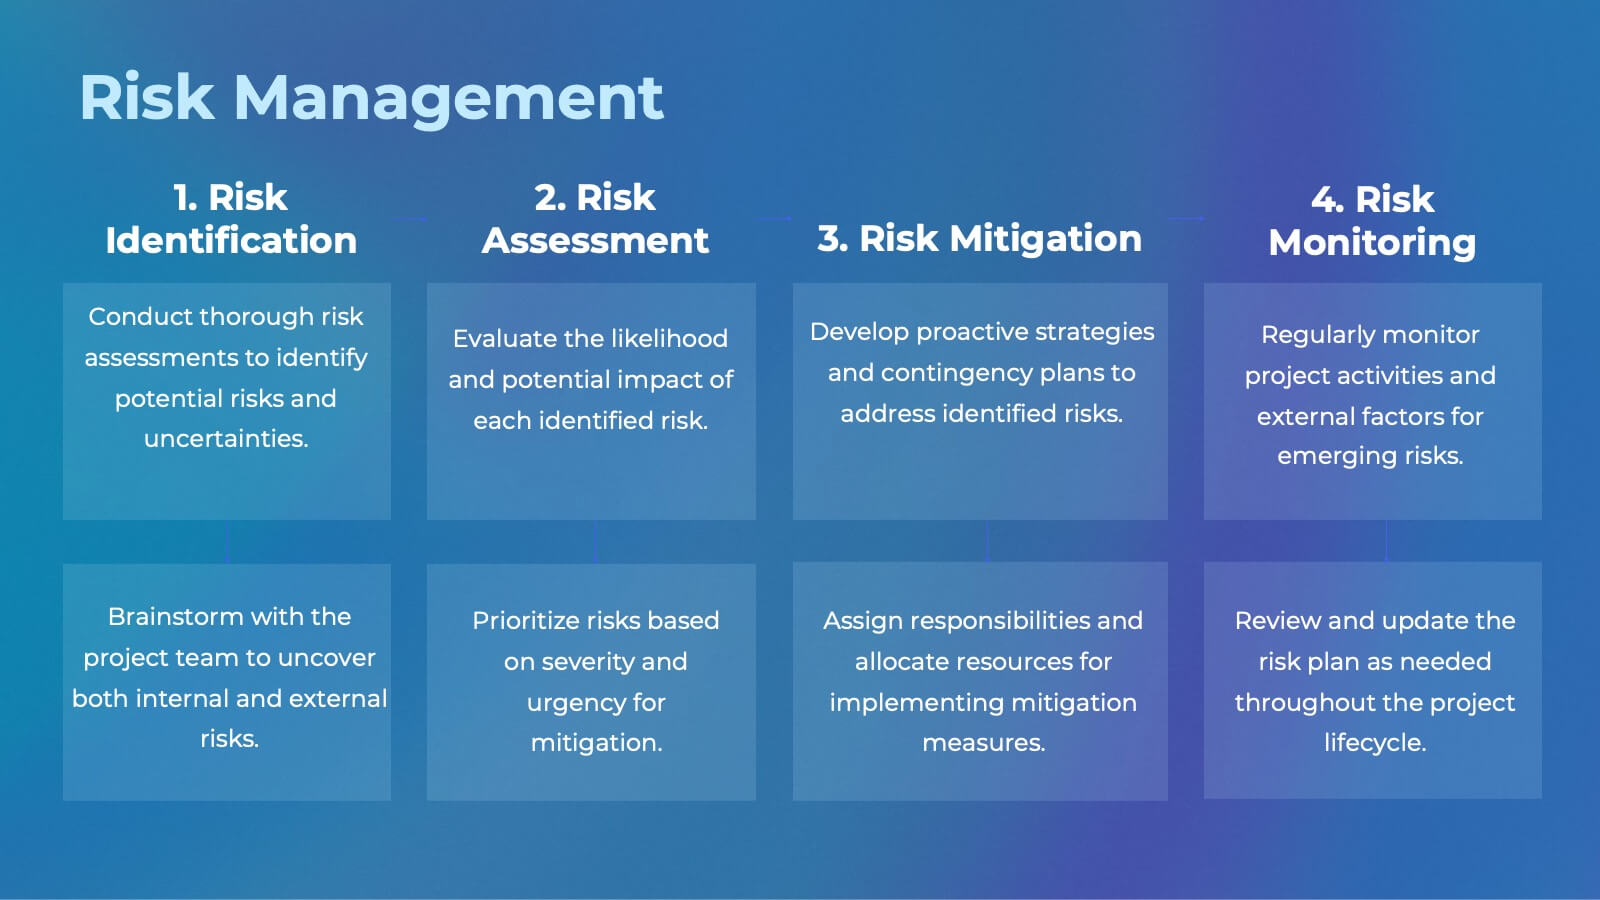
Ember Agile Project Plan Presentation
Ready to ace your next project proposal? This sleek presentation template is perfect for outlining objectives, timelines, and budgets. Designed for professionals aiming to impress stakeholders and secure approvals. Compatible with PowerPoint, Keynote, and Google Slides, it ensures a smooth and professional presentation every time. Ideal for project managers and business leaders.


7 diapositivas
Vacations Travel Infographic
Are you ready to embark on a journey around the world? Our Vacations Travel Infographic is your ultimate guide to thrilling destinations, exotic experiences, and memorable adventures. Whether you're a passionate traveler seeking new horizons or an explorer at heart, this infographic is designed to ignite your wanderlust and set your vacation dreams on fire. Compatible with Powerpoint, Keynote, and Google Slides. Dive into the world of travel with this vivid infographic that sparks excitement and eagerness to discover what lies beyond. This template is not just a visual delight, it's a roadmap to your dream vacation!