


Características


¿Tienes alguna pregunta?
Recomendar


6 diapositivas
Weekly Project Status Update Presentation
Keep your team aligned and your goals on track with this clear, structured layout designed to summarize weekly progress, milestones, and deliverables. Perfect for project managers and team leads, it turns updates into visuals that are easy to follow. Fully compatible with PowerPoint, Keynote, and Google Slides for smooth customization.


6 diapositivas
RACI Matrix Chart Infographic
The RACI matrix is a project management tool used to define roles and responsibilities for tasks and activities within a project. This infographic template is designed to clarify the roles and responsibilities of team members in a project or process. RACI stands for Responsible, Accountable, Consulted, and Informed, and the matrix helps define each team member's involvement in different tasks or activities. This includes a step-by-step guide on how to create a RACI matrix, including identifying tasks, defining roles, and assigning responsibilities. This will simplify your audience's understanding of the RACI matrix chart.


4 diapositivas
Collaborative Team Workflow Presentation
Visualize seamless collaboration with the Collaborative Team Workflow Presentation. This slide design features team icons, branching layouts, and a clean structure to showcase group dynamics and process flow. Perfect for teamwork strategies, HR initiatives, or cross-functional planning. Fully editable in PowerPoint, Keynote, and Google Slides for tailored communication.


7 diapositivas
Target Market Advertising Infographic
Target market advertising, also known as target advertising or target marketing, is a strategy in marketing and advertising where promotional efforts are directed towards a specific and well-defined group of consumers who are most likely to be interested in a product or service. The goal of this infographic template is to tailor marketing messages and campaigns to resonate with the characteristics and preferences of your specific audience, thus increasing the effectiveness and efficiency of the marketing efforts. Fully customize the content, to educate about targeting the right audience for advertising presentations.


21 diapositivas
Tourmaline Project Proposal Presentation
This sleek design proposal template covers all essential sections like project summary, objectives, goals, and deliverables. With a modern and professional layout, it's perfect for presenting solutions and methodologies. Compatible with PowerPoint, Keynote, and Google Slides, it’s designed to impress clients and stakeholders with clear, structured information.


26 diapositivas
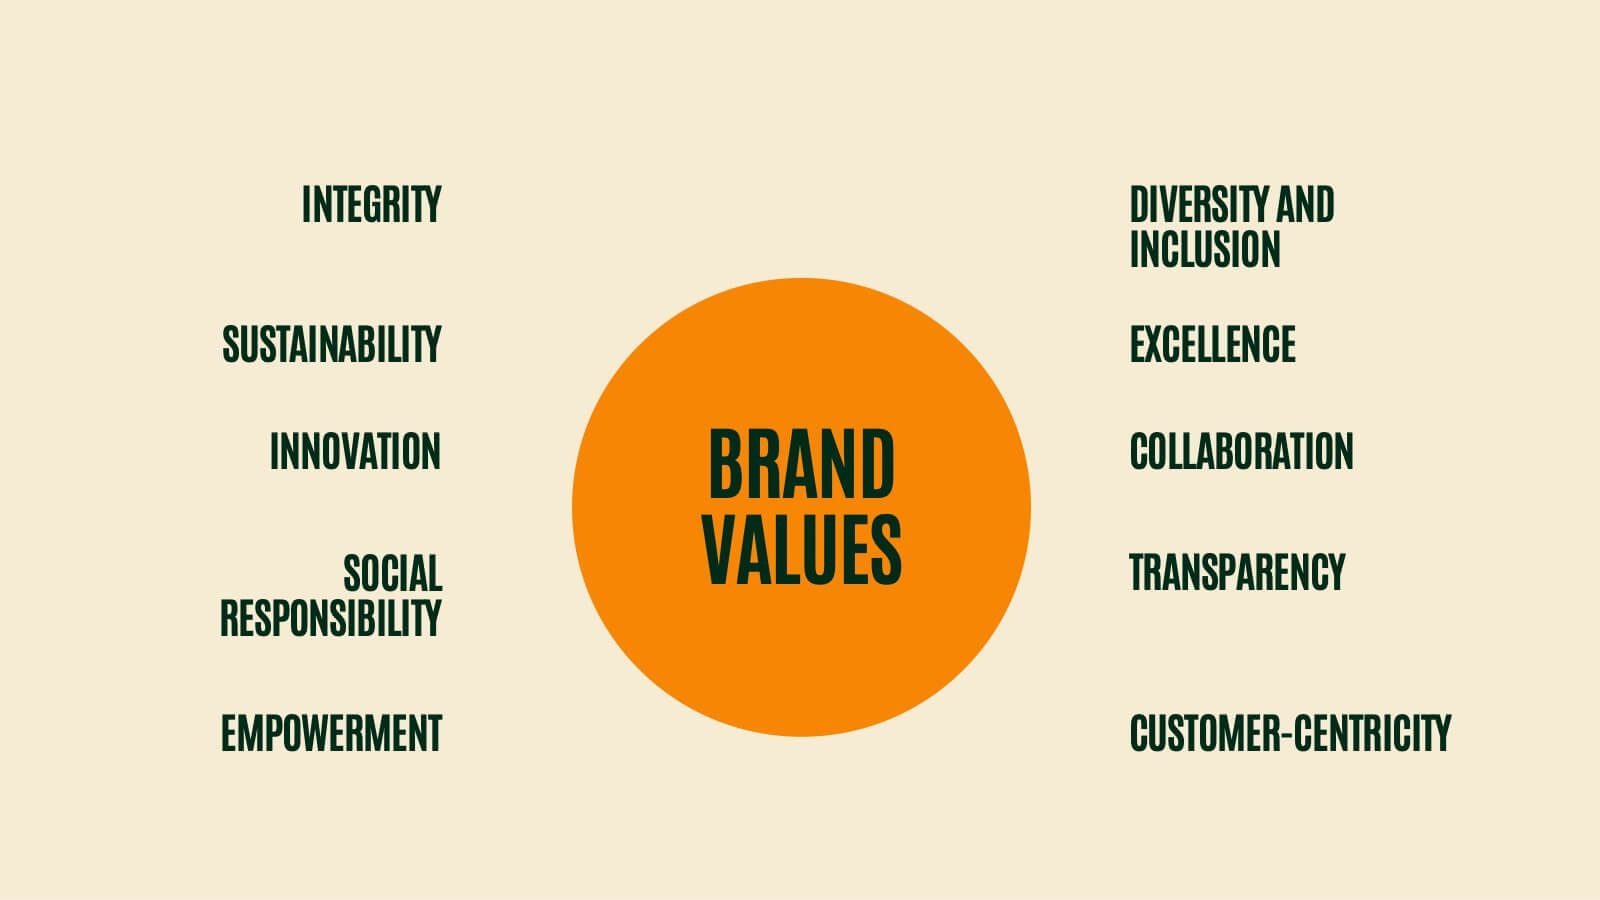
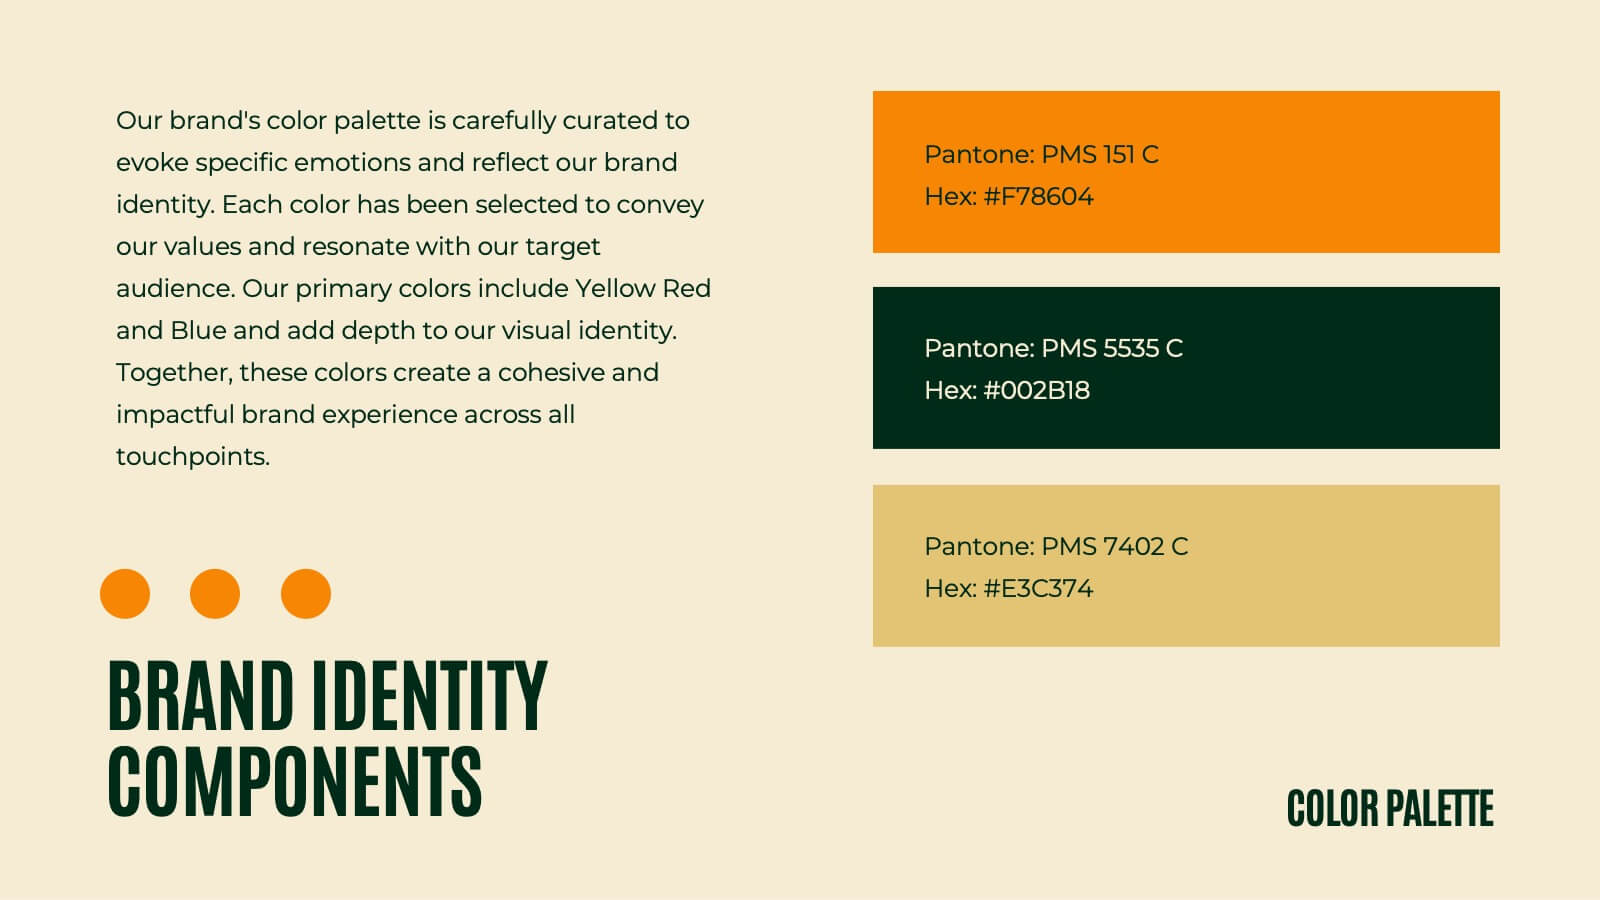
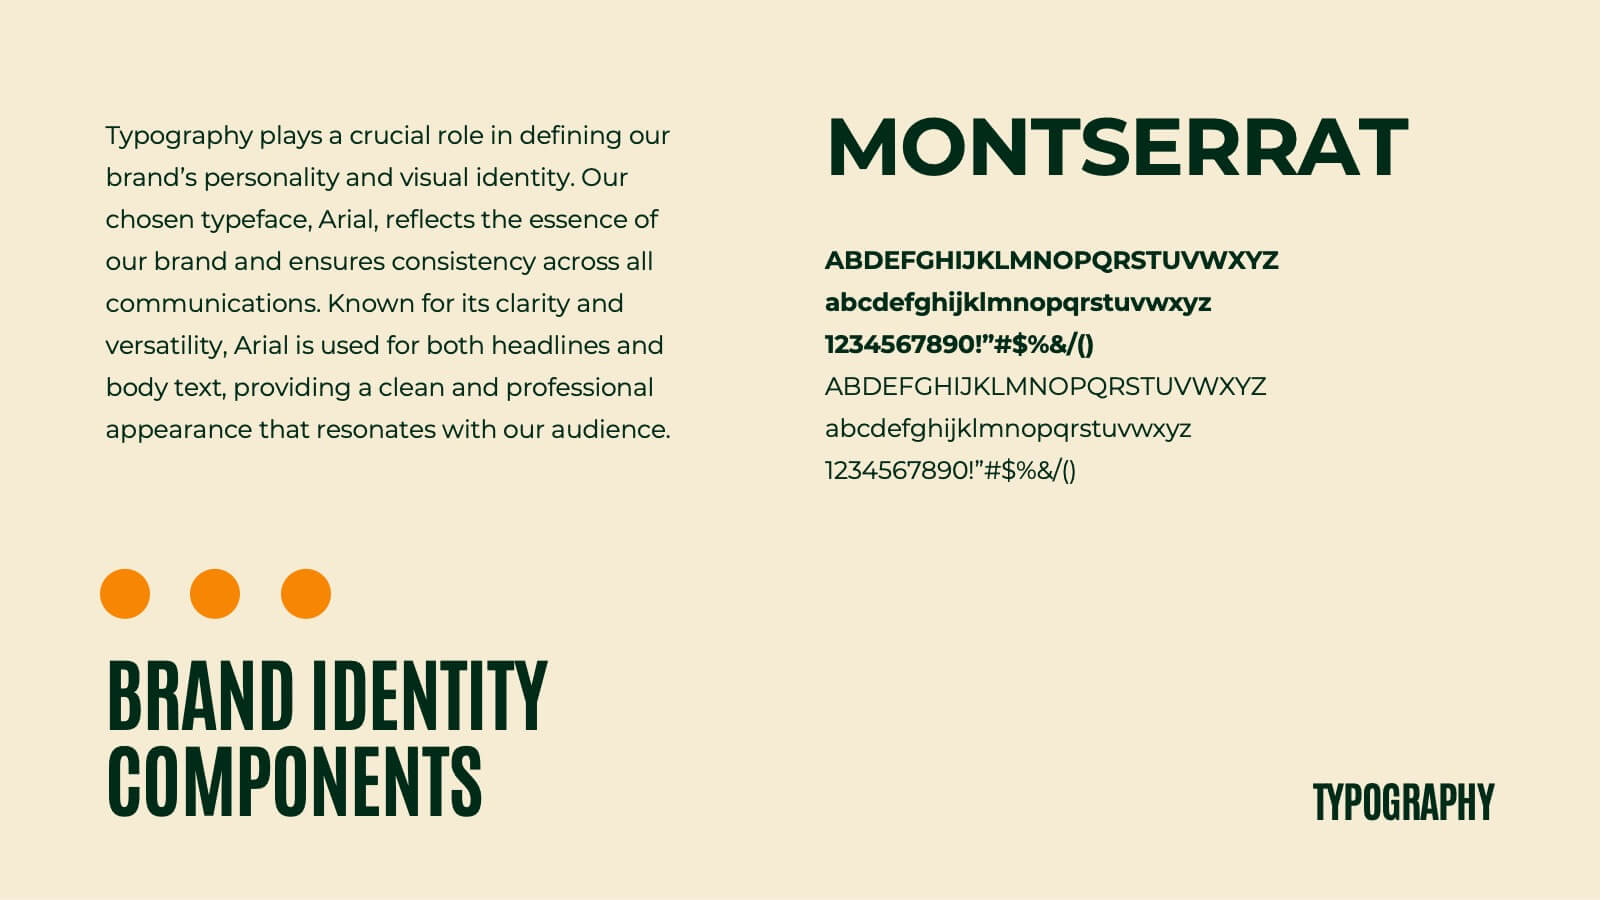
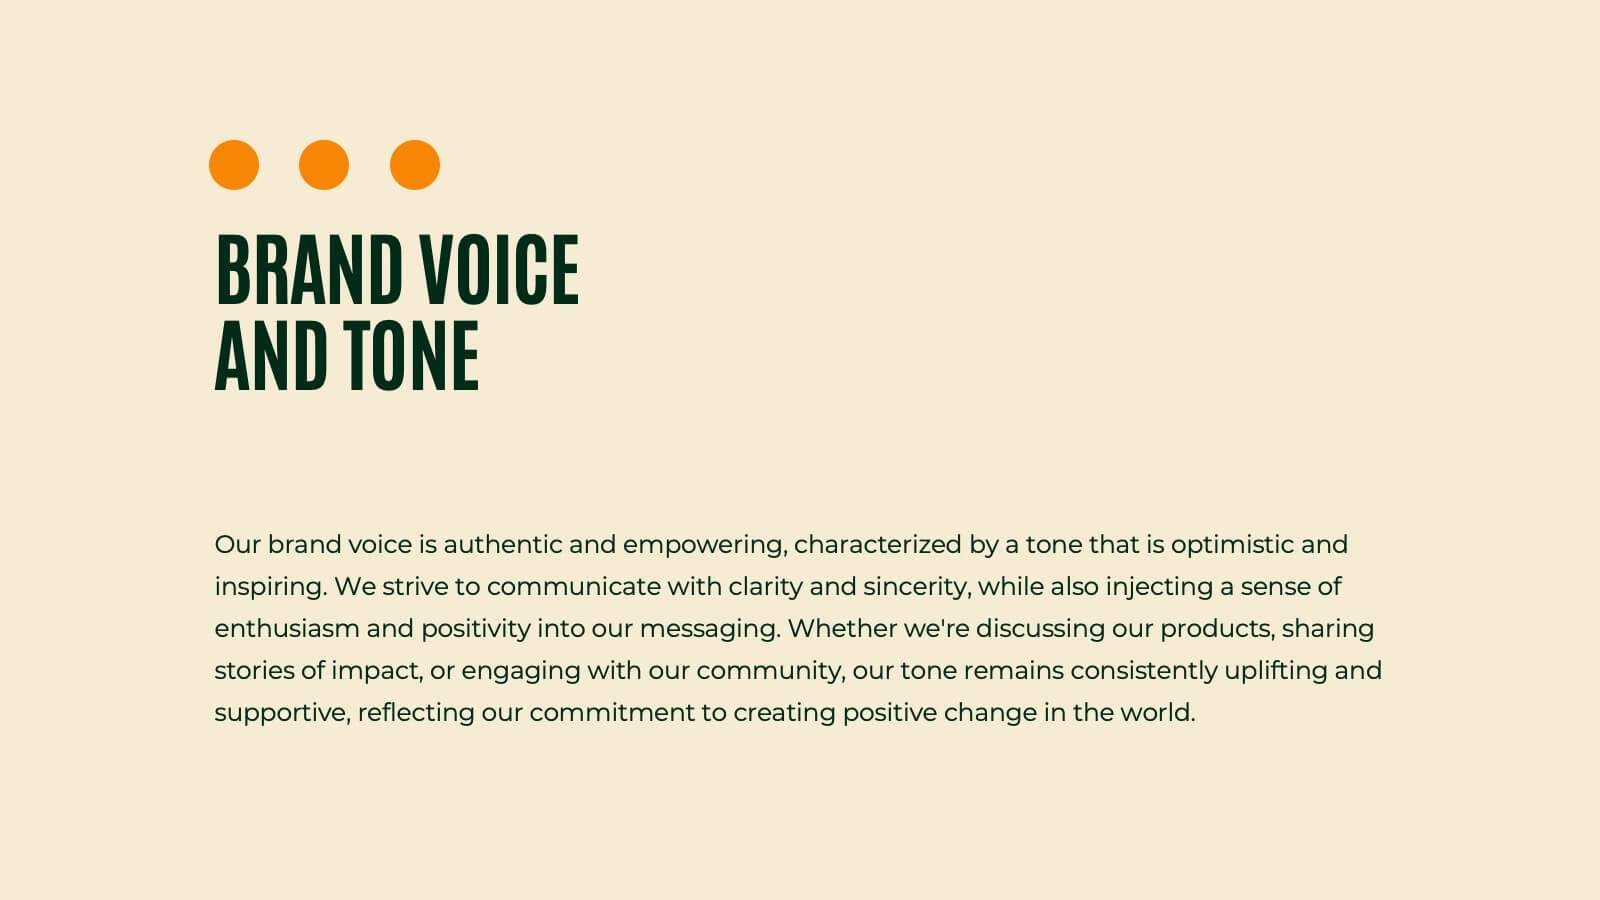
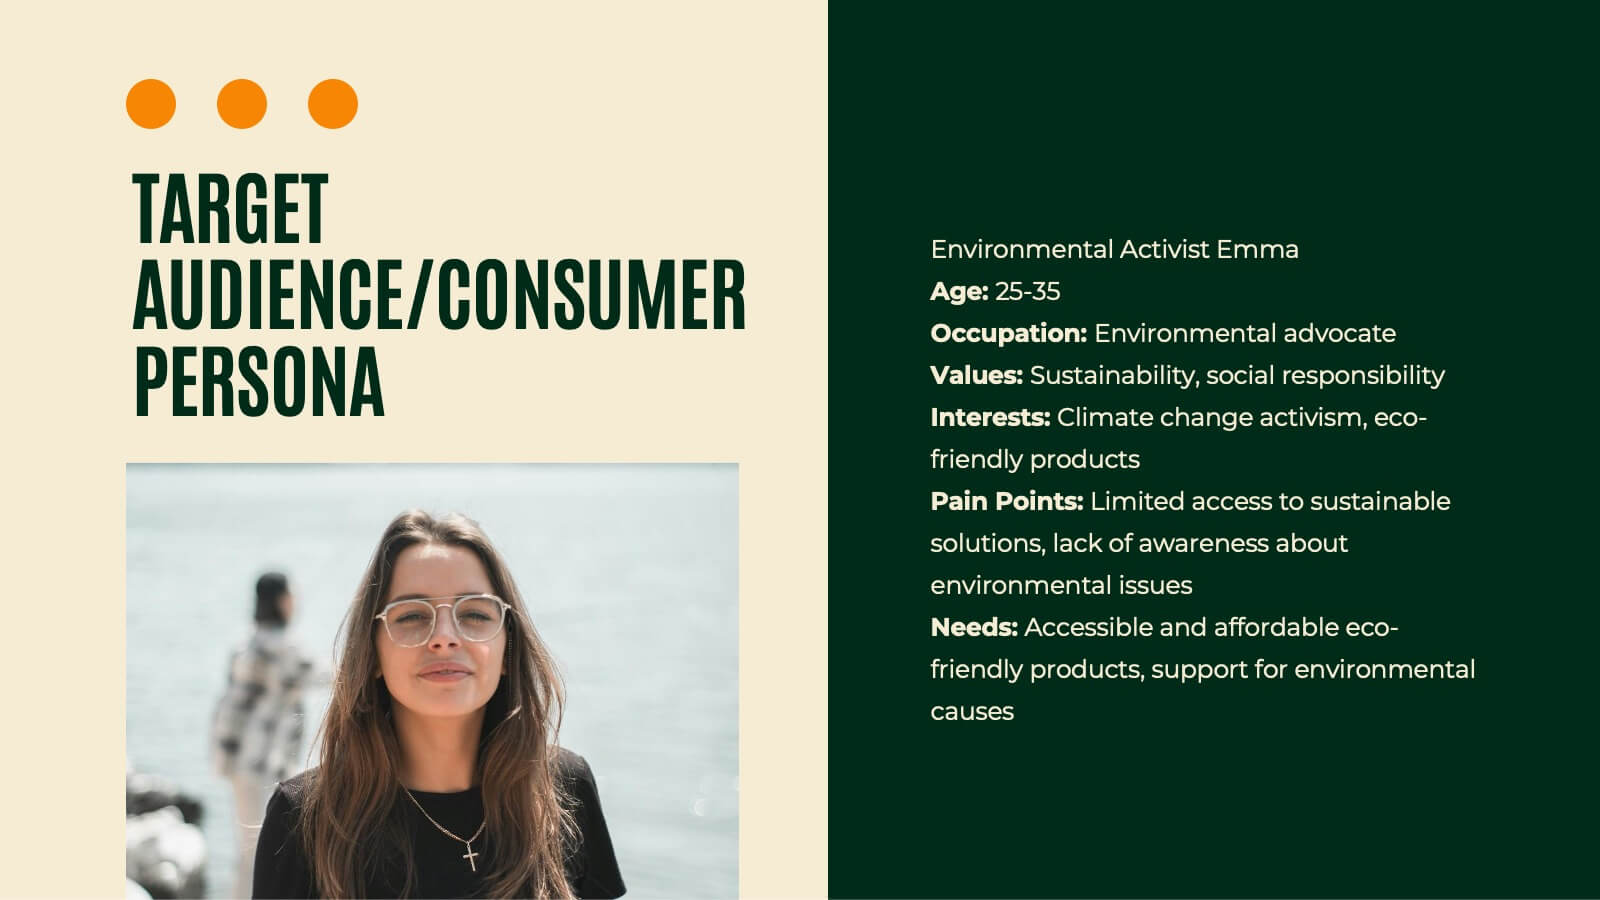
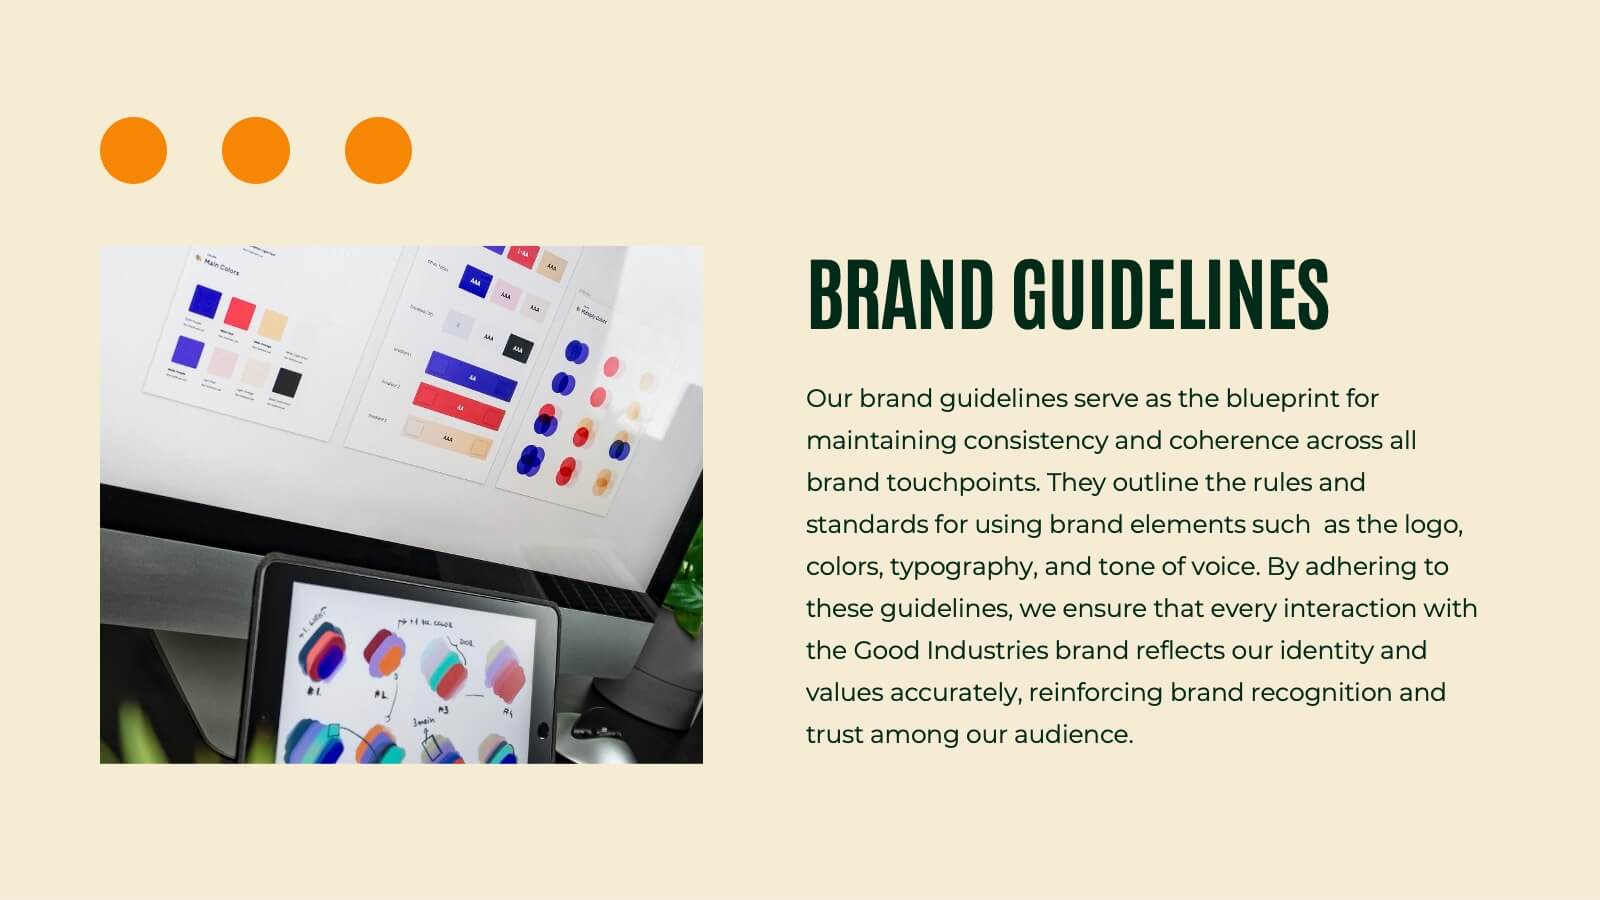
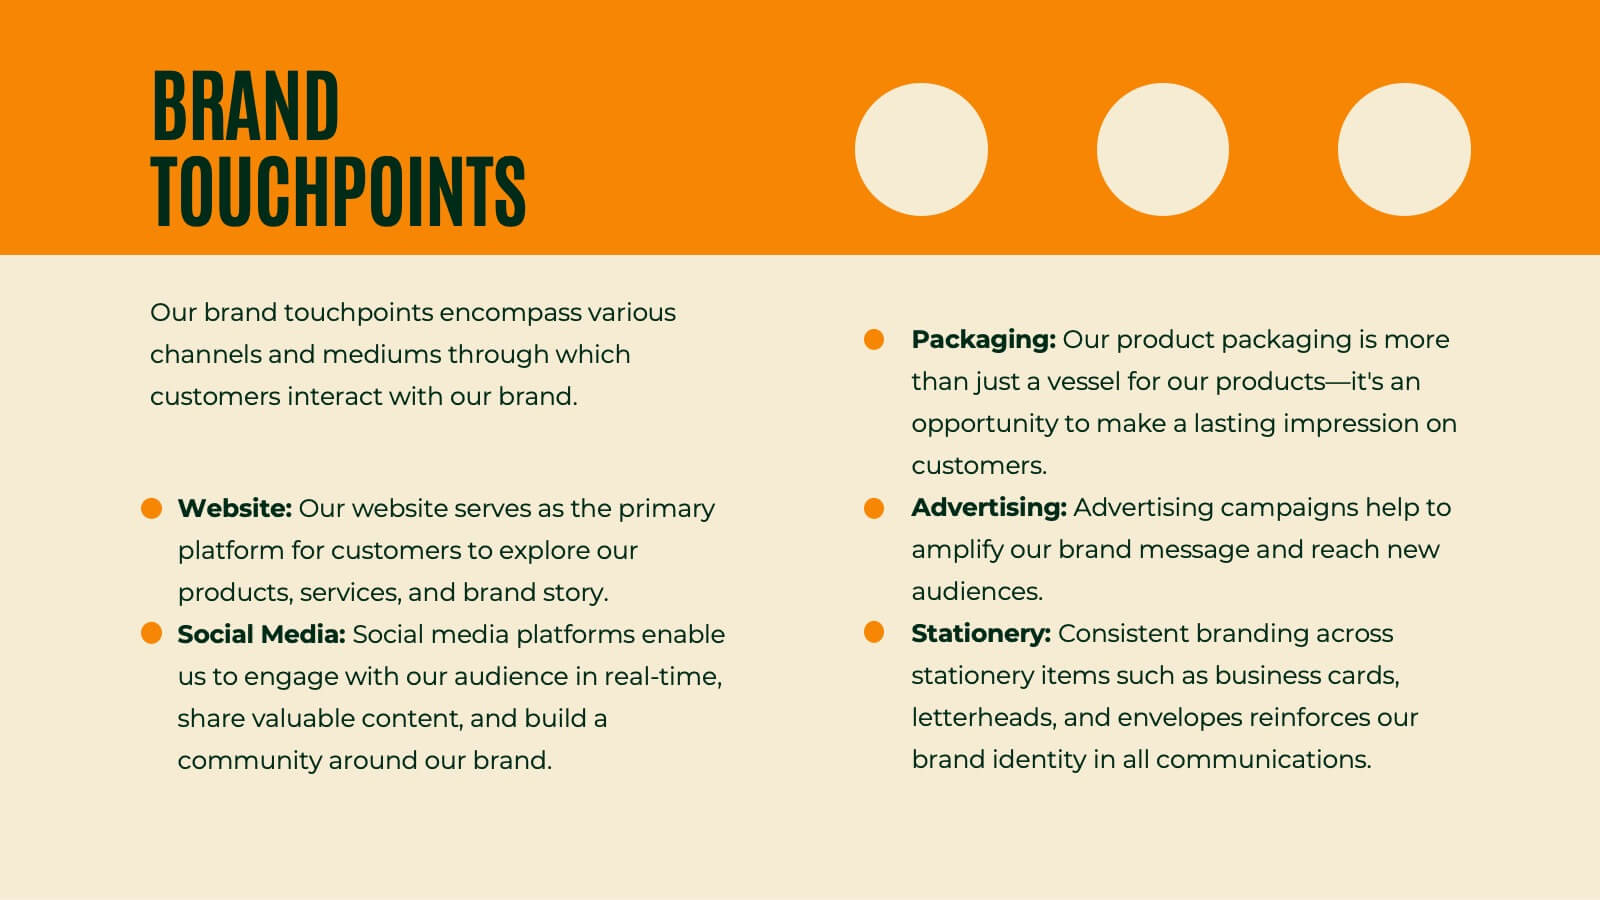
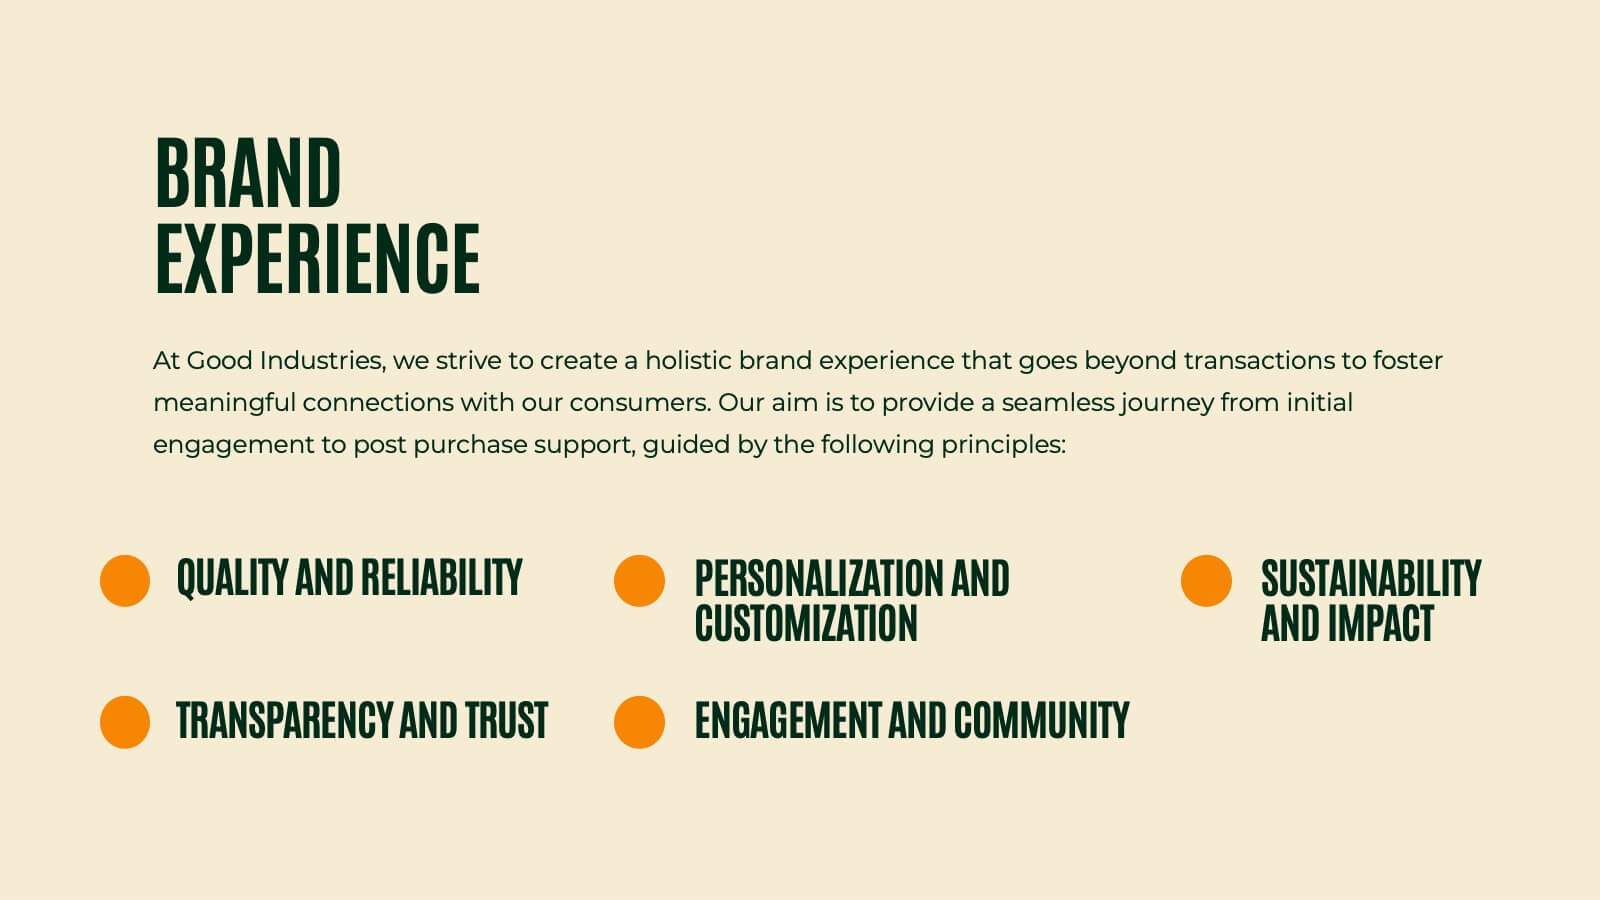
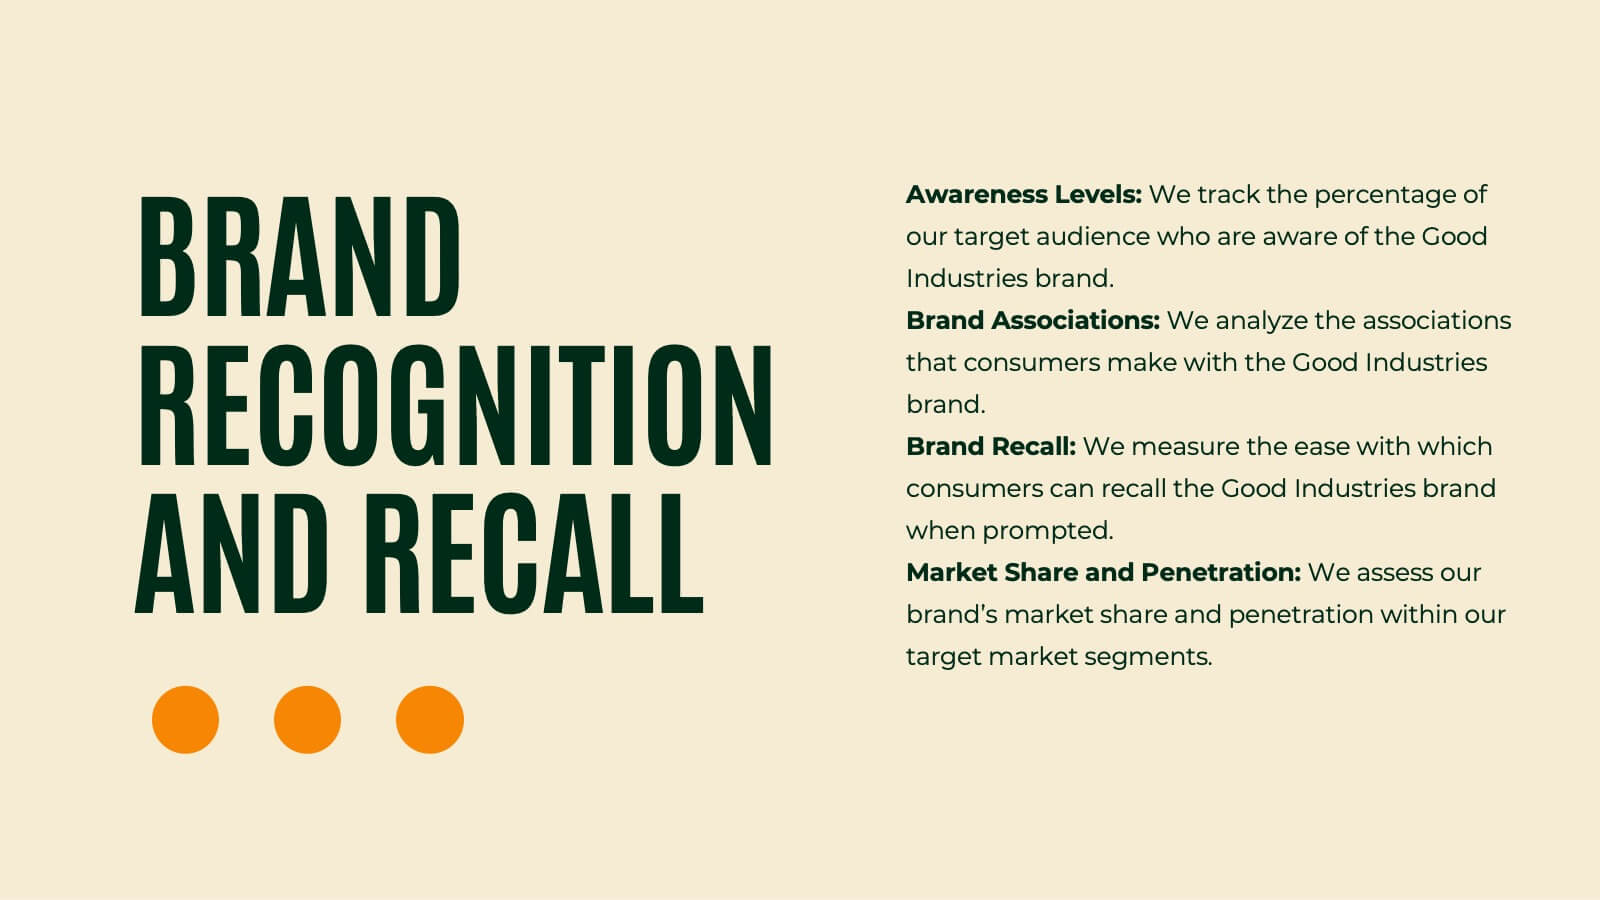
Griffin Rebranding Project Plan Presentation
Unleash the power of branding with this vibrant presentation template! This tool guides you through essential brand elements like identity, voice, and strategy. Perfect for marketers and brand managers aiming to make a memorable impact. Compatible with PowerPoint, Keynote, and Google Slides, it's a must-have for any branding project.


5 diapositivas
Strategic Blue Ocean Shift Presentation
Dive into bold new thinking with a slide that makes strategic transformation feel clear, focused, and actionable. This presentation breaks down key decisions that help teams shift from competitive pressure to value innovation, making complex choices easy to visualize and present. Fully compatible with PowerPoint, Keynote, and Google Slides.


7 diapositivas
SEO Agency Infographic
A Search Engine Optimization (SEO) agency is a company or organization that provides specialized services aimed at improving a website's visibility in search engines like Google, Bing, and Yahoo. The primary goal of this infographic is to help businesses increase their online presence and drive more organic traffic to their website, ultimately leading to higher visibility, increased website visitors, and potential customers. Compatible with Powerpoint, Keynote, and Google Slides. This vibrant, energetic template is tailor-made for the modern-day digital warrior, ready to conquer the realm of online visibility.


5 diapositivas
Budget Planning Finance Presentation
Visualize your financial strategy with this Budget Planning Finance Presentation. Featuring four plant pot icons representing different funding stages, this design helps highlight growth potential and budget allocation. Ideal for financial planning, investment proposals, and expense reports. Customize the text, colors, and icons easily in PowerPoint, Keynote, or Google Slides. Perfect for finance teams, consultants, and business managers.


6 diapositivas
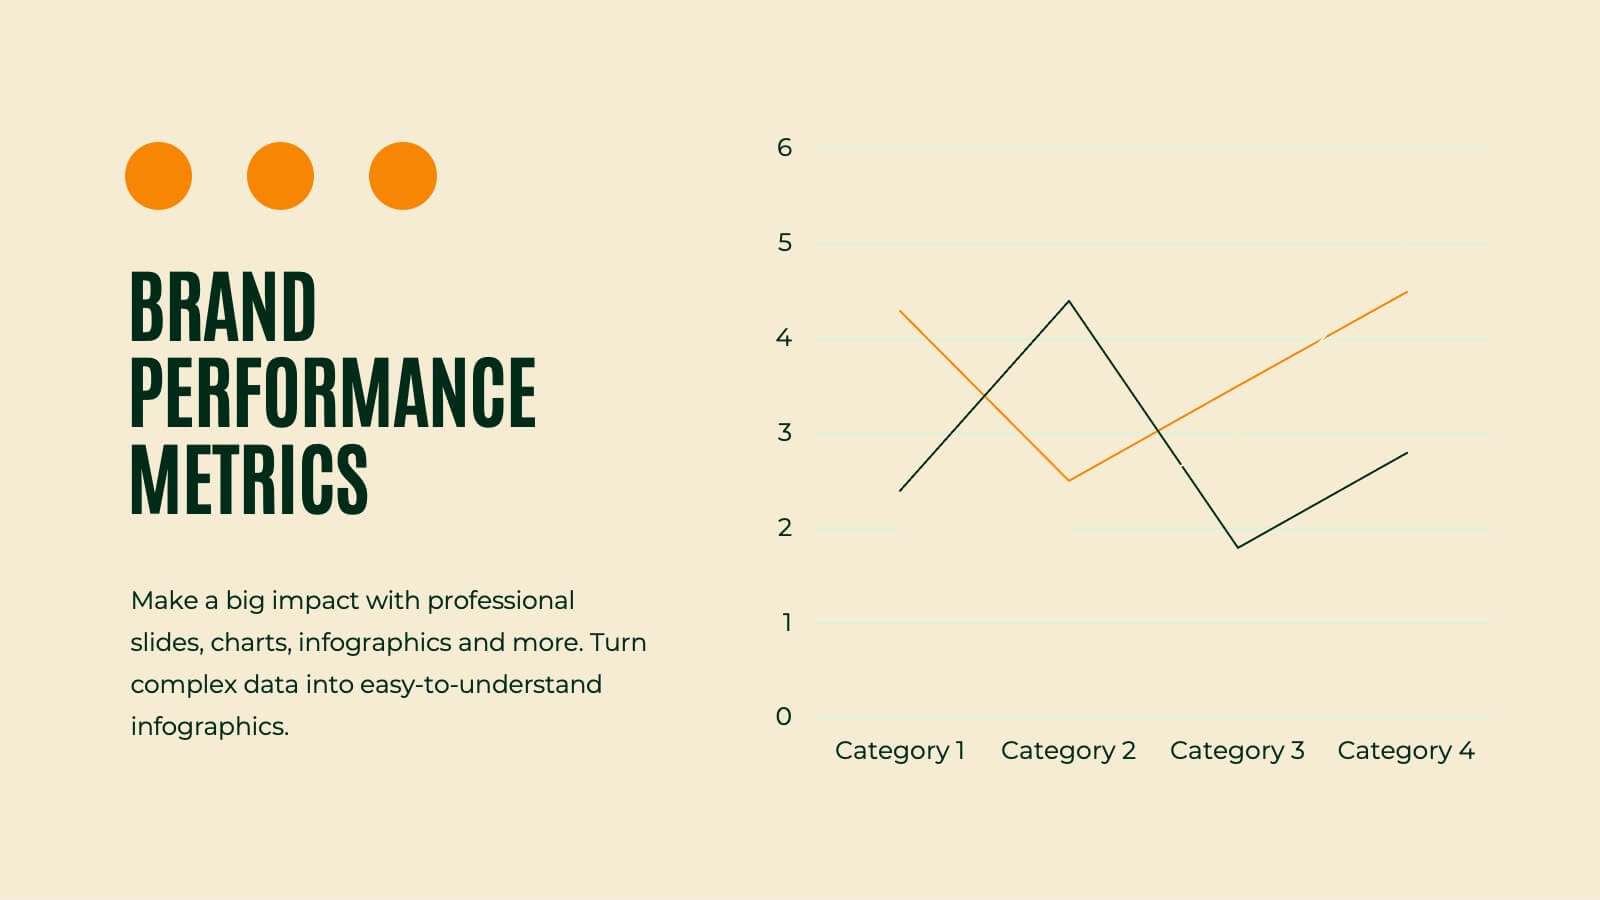
Sales Performance Slide Presentation
Get ready to showcase your results with a slide that makes progress feel genuinely exciting. This presentation highlights key sales metrics, performance stages, and growth insights in a clean, visual format that’s easy to follow and great for reports or team updates. Fully compatible with PowerPoint, Keynote, and Google Slides.


6 diapositivas
Achievements and Goals Milestone Presentation
Celebrate every step toward success with a bold visual that climbs to the top. This infographic template is designed to highlight key goals, project milestones, or achievements using a mountain-inspired layout that’s both symbolic and practical. Perfect for roadmaps, team highlights, or quarterly wins—works seamlessly with PowerPoint, Keynote, and Google Slides.


6 diapositivas
SMART Goal Setting Process Presentation
Clearly define and communicate your business goals with the SMART Goal Setting Process slide. This layout visually breaks down the SMART framework—Specific, Measurable, Achievable, Relevant, and Time-bound—using icons, headers, and editable descriptions for each section. Ideal for strategy planning, goal tracking, and team alignment. Easily customizable in PowerPoint, Keynote, and Google Slides to suit any industry or project.


7 diapositivas
Premium Credit Card Infographic
A premium credit card, is a type of credit card that offers enhanced benefits and exclusive features compared to standard credit cards. This infographic template provides an overview of premium credit cards, showcasing their exclusive benefits and empowering users to make informed financial decisions. Present different types of premium credit cards available, showcasing how each caters to specific needs and preferences. Fully customizable and compatible with Powerpoint, Keynote, and Google Slides. This allows you to easily present financial management tools and features embedded in premium credit cards.


21 diapositivas
Parthenon Marketing Proposal Template Presentation
Create an impactful marketing proposal with this vibrant and modern presentation template! Covering key sections such as industry overview, consumer behavior, social media strategies, and emerging technologies, it helps you present your marketing insights with style. Fully customizable and perfect for data-driven marketing plans, this template is compatible with PowerPoint, Keynote, and Google Slides for seamless presentation delivery.


7 diapositivas
Global Ecology Infographic
Global ecology is the scientific study of ecosystems and the relationships between organisms and their environment on a global scale. This infographic template is structured to provide a comprehensive understanding of global ecology while encouraging action to protect our planet. Fully customizable and compatible with Powerpoint, Keynote, and Google Slides. Feel free to customize, add visuals, and design as per your needs and preferences. This infographic allows you to create educational and impactful visuals that communicate the importance of preserving and nurturing our planet's delicate ecosystems.


6 diapositivas
Business Logic Flow Chart
Streamline complex processes with the Business Logic Flow Chart Presentation. This modern, curved connector design helps you visually outline up to five sequential steps or logic paths, using colorful icons and editable text fields. Ideal for business workflows, strategic plans, or data flow maps. Fully compatible with PowerPoint, Keynote, and Google Slides.


6 diapositivas
Value Chain Model Infographic
The Value Chain Model is a concept developed by Michael Porter to understand and analyze how businesses create and deliver value to their customers. This infographic template illustrates the various activities and processes involved in creating and delivering a product or service to customers. This template is a strategic tool that breaks down the activities of a company into primary and support activities. This infographic breaks down the value chain into distinct stages, each contributing to the overall value and success of the business. It is a powerful tool for analyzing and understanding the competitive advantage of a company and identifying areas for improvement.