


Características


¿Tienes alguna pregunta?
Recomendar


7 diapositivas
United States Map Infographic Presentation Template
The United States is a country in North America, consisting of 50 states. Besides the 48 conterminous states that occupy the middle latitudes of the continent, the United States includes the state of Alaska, at the northwestern extreme of North America, and the island state of Hawaii, in the mid-Pacific Ocean. This map template is a great way to kickstart your project, add a clean and professional look with it. This template can be used to display any type of data or information you need in your presentations. Use this map template to show where the states are and what they're known for.


7 diapositivas
Circle Process Infographic
A Circle Process is a method used to involve a group of people in problem-solving and decision-making. The process is based on a circle shape, where everything is in a circle facing each other. The template includes vibrant colors and circle process charts that you can customize to make just right for your project. This template is perfect for any project or presentation school or business related. This circle process template works with Powerpoint, Keynote, and Google Slides, so you can use it on any device. This template is great for teamwork, community building, and conflict resolution.


5 diapositivas
Energy Sector Analysis Infographics
The Energy Sector refers to the industry and activities related to the production, generation, distribution, and consumption of energy. This template is a simple and informative tool that allows you to present key information and statistics about the energy sector in an engaging manner. This template is designed to help you showcase data, trends, and insights related to aspects of the energy sector, including renewable energy, fossil fuels, and environmental impacts. Its customizable design and informative layouts make it an ideal choice for educational presentations, or raising awareness and understanding of this and its various dimensions.


5 diapositivas
Corporate Risk Assessment Slide Presentation
Streamline complex evaluations with a clean, step-by-step visual that guides your audience through key business risks and mitigation strategies. Ideal for planning sessions or executive reports, this modern design helps simplify communication and enhance decision-making. Fully compatible with PowerPoint, Keynote, and Google Slides for seamless editing and presentation.


22 diapositivas
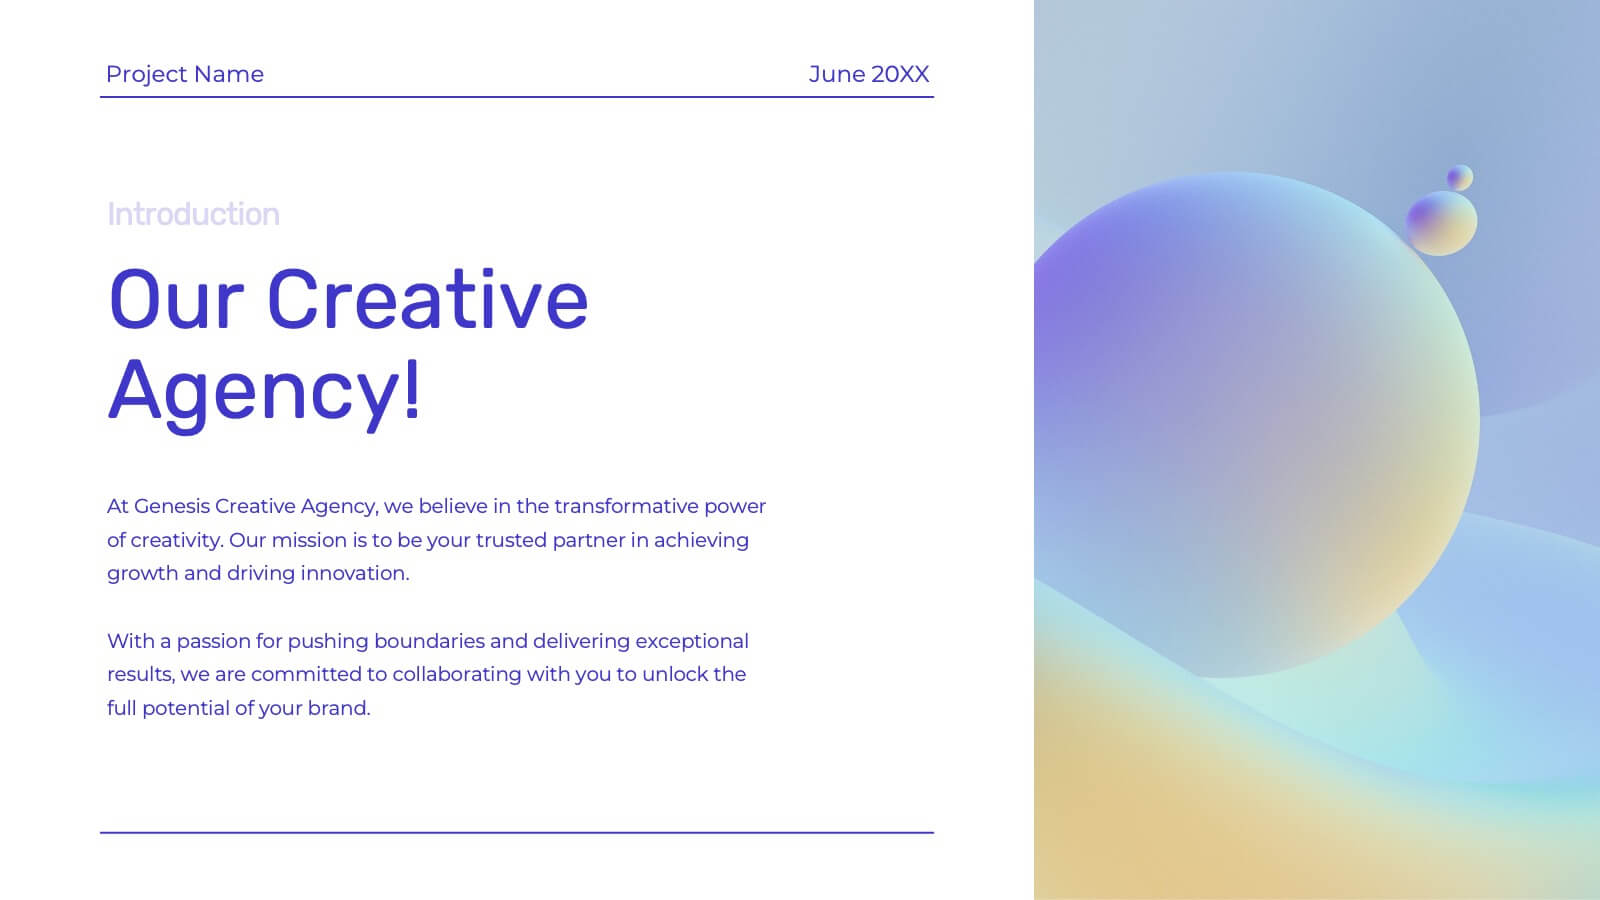
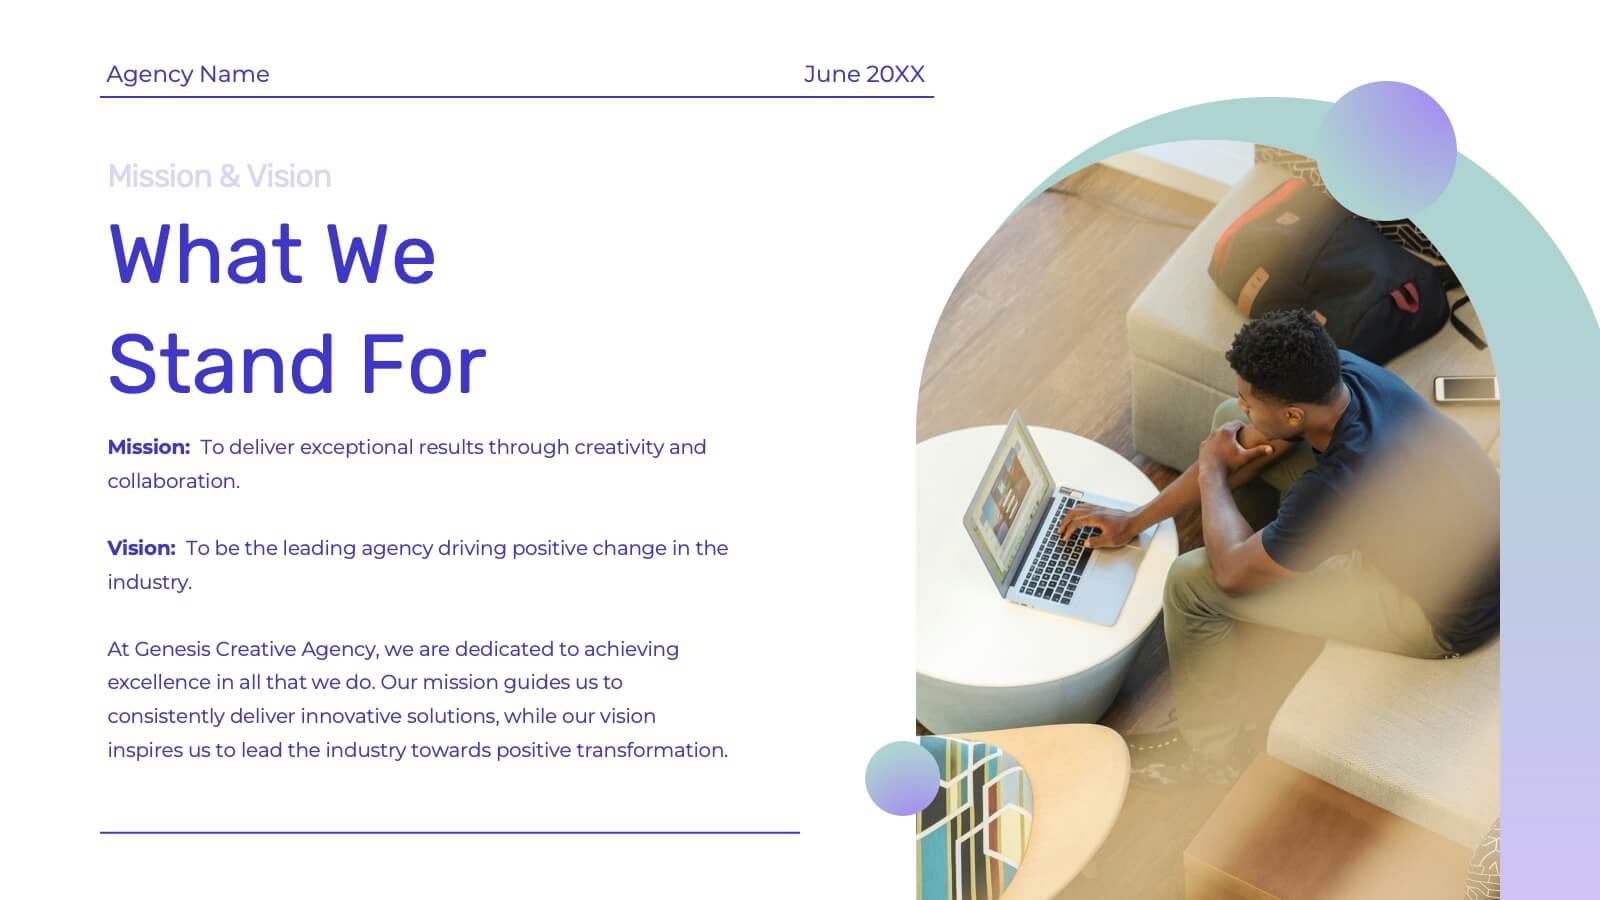
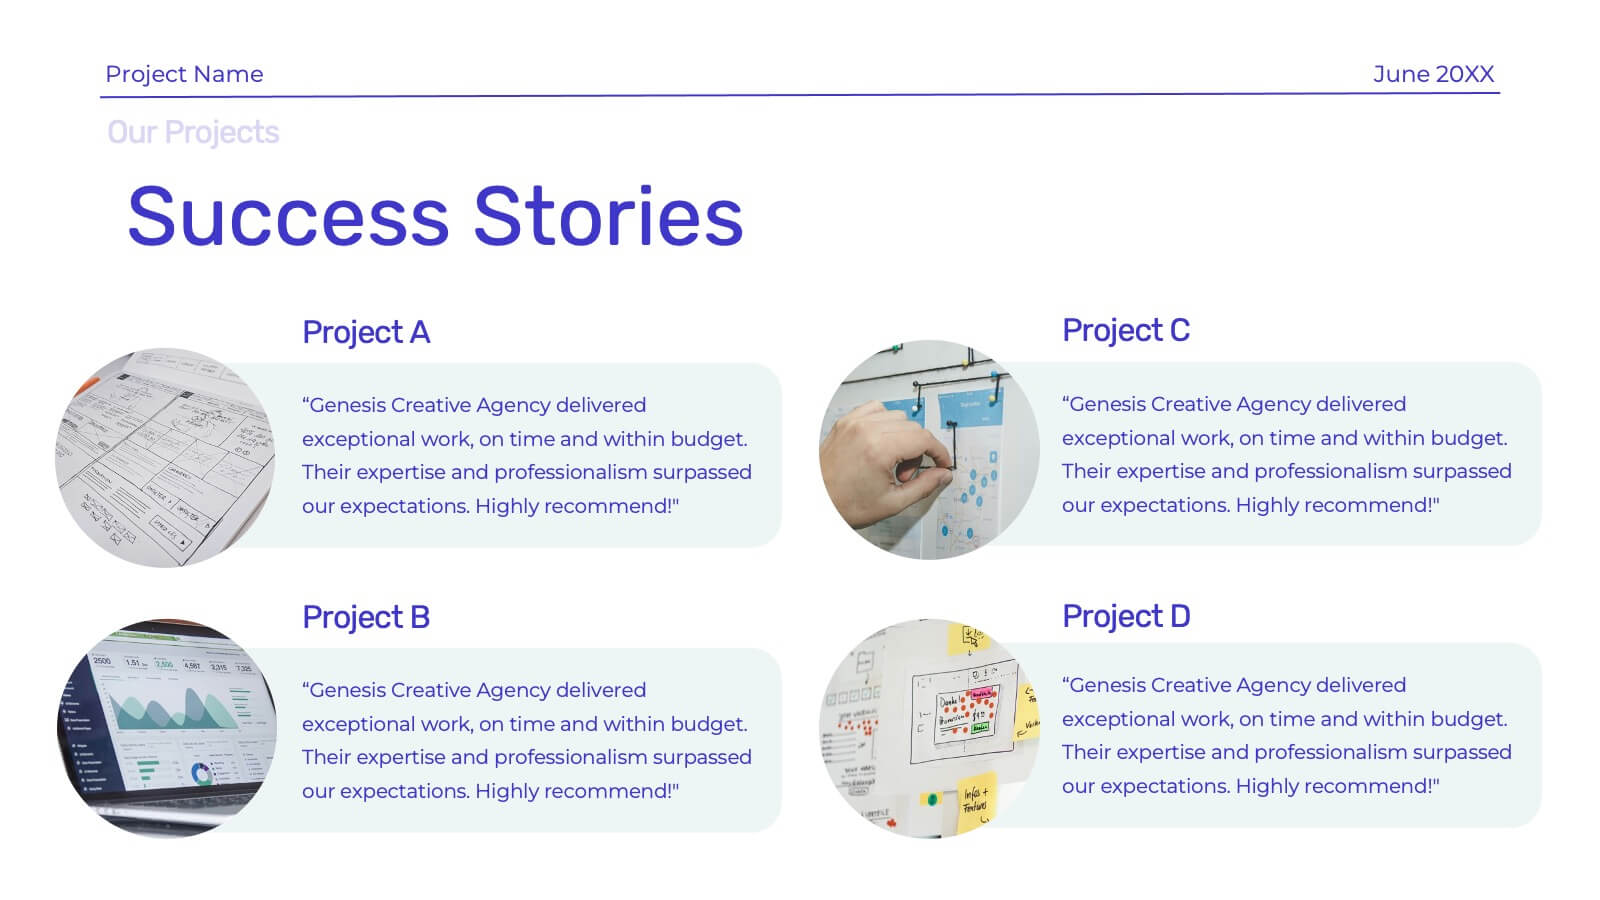
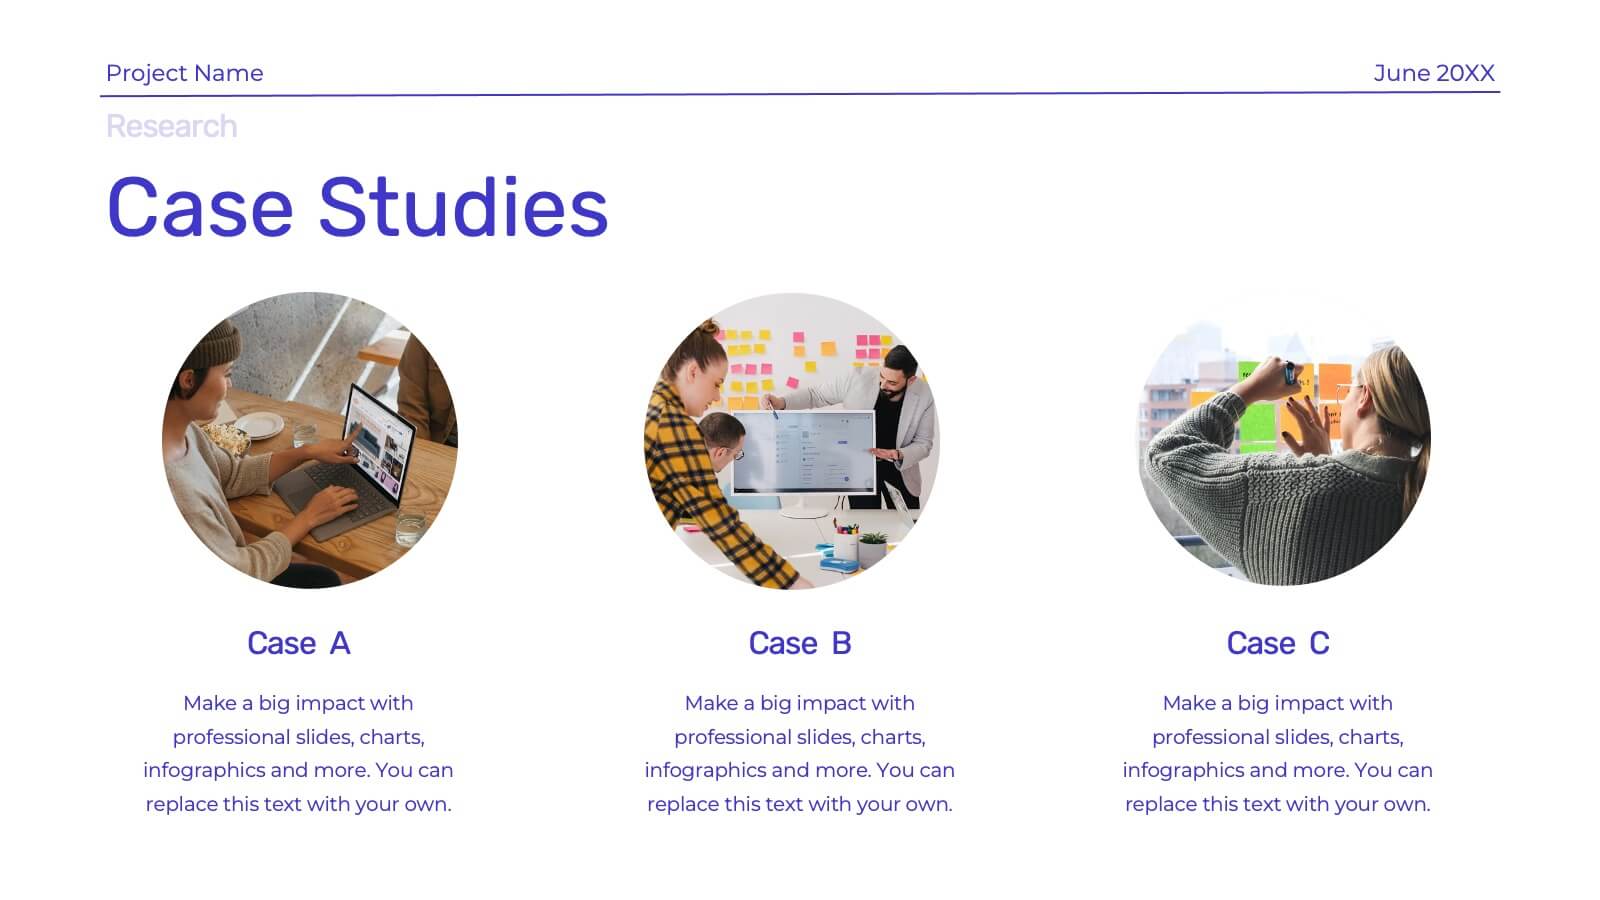
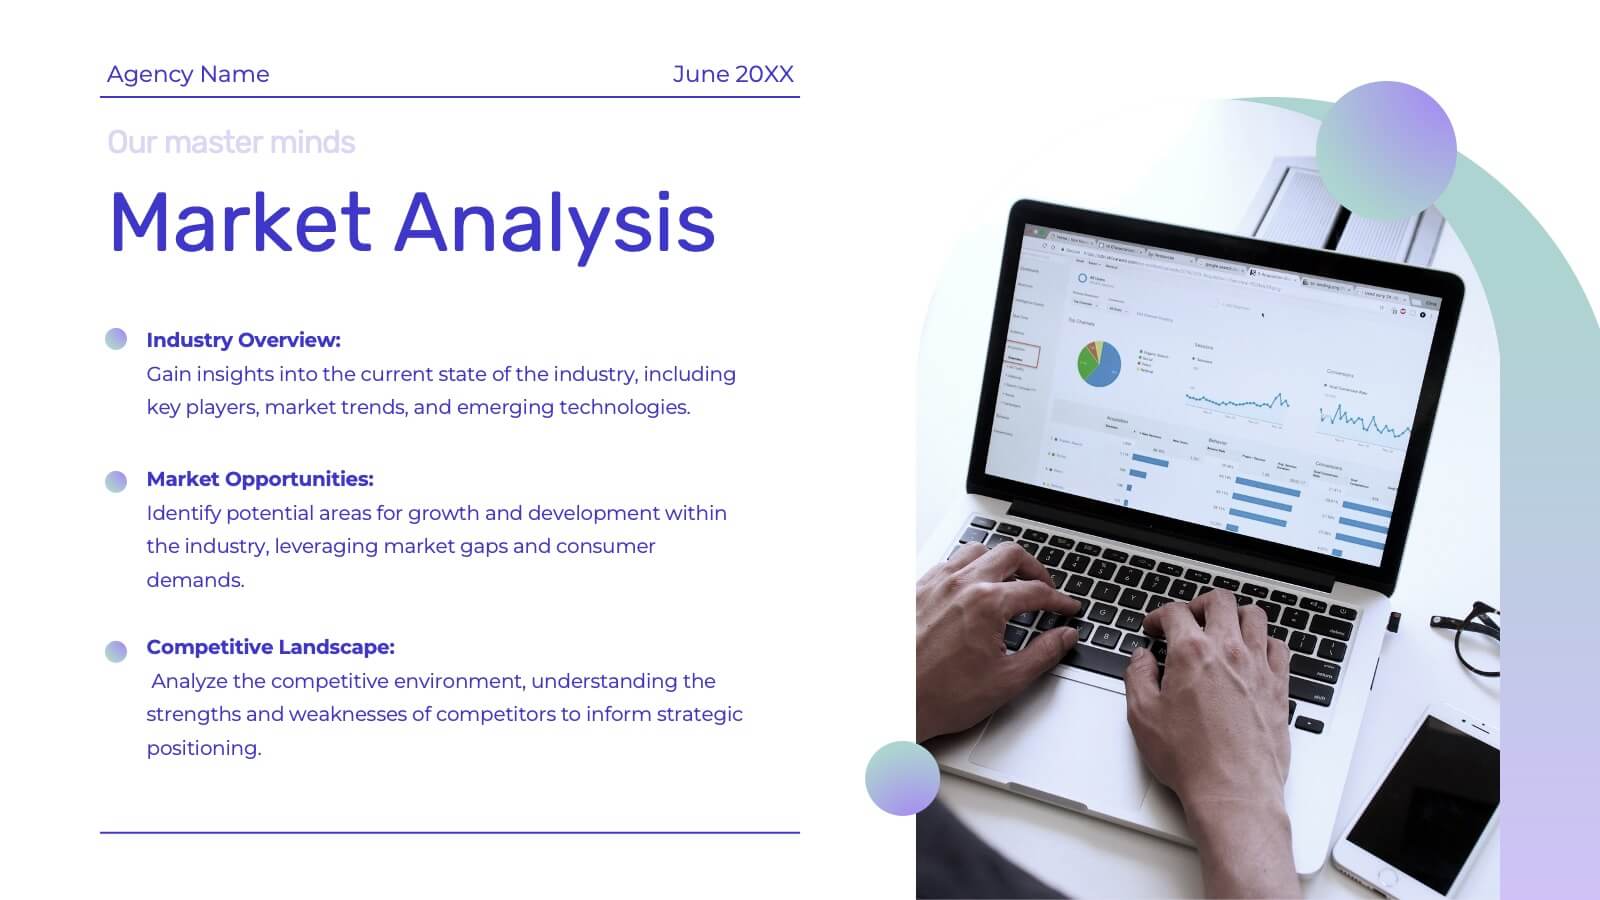
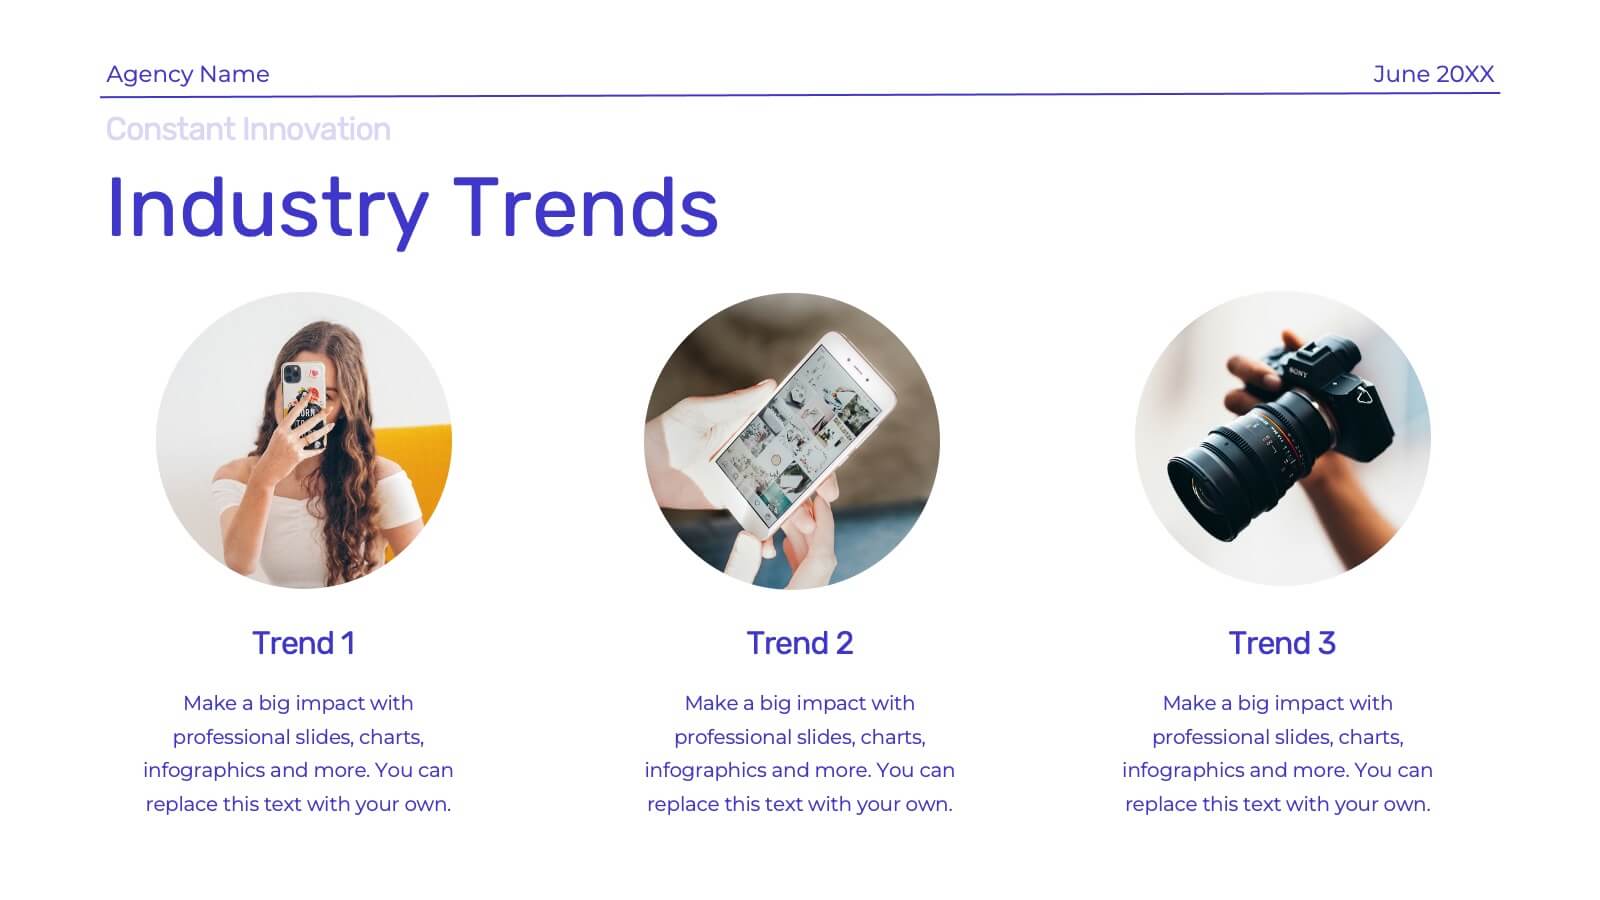
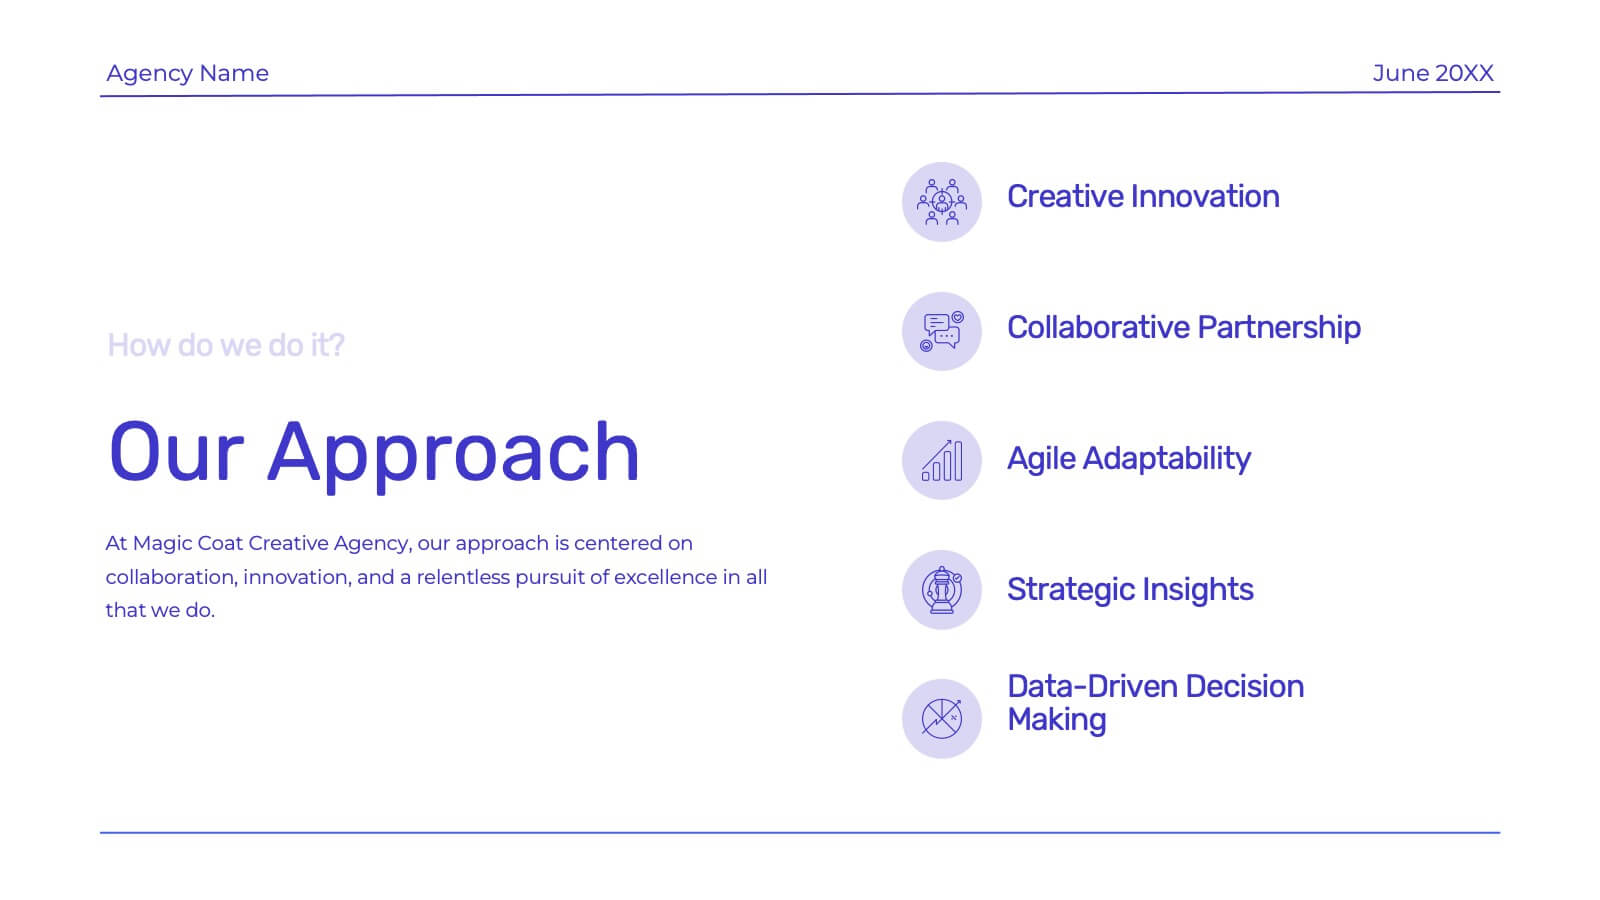
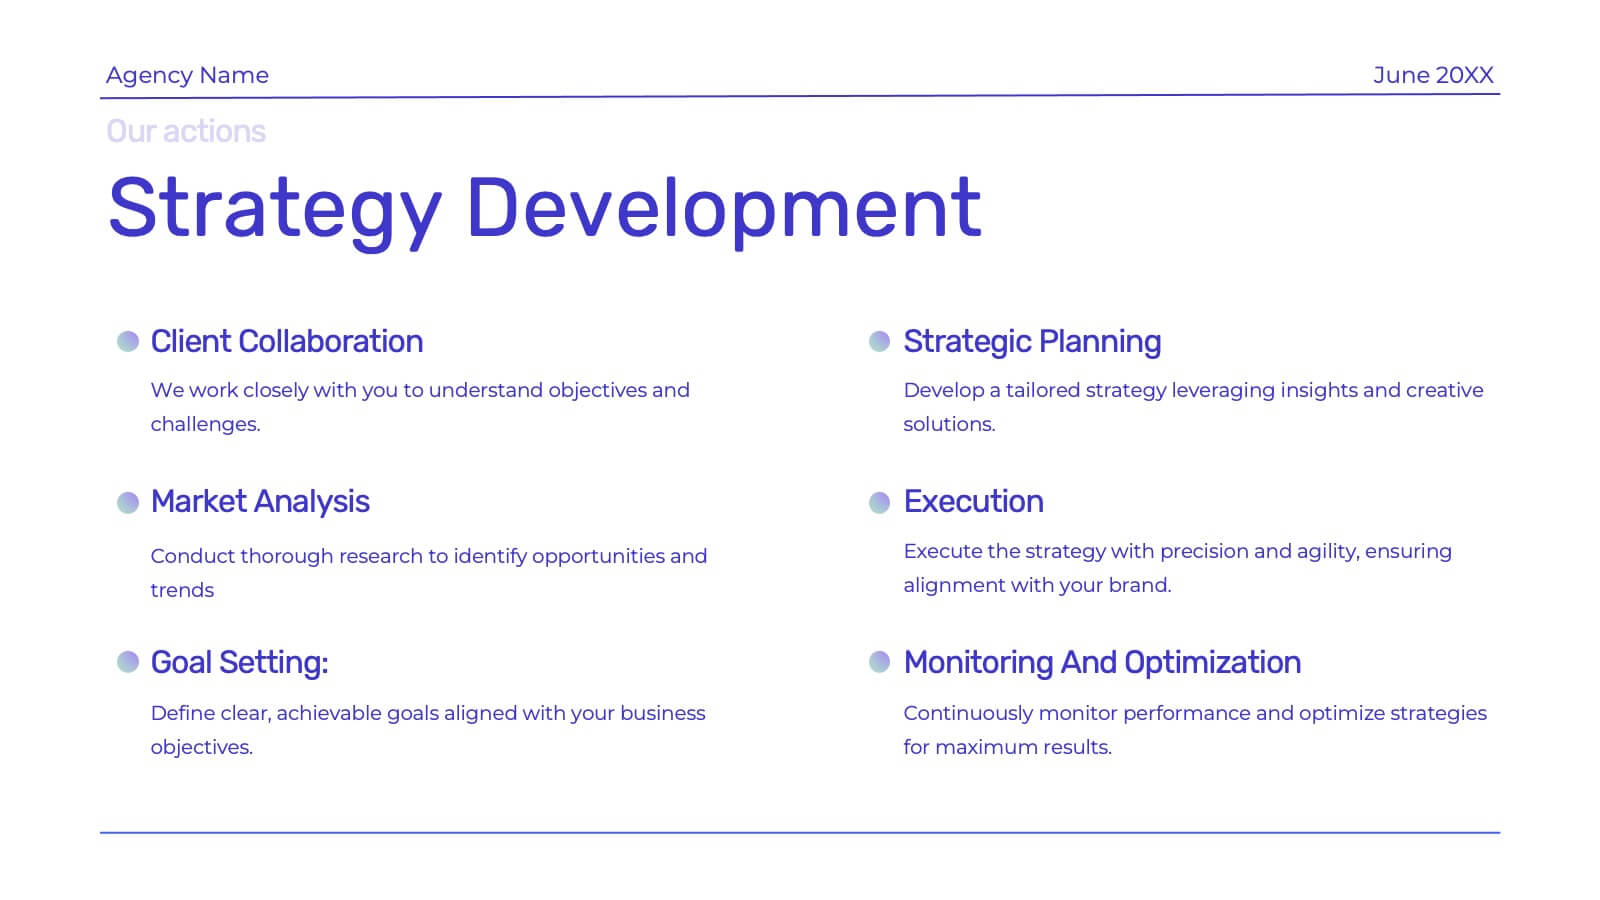
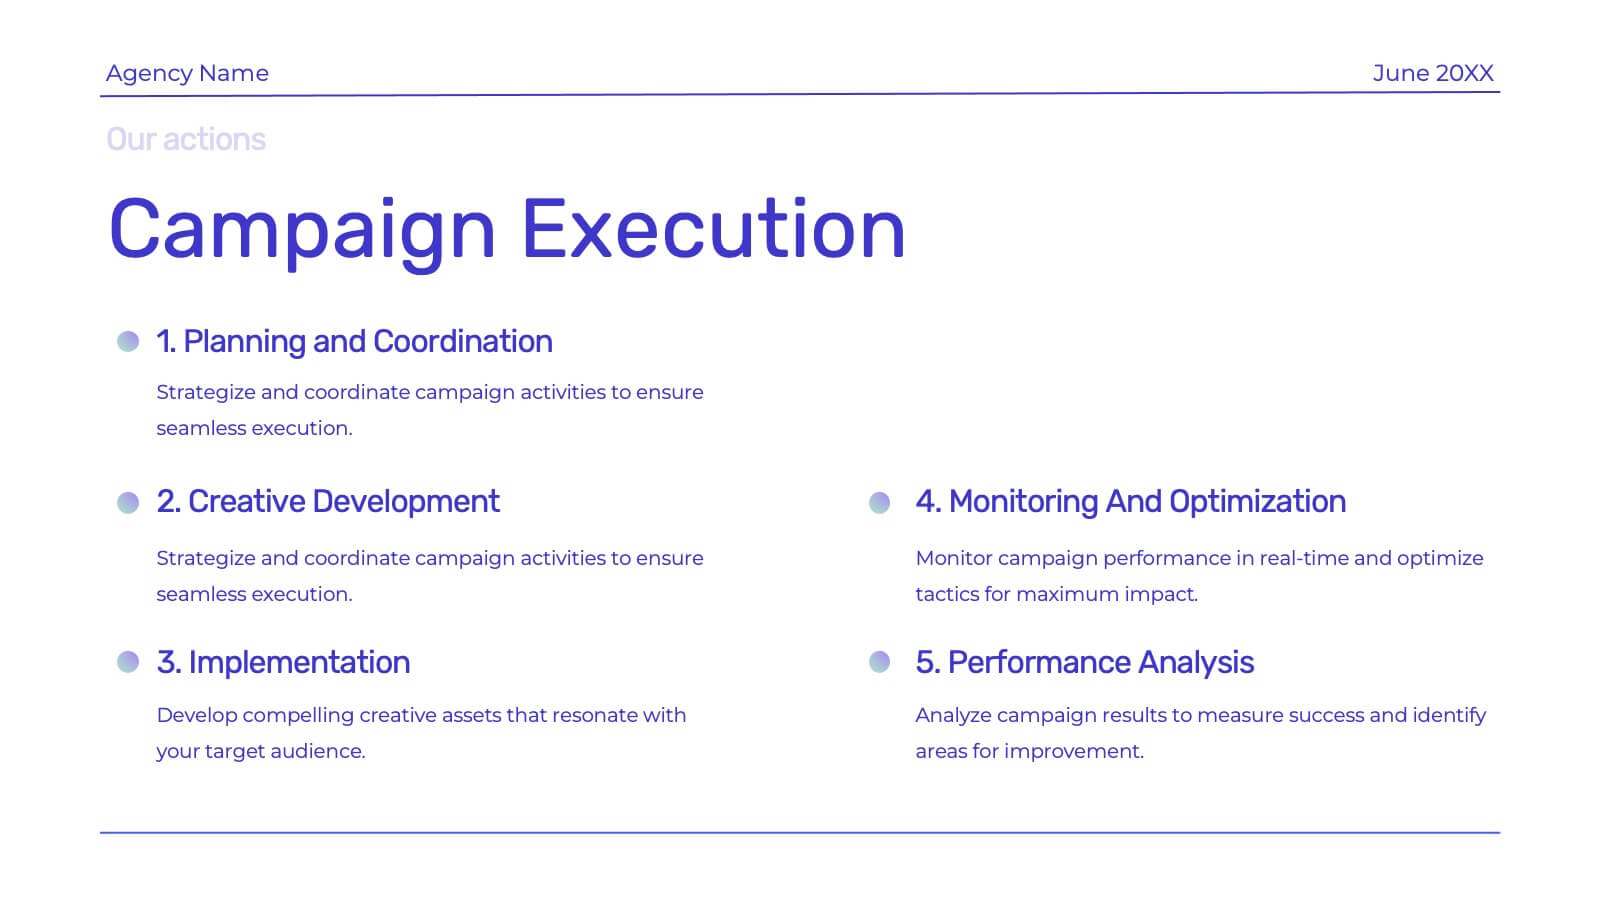
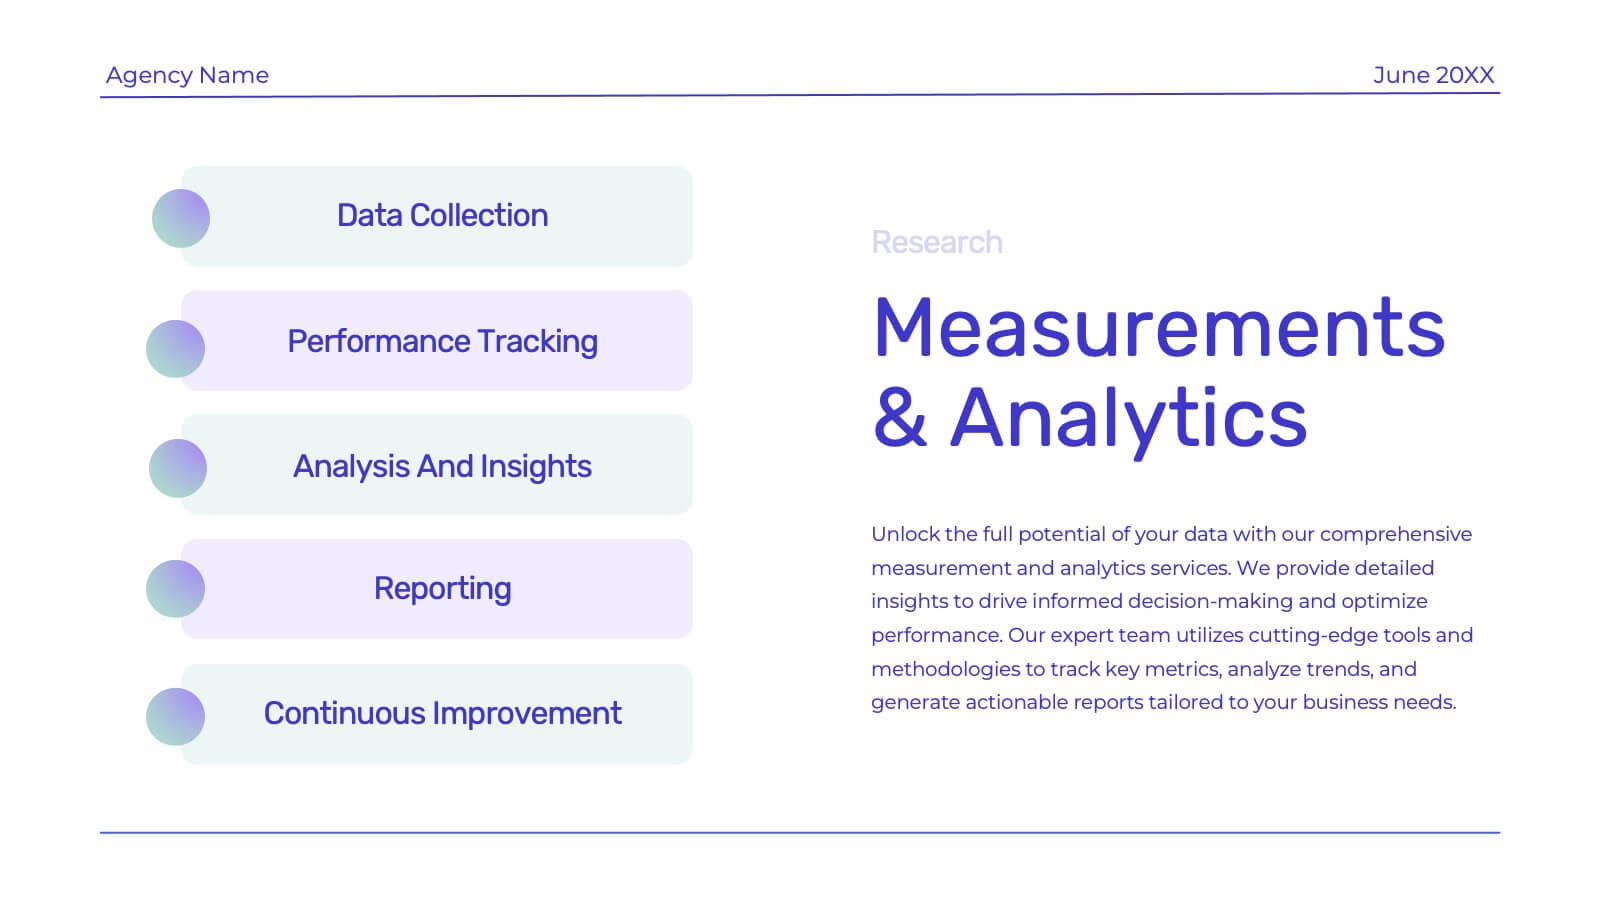
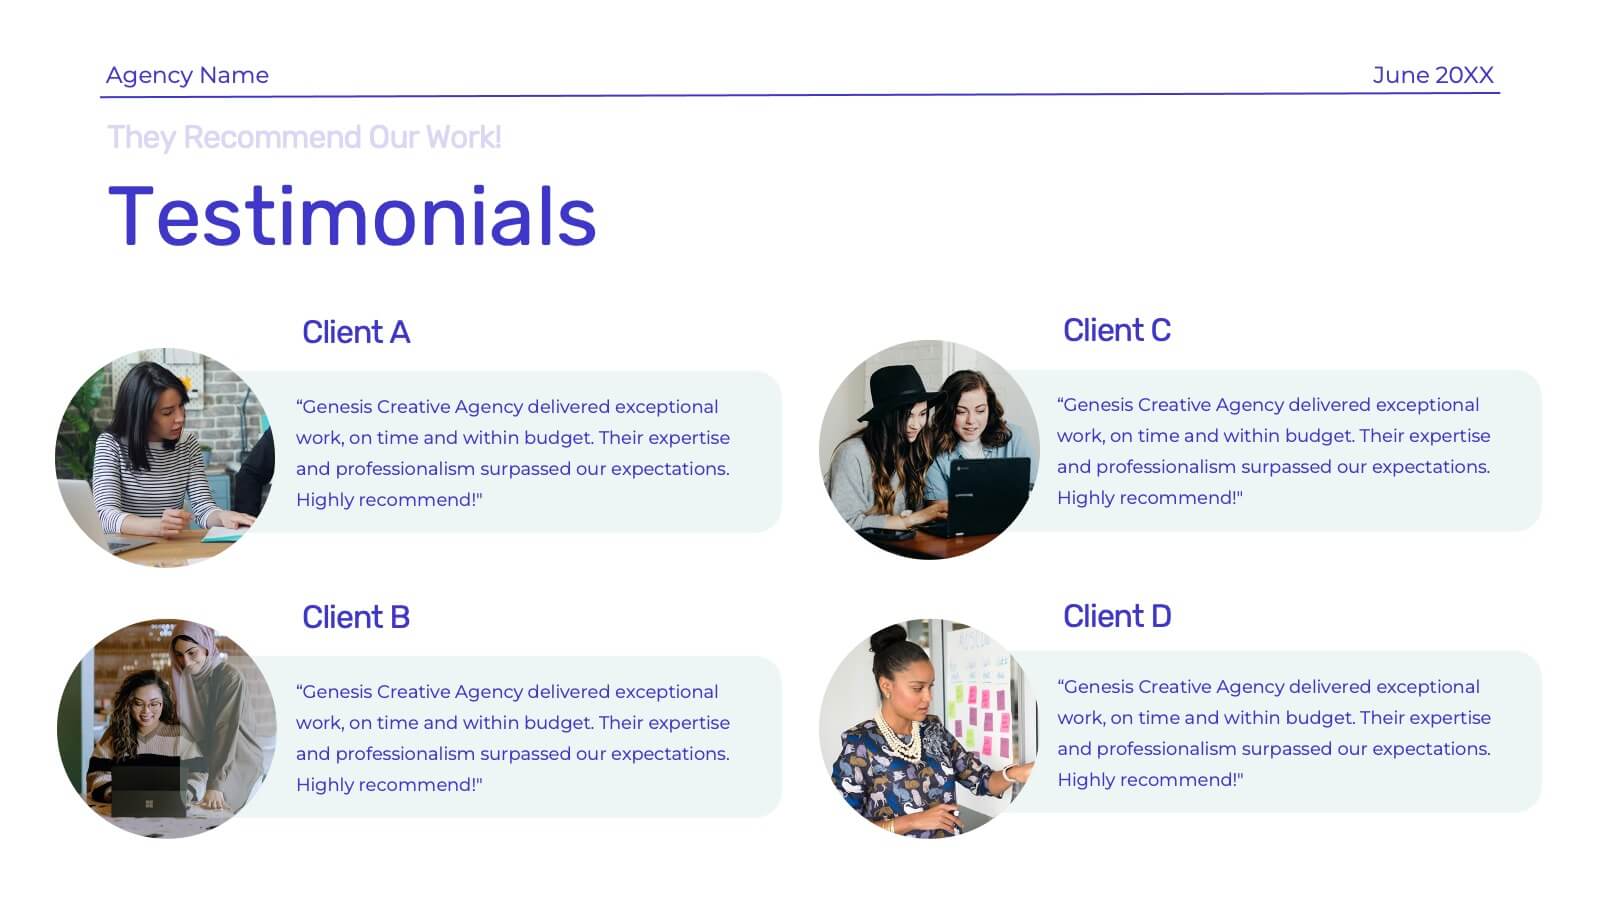
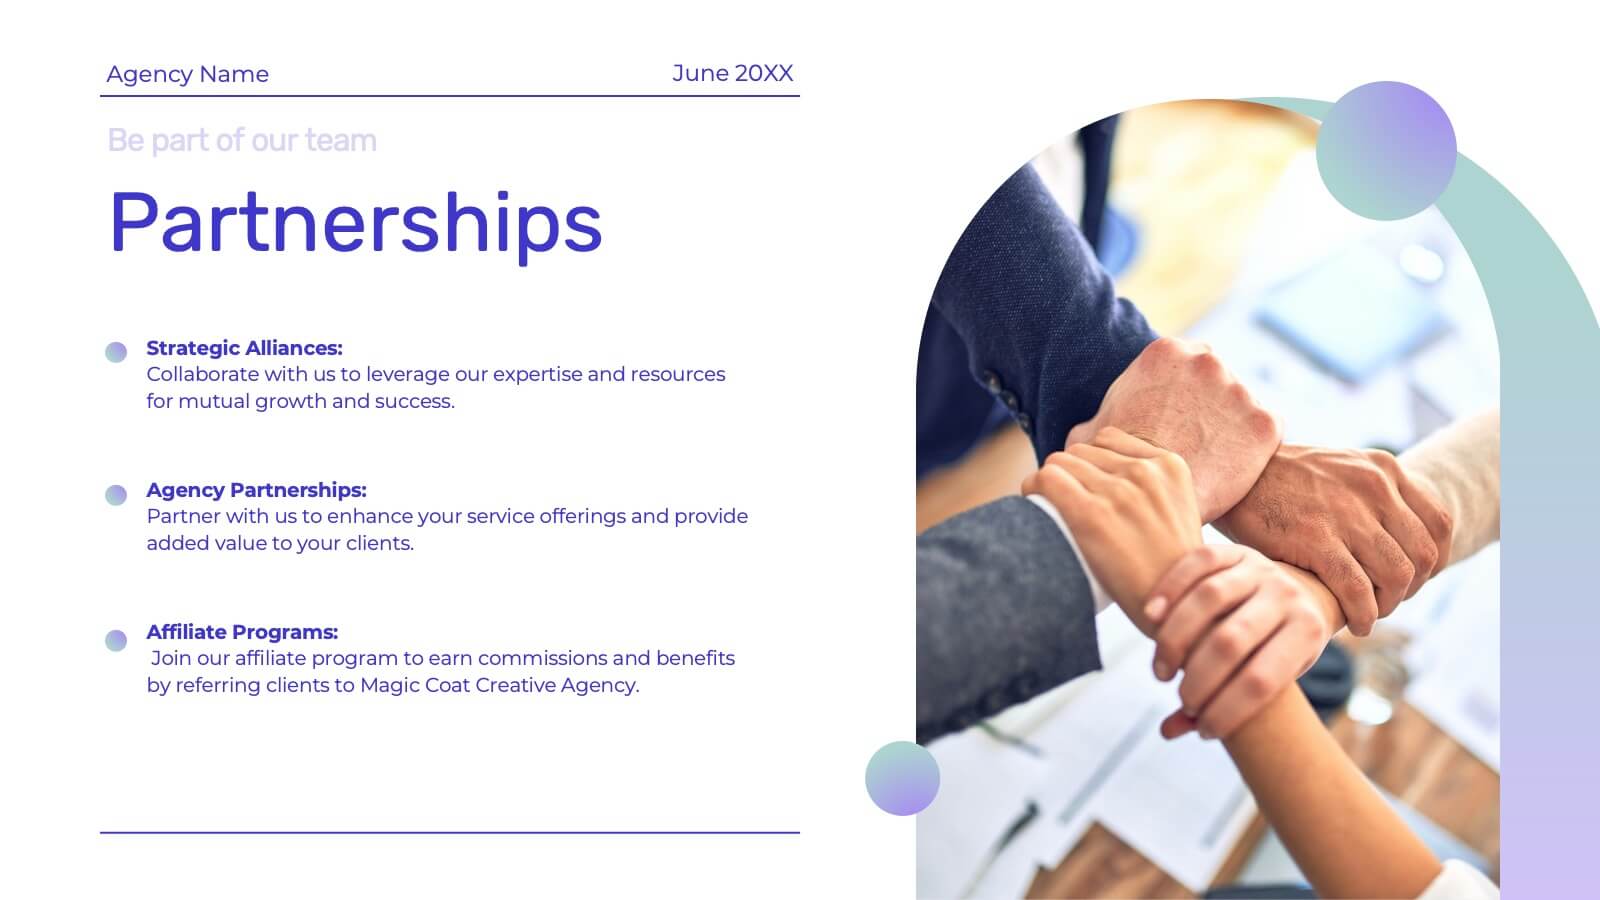
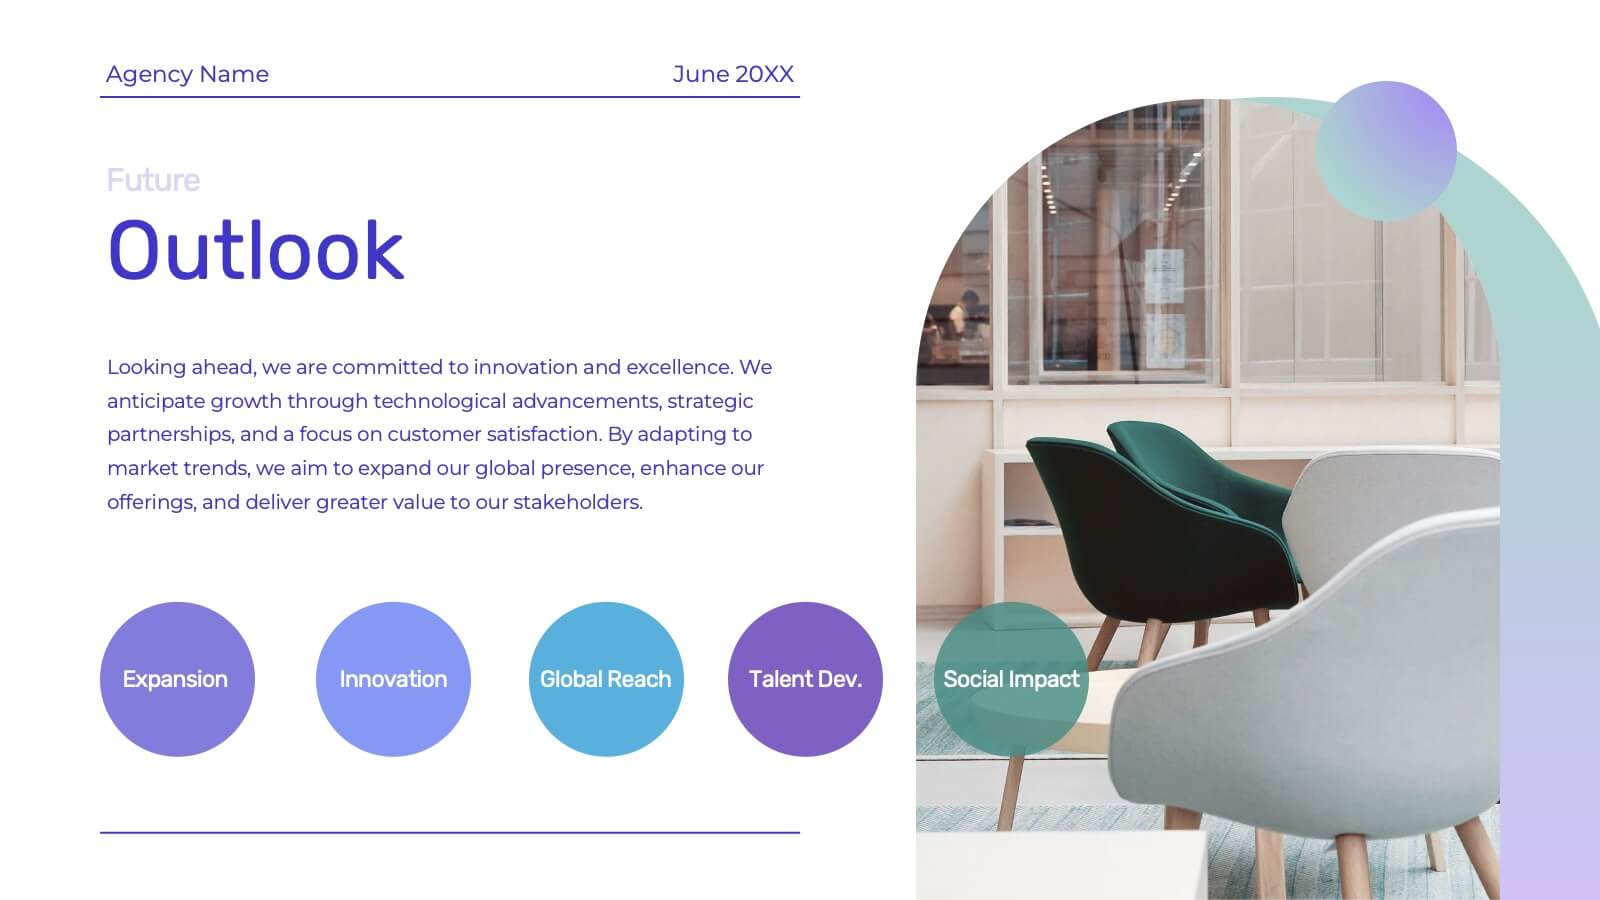
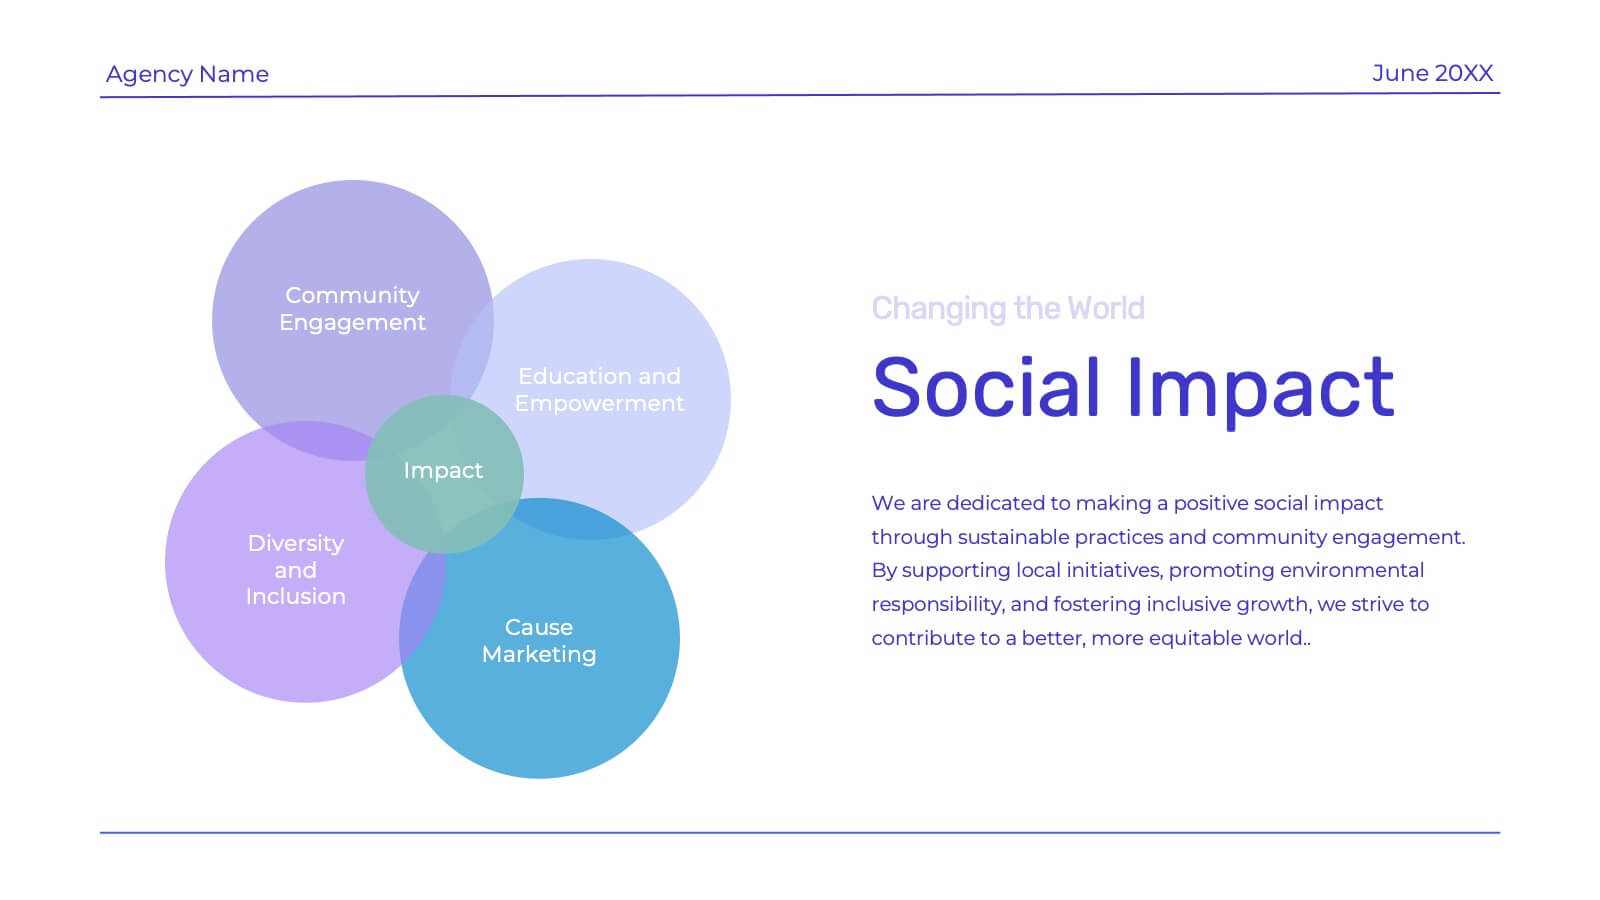
Genesis Creative Agency Pitch Deck Presentation
Showcase your creative agency’s strengths with this vibrant template. Highlight your team, services, success stories, and unique approach. Ideal for case studies, market analysis, and campaign execution. Fully compatible with PowerPoint, Keynote, and Google Slides.


4 diapositivas
Health and Safety Measures Presentation
Bring awareness and clarity to your audience with this bold, safety-inspired presentation layout. Designed to help communicate workplace protocols, risk prevention, and emergency measures effectively, it uses clean visuals and strong icons to capture attention. Fully editable and compatible with PowerPoint, Keynote, and Google Slides for seamless customization.


6 diapositivas
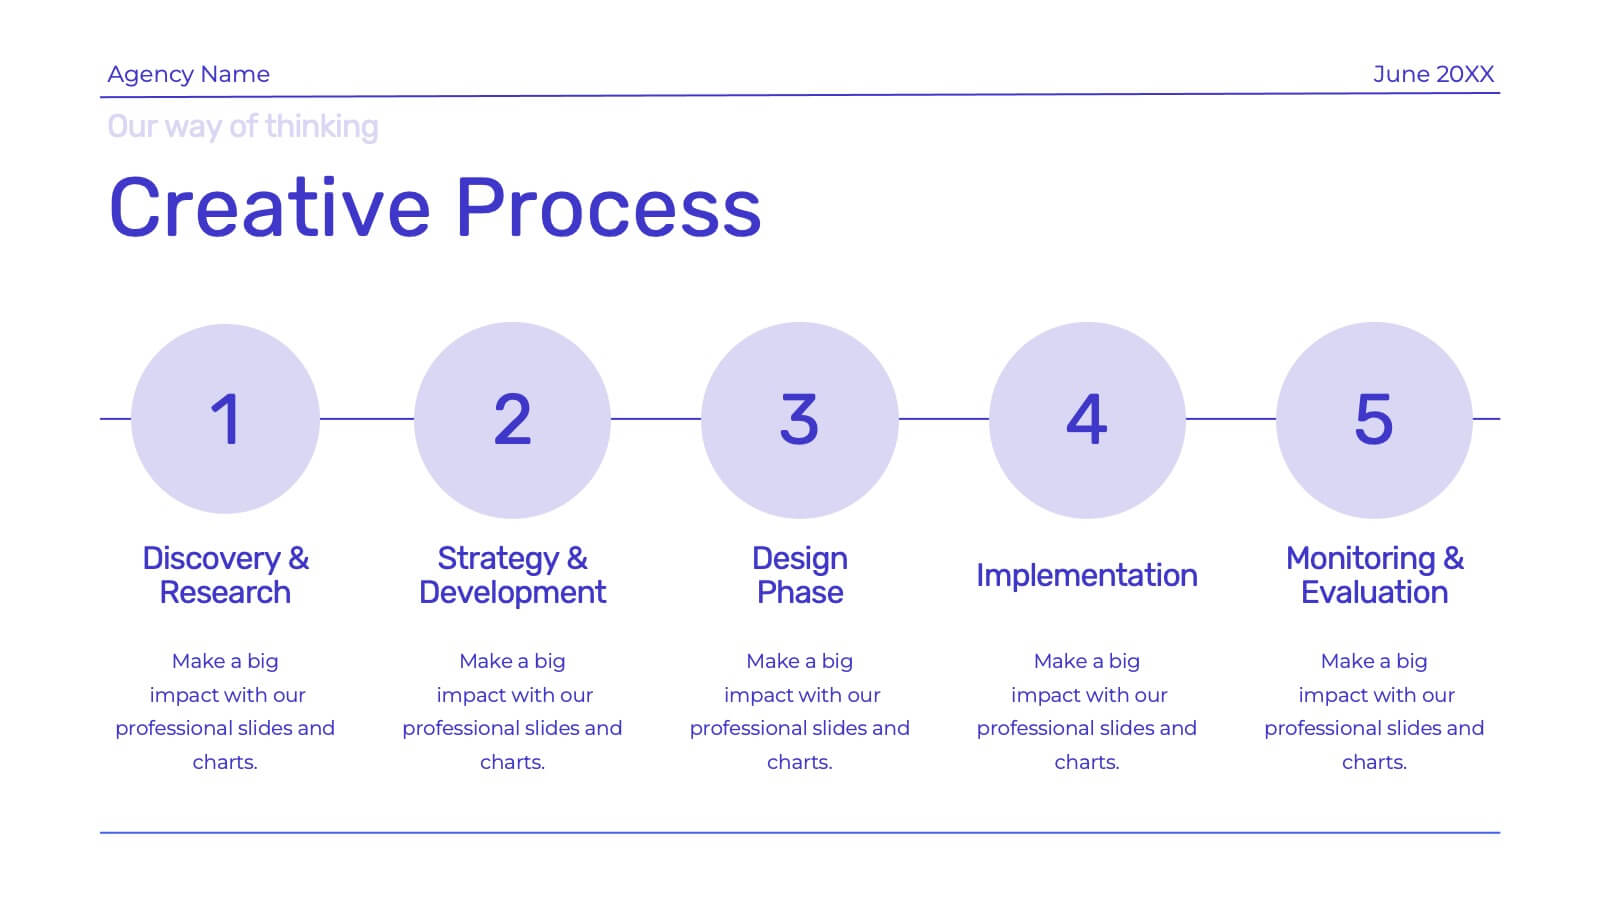
Key Conclusion Summary in Presentation
Conclude your presentation with clarity using this visually structured summary slide. Highlight five key takeaways through a linear roadmap with numbered sections and icons for quick reference. Perfect for final thoughts, progress recaps, or strategic conclusions. Fully editable in PowerPoint, Keynote, and Google Slides to suit your presentation needs.


26 diapositivas
Clean Company Profile Presentation
Present your organization with poise using this clean company profile template. The design marries minimalist aesthetics with functional elegance, embodying a professional and polished look. The crisp layout is dotted with geometric shapes and a calm color palette, reflecting a modern corporate image. It’s perfect for businesses wanting to communicate their mission, team, and milestones succinctly. The 'Meet Our CEO' slide introduces leadership with clarity, while the 'Four Option Slide' breaks down services or products into an easy-to-digest format. Financial achievements gain prominence on the 'Big Number Slide', and the 'World Map Infographic' illustrates global reach. This design is not just about presenting facts; it’s about telling your company’s story with sophistication. From first glance to final slide, it’s crafted to convey a narrative of reliability, innovation, and corporate integrity. Use it for investor briefings, internal meetings, or partnership pitches and establish an image of impeccable professionalism.


5 diapositivas
Veterinary Diagnostics and Treatment Presentation
Clearly outline your care process with the Veterinary Diagnostics and Treatment presentation. This slide features a visually appealing medical bag segmented into four quadrants, each marked by colorful paw prints and editable titles. Ideal for showcasing diagnosis steps, treatment plans, or service categories for veterinary clinics. Fully customizable and easy to adapt for use in PowerPoint, Keynote, and Google Slides. Perfect for pet care professionals seeking a professional, pet-friendly visual.


26 diapositivas
Hypnosia Brand Guidelines Proposal Presentation
This Brand Guidelines Proposal Template provides a sleek, professional layout to showcase key branding elements like vision, values, identity, and strategy. Perfect for businesses and agencies, it ensures brand consistency. Fully customizable and compatible with PowerPoint, Keynote, and Google Slides for seamless adaptation to your brand’s style.


4 diapositivas
Attention-Interest-Desire-Action Sales Strategy Presentation
Highlight each phase of your sales journey with this clean and modern AIDA model layout. Designed for clarity, it uses bold semicircle visuals and directional arrows to guide your audience from capturing attention to driving action. Perfect for sales teams, marketers, and consultants. Fully editable in PowerPoint, Keynote, and Google Slides.


4 diapositivas
US Map with Data Points Presentation
Bring your data to life with a dynamic nationwide view that makes trends instantly clear. This presentation helps you showcase key metrics, highlight regional insights, and compare results across states using clean, modern data markers. It’s perfect for reports, strategy updates, and analytics. Fully compatible with PowerPoint, Keynote, and Google Slides.


8 diapositivas
Customer Survey Results Analysis Presentation
Visualize feedback clearly and confidently with this dynamic results breakdown template. Featuring circular percentage graphics around a central report icon, this slide is ideal for presenting survey insights, NPS metrics, or user feedback summaries. Fully editable in PowerPoint, Keynote, and Google Slides.


6 diapositivas
Workplace Safety and Compliance
Simplify safety protocols with this visual workplace compliance slide. Featuring a clear cone-style graphic and three editable sections, it's ideal for outlining procedures, regulations, and training checkpoints. Perfect for HR teams, safety briefings, and internal audits. Editable in PowerPoint, Keynote, and Google Slides.


7 diapositivas
Bowtie Risk Management Diagram Presentation
Visualize cause and consequence with a clean, symmetrical flow that simplifies complex risk scenarios. This presentation helps you illustrate threats, controls, and outcomes in one cohesive framework, making decision-making clear and impactful. Fully customizable and compatible with PowerPoint, Keynote, and Google Slides for professional risk analysis presentations.


4 diapositivas
Data Visualization Pie Chart
Make your insights pop with this engaging Pie Chart slide. Perfect for reporting KPIs or comparing segmented data, the radial design blends clear visuals with editable text sections. Ideal for marketing, analytics, or strategy meetings. Fully customizable in PowerPoint, Keynote, and Google Slides.


5 diapositivas
RAPID Decision-Making Model
Take the guesswork out of group decisions with this bold and clear template. It’s designed around the RAPID framework—Recommend, Agree, Perform, Input, Decide—to help teams define roles and make faster, more accountable choices. Perfect for leadership, strategy, and project planning sessions. Fully compatible with PowerPoint, Keynote, and Google Slides.