


Características


¿Tienes alguna pregunta?
Recomendar


3 diapositivas
Stock Market Investment Analysis Presentation
Unlock the secrets of the stock market with our "Stock Market Investment Analysis" presentation templates. Ideal for financial analysts and investors, these templates provide a clear framework for analyzing trends and making informed decisions. With easy-to-edit elements and professional design, they are perfect for delivering compelling investment insights. Compatible with PowerPoint, Keynote, and Google Slides, they ensure your analysis looks sharp and persuasive across all platforms.


5 diapositivas
Revenue Streams & Expense Management Layout Presentation
Visualize your income and costs with the Revenue Streams & Expense Management Layout Presentation. This slide layout uses a vertical arrow chart to display four data categories, ideal for comparing sources of income and related expenditures. Great for financial reports, budgeting reviews, and strategy discussions. Compatible with Canva, PowerPoint, Google Slides, and Keynote.


5 diapositivas
Butterfly Chart Data Visualization Presentation
The "Butterfly Chart Data Visualization" presentation template is designed for comparative analysis across multiple options, facilitating easy visualization of data such as performance metrics, survey results, or any other quantifiable comparison. Each option is presented with dual opposing bars extending from a central axis, making it effortless to compare two datasets side by side for each category. This layout helps highlight differences and similarities effectively, ideal for presentations that require detailed analysis and clear visual distinctions between data points.


4 diapositivas
Social Media and Online Marketing Trends
Showcase emerging strategies with this mobile-inspired layout perfect for social media and online marketing updates. The clean design highlights trends like SEO, influencer marketing, and content innovation with clarity. Fully customizable and compatible with PowerPoint, Keynote, and Google Slides.


10 diapositivas
Logistics and Procurement Supply Chain
Streamline your supply chain narrative with this clean, visual timeline layout. Perfect for operations managers, logistics planners, or procurement leads, this slide breaks down each stage of the supply chain process with color-coded segments and intuitive icons. Fully editable in PowerPoint, Keynote, and Google Slides.


6 diapositivas
Legal Compliance and Business Law Presentation
The Legal Compliance and Business Law template elegantly demystifies the complexity of legal compliance, showcasing essential aspects like regulations, law, legal systems, rules, standards, and requirements in an interconnected format. Ideal for presentations that require clear and concise delivery of compliance strategies. This template is compatible with PowerPoint, Keynote, and Google Slides.


20 diapositivas
Illumira Design Proposal Presentation
Impress clients with this modern and professional design proposal presentation template. It covers key sections such as project summary, objectives, budget breakdown, and action plans. Fully customizable with clean layouts and engaging visuals, perfect for showcasing your design solutions effectively. Compatible with PowerPoint, Keynote, and Google Slides.


2 diapositivas
Creative Gratitude Slide
Wrap up your presentation with impact using this clean, modern “Thank You” slide. Featuring space for a photo, contact details, and playful design elements, it's perfect for leaving a lasting impression. Ideal for business proposals, pitch decks, and educational slide decks. Fully editable in PowerPoint, Keynote, and Google Slides.


6 diapositivas
Event Planning Agenda Presentation
Organize every detail with the Event Planning Agenda Presentation. Featuring a 6-step layout styled like a calendar, this template clearly outlines each agenda point with vibrant blocks and icons for visual impact. Ideal for conferences, workshops, or launches. Fully editable in PowerPoint, Keynote, and Google Slides.


5 diapositivas
Scientific Research Data Presentation
Bring your research to life with a clean, dynamic layout designed to simplify complex findings and highlight key scientific insights. This presentation offers a structured flow for showcasing data, experiments, or results in a clear and engaging way. Fully compatible with PowerPoint, Keynote, and Google Slides.


7 diapositivas
Mind Map Infographic Presentation Template
A mind map is a diagram that allows you to visualize how related ideas and concepts are connected to one another. It is especially good for brainstorming, planning and organizing. A mind map allows you to organize information in a way that shows your thinking process and gives you the opportunity for deeper understanding. This template will help others understand how you think about a particular subject or topic. Use this template to "brainstorm" a topic, and create an interesting mind map. You can also use it to share your ideas with others, or to visually organize your thoughts.


7 diapositivas
Concentric Circles for Data Representation Infographic
Visualize the hierarchy and relationship of your data with our Concentric Circles Infographic, an invaluable tool for data analysts, strategic planners, and educators. This infographic is designed to represent complex data in an organized, easily interpretable format. Our Concentric Circles Infographic offers a multi-layered approach to data presentation, showcasing the interconnection between different levels of information. It's perfect for displaying structures such as organizational hierarchies, market segmentation, or product feature breakdowns. Customize this infographic to highlight core elements and their dependencies or to showcase the ripple effect of central policies on various organizational branches. This SEO-friendly infographic is crafted to make your data stand out and to facilitate a quick understanding of intricate systems. Employ our Concentric Circles Infographic to bring clarity to your data, making it an insightful resource for reports, presentations, and educational materials.


10 diapositivas
Competitive Advantage Through Value Chain Presentation
Gain a Competitive Edge with Strategic Value Chain Optimization! This Competitive Advantage Through Value Chain presentation template is designed to help businesses map, analyze, and enhance their value chain for increased efficiency and profitability. Featuring a structured layout with dynamic elements, this template allows you to showcase key business activities, identify strengths, and optimize processes for sustainable competitive advantage. Perfect for consultants, business strategists, and executives, this template is fully editable and compatible with PowerPoint, Keynote, and Google Slides for seamless customization.


6 diapositivas
Editable Puzzle Infographic
Piece together complex data with our Editable Puzzle Infographic, compatible with Powerpoint, Google Slides, and Keynote. This engaging infographic is designed to help presenters visually connect different pieces of information in a cohesive and understandable way. The puzzle pieces are a metaphor for how individual components fit into a larger strategy or concept, making it perfect for collaborative projects or educational models. The infographic is fully customizable, allowing you to adapt the colors, text, and arrangement to fit your specific needs. With this puzzle infographic, you can make your presentations more interactive ensuring your audience can see the big picture every time.


7 diapositivas
Customer Success Journey Infographic
A customer journey infographic is a visual representation of your customer's experience with your company. It can help you gain insight into where they're struggling and how they feel about your product or service. This infographic template will help you understand the top factors that influence your customers' decisions, including the most common problems they face. With this template you'll also learn how their behaviors change over time—and how to structure marketing campaigns that stay with them throughout their journey. Fully customizable and compatible with Powerpoint, Keynote, and Google Slides.


21 diapositivas
Dreamwood Sales Pitch Deck Presentation
Deliver powerful sales presentations with this vibrant and engaging sales pitch deck template! It provides all essential sections, including sales objectives, customer testimonials, pricing strategy, and performance metrics, to help you leave a lasting impact. Perfect for business teams and client pitches, it’s compatible with PowerPoint, Keynote, and Google Slides for seamless customization.


20 diapositivas
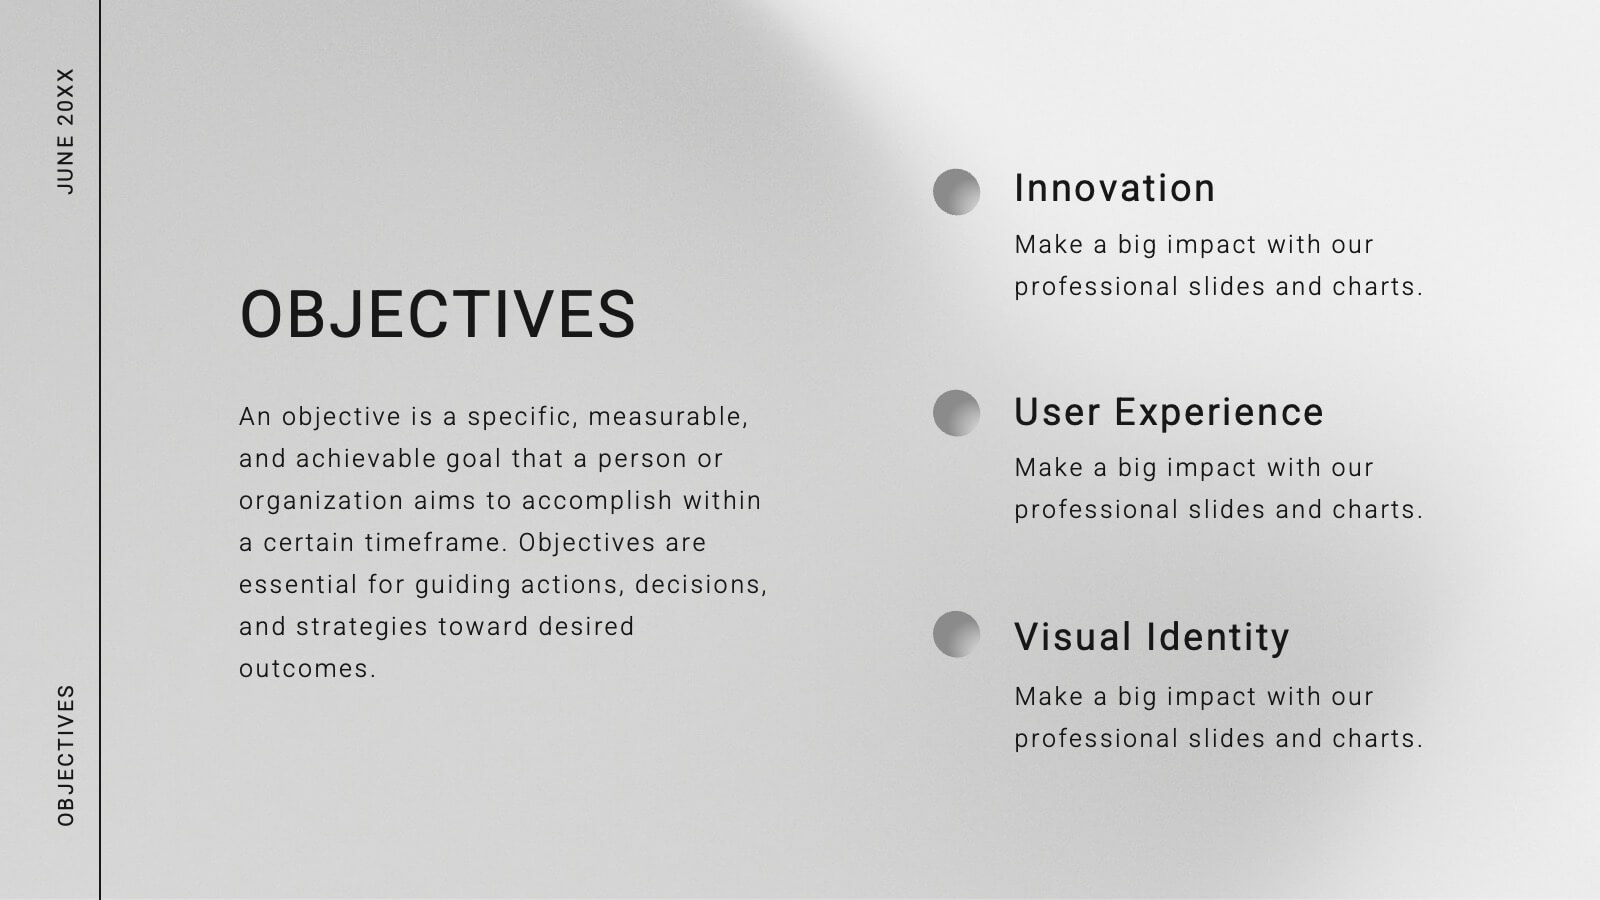
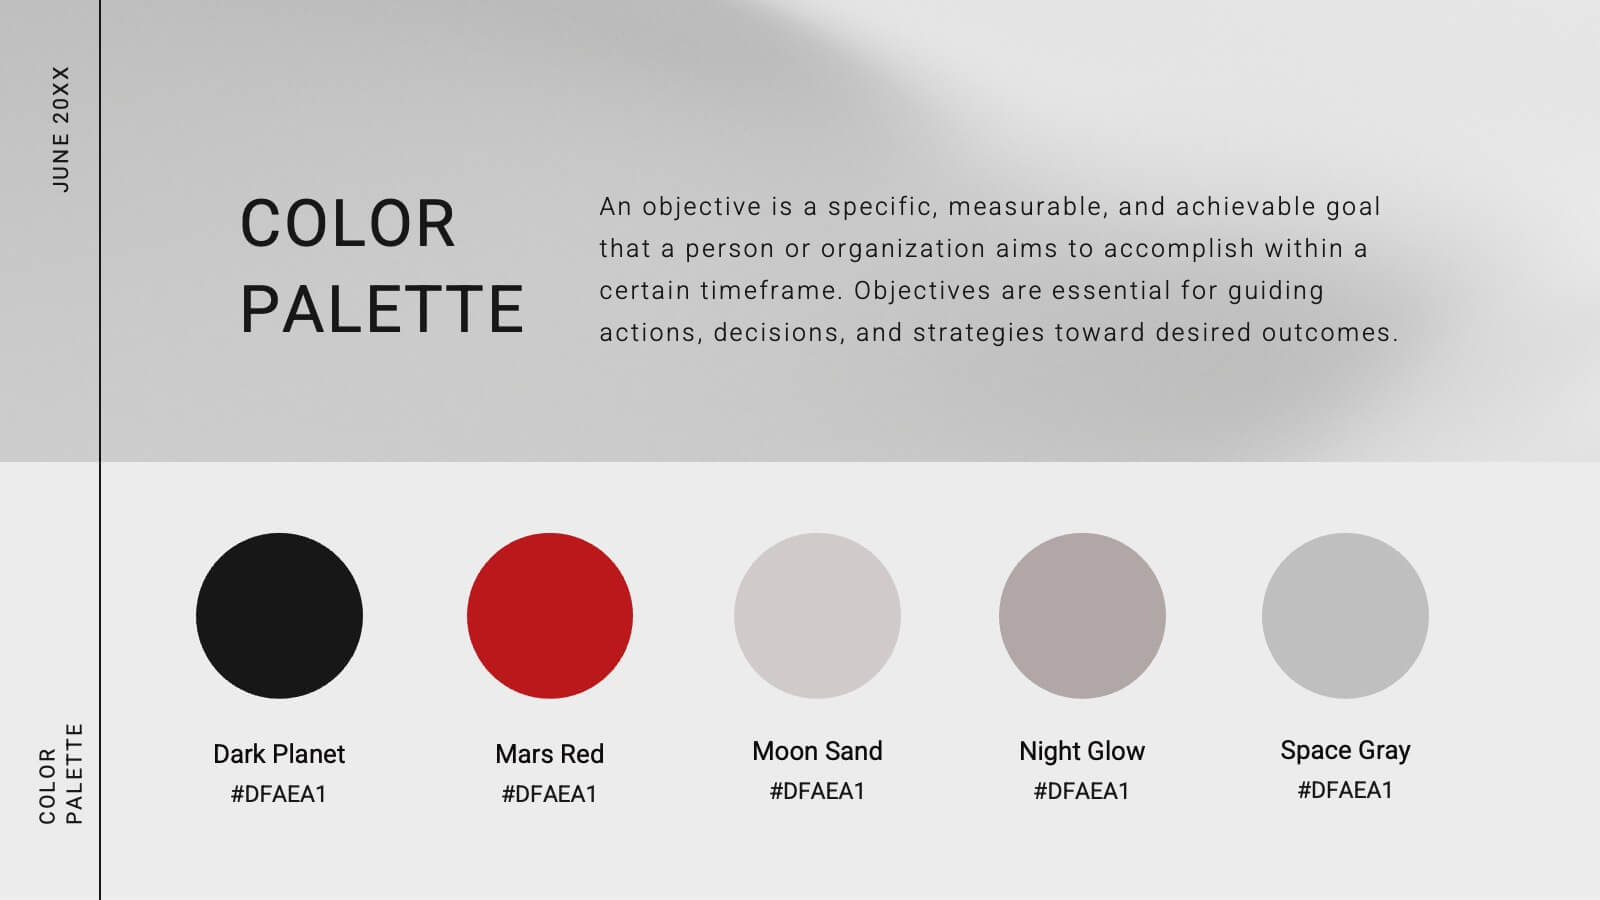
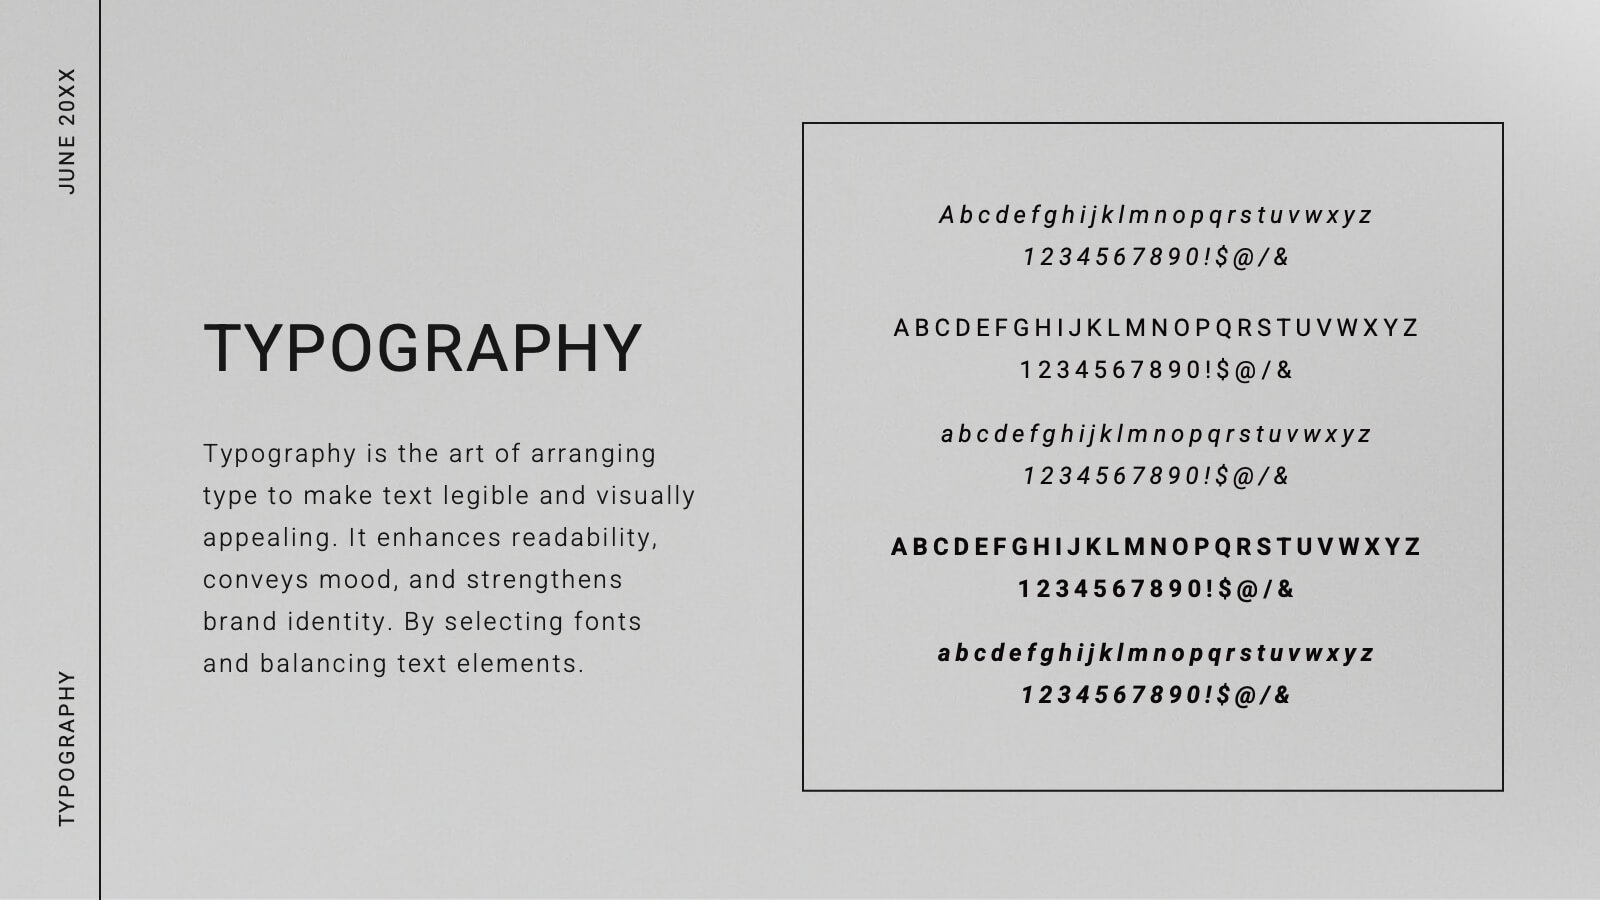
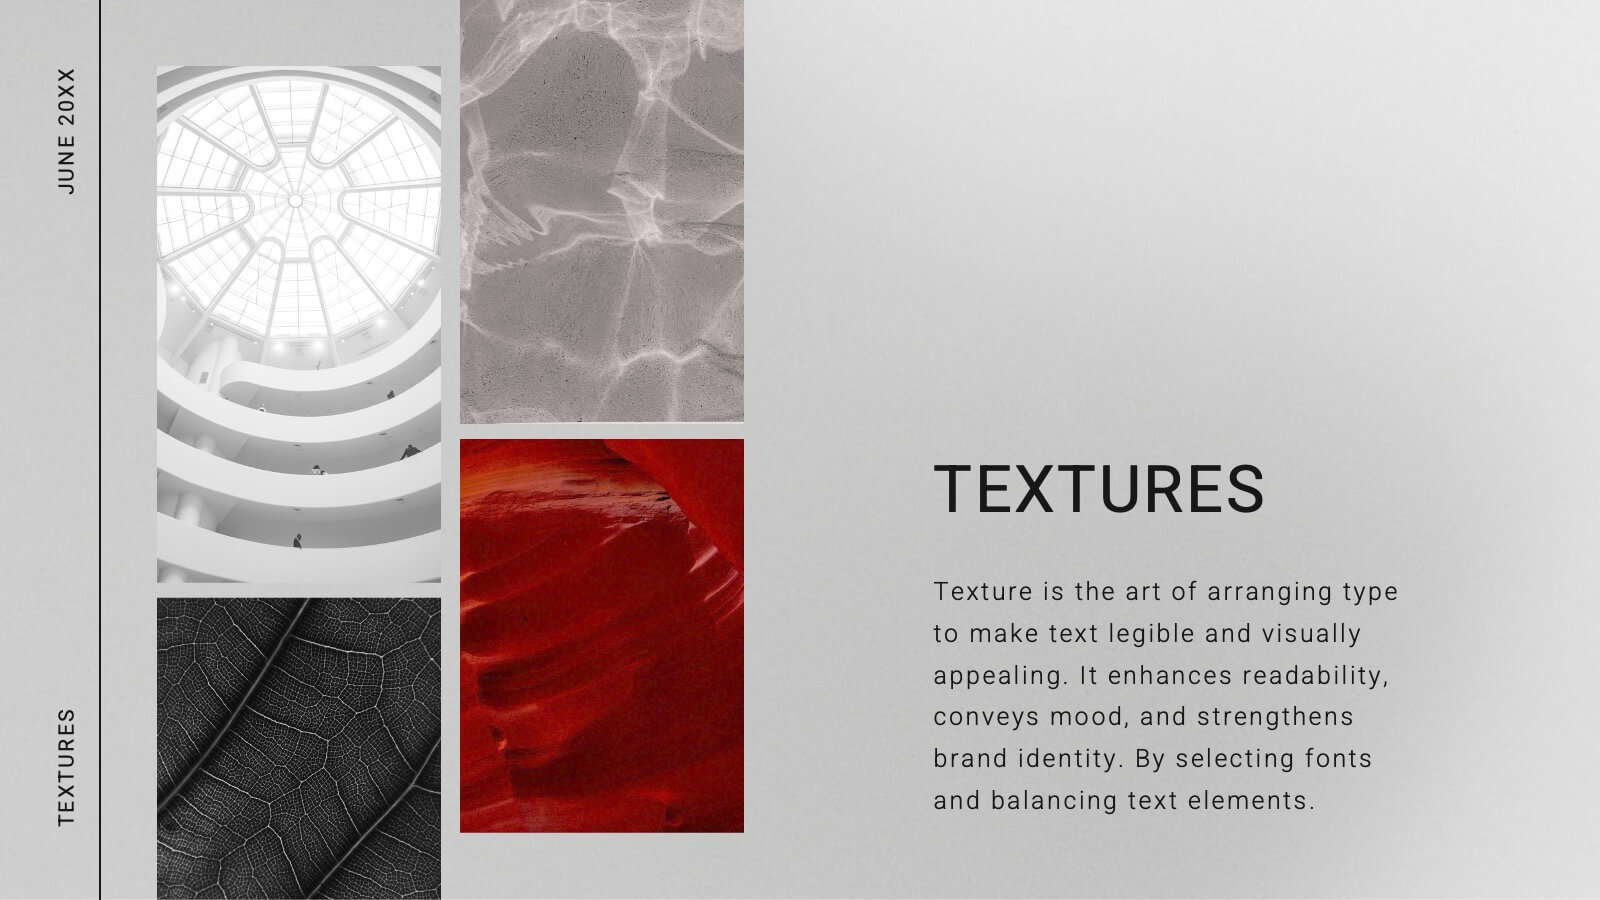
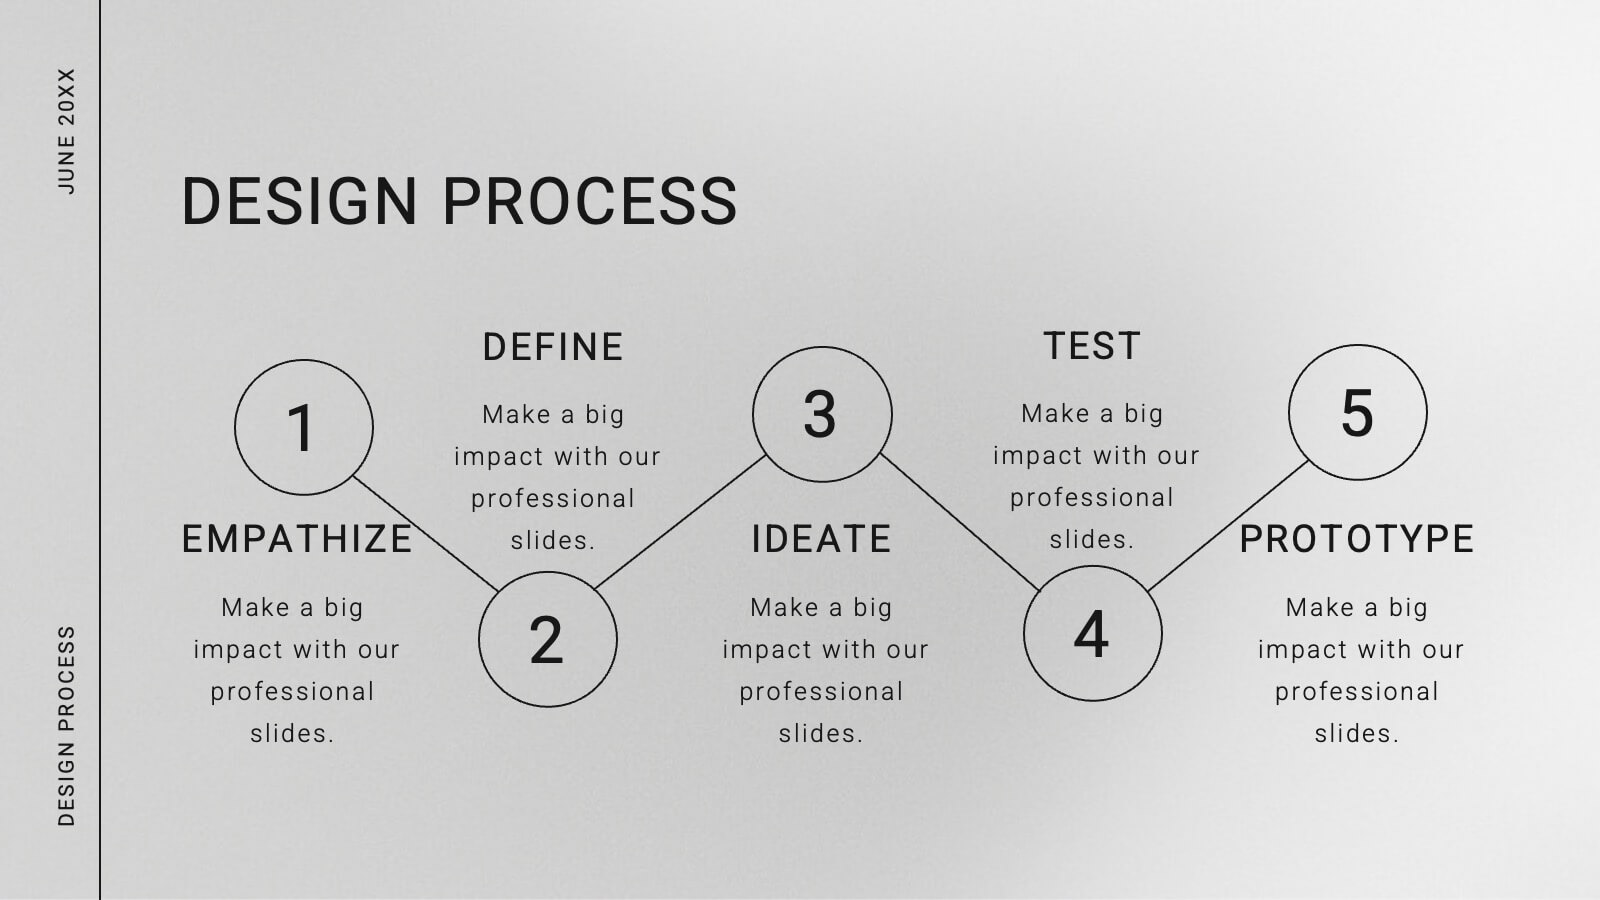
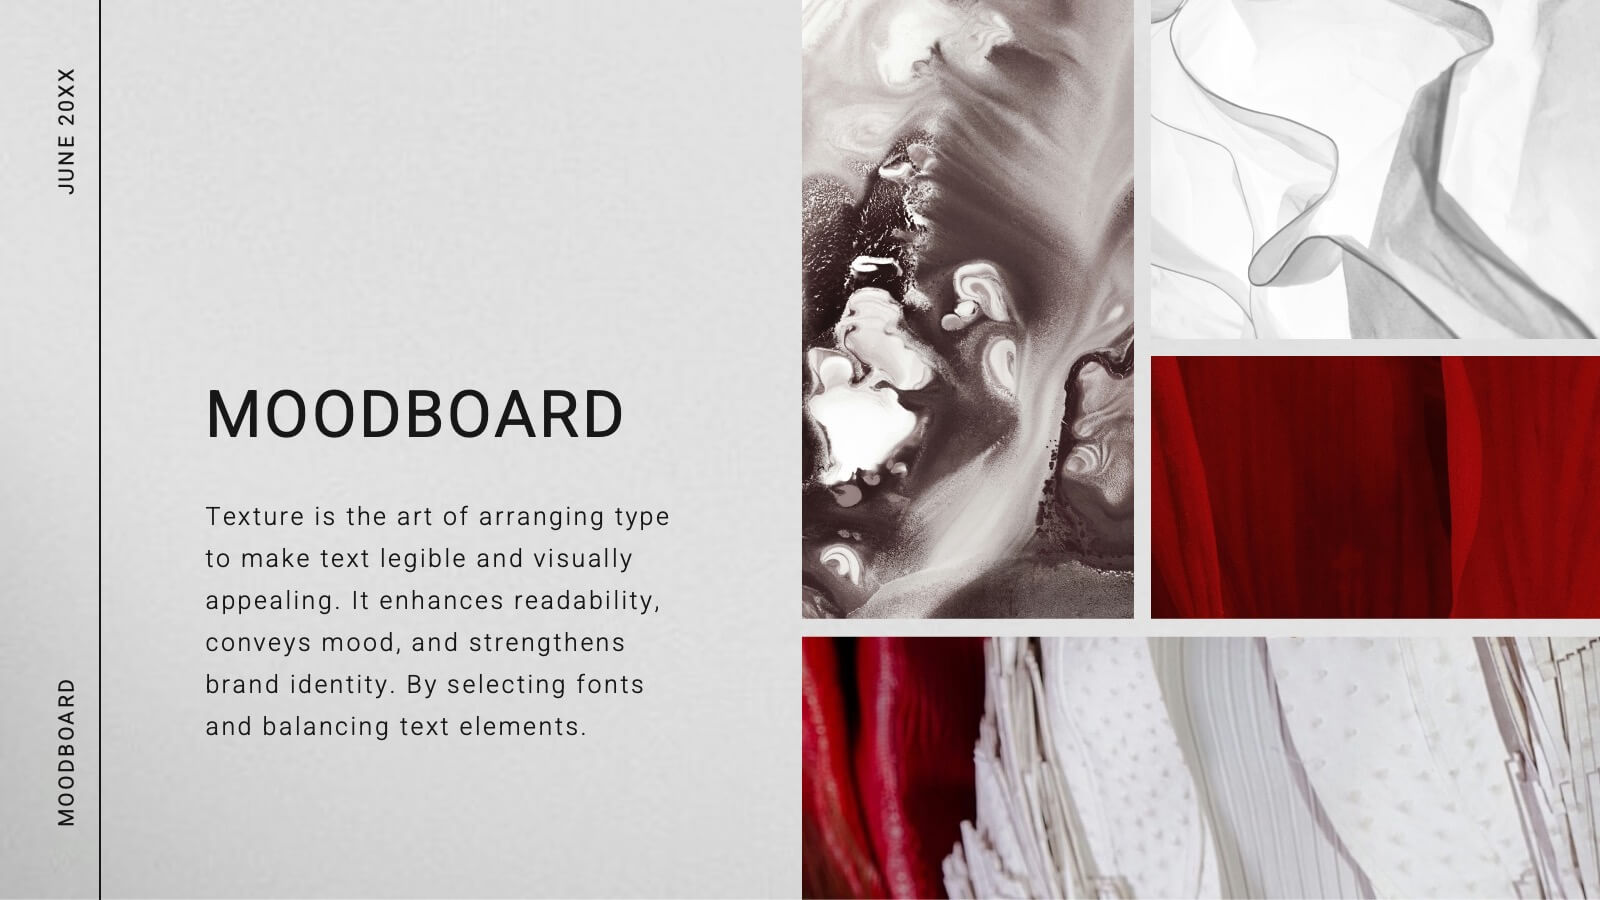
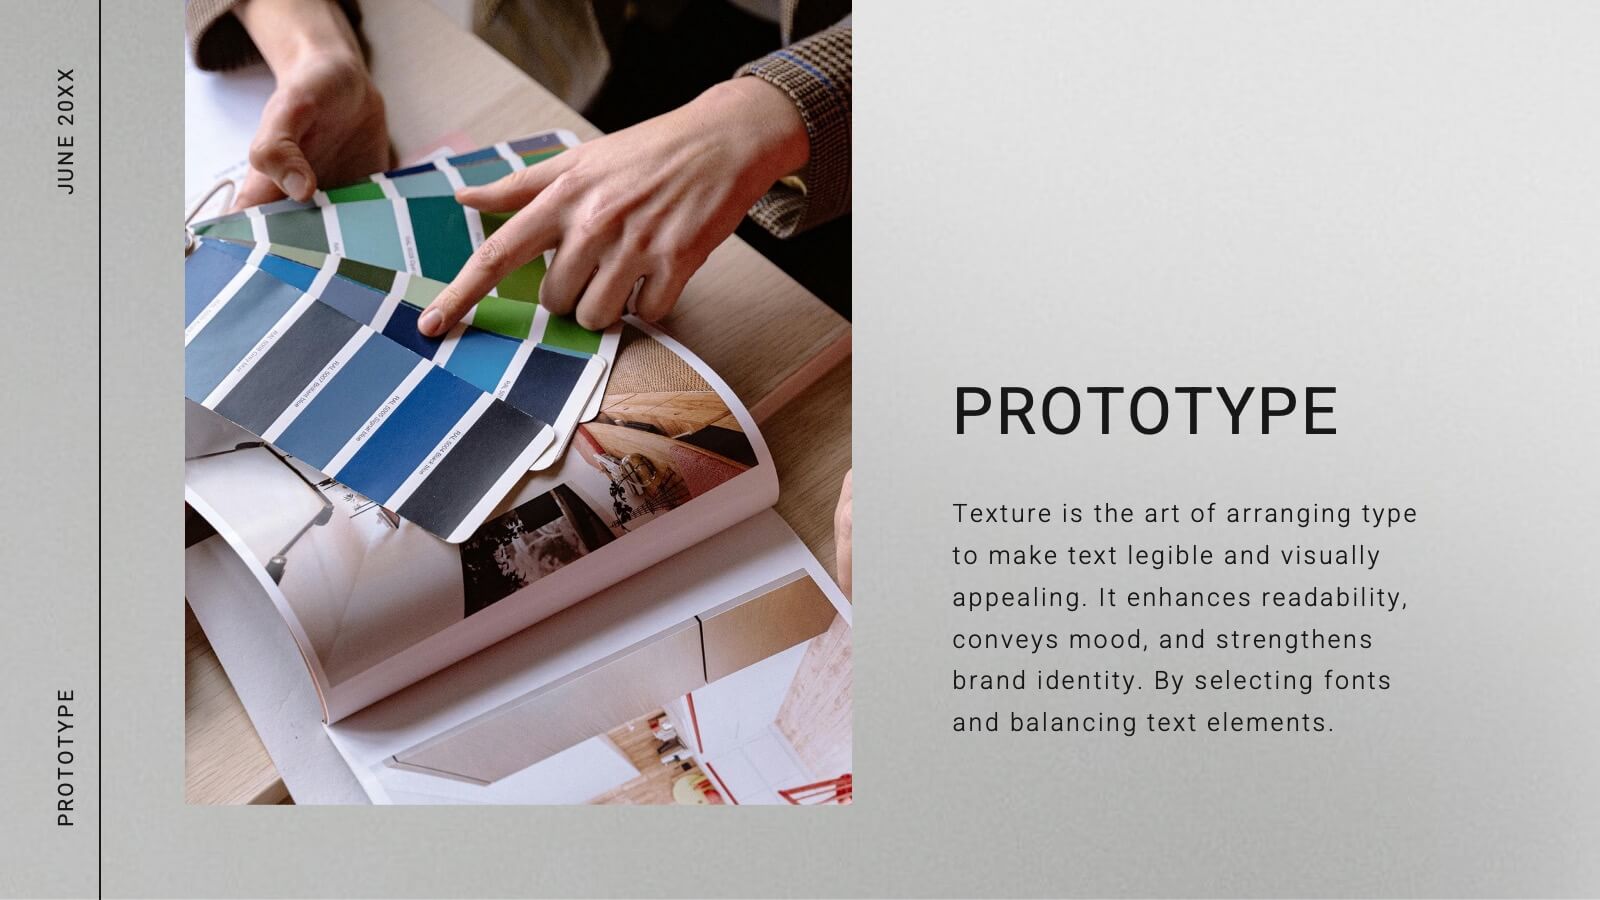
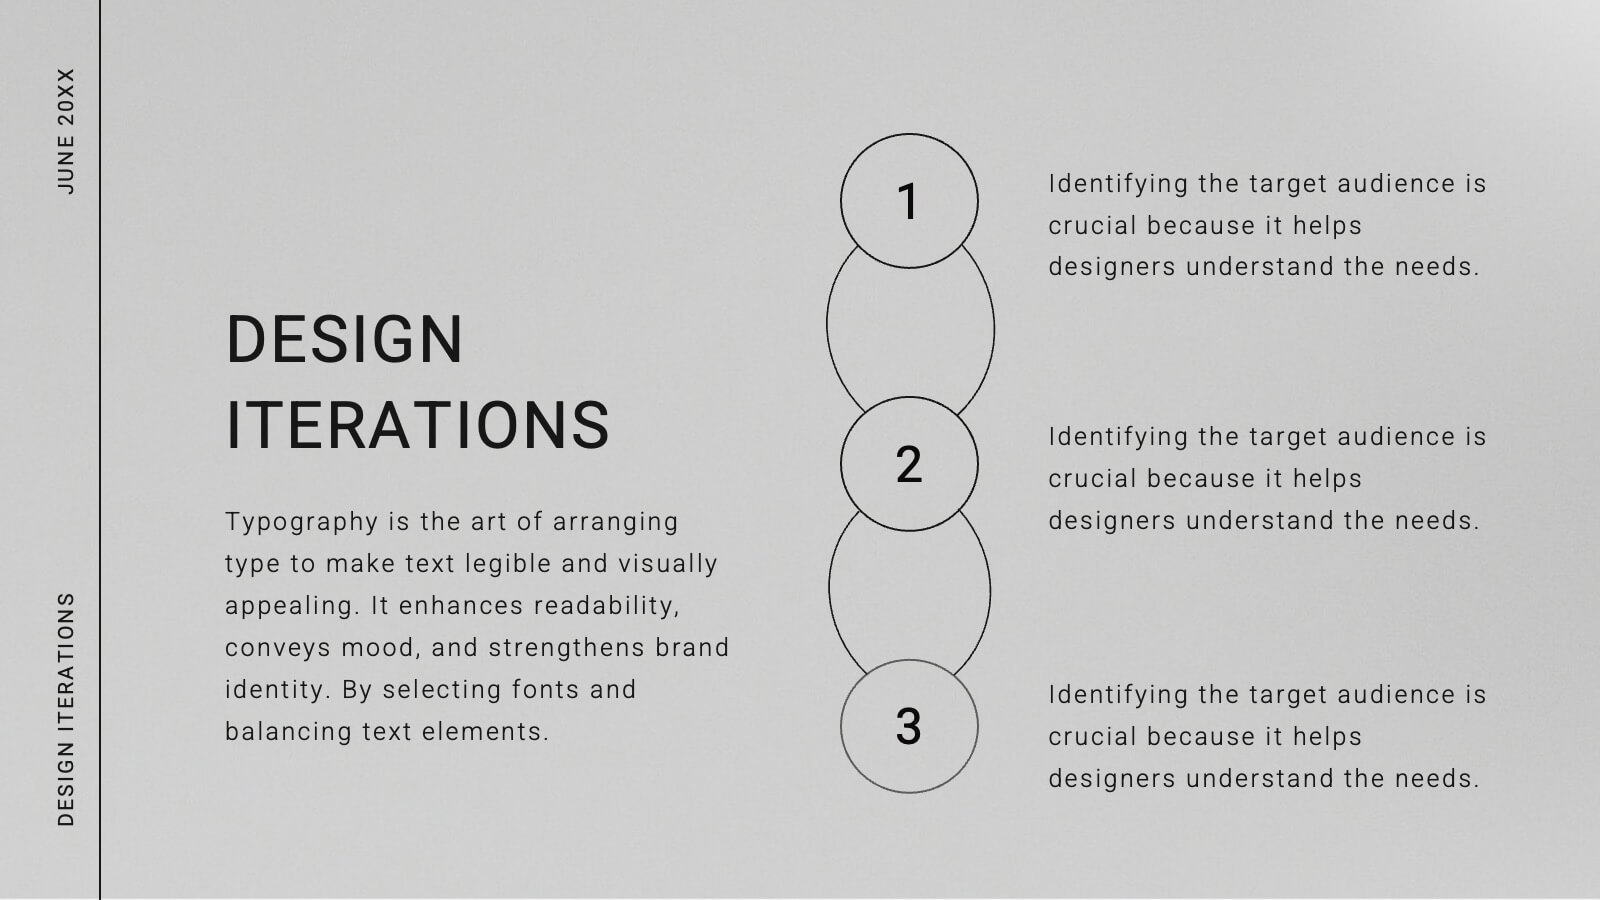
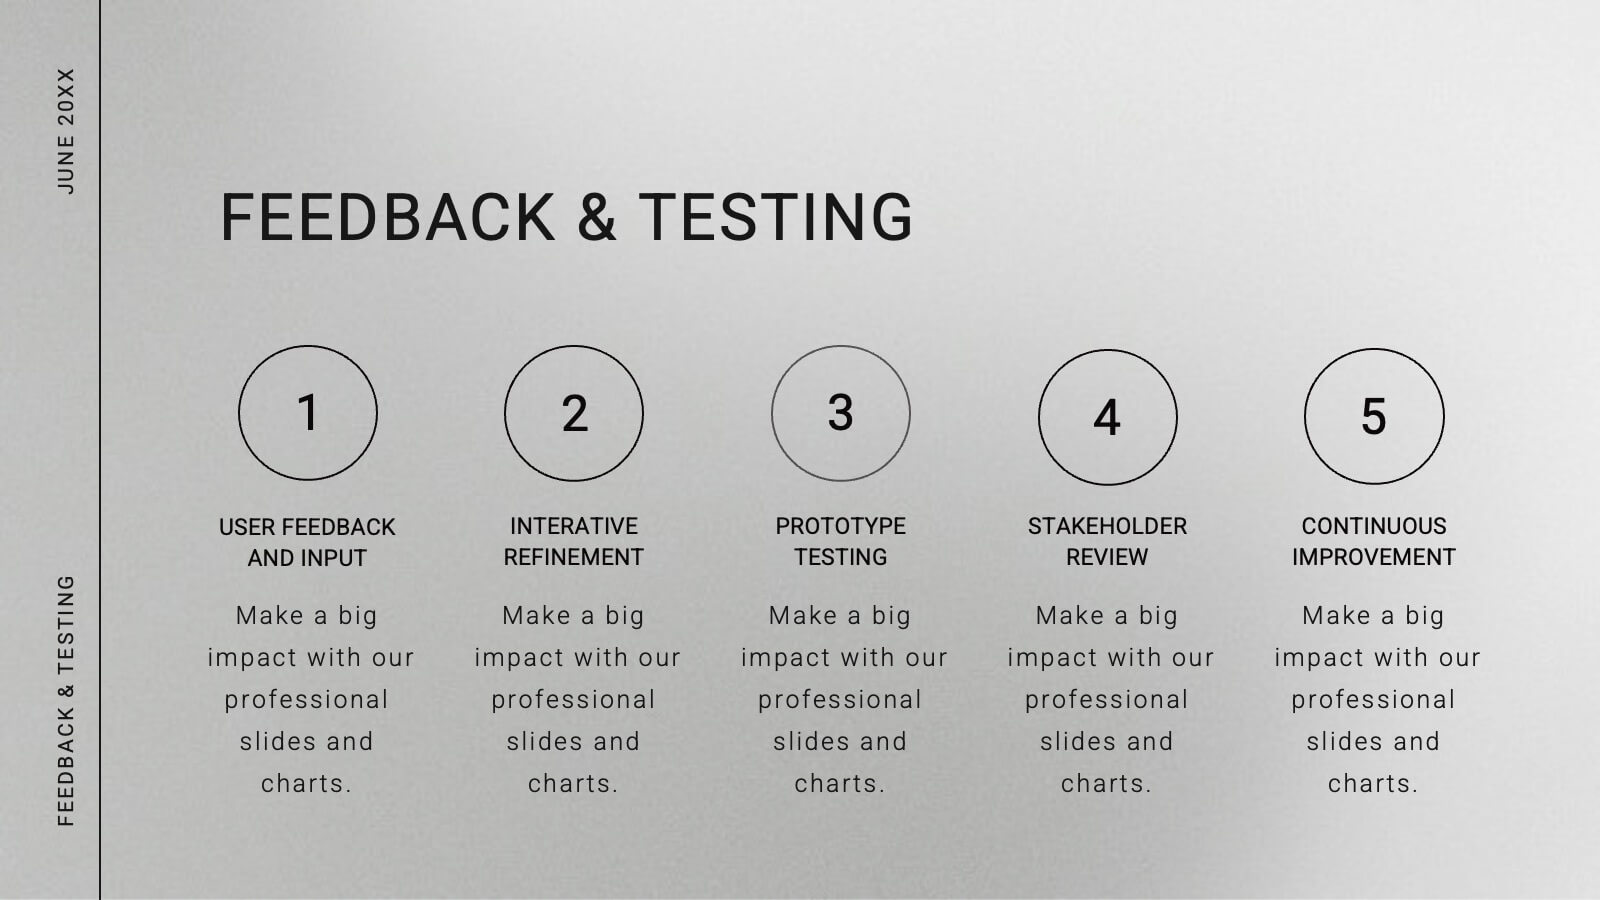
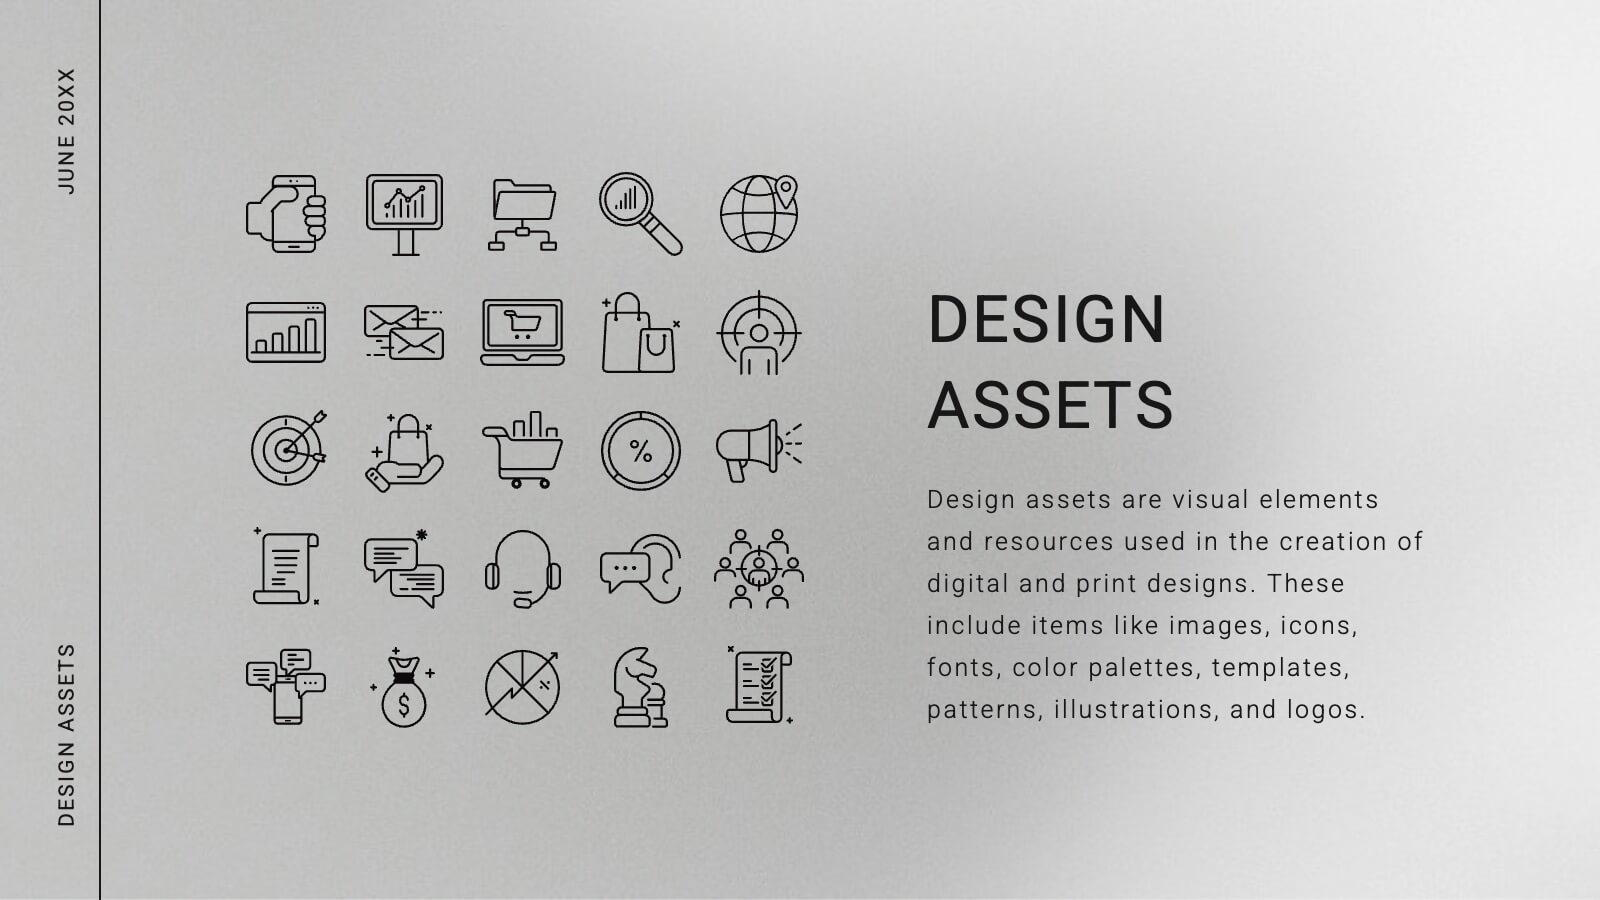
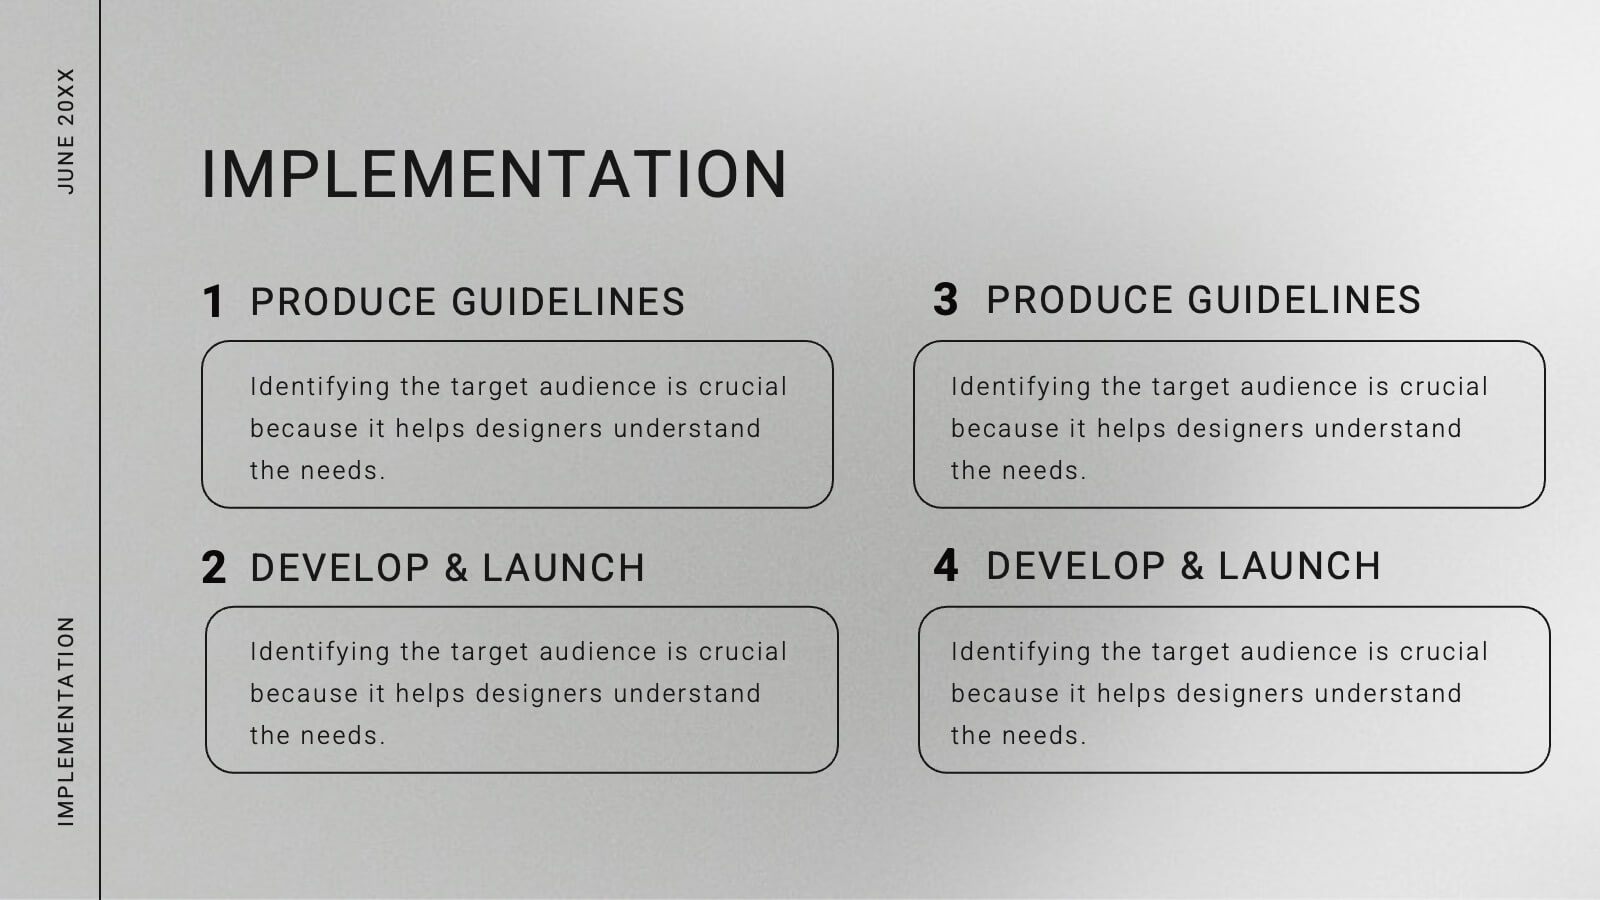
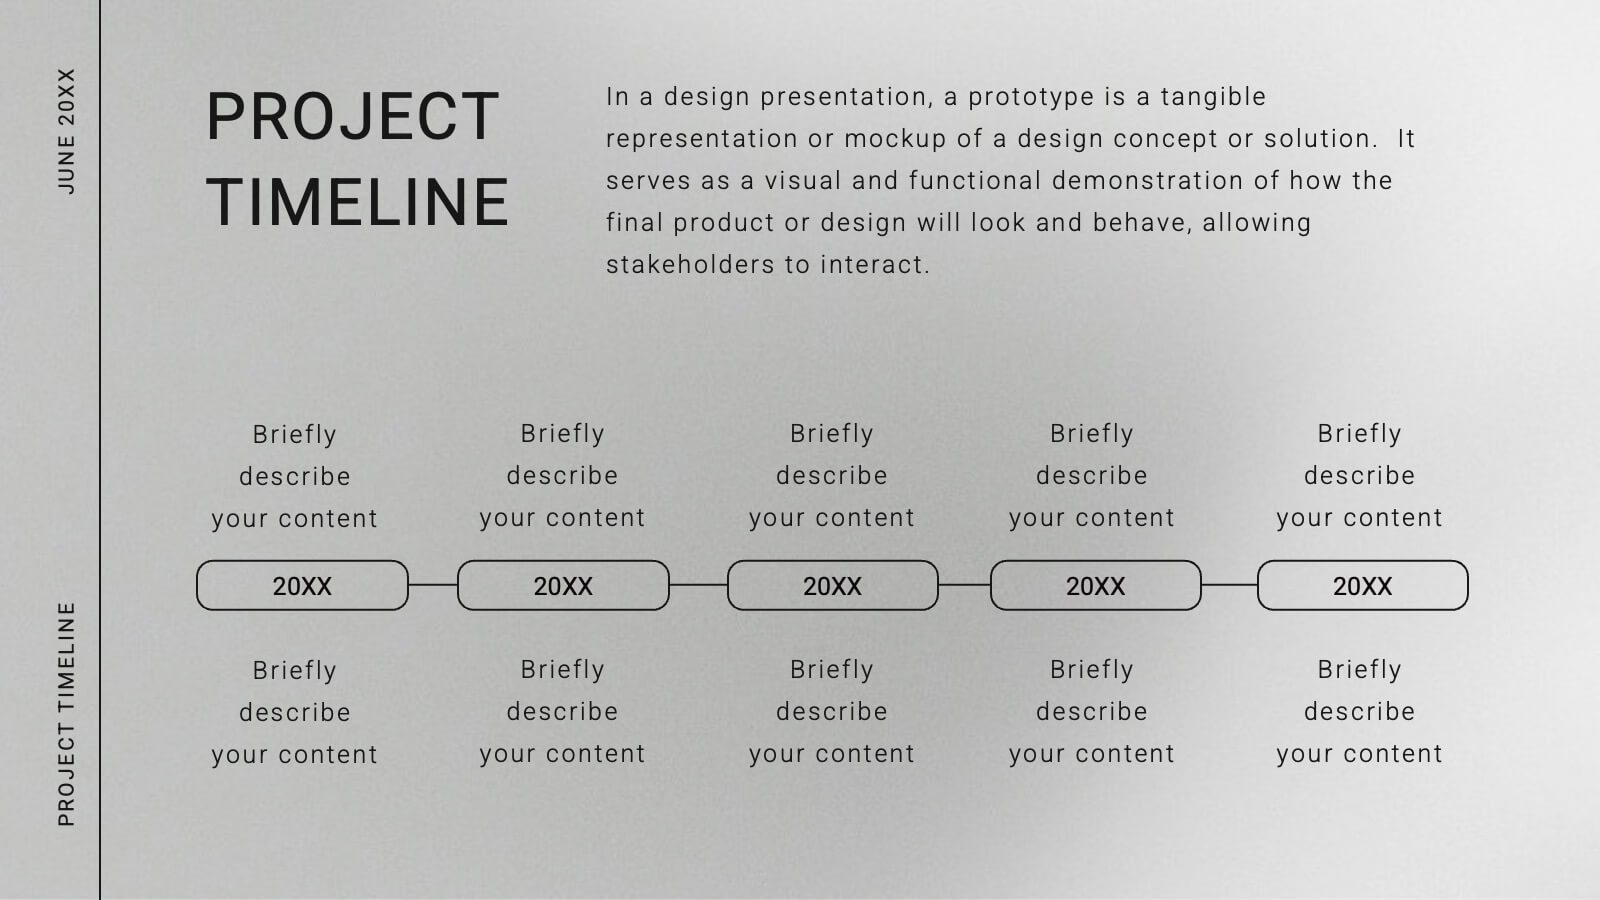
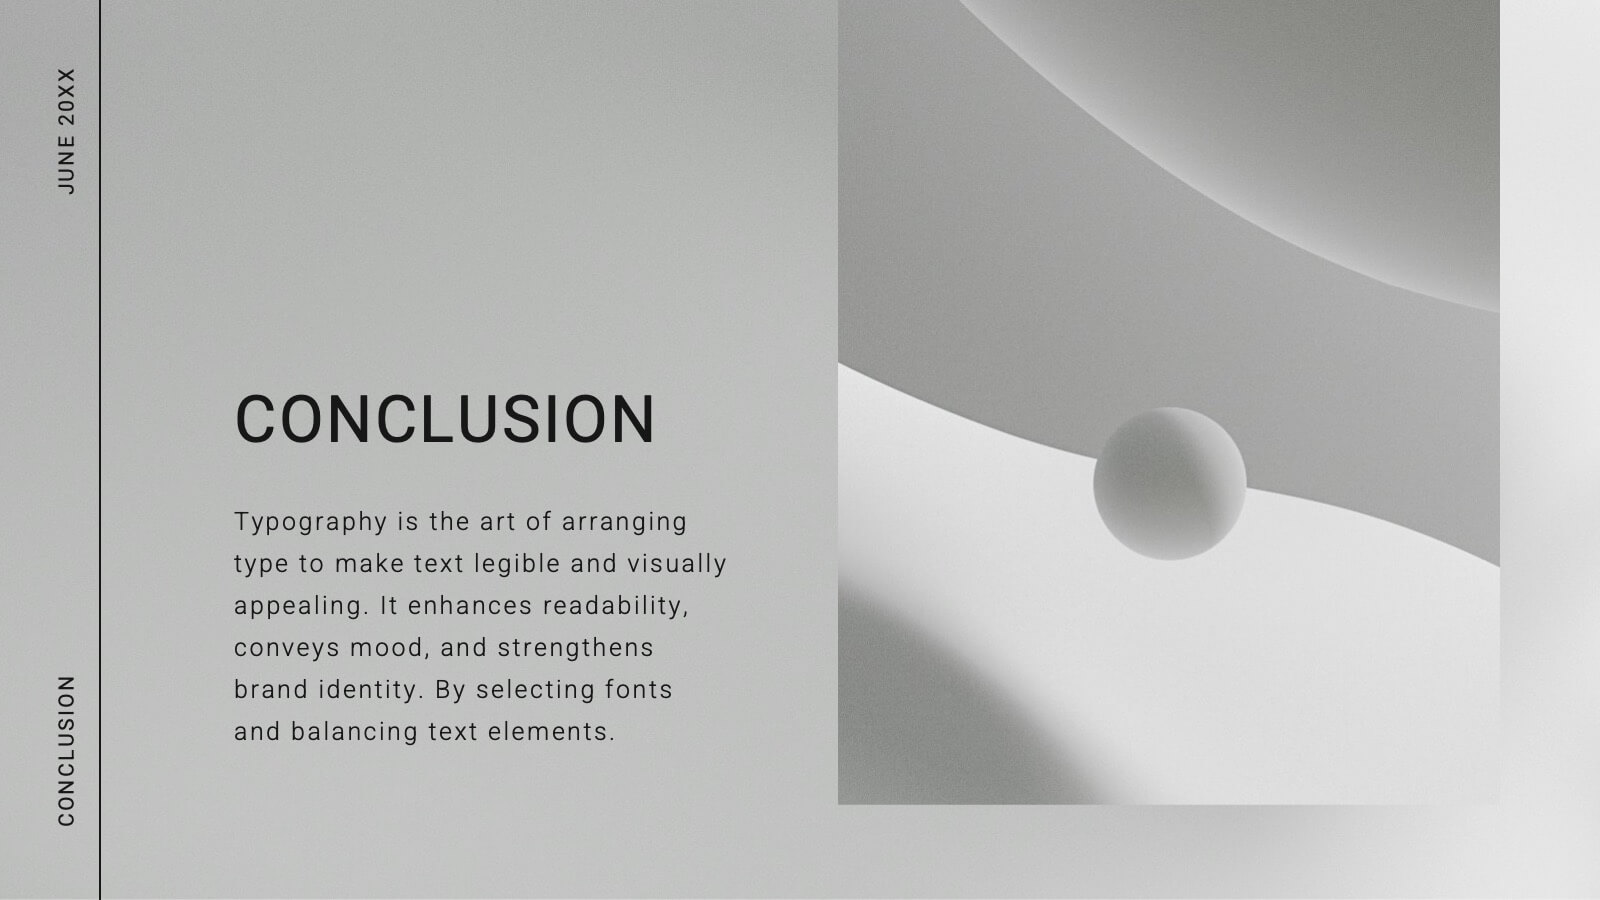
Comet Graphic Design Project Plan Presentation
Craft stunning design project presentations with this elegant template. Showcase objectives, processes, mood boards, and final designs effectively. Ideal for creative teams and clients. Fully compatible with PowerPoint, Keynote, and Google Slides.