


Características


¿Tienes alguna pregunta?
Recomendar


6 diapositivas
Supply Chain Management Infographics
Elevate your presentation with our Supply Chain Management template, designed for clarity and impact. The slides are a blend of professional and engaging visuals, perfect for showcasing the intricacies of supply chain operations. Ideal for professionals and educators, they simplify complex logistics concepts into understandable visuals. The design is clean, making it perfect for business presentations that need to convey detailed processes and strategies effectively. With these slides, you're equipped to deliver a powerful message about the importance of streamlined supply chain management.


4 diapositivas
Europe Market Expansion Visualization Presentation
Showcase your European growth strategy with the Europe Market Expansion Visualization Presentation. This map-based slide design allows you to clearly highlight regional opportunities, new market entries, and key expansion zones using icons and color-coded country markers. Ideal for strategic planning, investor updates, and sales overviews. Fully editable in PowerPoint, Keynote, Google Slides, and Canva.


7 diapositivas
Mental Agility Training Infographic
Embark on the enlightening path of training with our intricately designed mental agility training infographic. Illuminated by the motivation of yellow, the growth of green, and the depth of blue, our template effectively outlines training methodologies and outcomes. Adorned with precision-focused infographics, intuitive icons, and adaptable image placeholders, it renders complex training data into an easily digestible format. Expertly sculpted for Powerpoint, Keynote, or Google Slides. A quintessential tool for trainers, HR professionals, or any organization aiming to elevate its training regimen. Enlighten your audience; let every slide be a step towards mastery.


6 diapositivas
Business Calendar and Monthly Overview Presentation
Bring structure to your chaos with a bold and colorful visual planner! This easy-to-use layout helps track tasks, deadlines, or projects across multiple months in one glance. Ideal for team coordination or solo planning. Fully editable and compatible with PowerPoint, Keynote, and Google Slides for seamless calendar-based presentations.


3 diapositivas
Cost-Benefit Analysis and Strategic Outcomes Presentation
Present trade-offs with clarity using the Cost-Benefit Analysis and Strategic Outcomes Presentation. Designed with visual balance scales and segmented callouts, this layout helps you compare investments versus returns, making complex decisions easier to explain. Ideal for proposals, audits, or business strategy reviews. Fully editable in PowerPoint, Keynote, and Google Slides.


3 diapositivas
Company Mission and Core Values Presentation
Present your brand’s purpose with clarity using this streamlined infographic slide. Divided into three distinct sections—Mission, Vision, and Values—each with icon support and editable text, this layout offers a clean and professional structure for showcasing your company’s guiding principles. Ideal for pitch decks, onboarding, and strategic planning presentations. Fully compatible with PowerPoint, Keynote, and Google Slides.


22 diapositivas
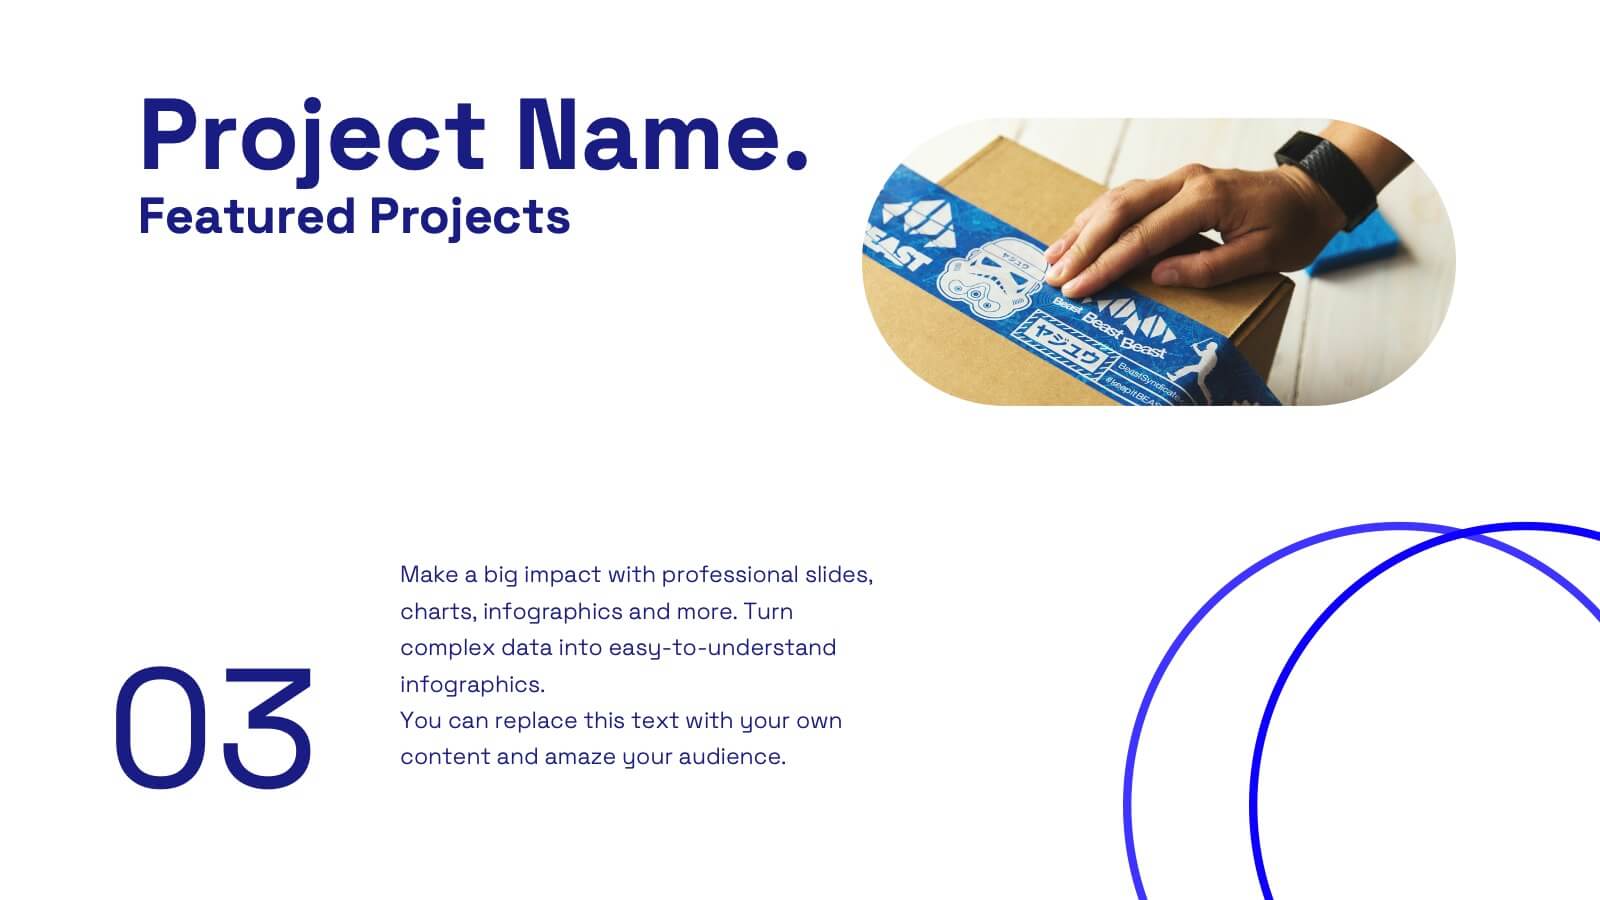
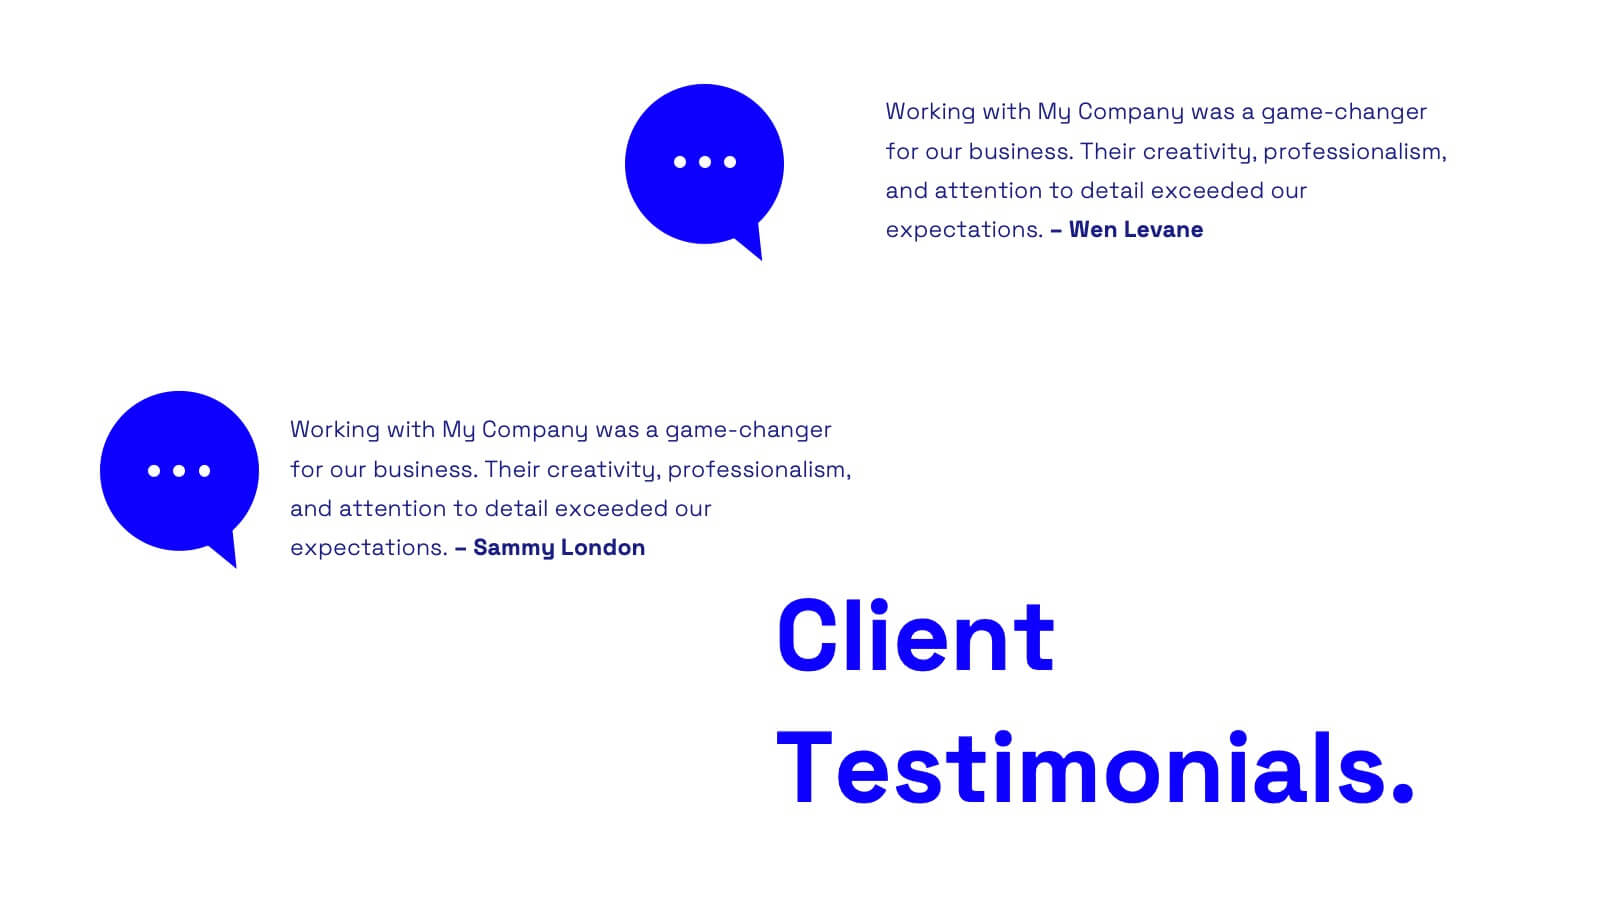
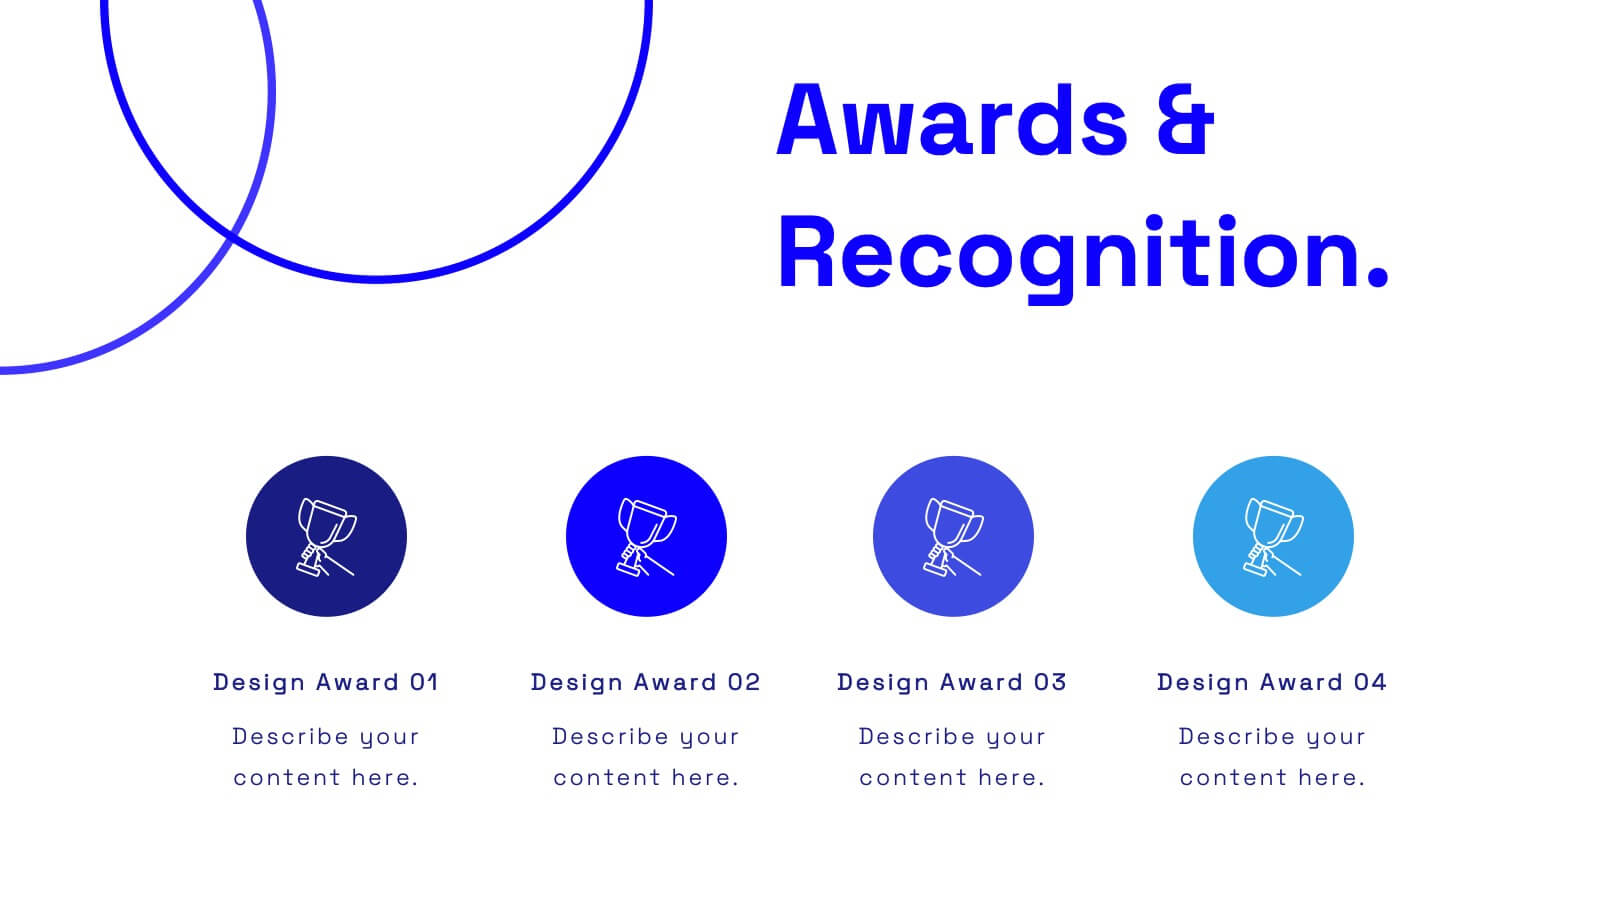
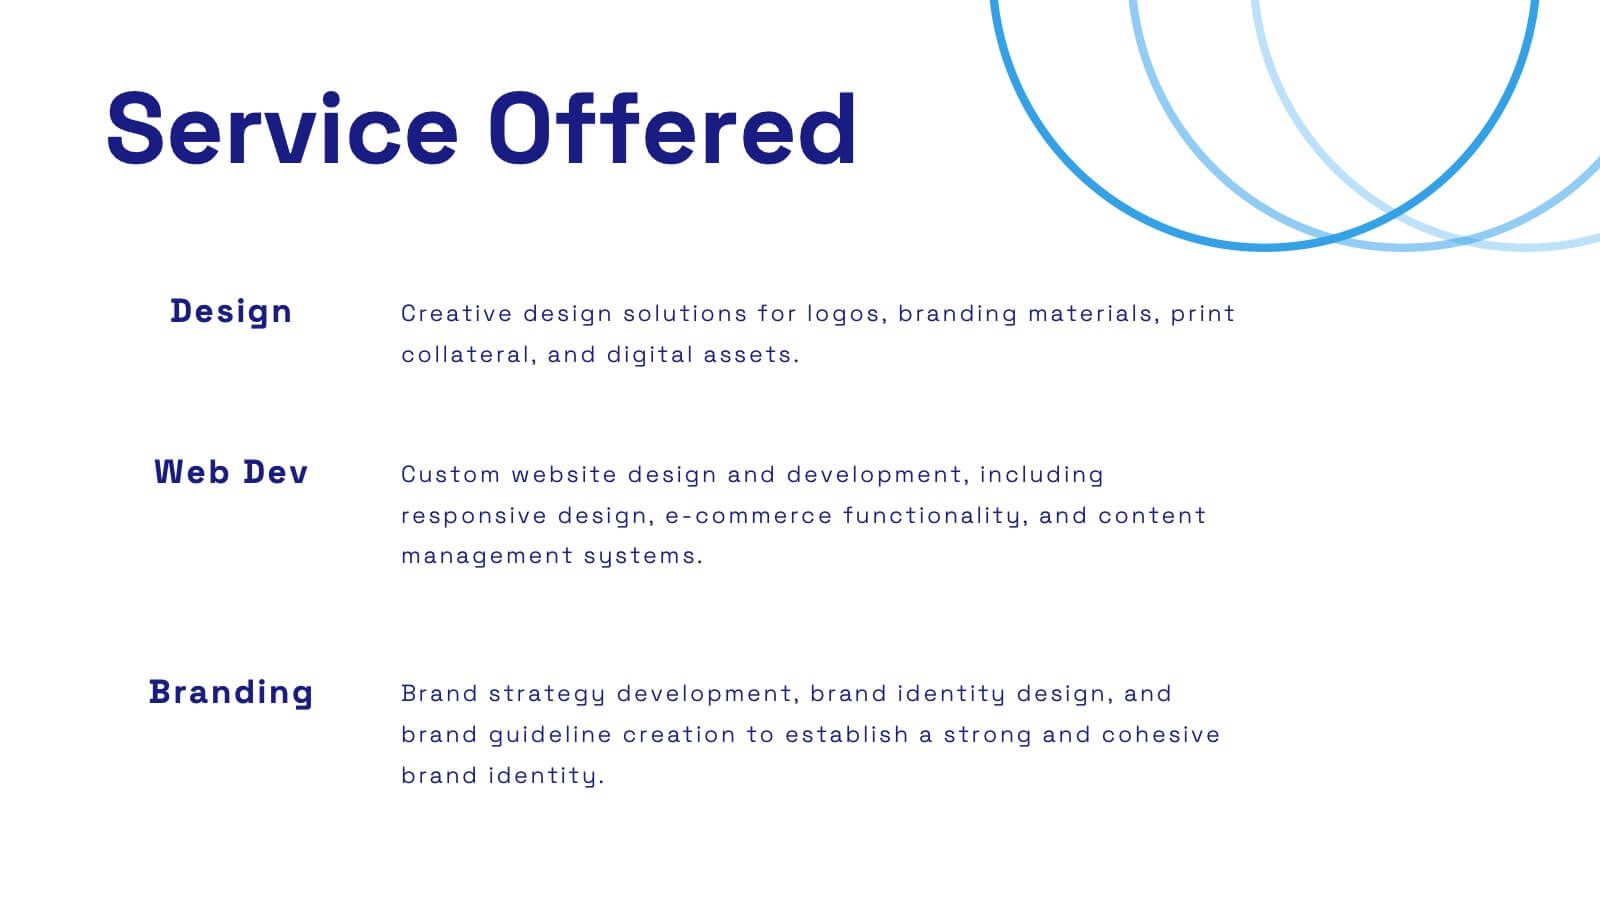
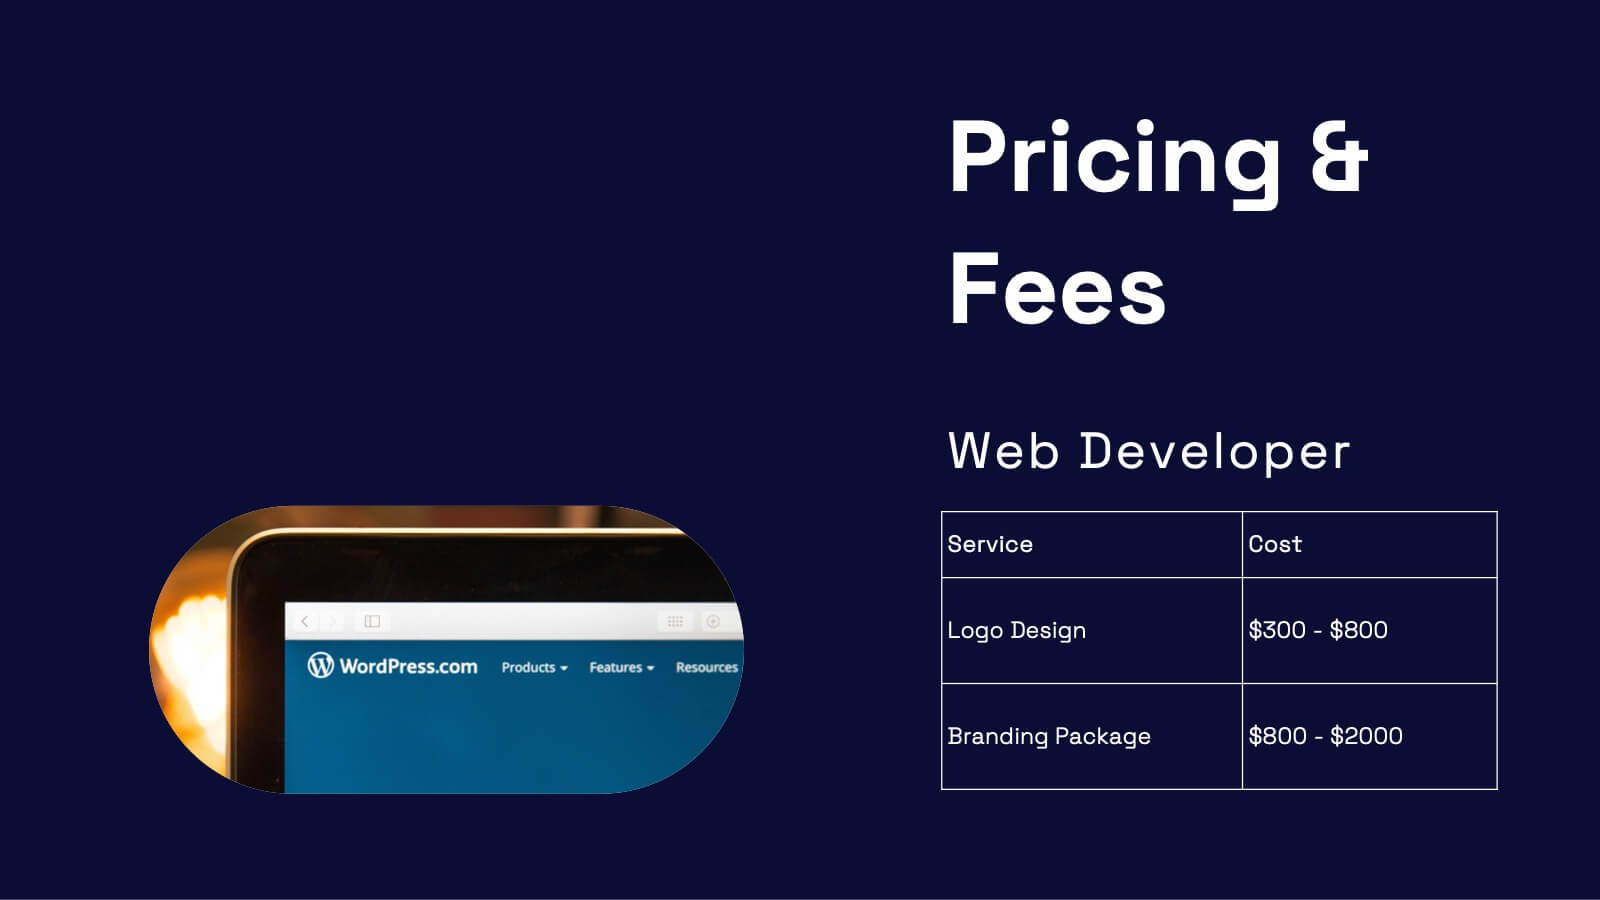
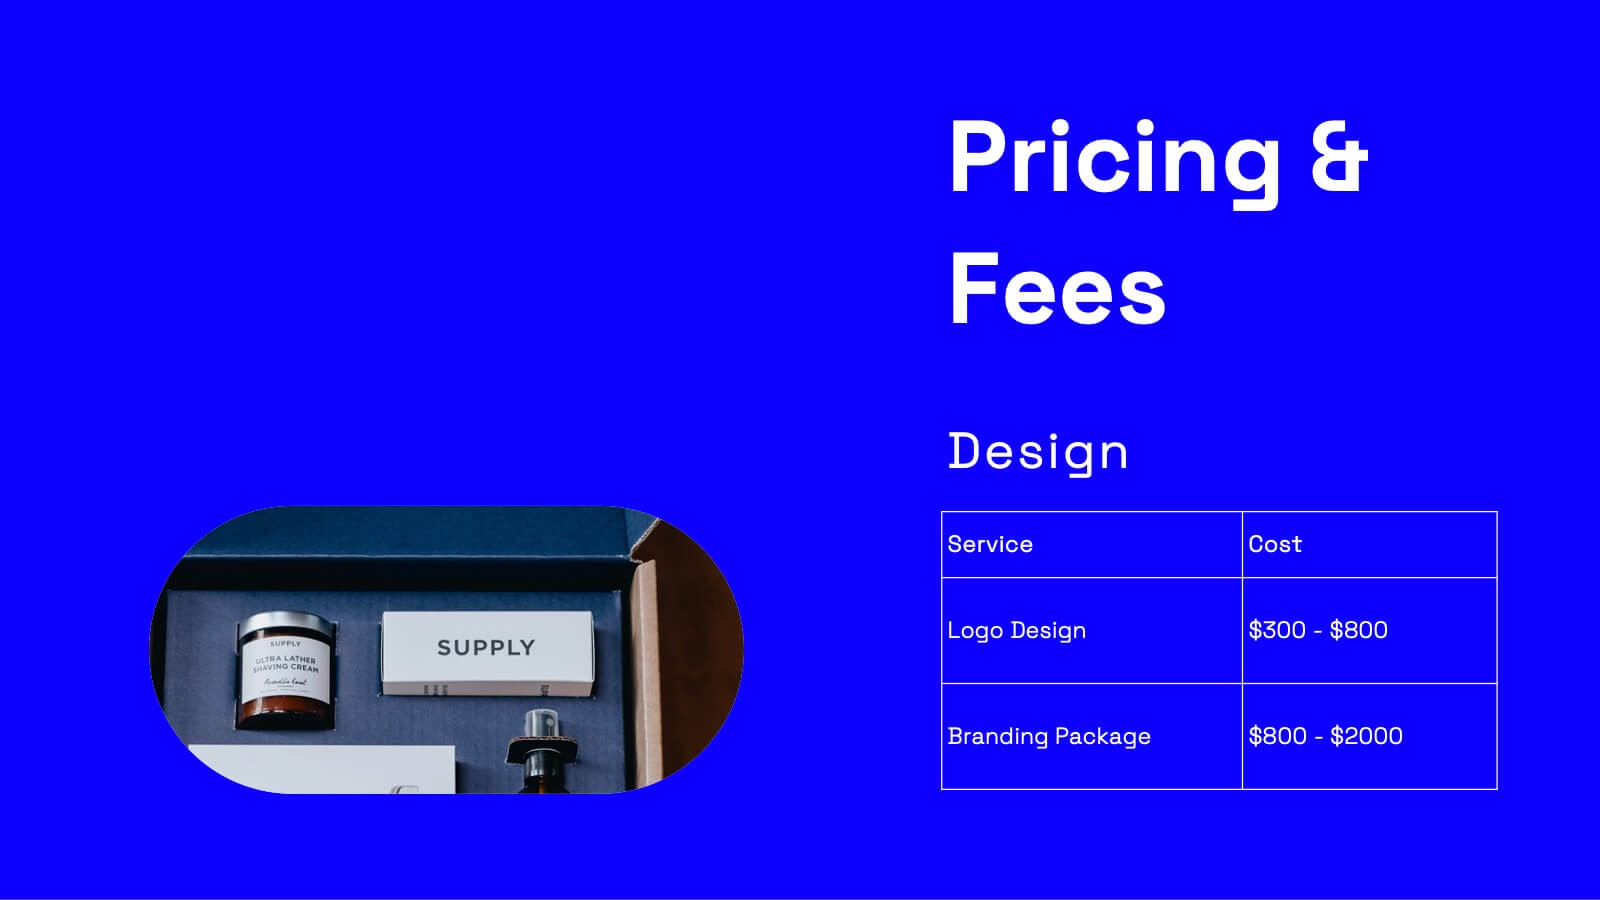
Wanderer Professional Portfolio Showcase Presentation
Showcase your creative work with this sleek, modern portfolio template. Perfect for highlighting your projects, philosophy, and client testimonials, it features a professional design with a dynamic layout. Display your awards, services offered, and pricing clearly to impress potential clients. Compatible with PowerPoint, Keynote, and Google Slides, it ensures seamless presentations on any platform.


5 diapositivas
Employee Benefits and Compensation Presentation
Effectively communicate your company’s value proposition with this Employee Benefits and Compensation Presentation. This clean and professional diagram highlights four key benefit categories in a circular flow, perfect for HR teams, onboarding materials, or internal strategy reviews. Easily editable in PowerPoint, Keynote, or Google Slides, it's ideal for showcasing wellness perks, bonuses, insurance, and more.


7 diapositivas
Lean Startup Strategy Presentation
Present your investment strategy with clarity and impact using this triangle diagram slide. Ideal for showcasing the relationship between key funding stages, investor types, or business milestones, this layout offers a clean structure with labeled nodes (A, B, C) and supporting icons. Fully editable in PowerPoint, Keynote, and Google Slides for seamless customization.


20 diapositivas
Ignisiel Sales Performance Report Presentation
Present your sales performance insights with a bold and professional edge using this dynamic presentation template. Designed to highlight every critical aspect of your sales achievements, it features slides for company introductions, service overviews, and target market analysis. Dive deeper into your success with sections on sales objectives, competitive analysis, and an in-depth performance metrics breakdown. Showcase your team’s efforts with slides for team introductions and build trust through customer testimonials. Financials are made clear with slides for pricing strategies and enticing promotions and discounts. Wrap up your presentation with actionable slides for future opportunities and an organized feedback section to engage stakeholders effectively. Fully customizable and compatible with PowerPoint, Google Slides, and Keynote, this template ensures your message is delivered with clarity and style. Perfect for businesses aiming to make a bold impression.


7 diapositivas
KPI Software Dashboard Infographic
Maximize the effectiveness of your performance analysis with our KPI Software Dashboard infographic, optimized for use in Powerpoint, Keynote, and Google Slides. This dynamic infographic is an indispensable tool for business analysts, project managers, and data-driven professionals seeking to present key performance indicators (KPIs) in an insightful and engaging manner. Our KPI Software Dashboard infographic offers a clear, visual representation of critical data points that influence business decisions. With its diverse array of charts, graphs, and meters, it provides an at-a-glance overview of company performance across various metrics. The design is tailored to enhance readability and comprehension, allowing your audience to quickly grasp complex data trends and patterns. Whether you're reviewing sales figures, monitoring customer satisfaction, or tracking project progress, this infographic is designed to streamline the presentation of your data. The compatibility with popular presentation platforms ensures a smooth integration into your slide deck, making it a breeze to communicate the insights that matter. Utilize this infographic to turn your KPI data into compelling narratives that drive strategic business actions.


14 diapositivas
Pitch Deck Presentation
Craft a compelling narrative for your startup or business proposal with our professionally designed Pitch Deck presentation template. Perfect for entrepreneurs and innovators, this template simplifies conveying your vision to investors and stakeholders. The sleek slides cover all critical aspects of a pitch: from the problem statement, solution, market opportunity, to the business model, and financial projections. Each slide is crafted to facilitate clear and persuasive communication of your ideas. The intuitive layout ensures that your market strategies, competitive analysis, and go-to-market plans are presented with clarity and impact. The templates are seamlessly compatible with PowerPoint, Keynote, and Google Slides, providing flexibility and ease of use across platforms. With our Pitch Deck template, you’re equipped to make a lasting impression that could propel your business to success. Make your data-driven points with confidence, backed by our engaging design that's primed for your next big pitch.


6 diapositivas
Customer Targeting Strategy Overview Presentation
Present your customer approach clearly with this Customer Targeting Strategy Overview presentation. Featuring a central persona with speech bubble-style segments, this layout is perfect for showcasing targeting methods, segmentation insights, or buyer personas. Ideal for marketers and strategists. Fully editable in Canva, PowerPoint, and Google Slides for easy customization.


26 diapositivas
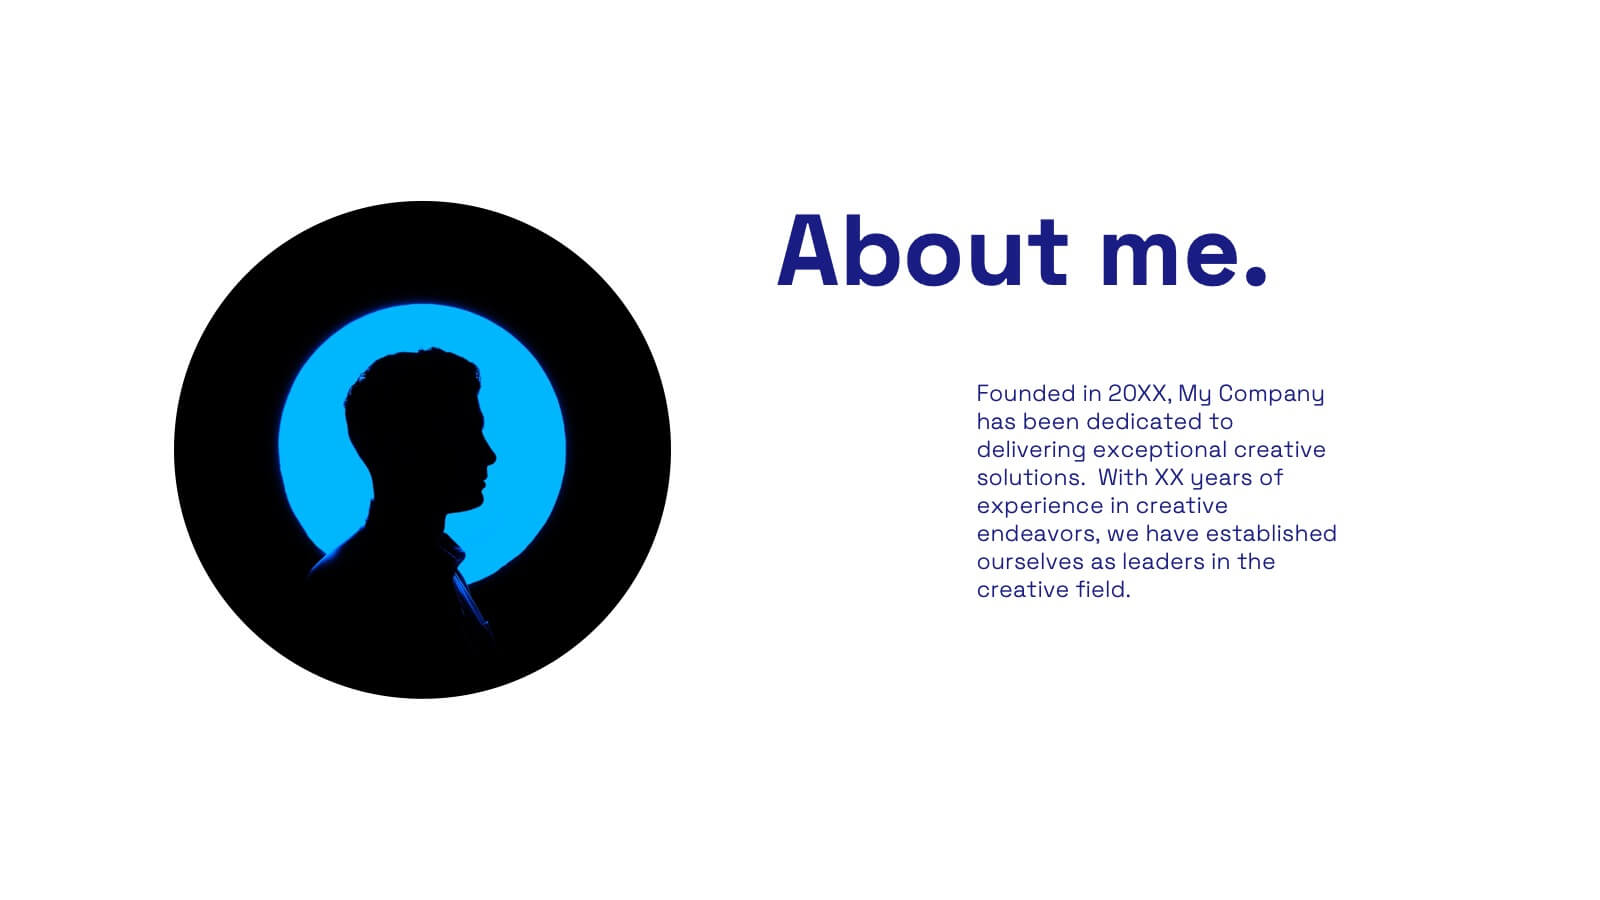
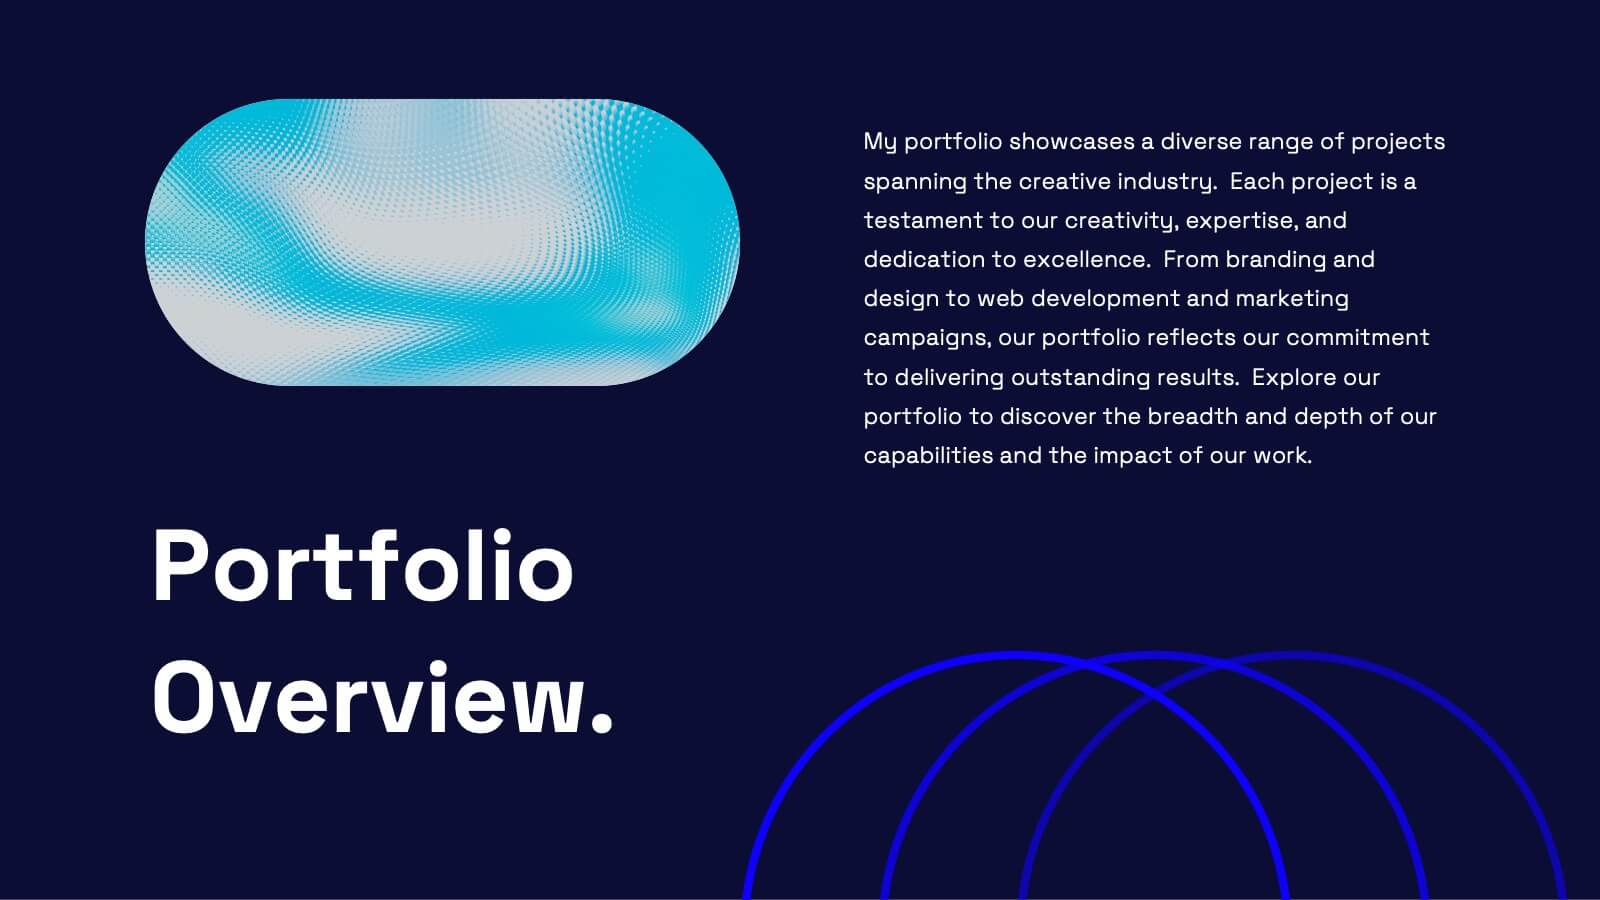
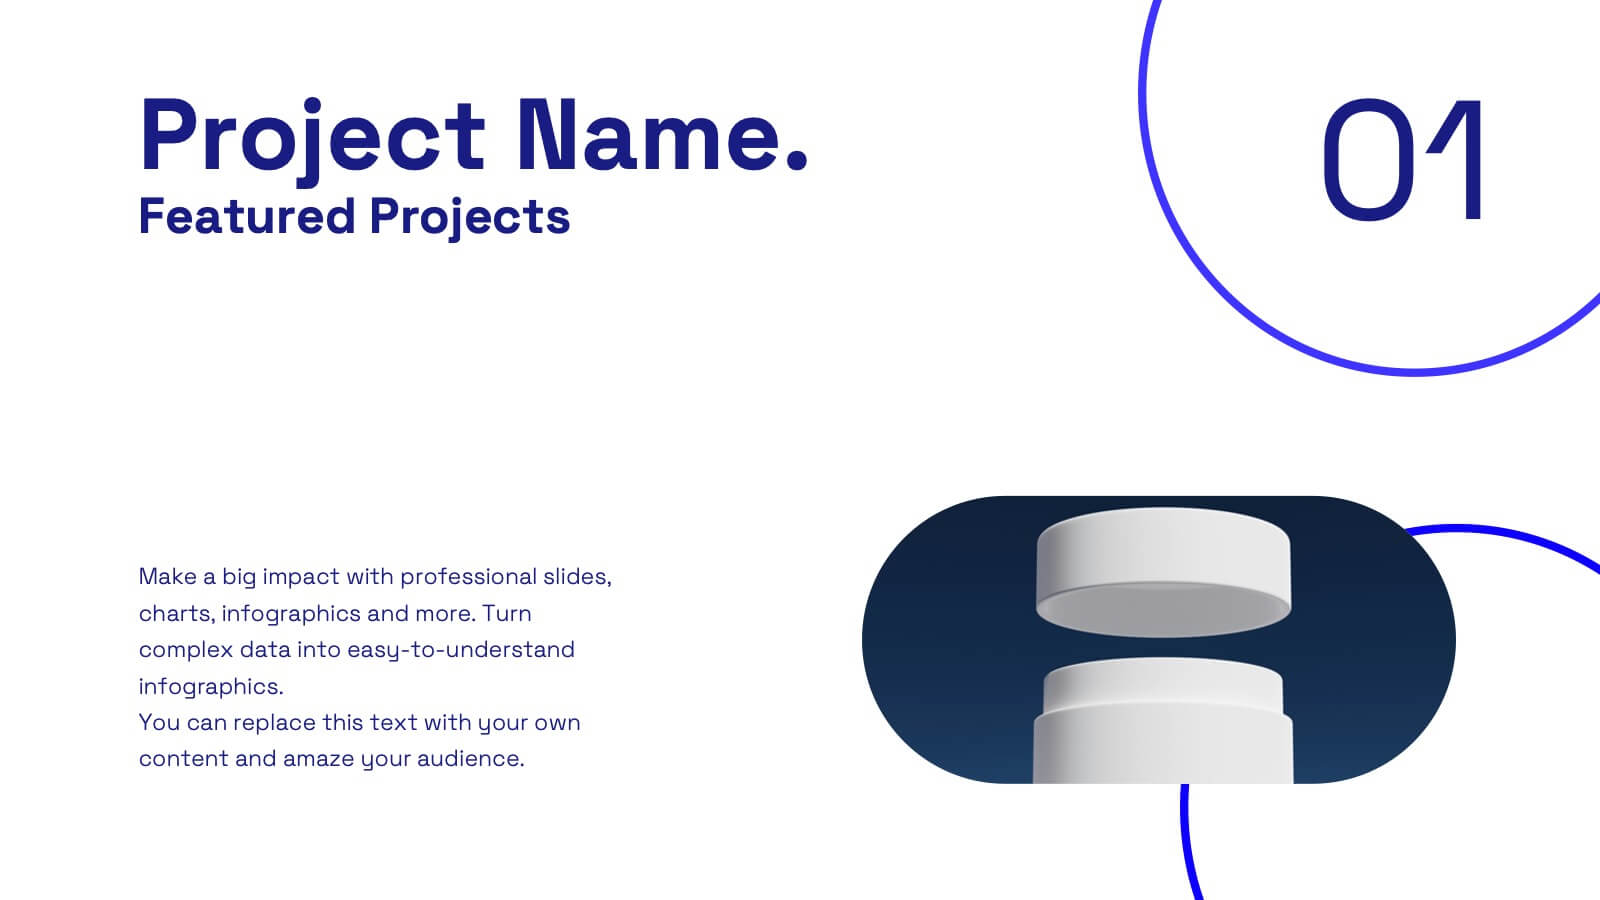
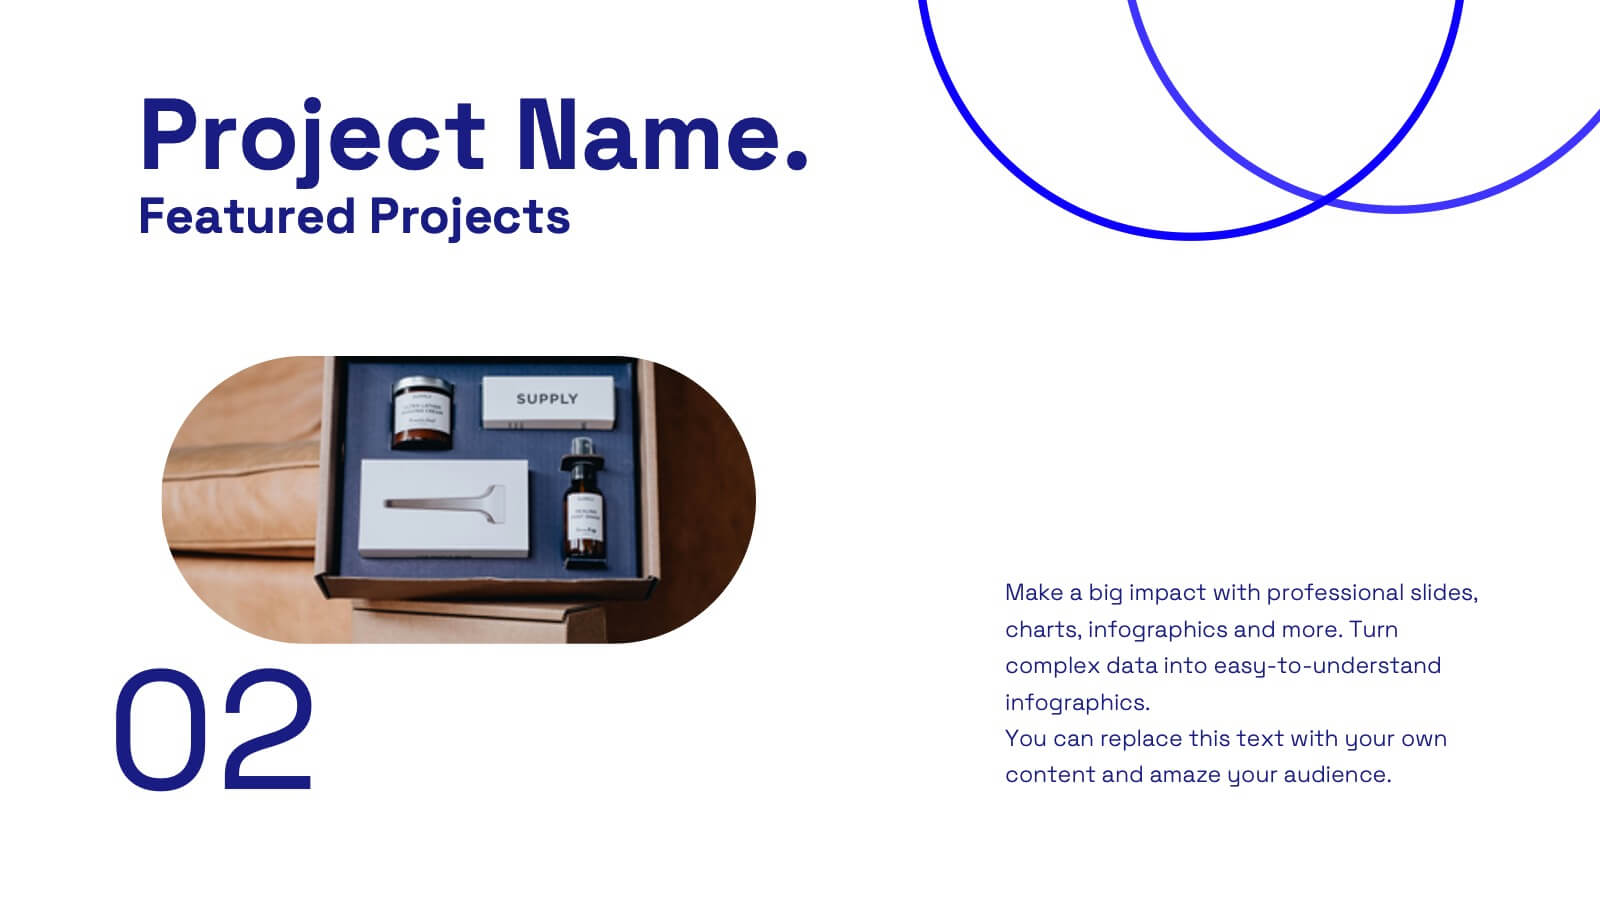
Arana Presentation Template
Arana is a minimal and stylish template to create stunning presentations. This template is perfect for training your business staff or team on how to use various services or products. It's easy to use, resulting in high quality presentations that look great to your clients or customers. Its slide designs can be used with each other to make more elaborate presentations complete with charts, images and text boxes. Arana simple yet stylish design makes it easy for anyone to use. With the large amount of information included, your presentation will look lighter, appealing, and easy to understand.


27 diapositivas
Creative Business Overview Presentation
Enhance your corporate presentations with our comprehensive Business template. This resource includes detailed slides on SWOT analysis, market opportunities, strategic goals, and product details. Perfect for delivering a complete business overview, it's compatible with PowerPoint, Keynote, and Google Slides for seamless use in various professional settings.


5 diapositivas
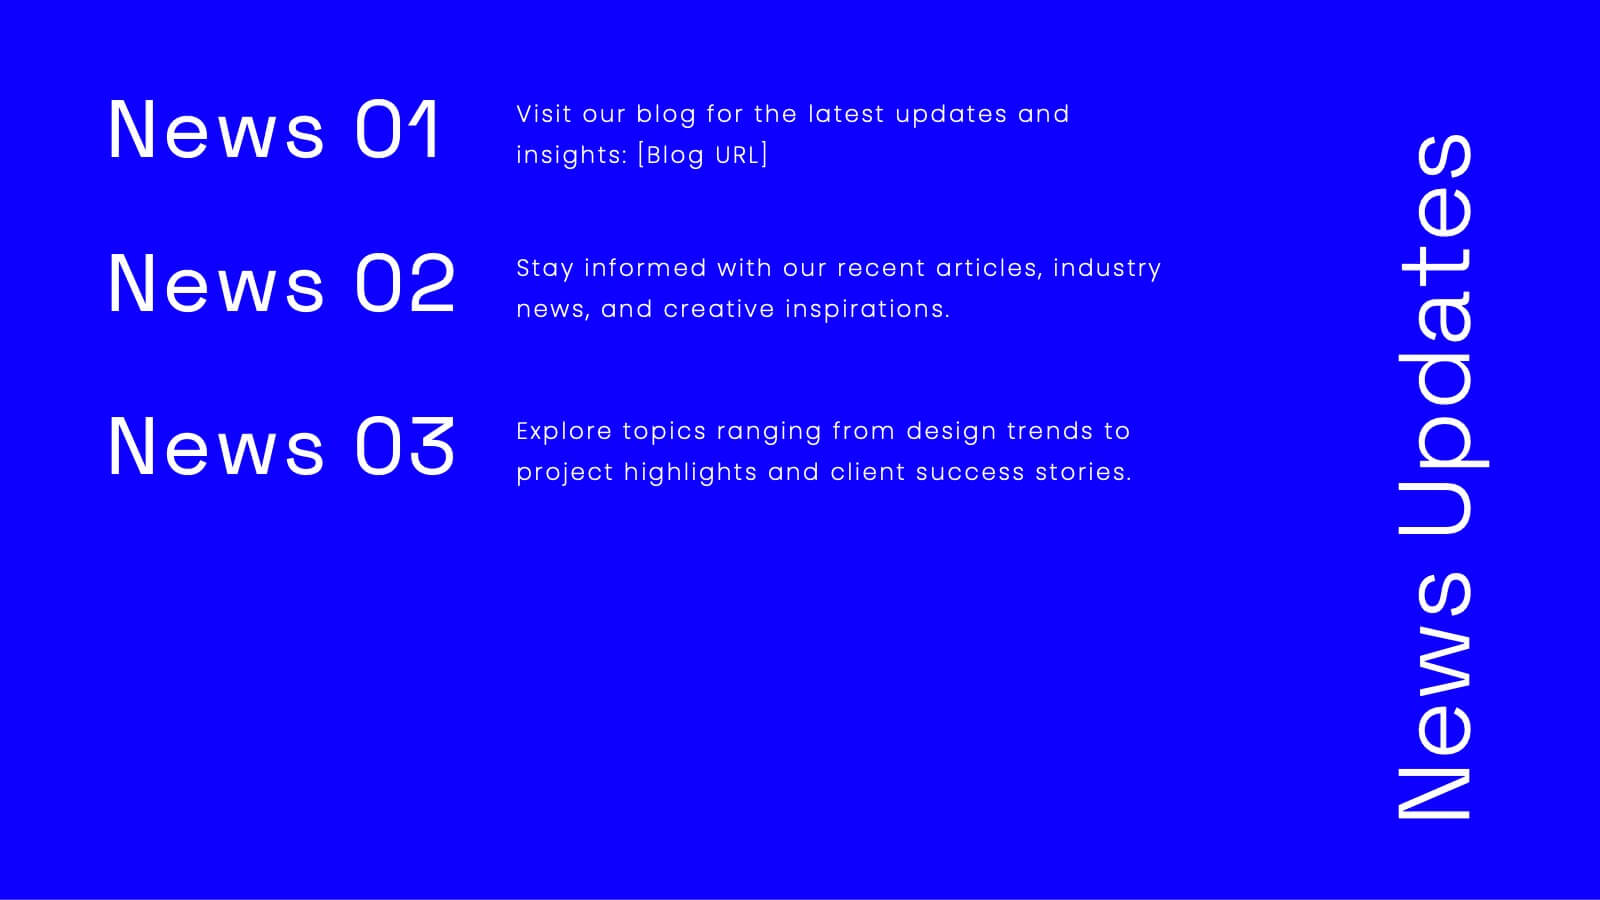
5 Module Online Training Content Presentation
Kick off your training session with a clean, engaging visual that maps out each module in a clear, easy-to-follow flow. This presentation helps you organize lessons, outline learning goals, and guide learners through a structured digital program. Fully compatible with PowerPoint, Keynote, and Google Slides.


23 diapositivas
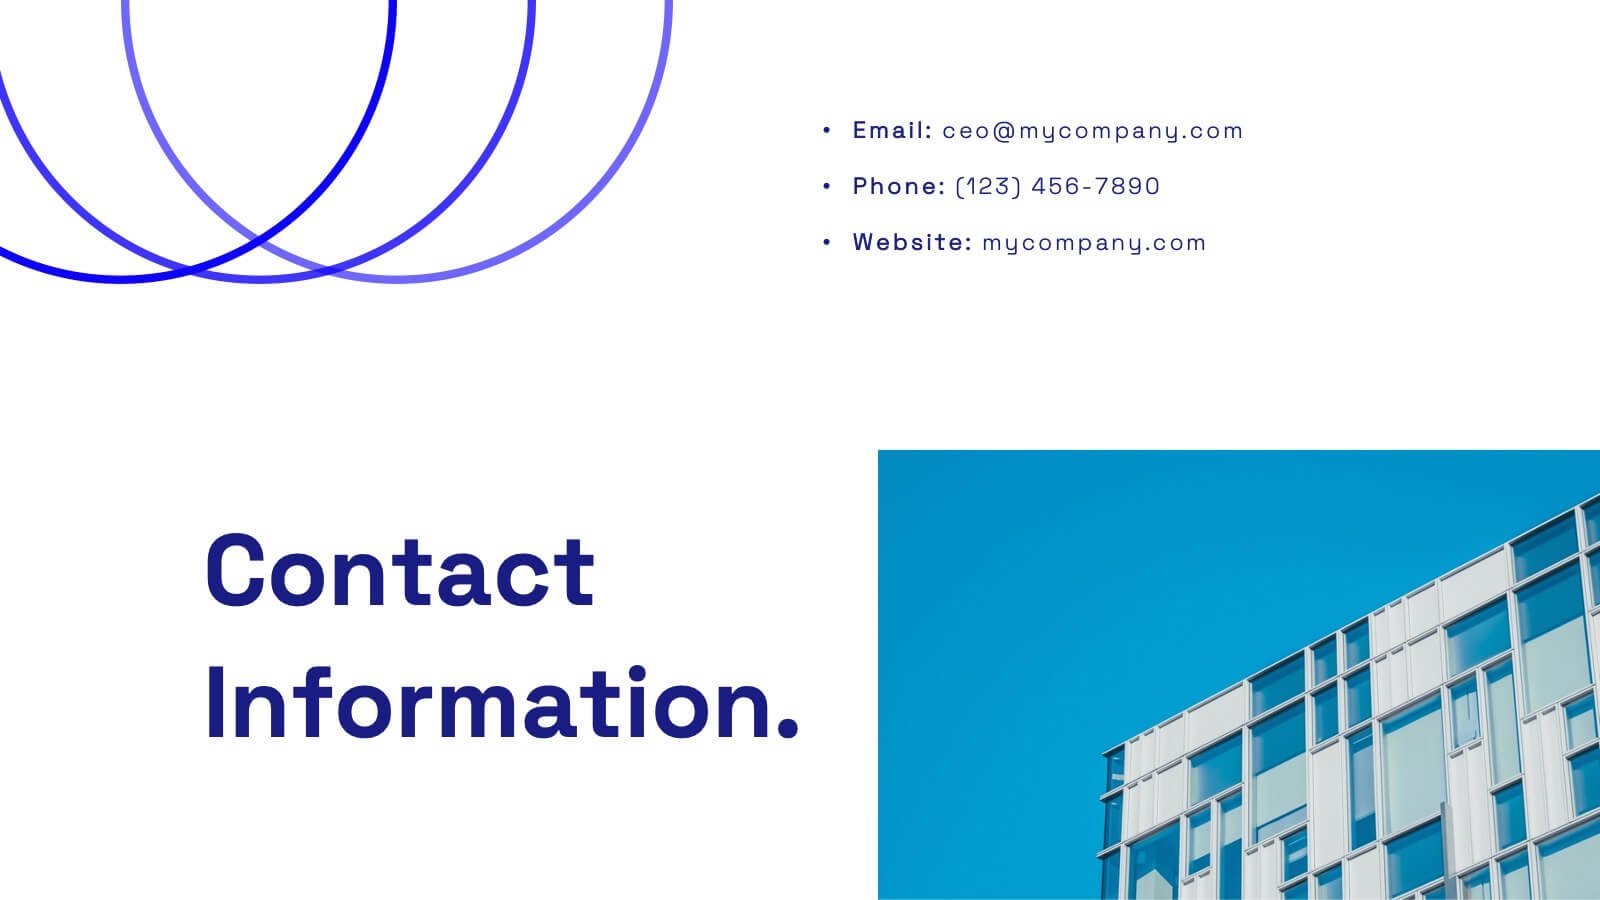
Delphi Investor Pitch Presentation
The Delphi Pitch Deck offers a warm and inviting design, ideal for conveying complex business concepts in a clear and engaging manner. The deck features a cohesive layout that covers all the essential components of a successful pitch, including company overview, problem statement, solution, market opportunity, and target audience. With a focus on optimizing supply chain efficiency, the template is perfect for startups and businesses looking to showcase their unique selling proposition and innovative strategies. The deck also includes detailed sections on business model canvas, revenue model, competitive landscape, and financial projections, ensuring your audience receives a comprehensive understanding of your business. The soft color palette enhances readability while maintaining a professional tone, making it suitable for various industries. Fully compatible with PowerPoint, Keynote, and Google Slides, the Delphi Pitch Deck is the perfect tool for delivering a memorable and persuasive presentation.