


Características


¿Tienes alguna pregunta?
Recomendar


5 diapositivas
Eco-Friendly Business Practices
Highlight sustainable strategies with this clean, eco-focused slide. Featuring a green triangle recycling loop with sprouting leaves, it's ideal for presenting environmental initiatives, green policies, or sustainability goals. Customize each section with your data to show actionable steps or impact metrics. Fully editable in PowerPoint, Keynote, and Google Slides.
4 diapositivas
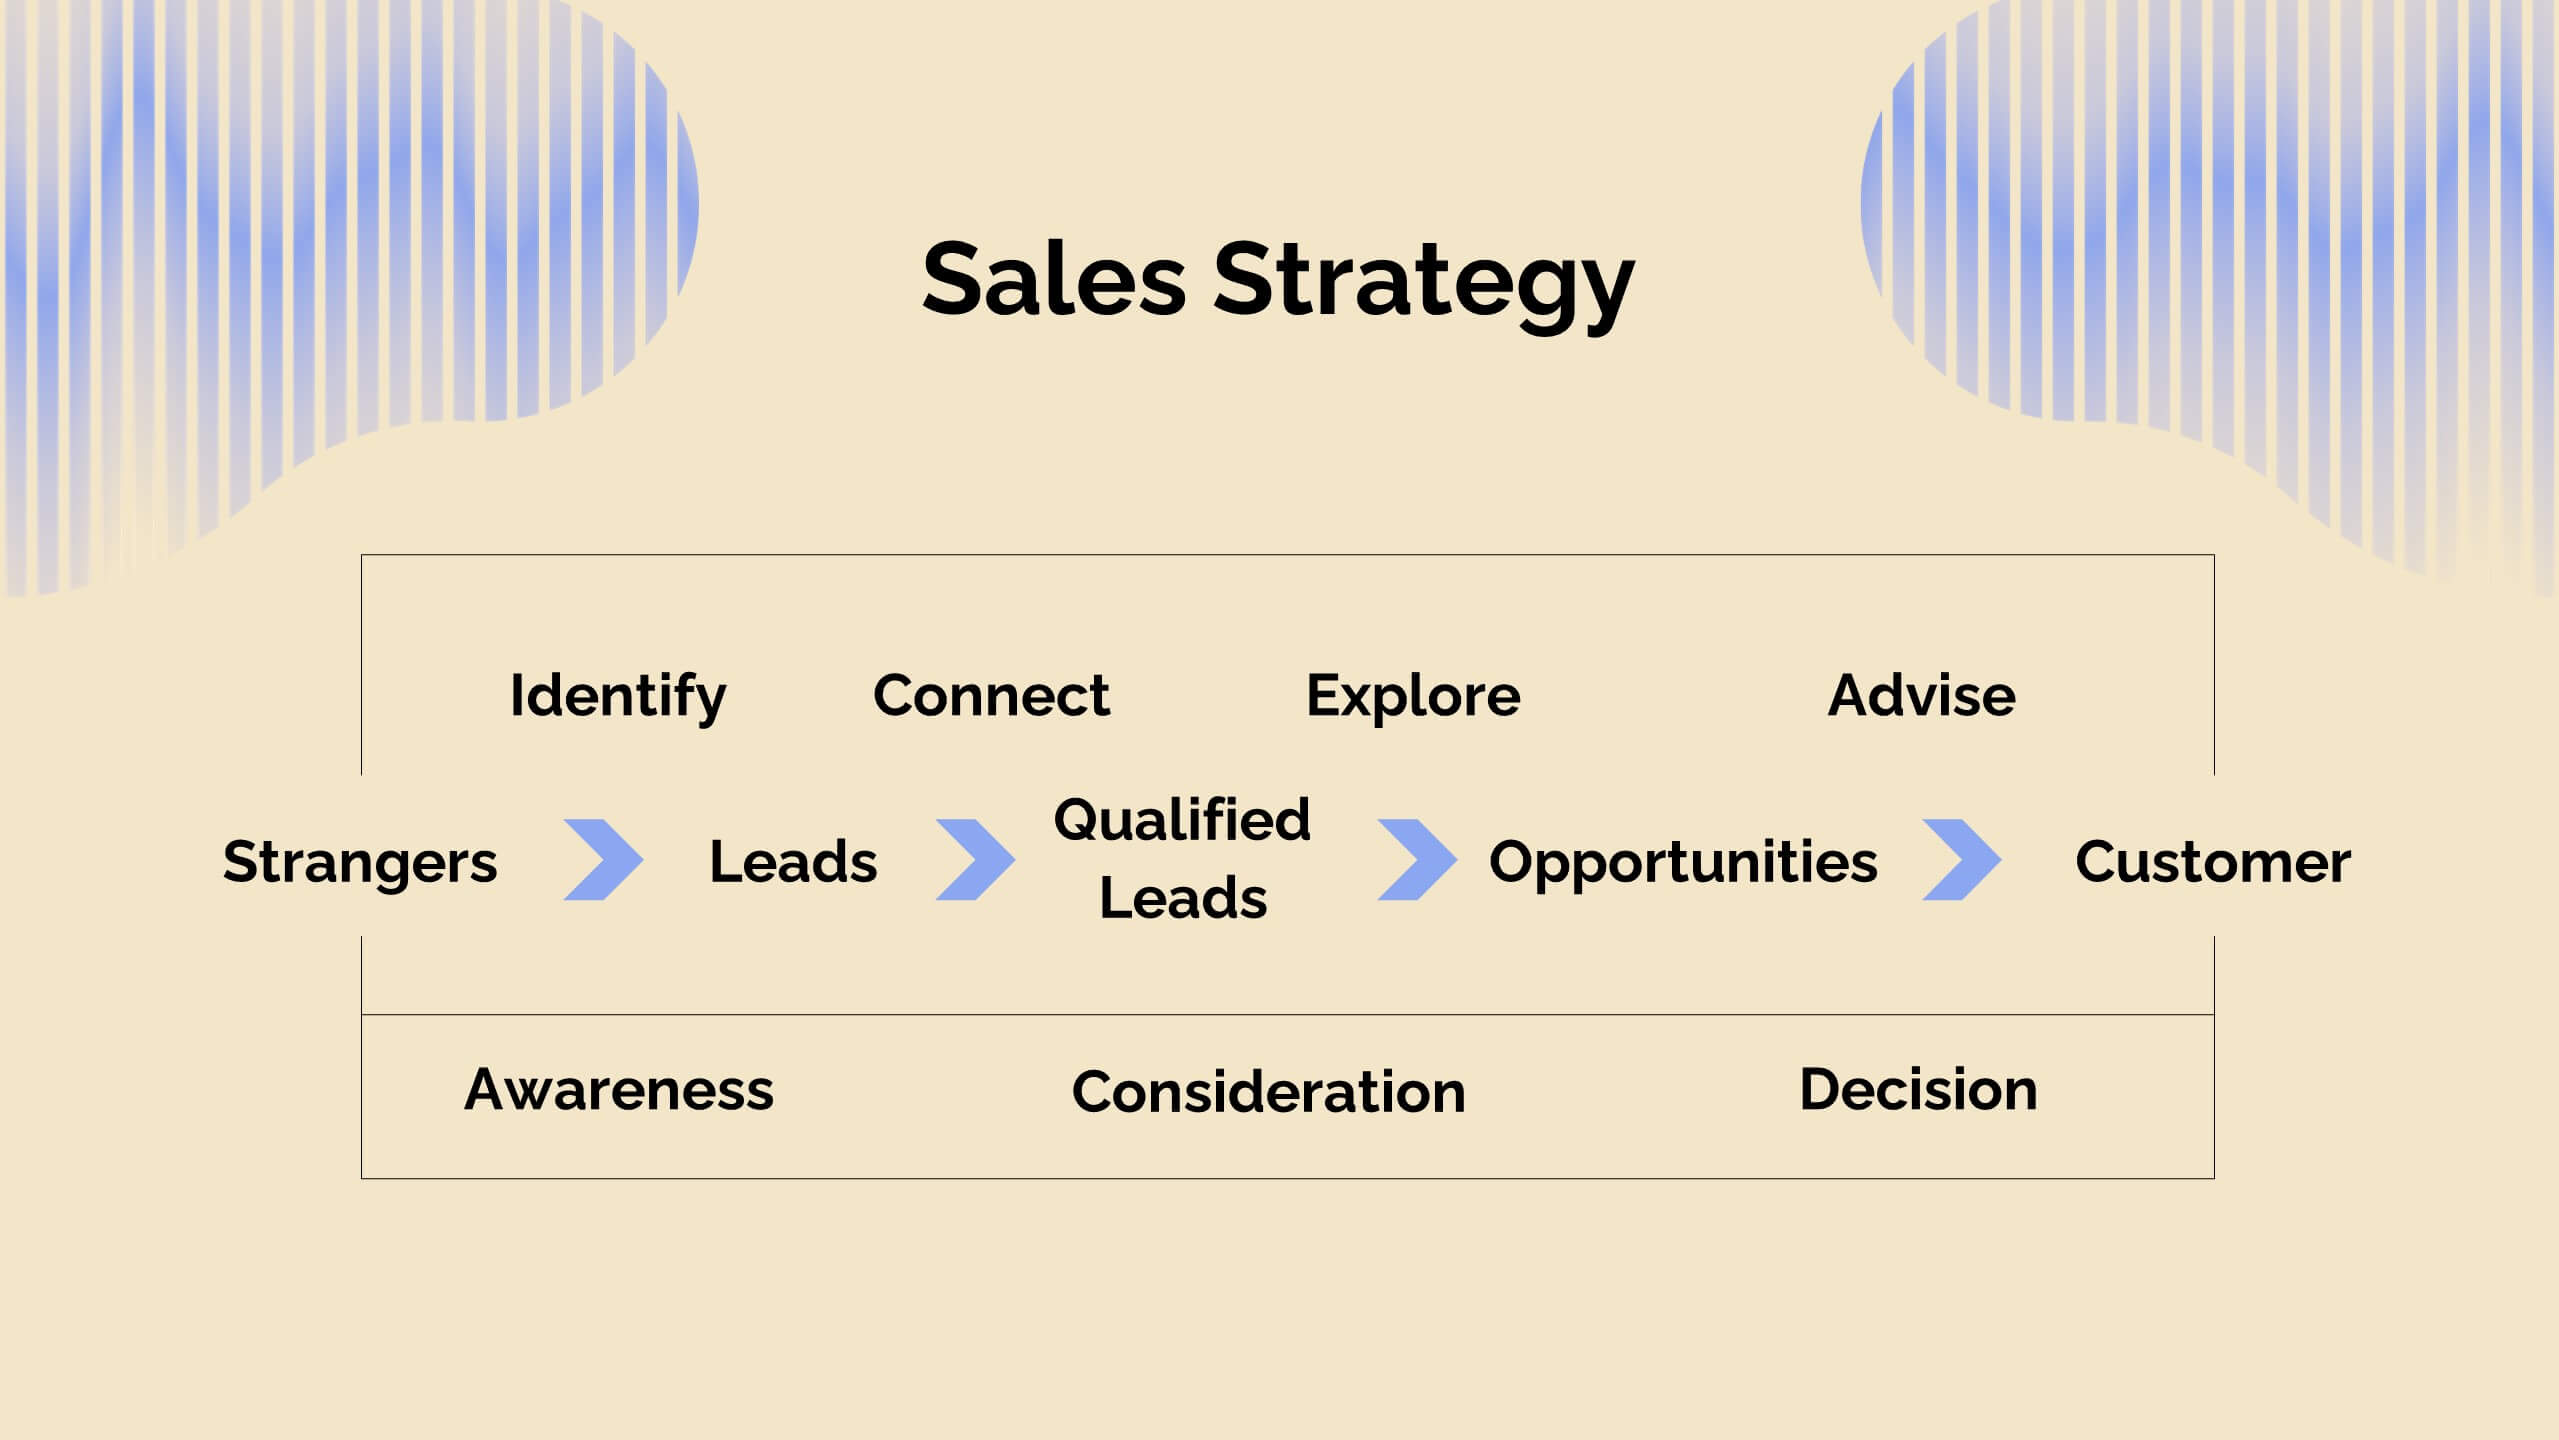
Directional Arrow Diagram Slide Presentation
Make your message stand out with a bold visual that points your audience in the right direction. This presentation uses clear directional arrows to highlight steps, options, or key decisions in a way that’s easy to follow and visually compelling. Fully editable and compatible with PowerPoint, Keynote, and Google Slides.


4 diapositivas
Team Performance Improvement Plan Presentation
Bring strategy to life with a clean, focused layout that makes team growth easy to follow. This template helps visualize performance gaps, goals, and action steps in a simple format, perfect for outlining improvement plans and productivity initiatives. Fully editable in PowerPoint, Keynote, and Google Slides for seamless team collaboration.


7 diapositivas
Breast Cancer Awareness Infographic Presentation
A Breast Cancer Awareness infographic is a visual representation of important information related to breast cancer awareness, such as statistics, risk factors, prevention methods, screening guidelines, treatment options, and survivorship. The goal of this breast cancer awareness infographic is to educate people about breast cancer, increase awareness of the disease, and encourage early detection and treatment. This template has a pink theme and many helpful illustrations. It is fully editable and can be designed in various styles and formats, including graphs, illustrations, and photographs.


2 diapositivas
Professional Thank You Slide Presentation
End your presentation with a clean, modern slide that leaves a polished final impression. This layout gives you space to share closing notes, contact details, or key reminders in a clear and visually balanced style. Fully editable and compatible with PowerPoint, Keynote, and Google Slides.


23 diapositivas
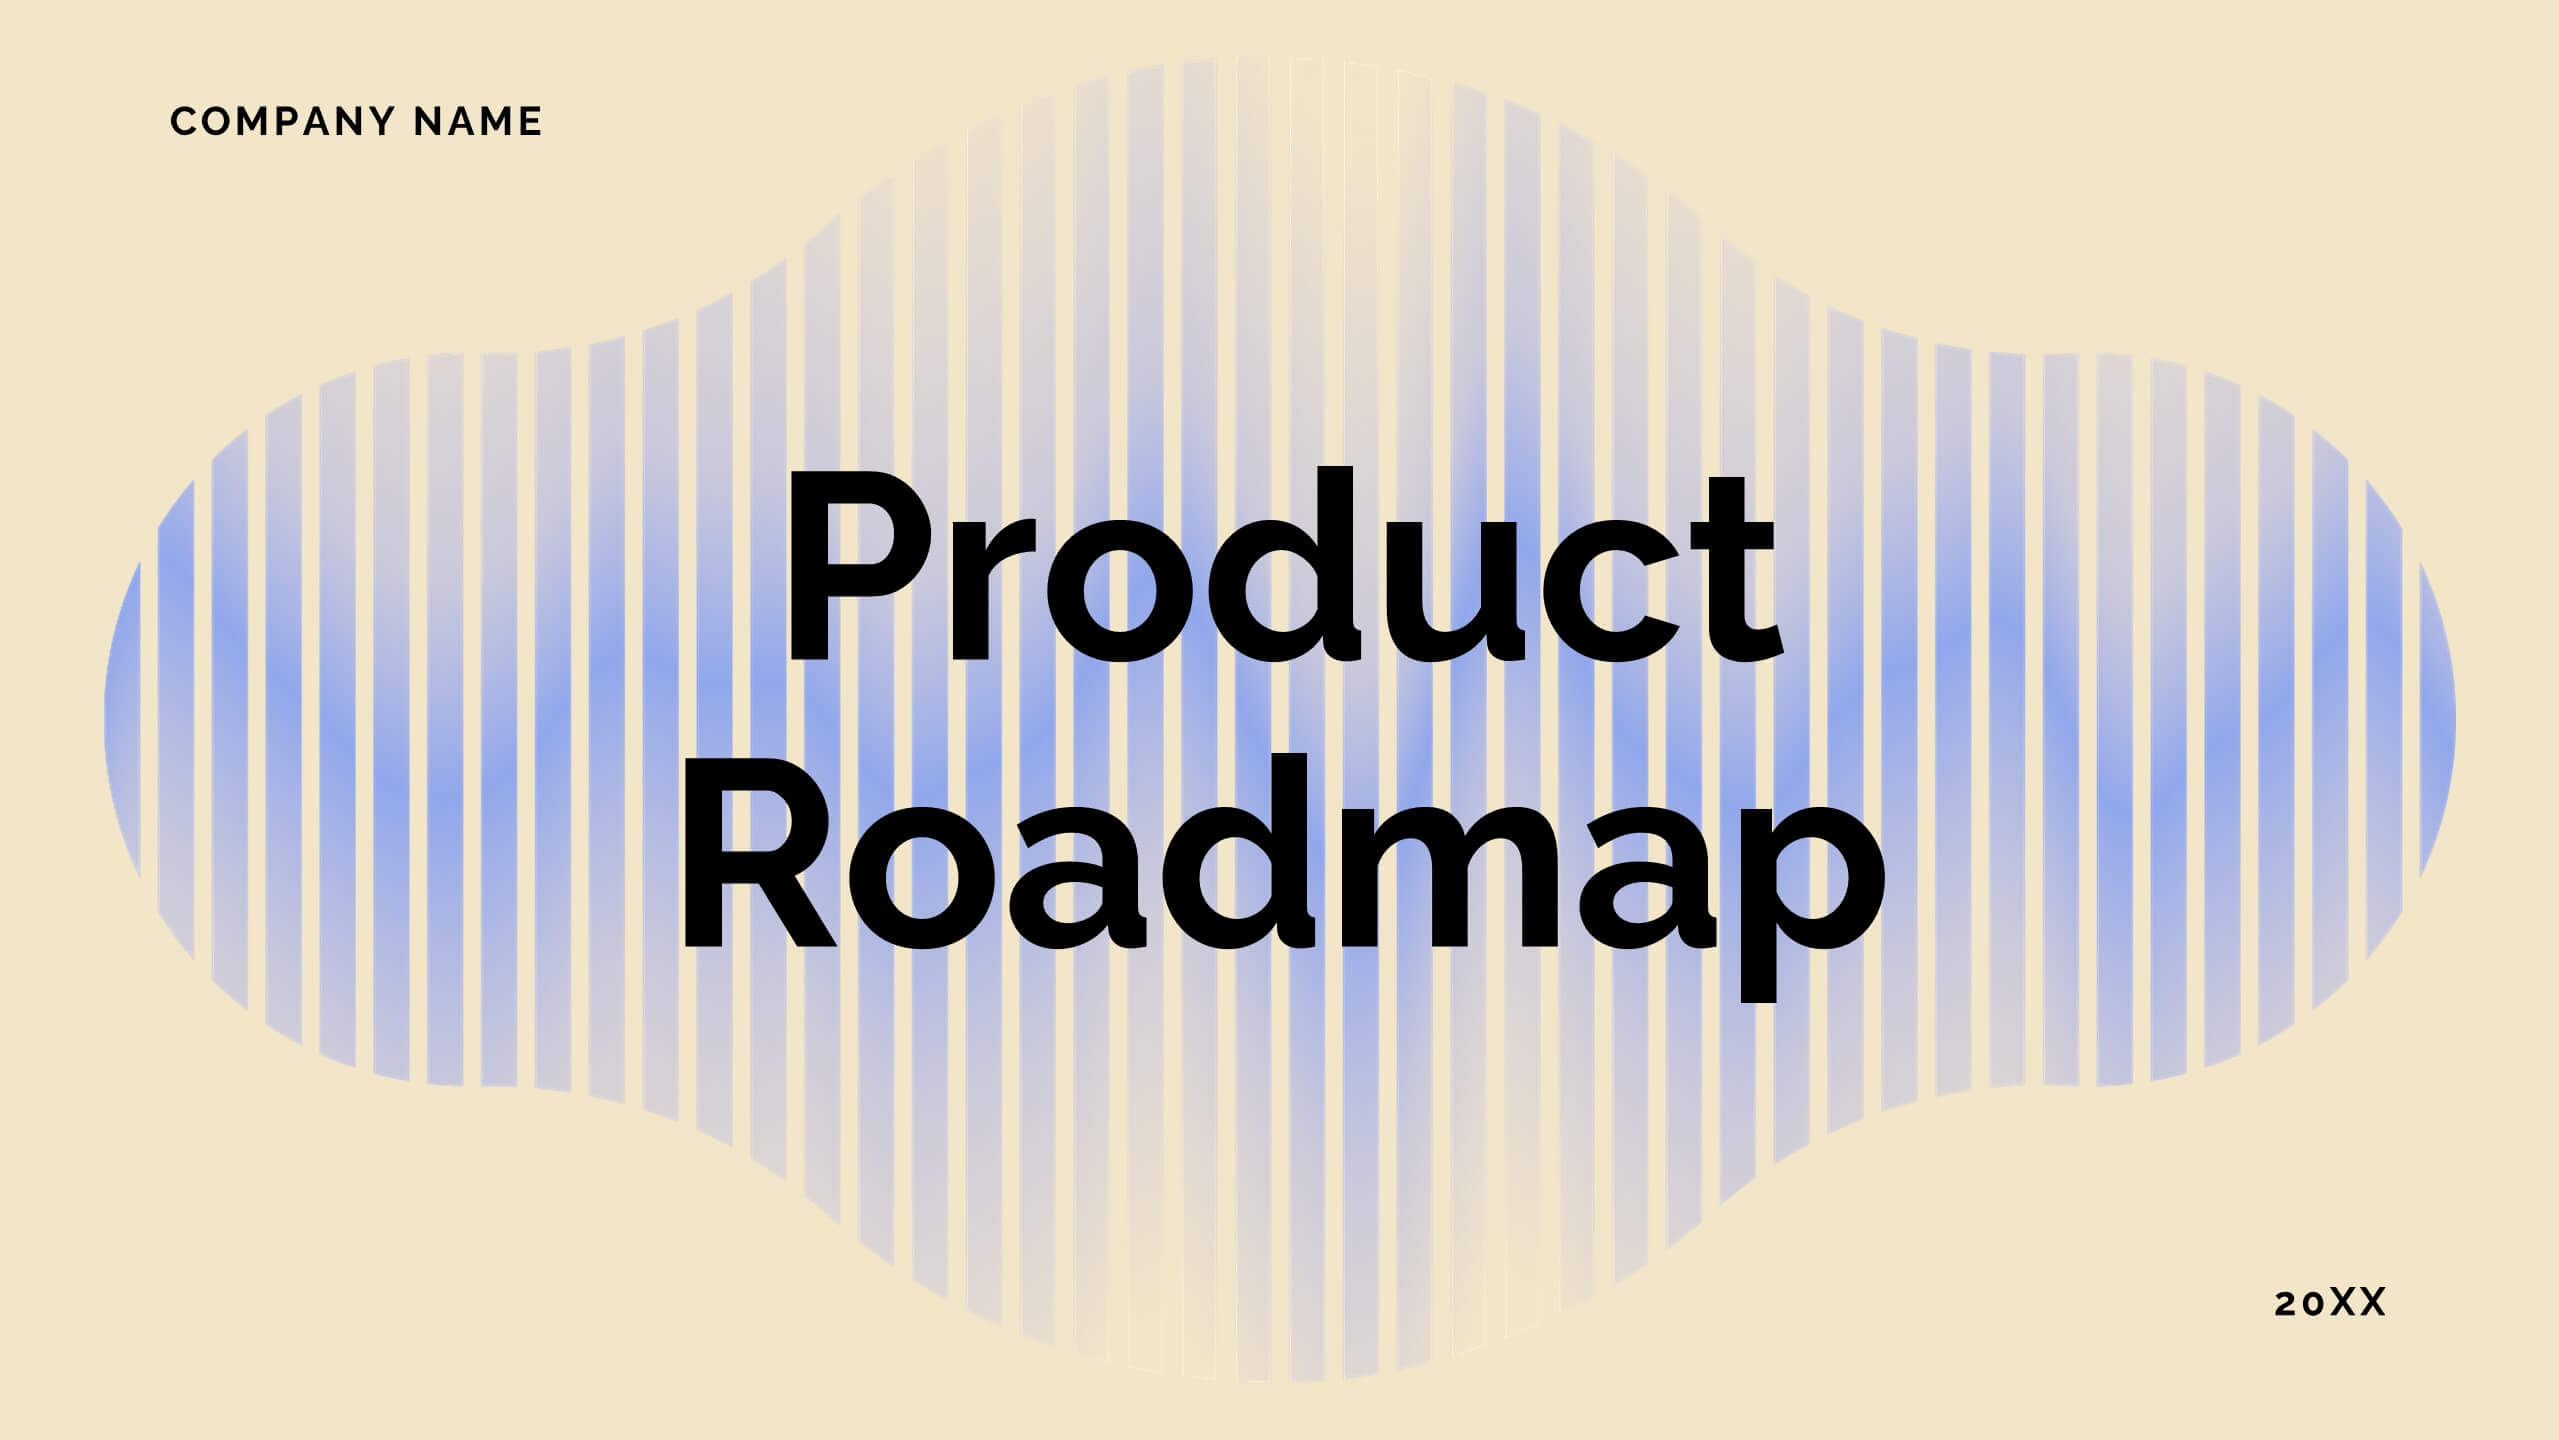
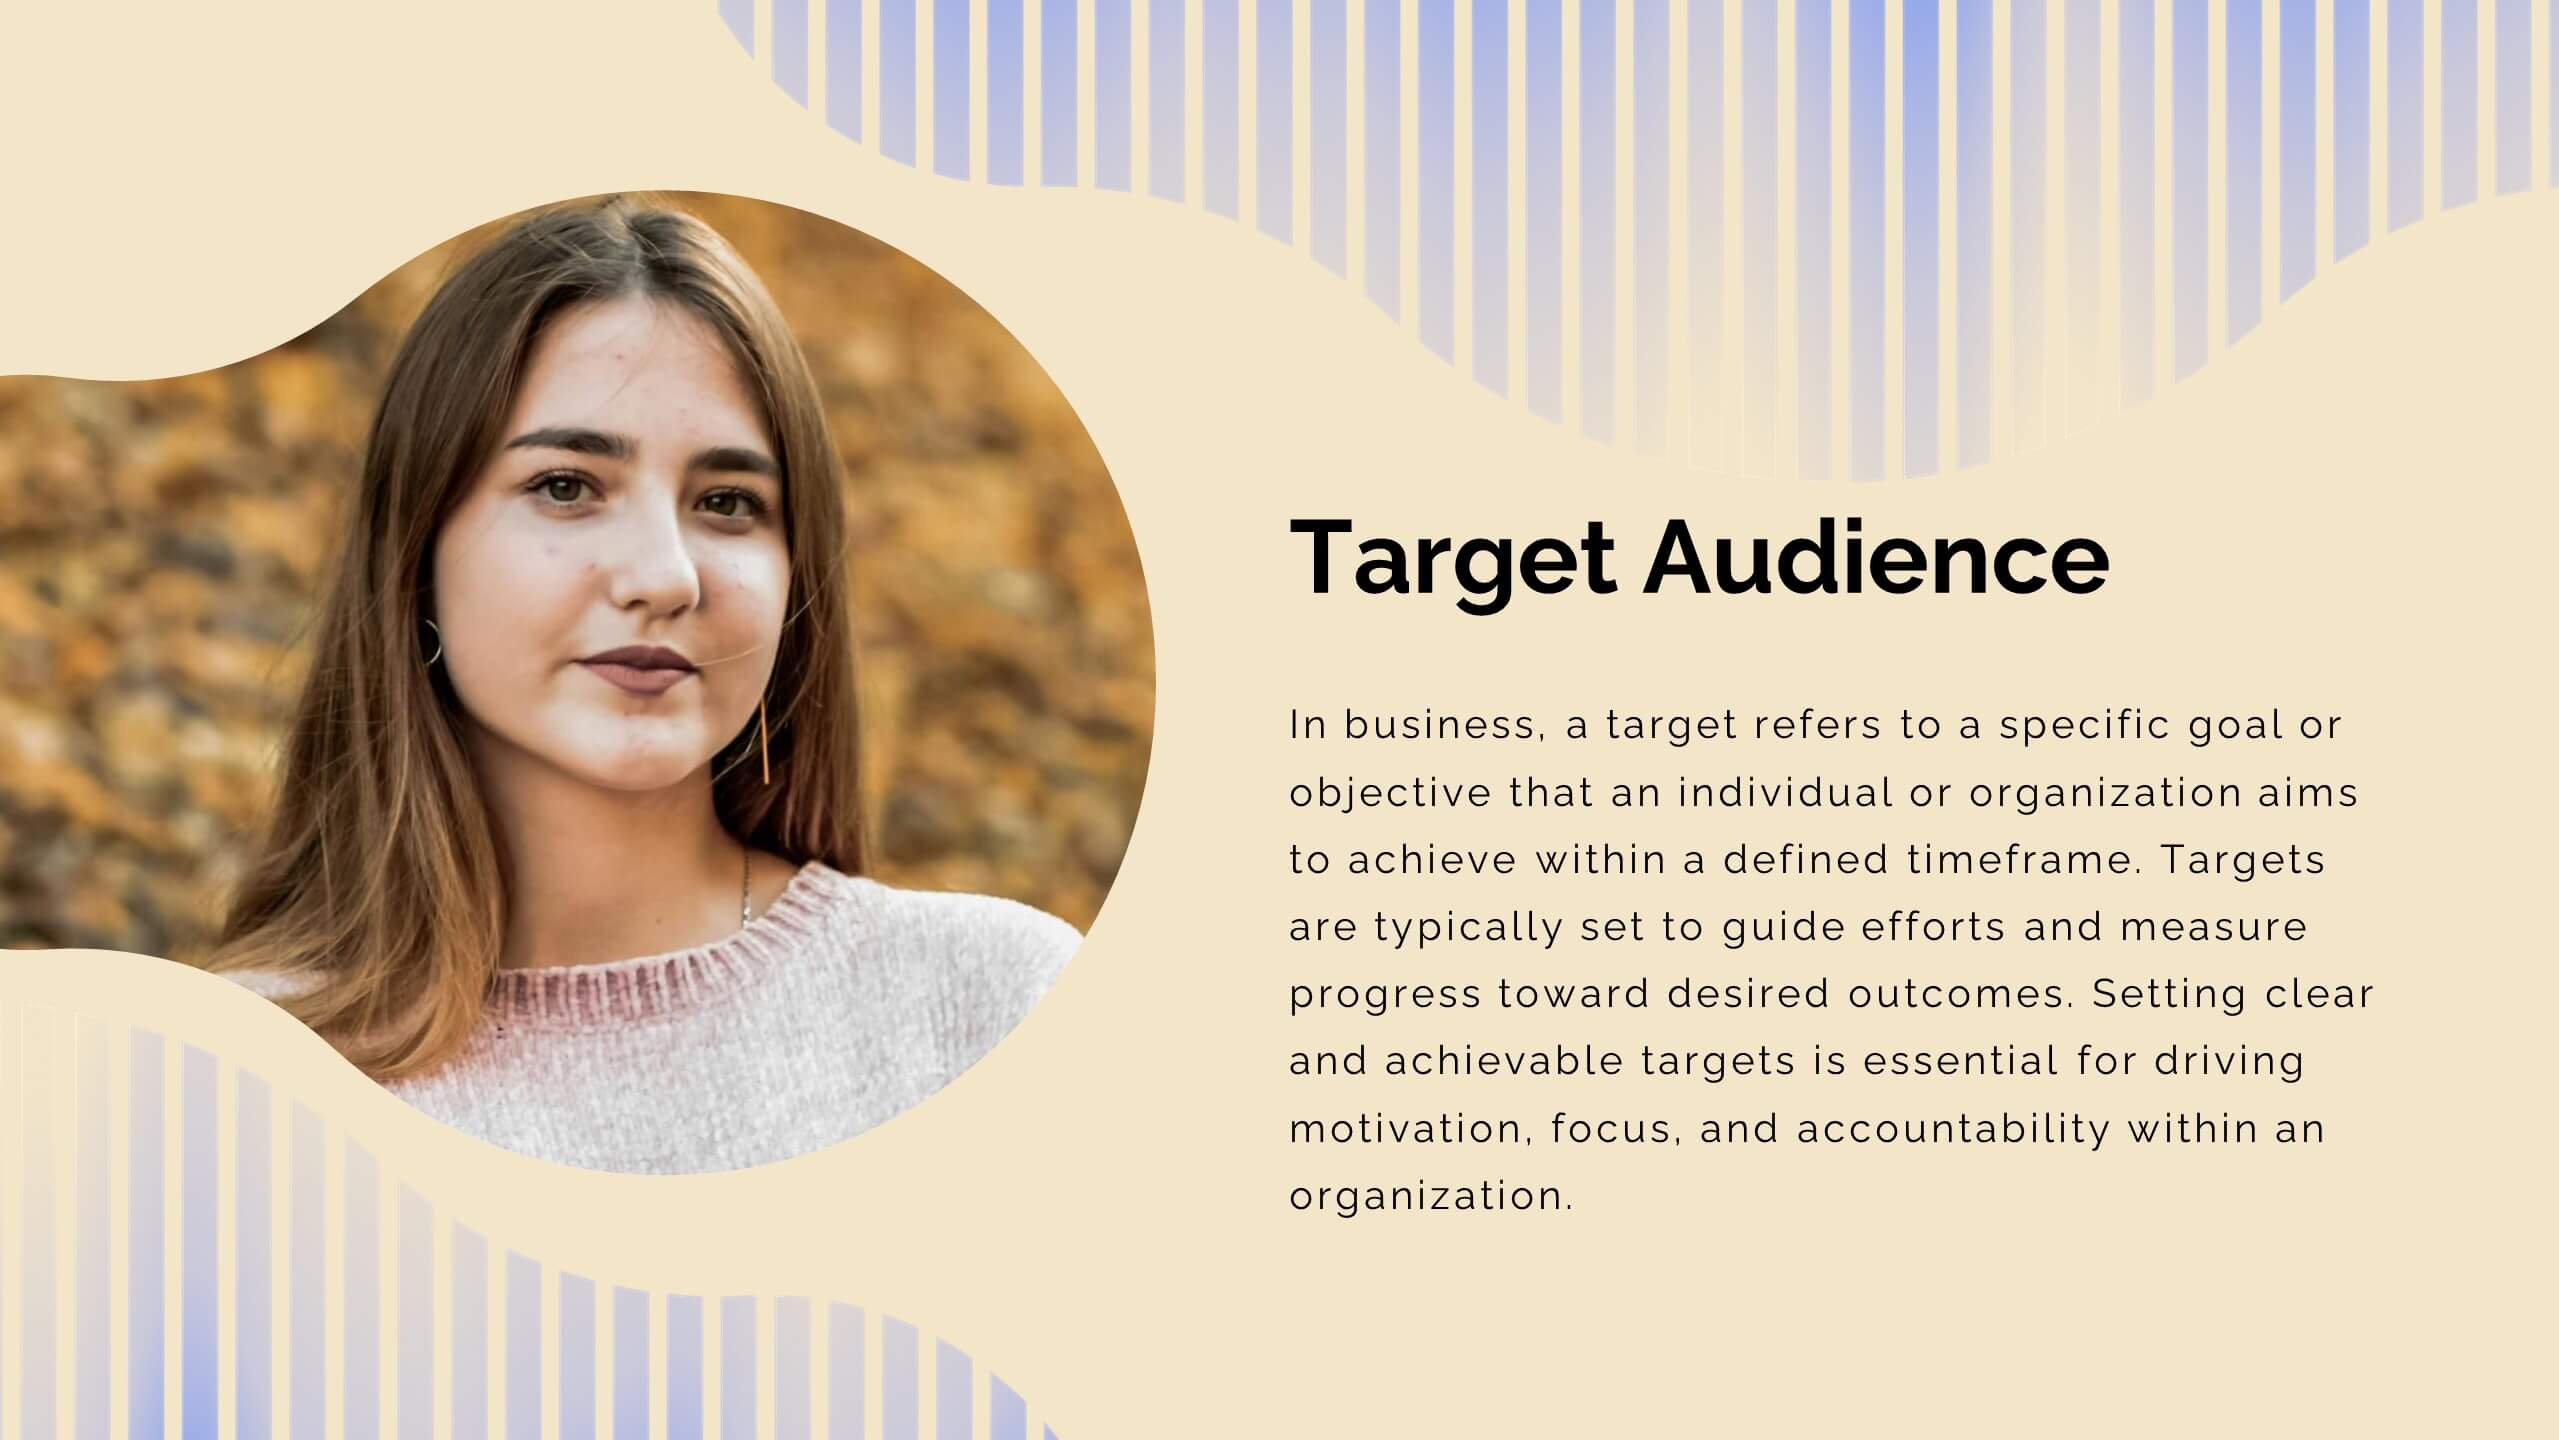
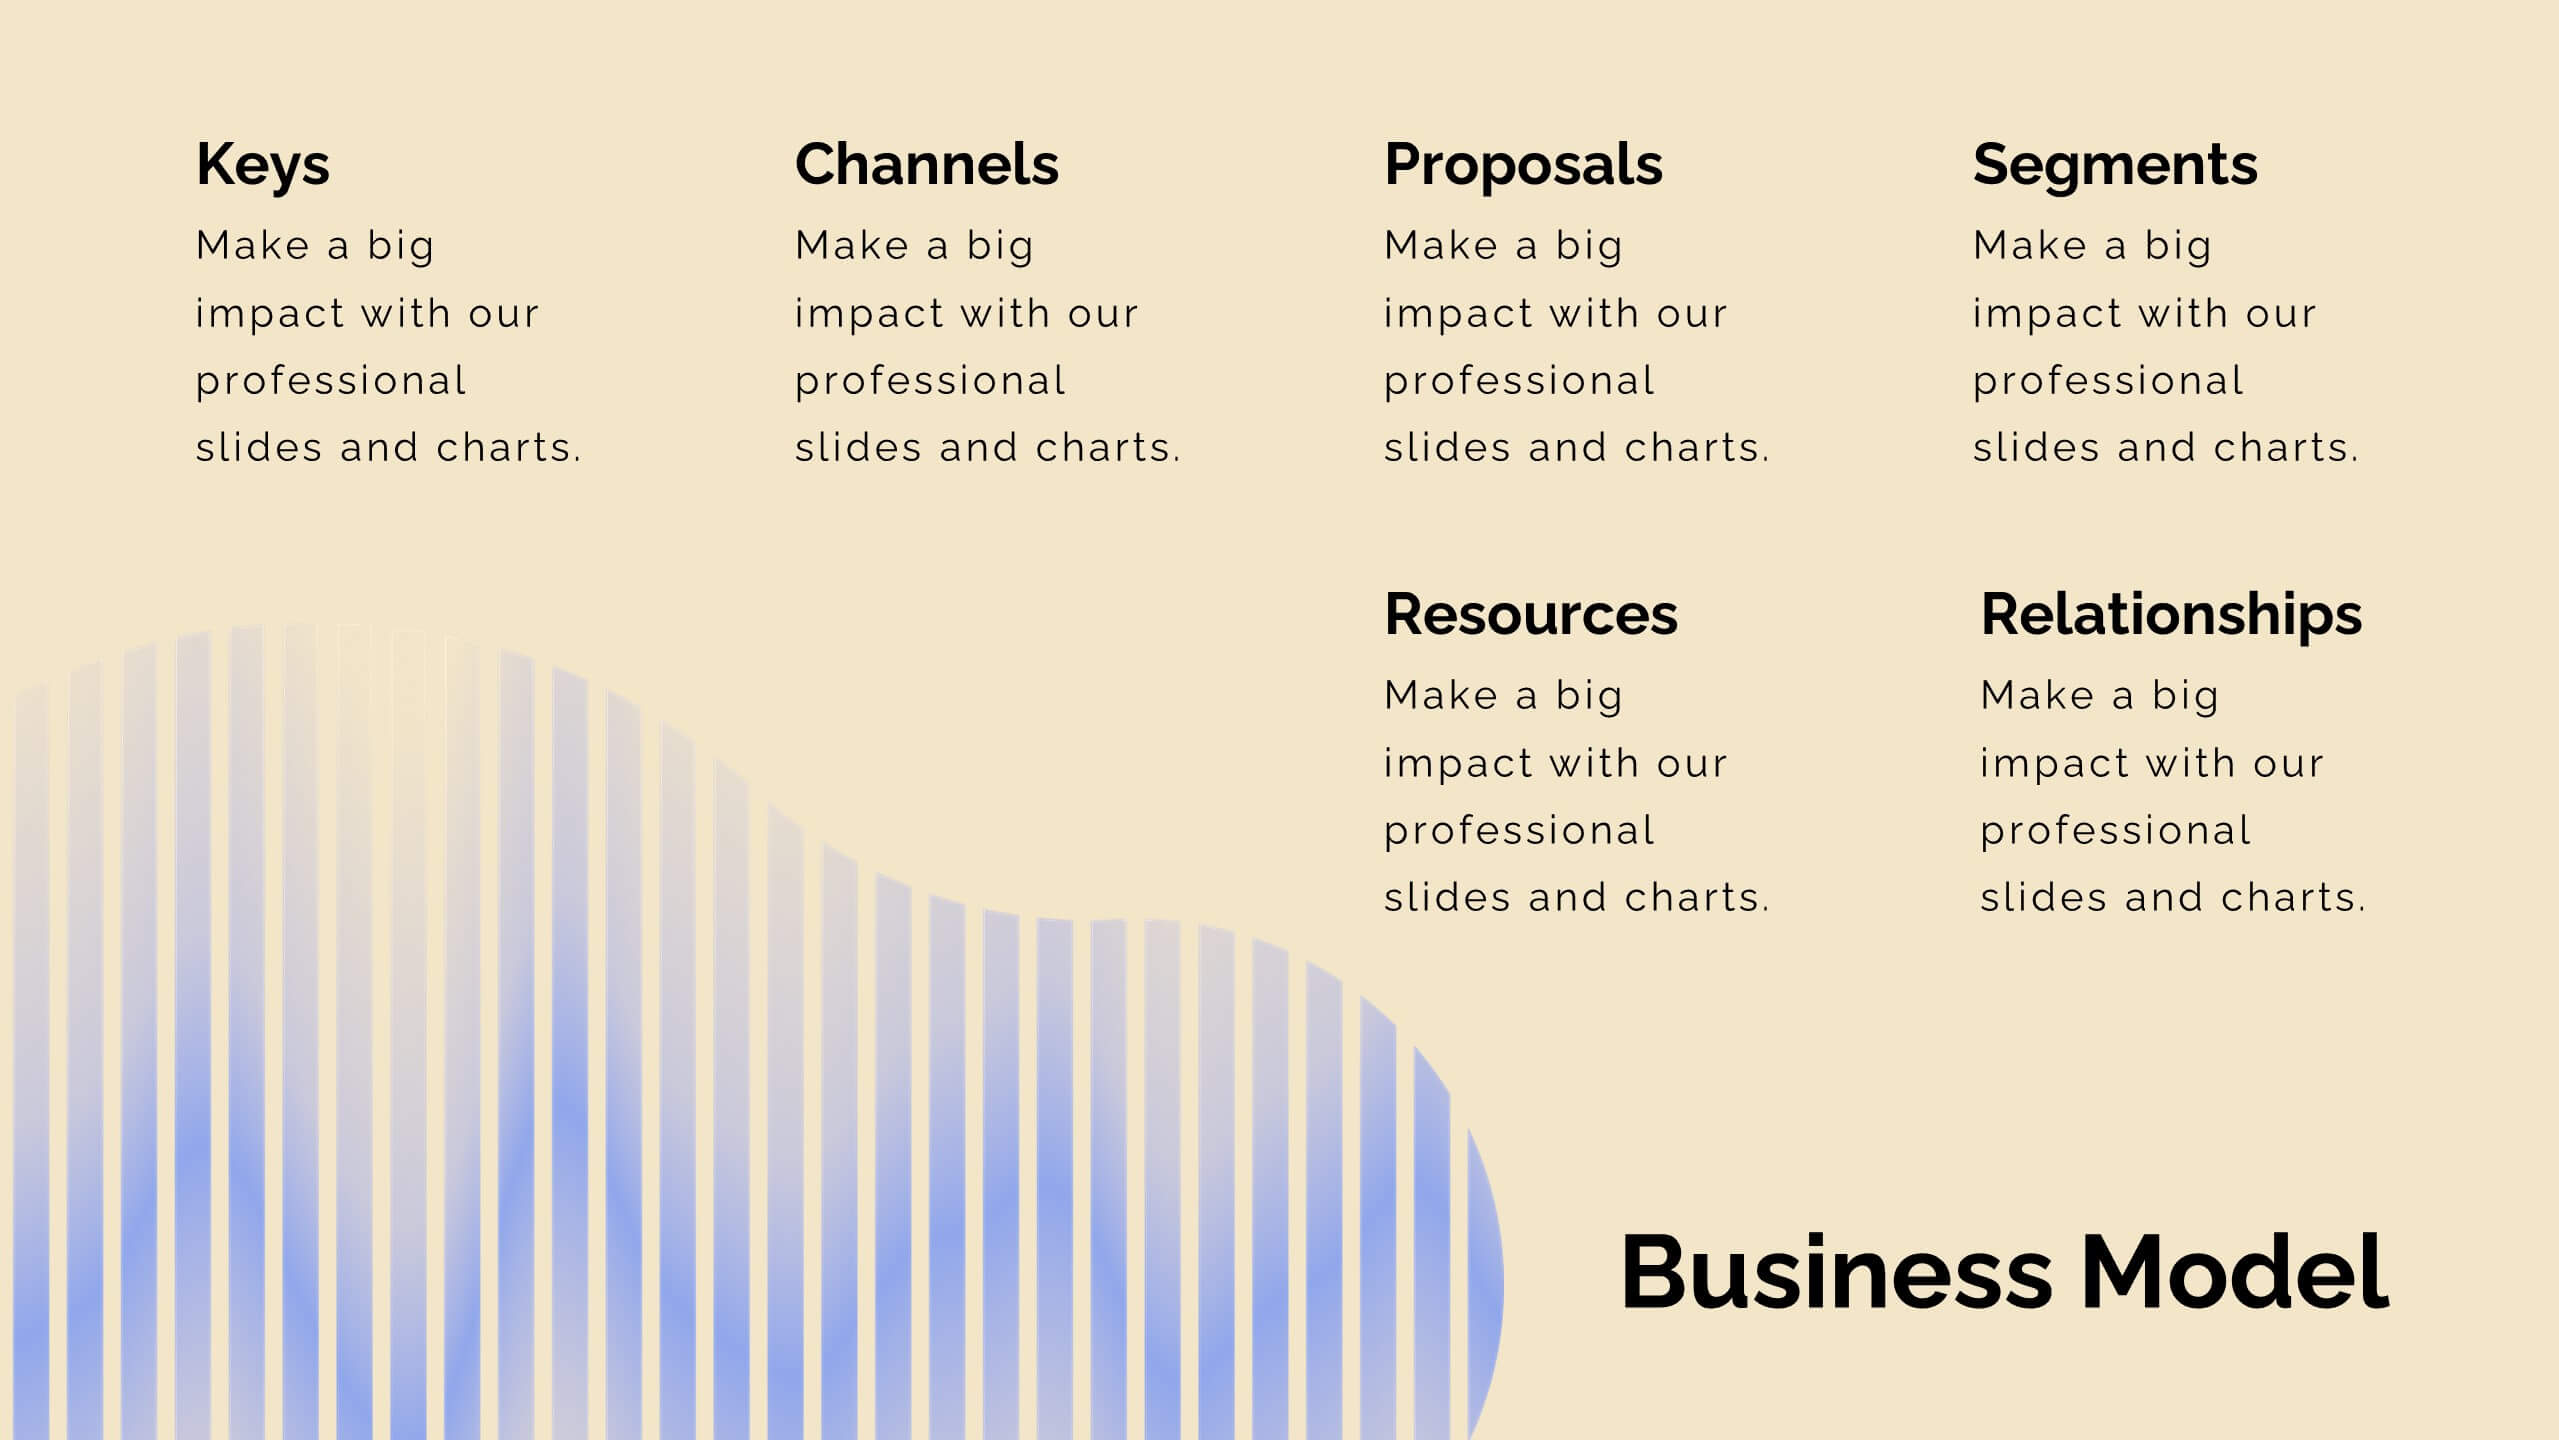
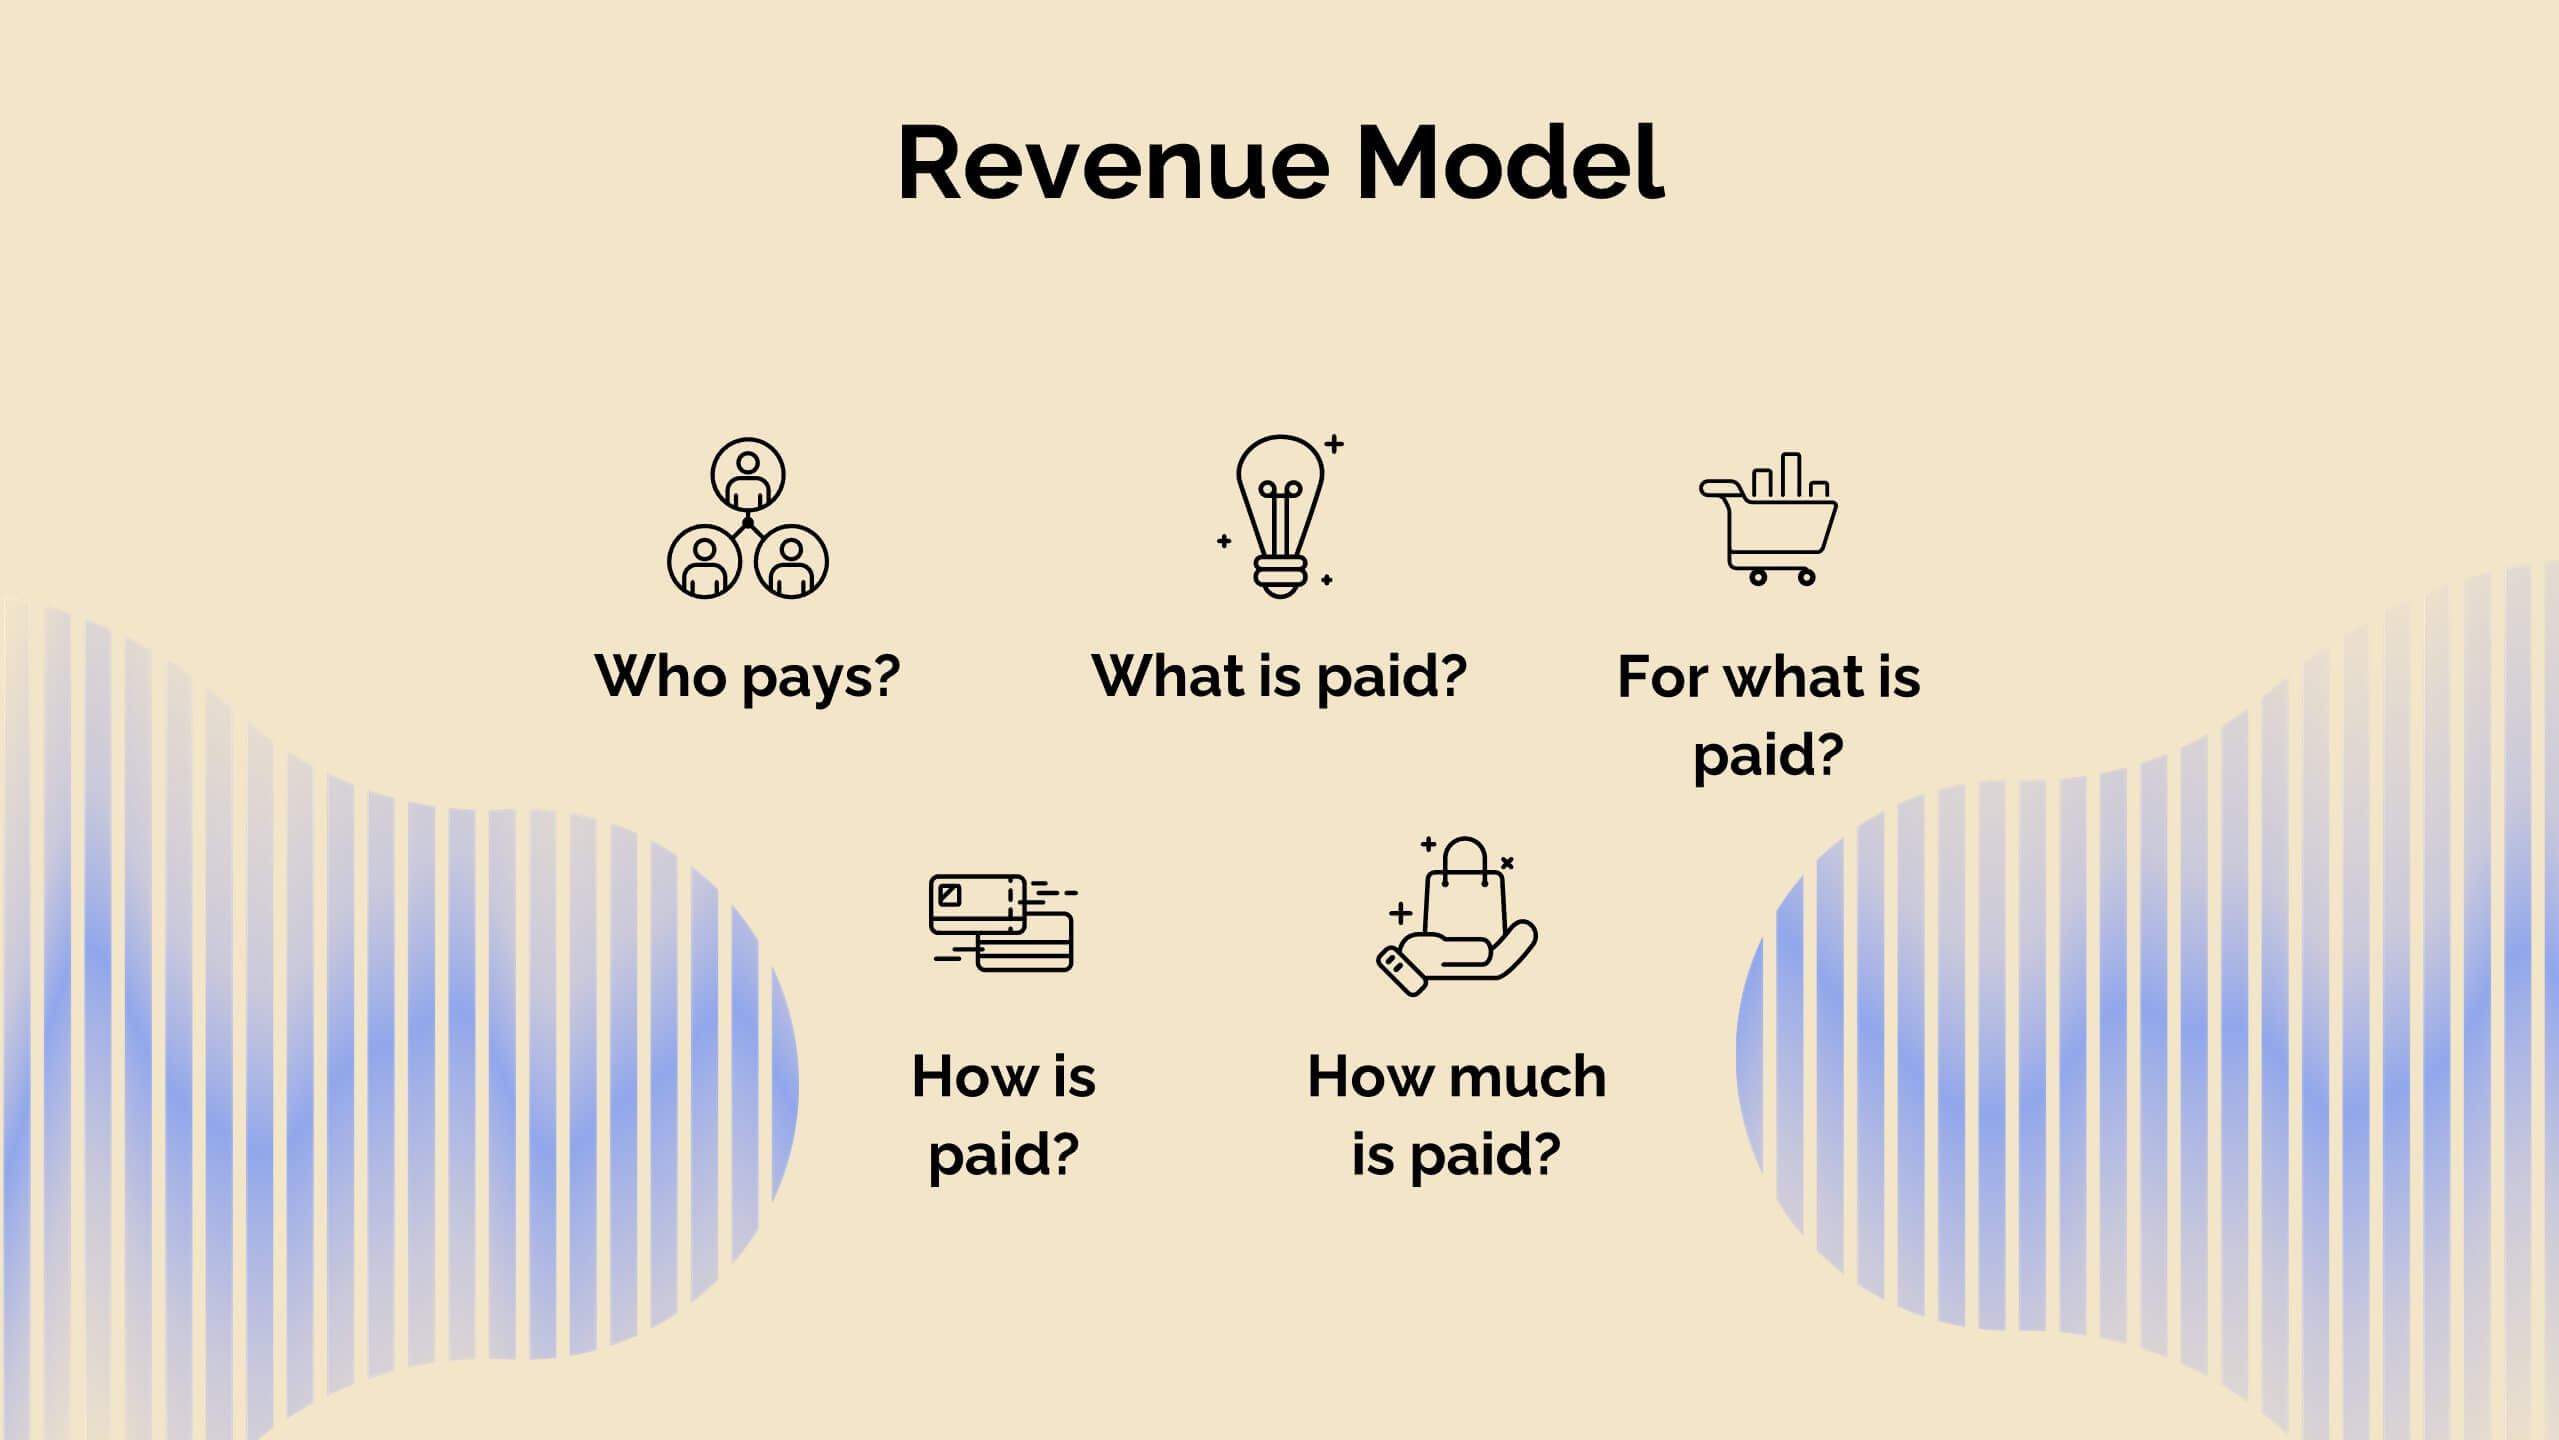
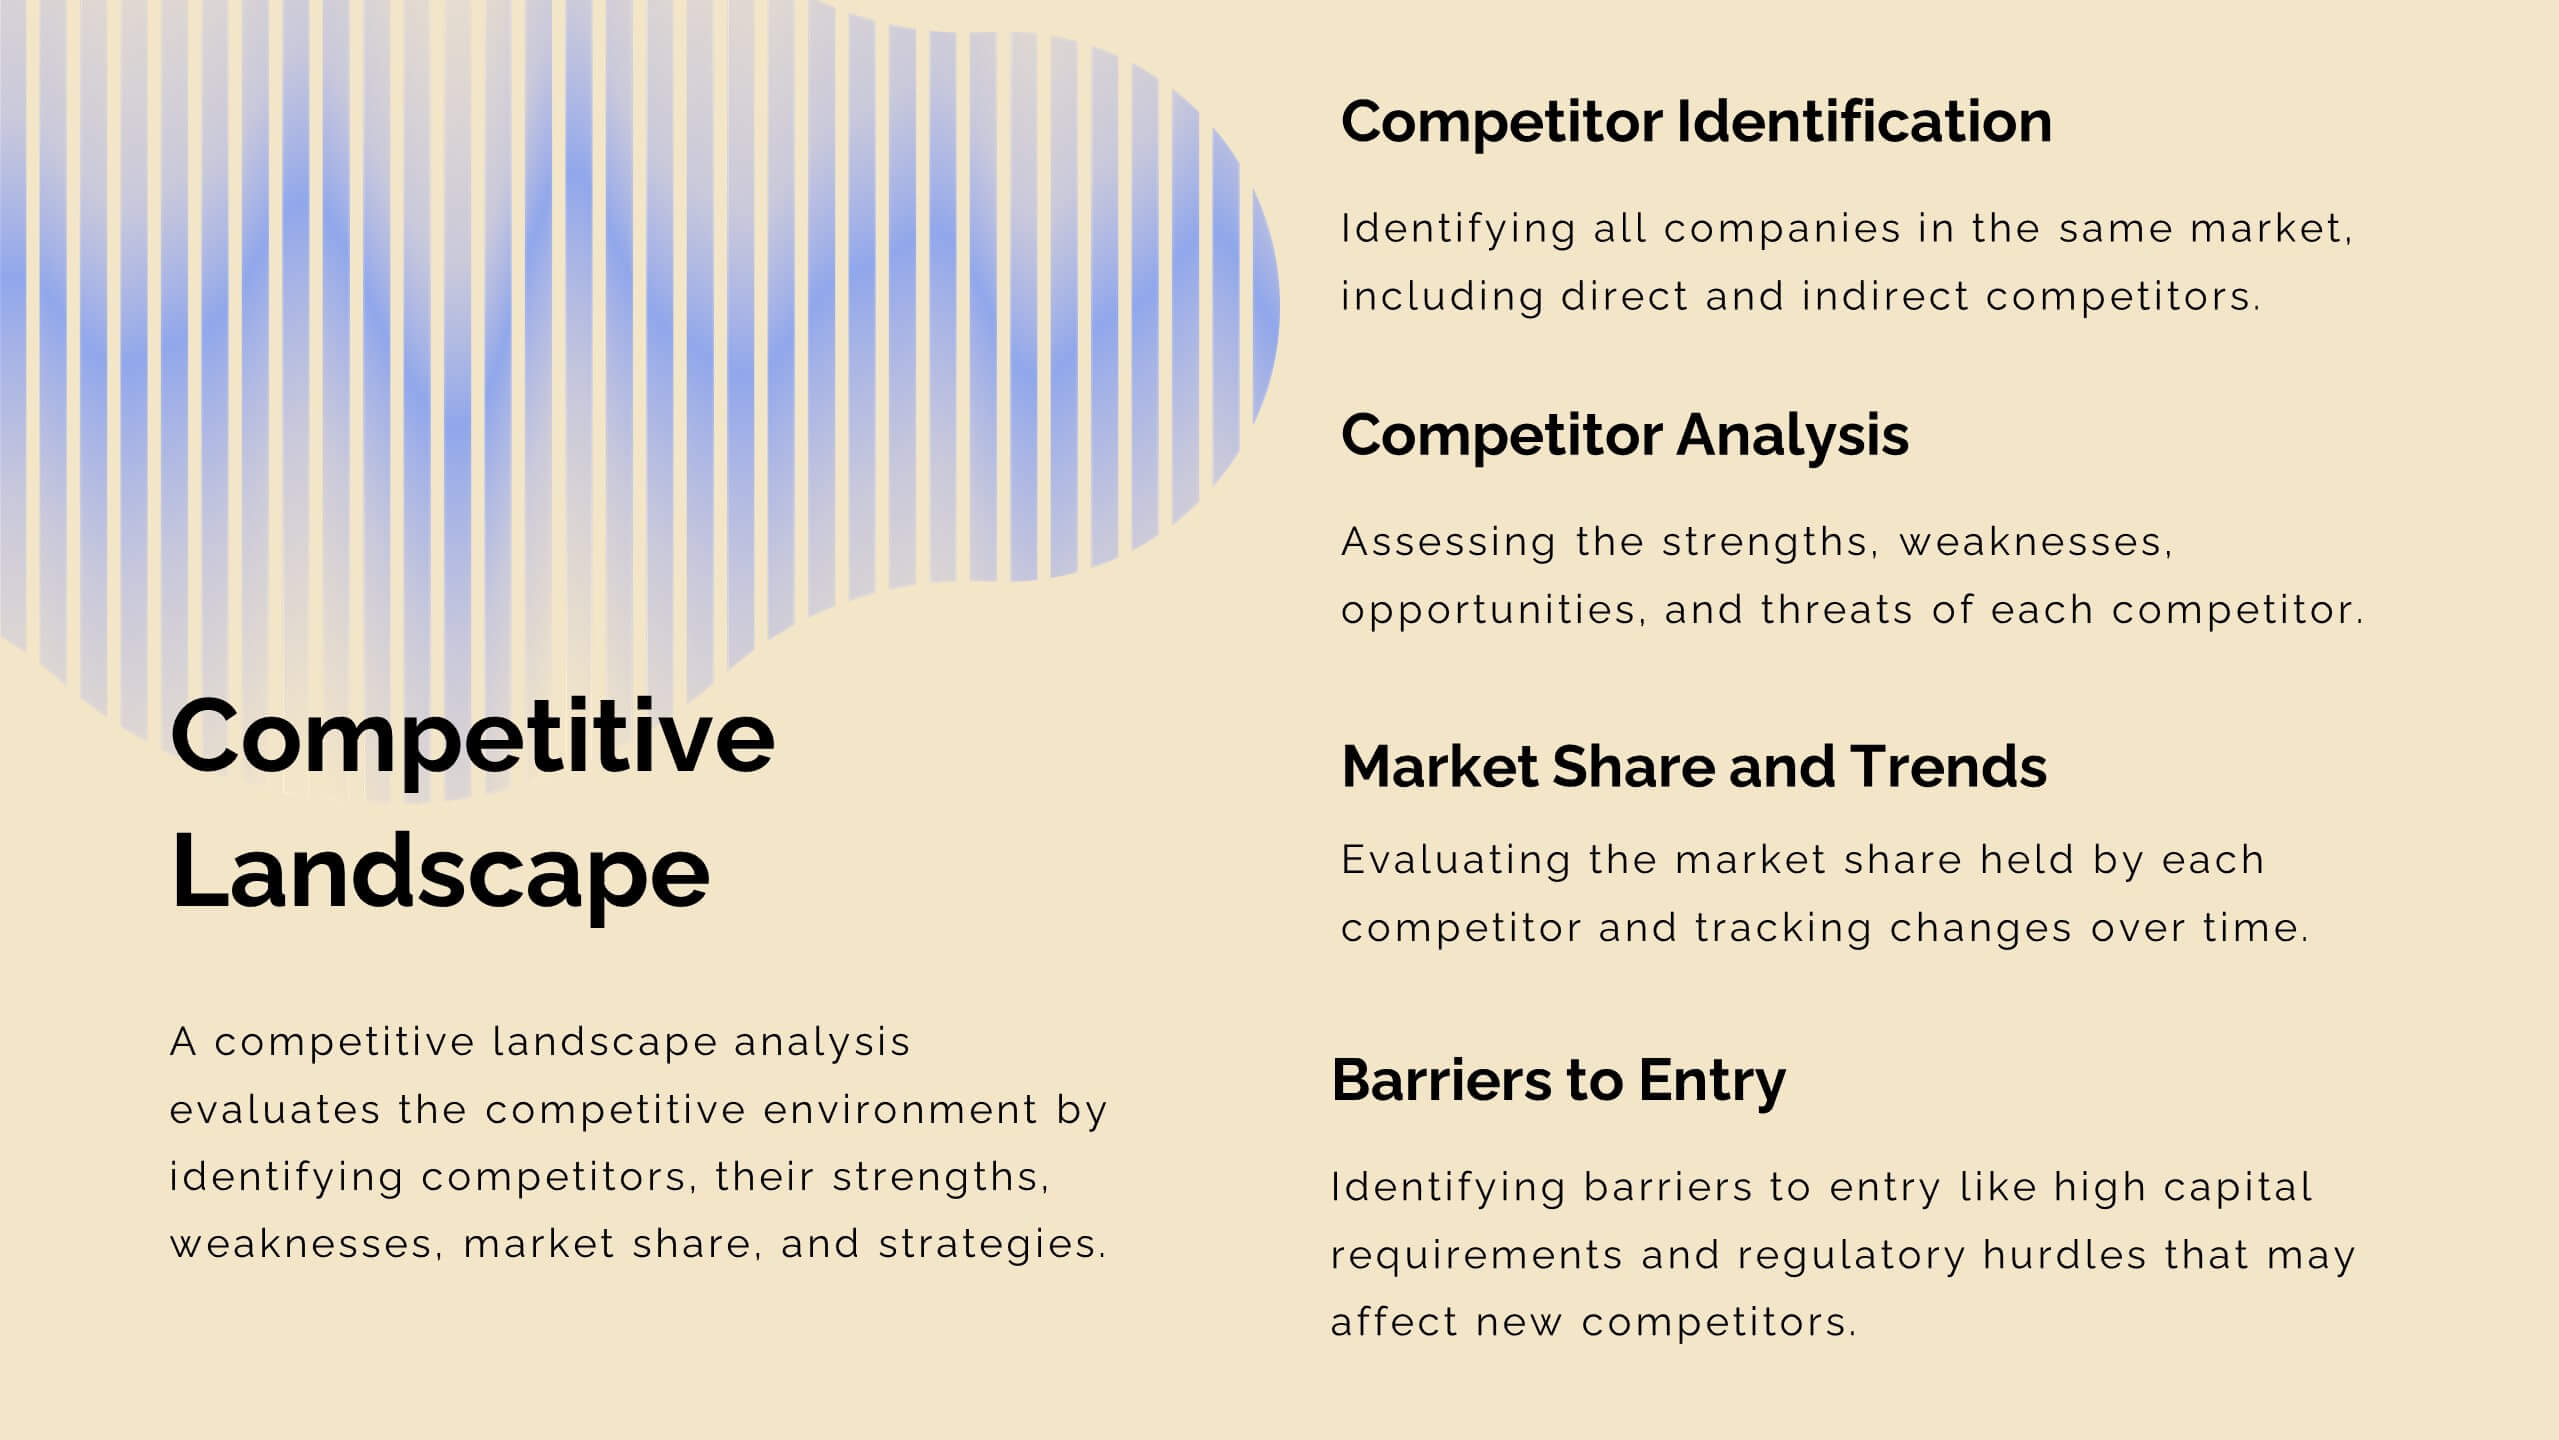
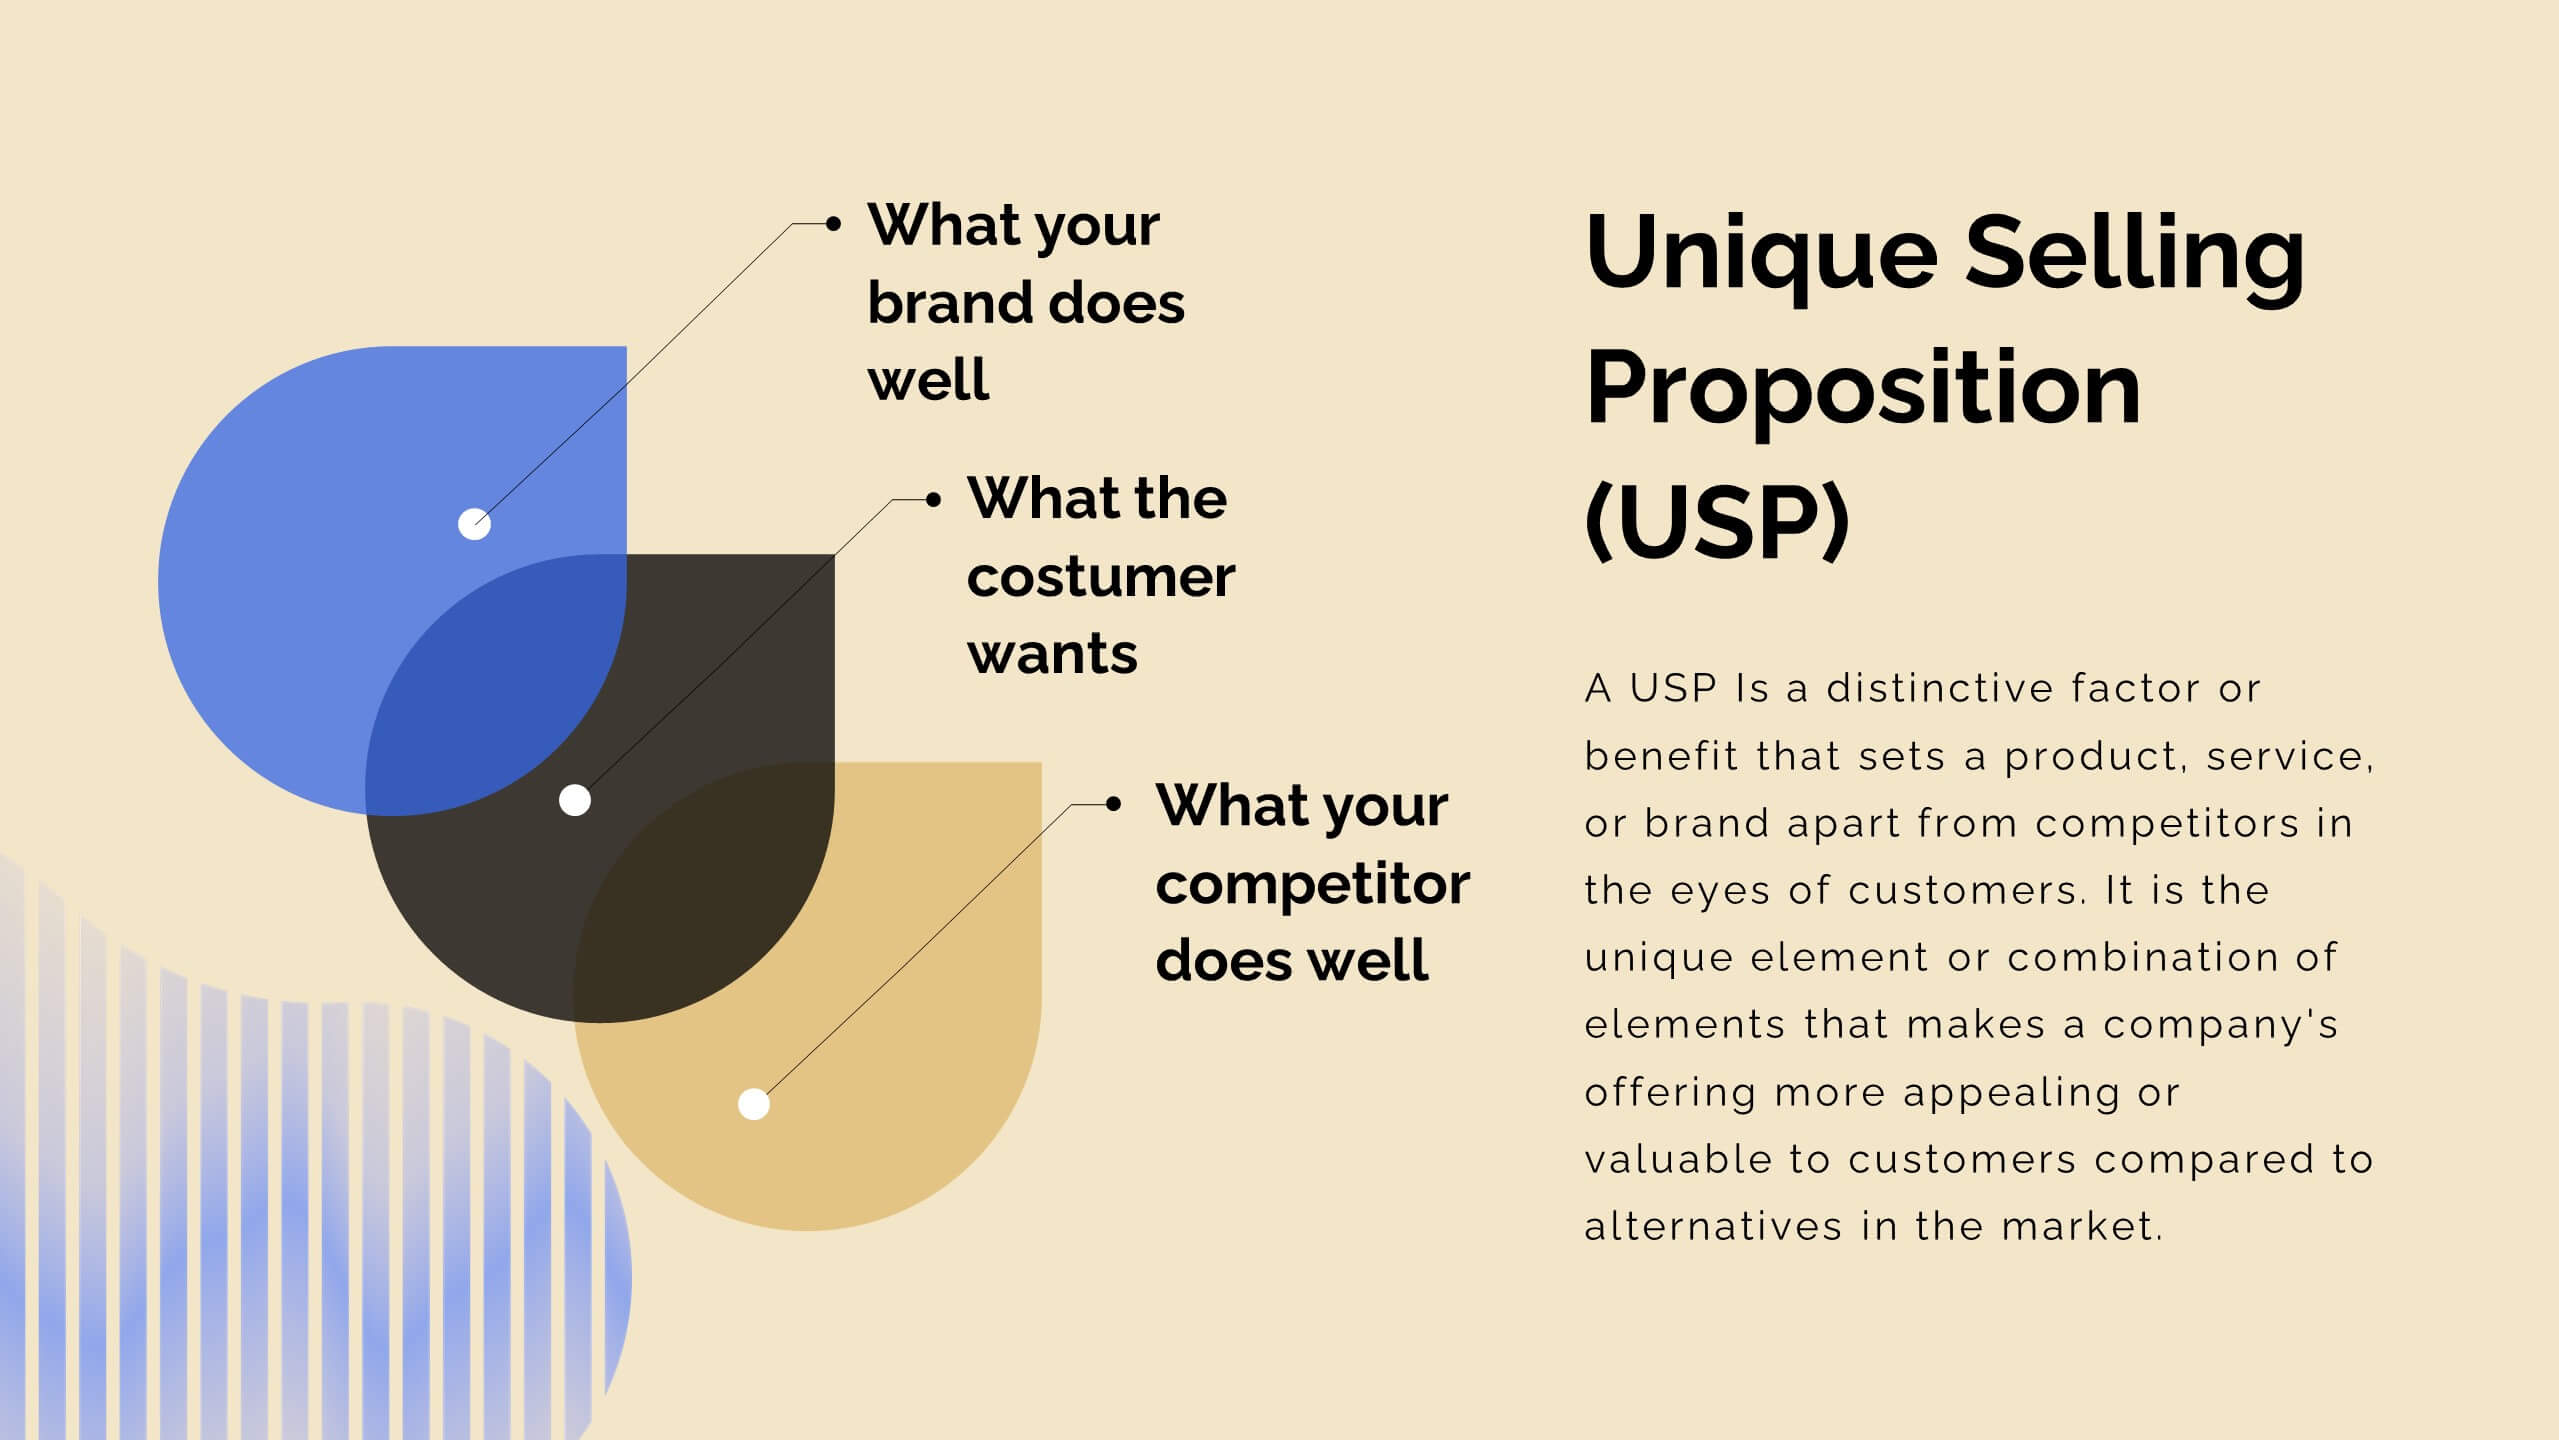
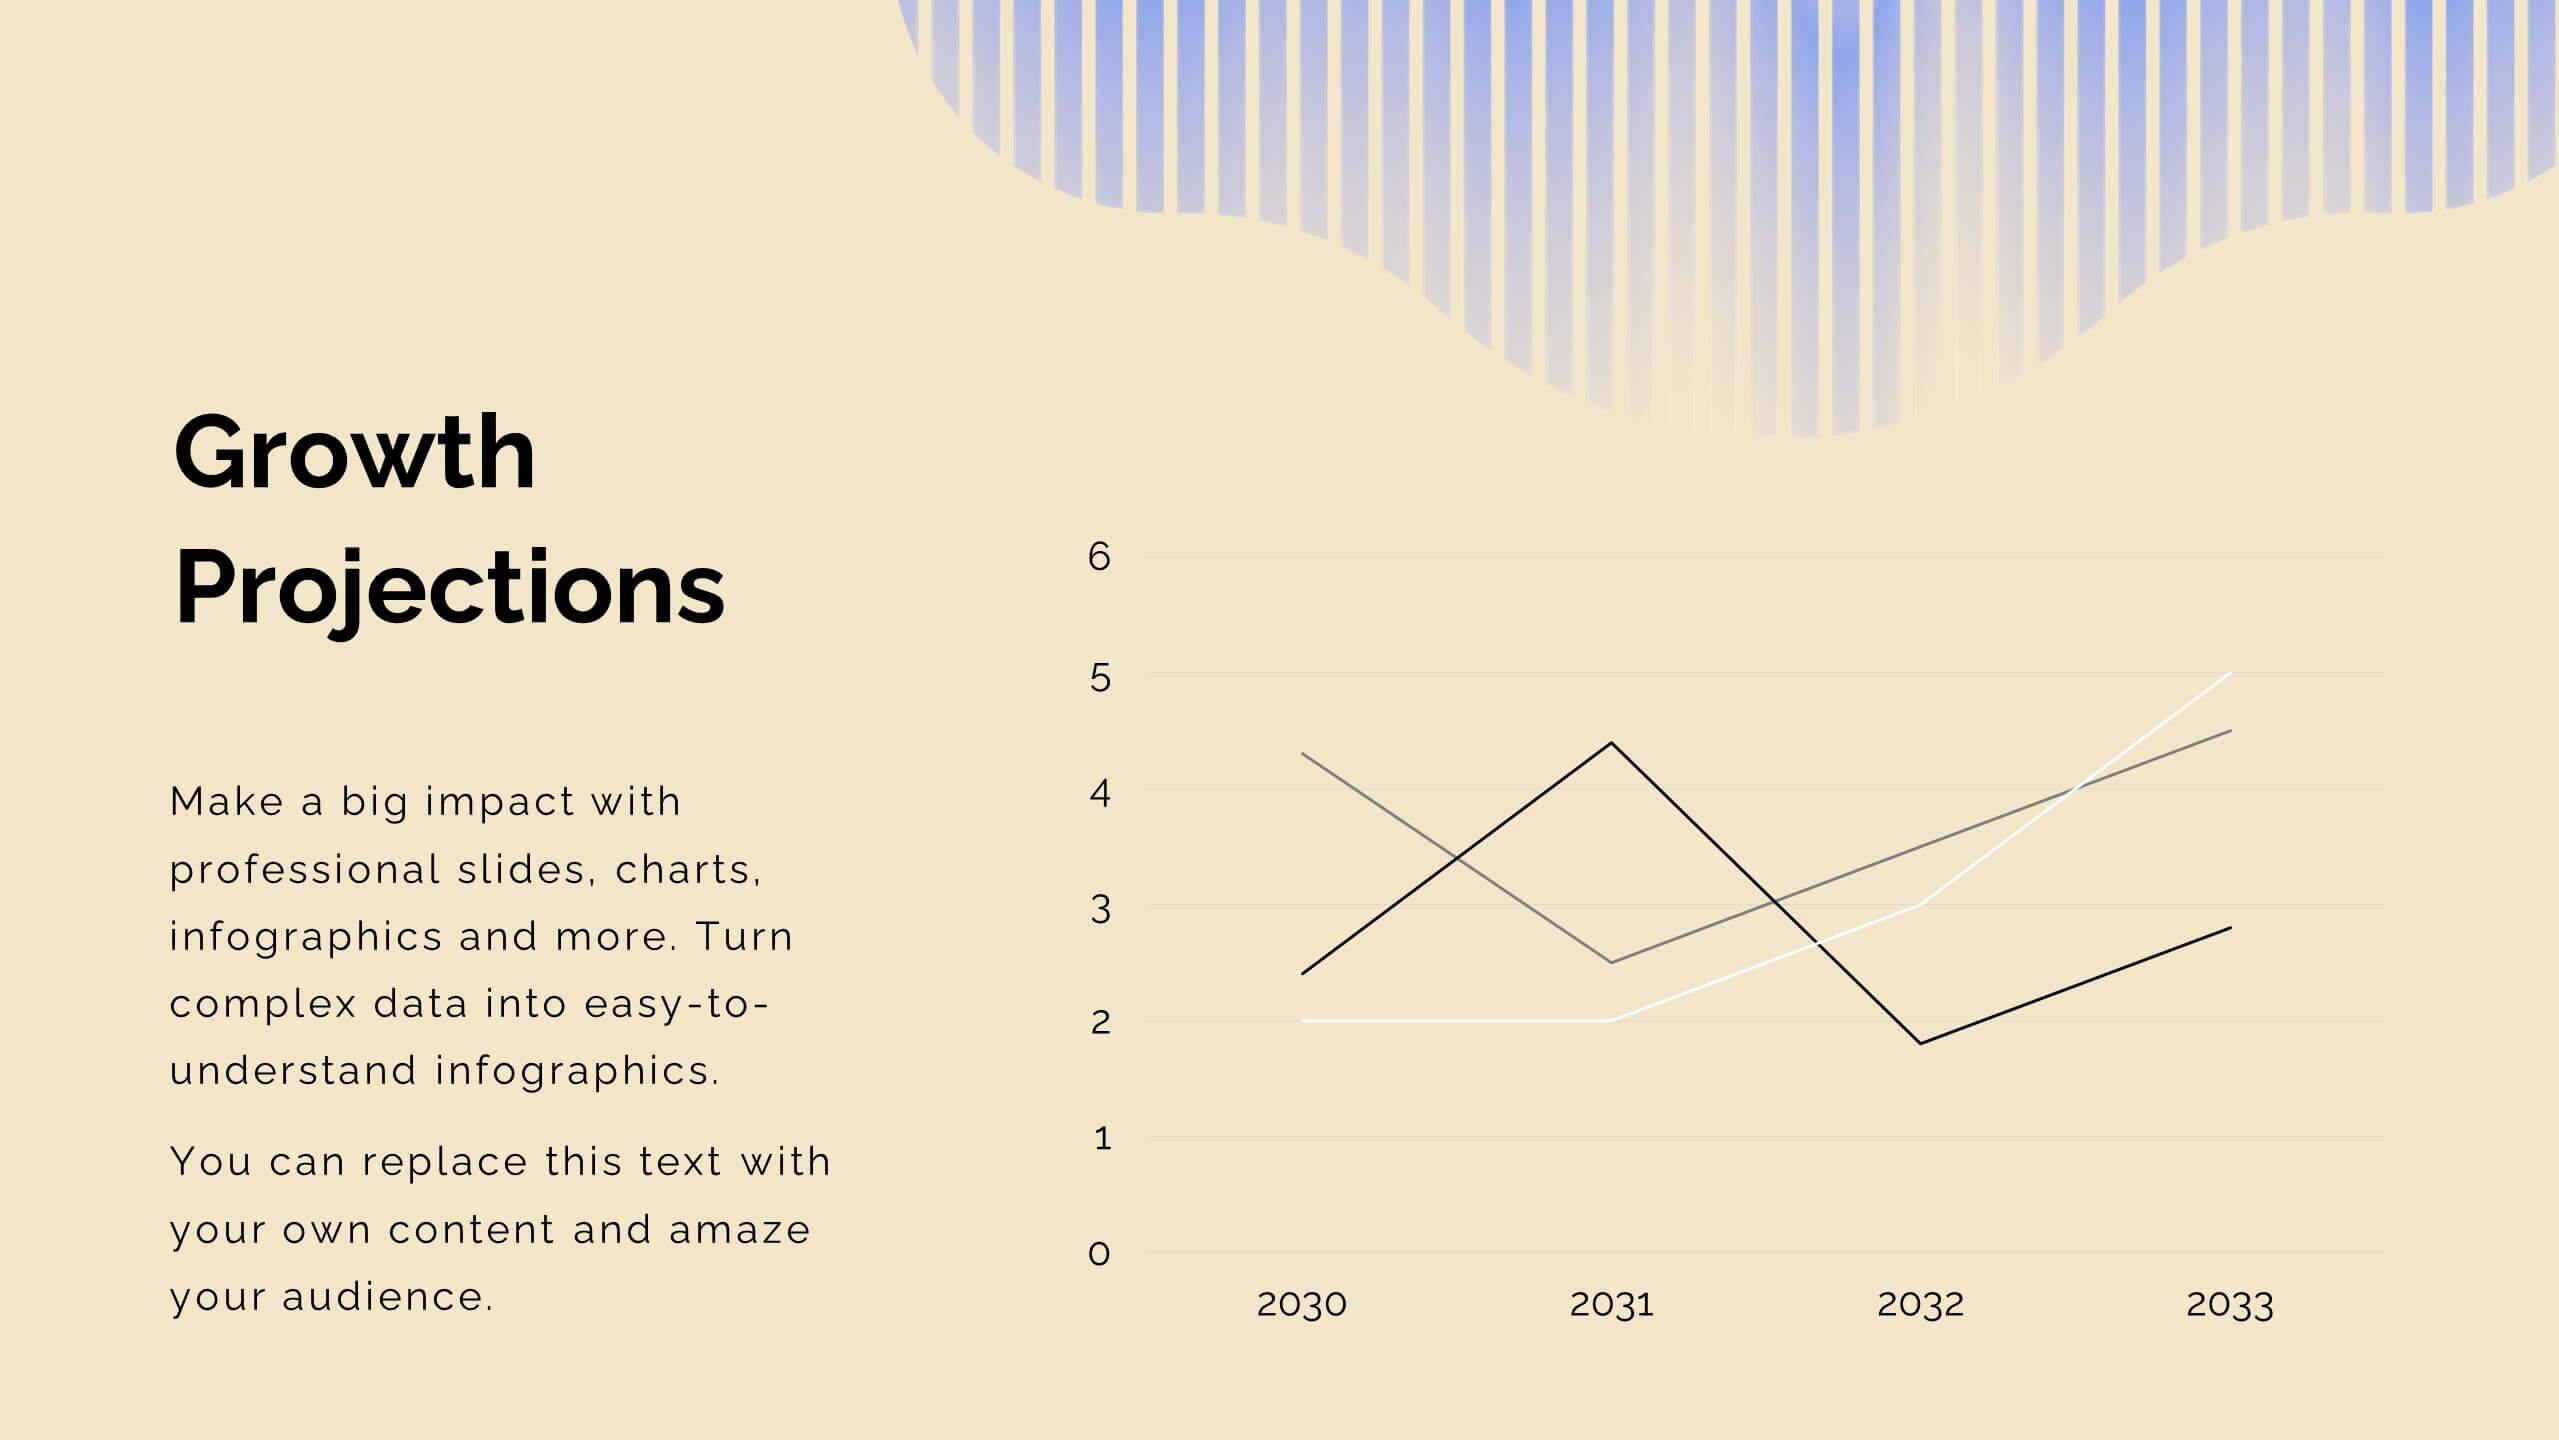
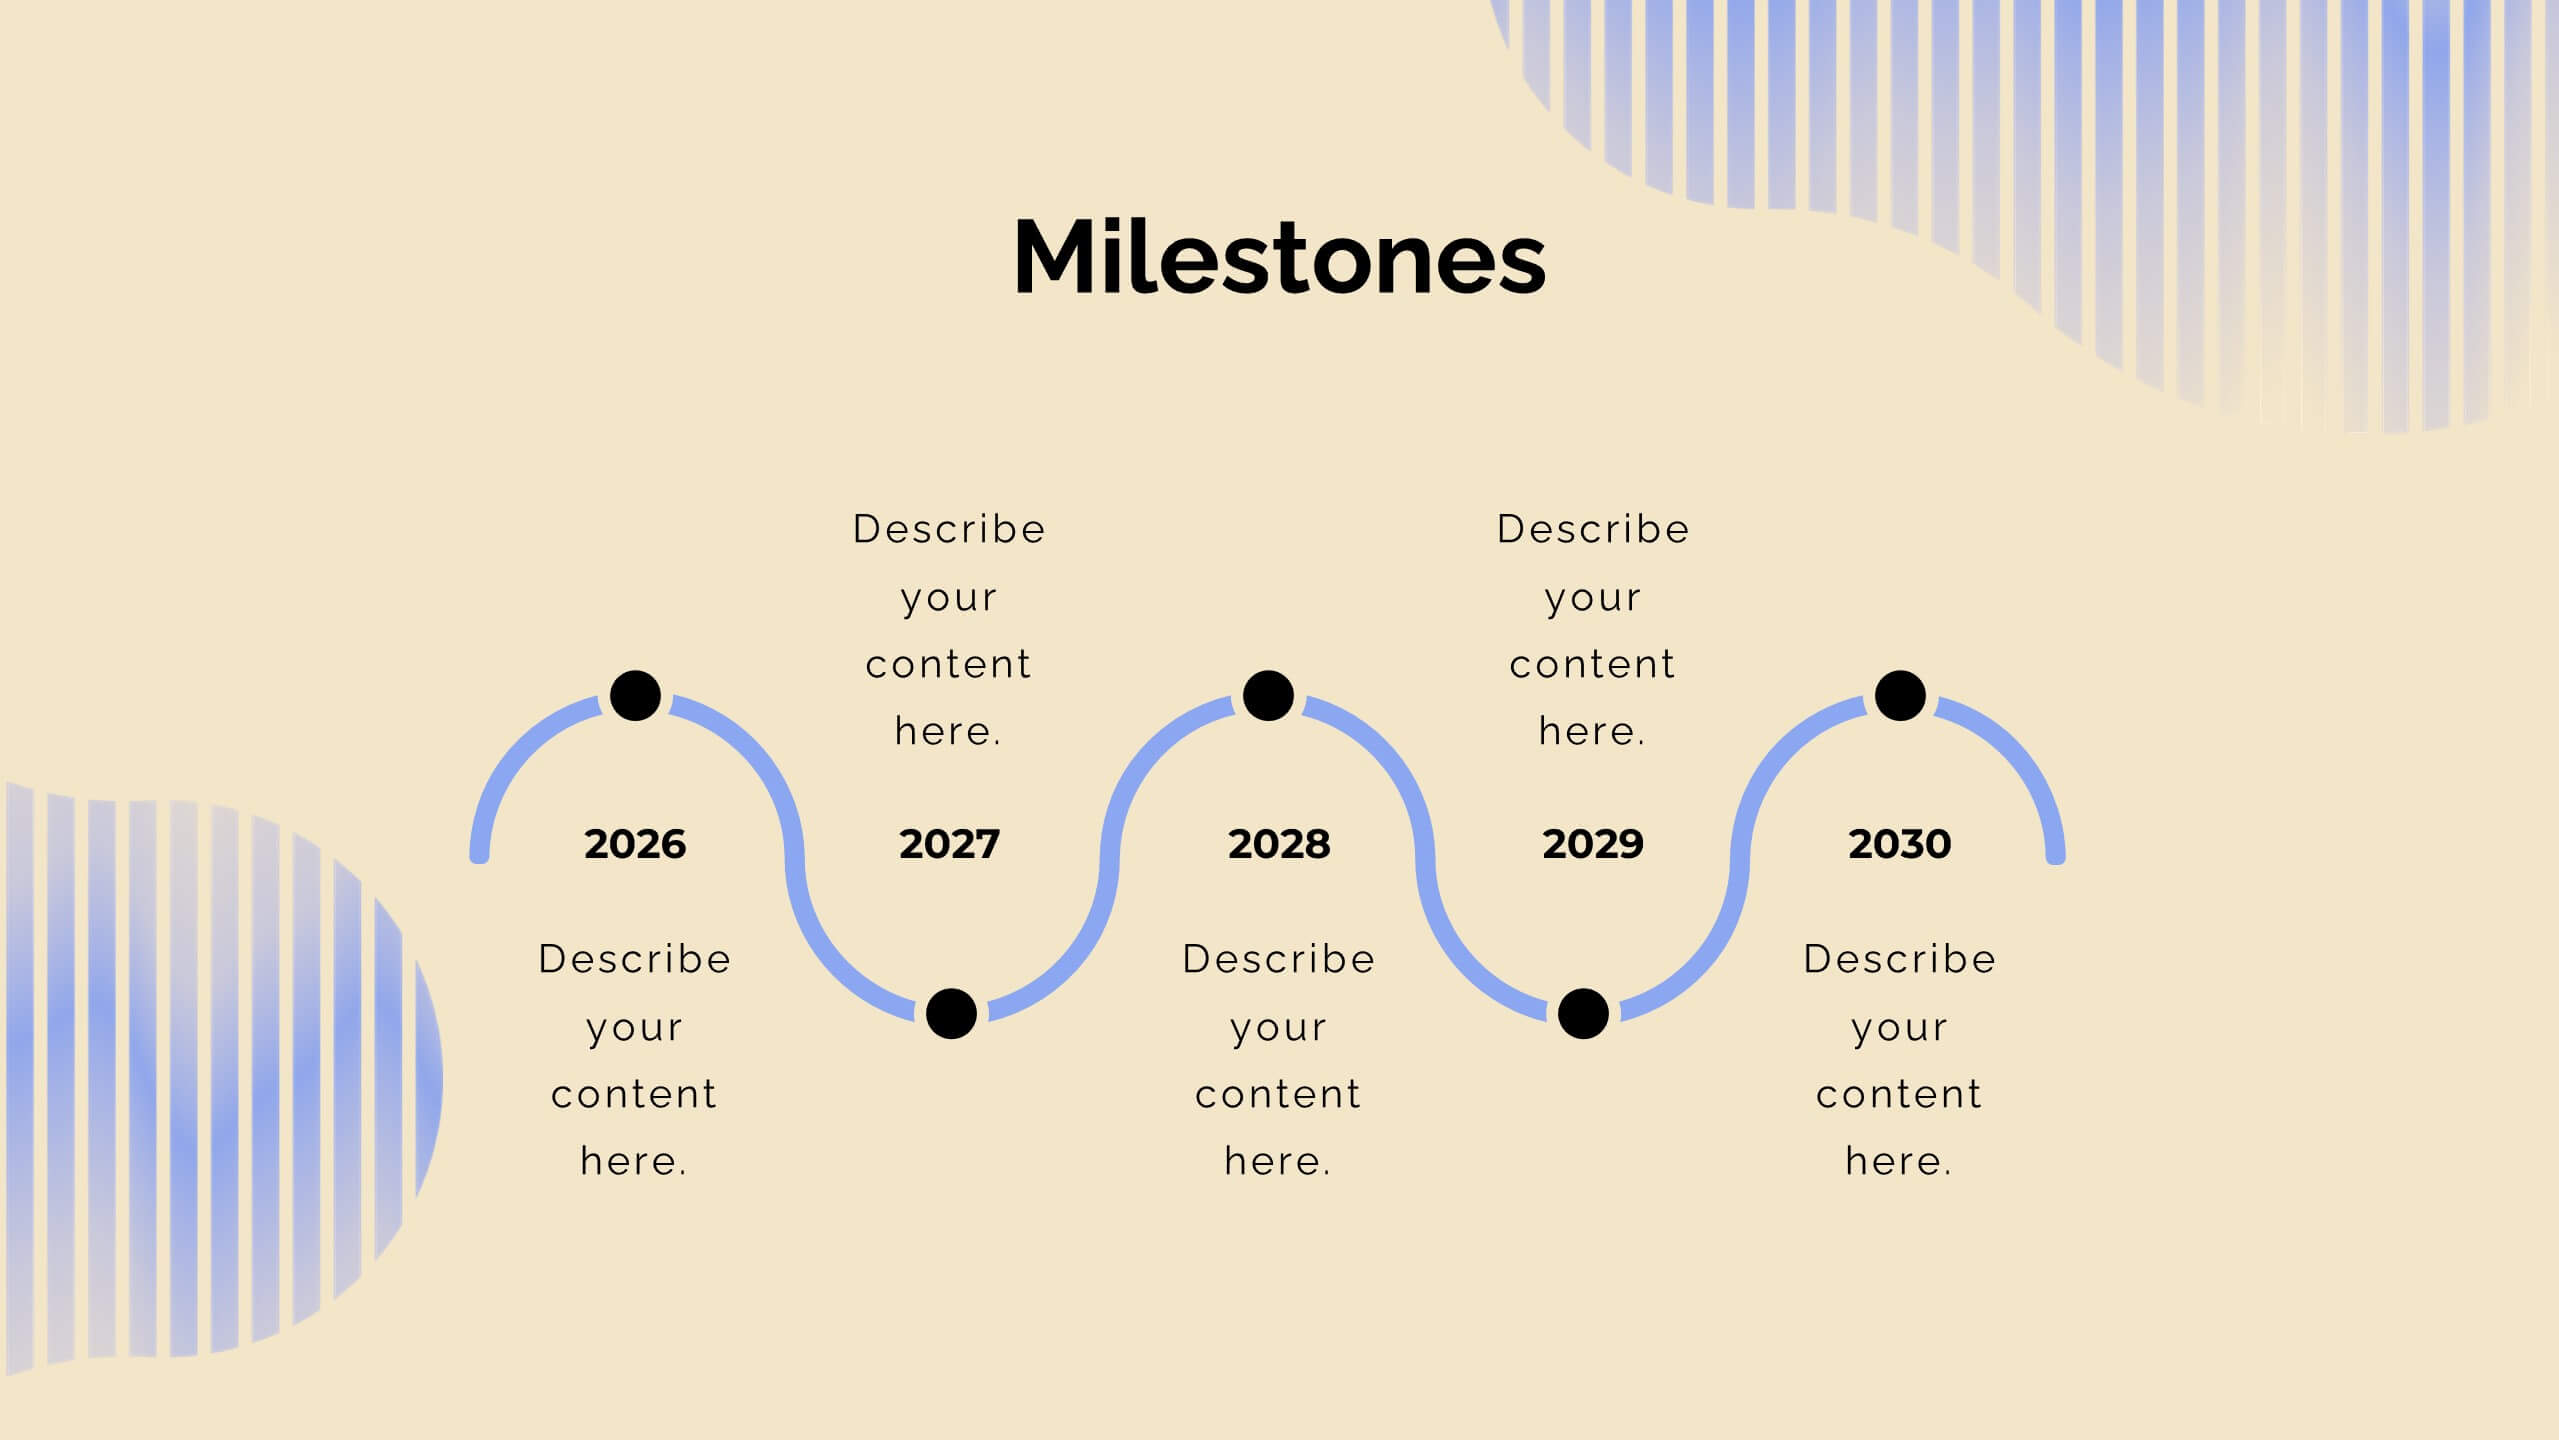
Journey Product Roadmap Presentation
Embark on a seamless journey through your product’s lifecycle with this comprehensive roadmap template! Perfect for illustrating key milestones, business models, and market opportunities, it’s your go-to for clear and engaging presentations. Dive into competitive analysis, showcase your unique selling proposition, and outline your growth projections with style. Compatible with PowerPoint, Keynote, and Google Slides.


4 diapositivas
Europe Market Expansion Visualization Presentation
Showcase your European growth strategy with the Europe Market Expansion Visualization Presentation. This map-based slide design allows you to clearly highlight regional opportunities, new market entries, and key expansion zones using icons and color-coded country markers. Ideal for strategic planning, investor updates, and sales overviews. Fully editable in PowerPoint, Keynote, Google Slides, and Canva.


8 diapositivas
Survey Poll Results Visualization Presentation
Easily showcase your survey or poll data with this bold and modern results visualization slide. Designed with eye-catching circular charts, it helps your audience quickly grasp key insights at a glance. Perfect for business reviews, feedback summaries, or internal reports. Compatible with PowerPoint, Keynote, and Google Slides.


5 diapositivas
Employee Training Needs Skills Gap Presentation
Optimize Workforce Training with a Skills Gap Analysis! The Employee Training Needs Skills Gap template helps HR teams, trainers, and managers visualize skill gaps, assess employee competencies, and align training programs with business goals. Featuring an interactive dot matrix layout, this template enables clear comparisons across skill areas, ensuring targeted and efficient upskilling strategies. Fully customizable in PowerPoint, Keynote, and Google Slides, it streamlines workforce development planning for maximum impact and growth.


7 diapositivas
Asia Regions Map Infographic
Embark on a visual journey across the vast and diverse continent of Asia with our meticulously crafted map infographic. Painted in the cultural richness of red, the depth of blue, and the clarity of white, our template captures the essence of Asia in all its glory. Adorned with pinpoint infographics, symbolic icons, and region-specific image placeholders, it serves as a comprehensive guide to Asia's multifaceted landscape. Impeccably designed for Powerpoint, Keynote, or Google Slides. An indispensable resource for educators, travelers, researchers, or businesses venturing into the Asian market. Explore with purpose; let every slide be a step into Asia's vibrant tapestry.


10 diapositivas
Brand Loyalty and Customer Retention Presentation
Strengthen your brand’s relationship with your audience using the "Brand Loyalty and Customer Retention" presentation template. This design effectively illustrates how strong branding strategies enhance customer loyalty and retention rates. Ideal for marketers and business strategists, this template is fully compatible with PowerPoint, Keynote, and Google Slides, making it perfect for presentations aimed at improving customer engagement and business growth.


8 diapositivas
Typography Alphabet Grid Concept
Showcase your message with bold clarity using the Typography Alphabet Grid Concept Presentation. Featuring a striking letterform at the center and four customizable sections for key points, this layout is perfect for creative overviews, branding, or idea segmentation. Fully editable in PowerPoint, Keynote, and Google Slides.


5 diapositivas
Responsibility Assignment Matrix Slide
Make project accountability crystal clear with this smart and structured matrix designed for assigning responsibilities across roles. Ideal for outlining who's doing what in multi-team environments, this slide keeps everyone on the same page using the classic RACI method. Fully compatible with PowerPoint, Keynote, and Google Slides.


13 diapositivas
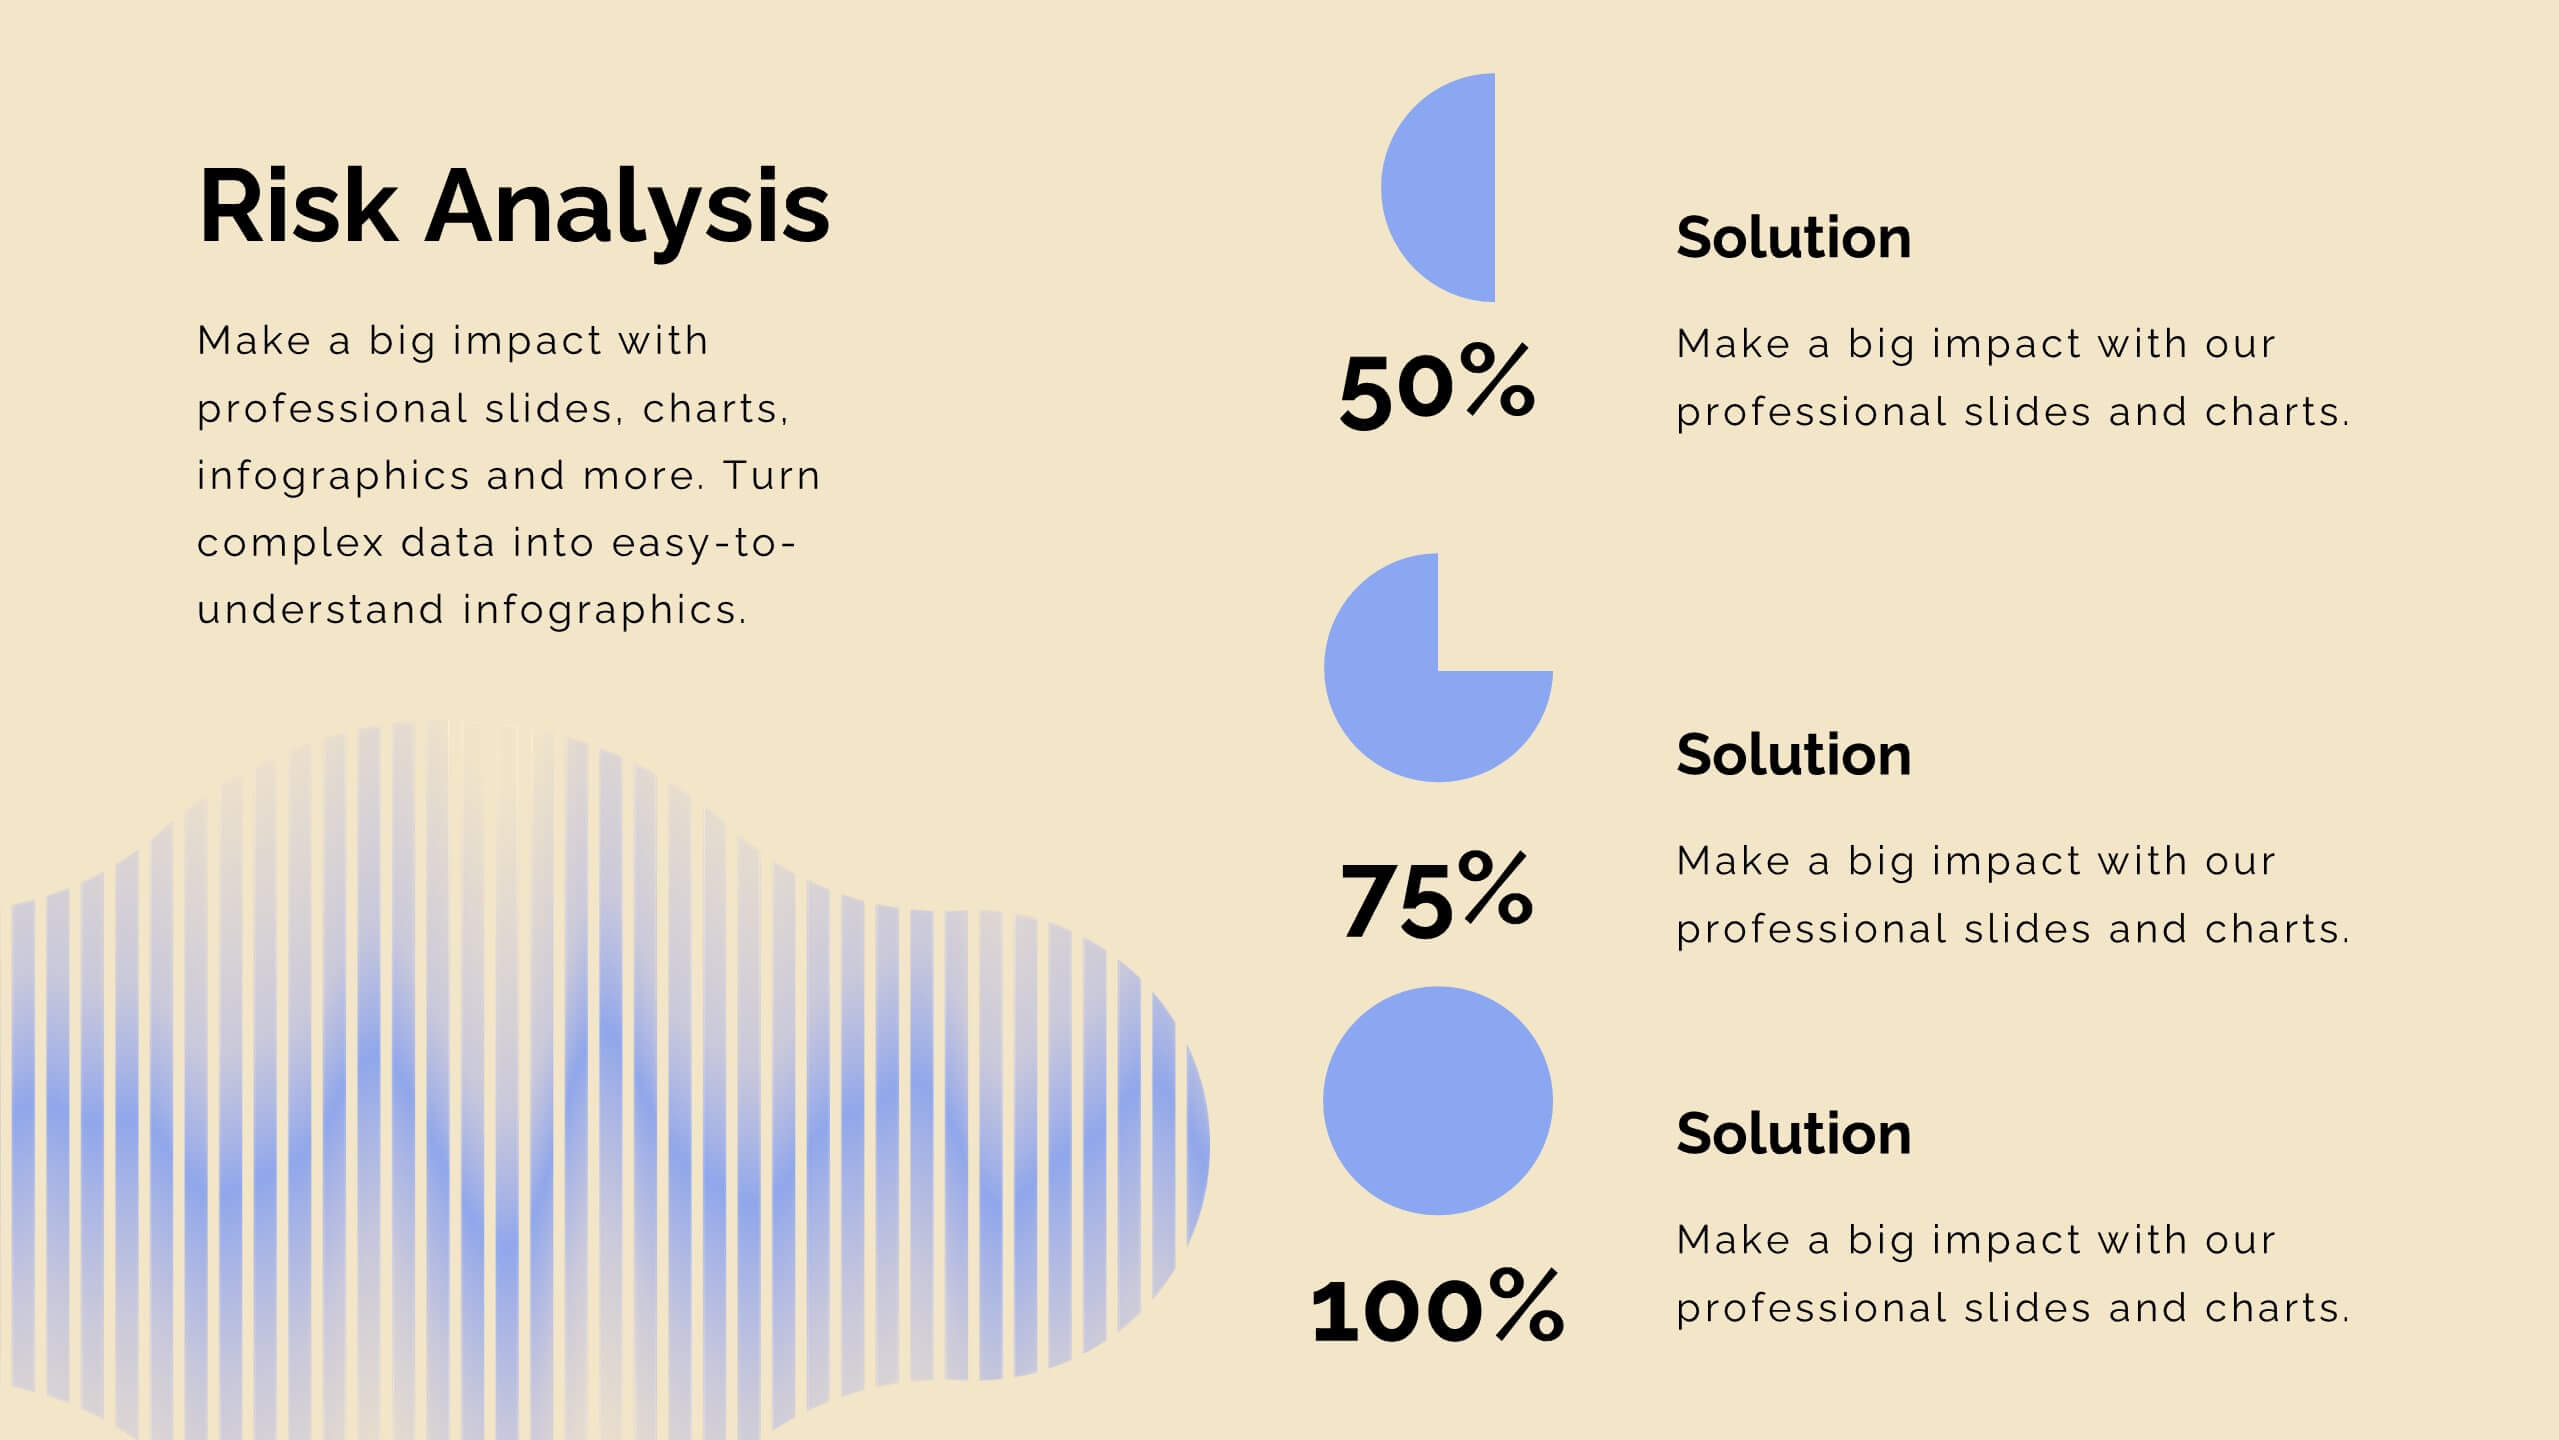
Key Performance Indicators (KPI) Presentation
Track success with the Key Performance Indicators (KPI) Presentation template. This data-driven layout showcases essential metrics, from social media engagement to financial performance, helping you visualize progress and optimize strategies. Perfect for business reports, marketing analysis, and executive dashboards. Fully customizable in PowerPoint, Keynote, and Google Slides for seamless integration into your workflow.


8 diapositivas
Cognitive Mapping and Brain Thinking
Visualize complex ideas clearly with the Cognitive Mapping and Brain Thinking Presentation—a sleek, brain-themed layout designed to display four key concepts connected to a central idea. Each node uses a minimalist icon and color-coded bubble to guide your audience through thought patterns, processes, or strategic insights. Ideal for psychology, education, or innovation workshops. Fully editable in PowerPoint, Keynote, and Google Slides.


5 diapositivas
Employee Feedback Survey Report Presentation
Deliver clear insights into team sentiment with this employee rating slide. Designed with star rating visuals and thumbs-up iconography, it's perfect for showcasing staff satisfaction, engagement, and performance reviews. Easy to customize in PowerPoint, Keynote, and Google Slides.


5 diapositivas
Energy Sources in The United States Infographics
Energy Sources in The United States Infographics is a bold, colorful, and modern presentation