


Características


¿Tienes alguna pregunta?
Recomendar


7 diapositivas
Puzzle Communication Infographic
Piece together the art of effective communication with our puzzle communication infographic. Set on a sleek white foundation, complemented by the enigma of purple, the zest of orange, and the passion of red, this template ingeniously utilizes puzzle pieces to symbolize interconnected communication elements. Enhanced with inventive infographics, representative icons, and adjustable image placeholders, it offers a comprehensive exploration of communication dynamics. Exquisitely crafted for Powerpoint, Keynote, or Google Slides. An indispensable tool for communication specialists, team leads, trainers, or anyone keen on enhancing interpersonal exchanges.


5 diapositivas
Timeline-Based Year-End Recap Presentation
Summarize milestones with the Timeline-Based Year-End Recap Presentation. This structured, column-based layout allows you to compare achievements across multiple years in a clear, organized format. Each year is color-coded and paired with icons and editable label sections to highlight key points. Ideal for annual reports, strategic reviews, and progress tracking. Fully editable in PowerPoint, Google Slides, and Canva.


4 diapositivas
Business Role Structure Diagram Presentation
Bring your team structure to life with a clear, engaging visual that makes every role instantly understandable. This presentation helps you map relationships, outline responsibilities, and communicate workflow with ease. Designed for simple customization and professional clarity, it supports PowerPoint, Keynote, and Google Slides for seamless editing across platforms.


4 diapositivas
Attention-Interest-Desire-Action Sales Strategy Presentation
Highlight each phase of your sales journey with this clean and modern AIDA model layout. Designed for clarity, it uses bold semicircle visuals and directional arrows to guide your audience from capturing attention to driving action. Perfect for sales teams, marketers, and consultants. Fully editable in PowerPoint, Keynote, and Google Slides.


21 diapositivas
Stellar Content Marketing Pitch Deck Presentation
The Stellar Marketing Pitch Deck template is designed to make your marketing strategies shine like never before! This template is perfect for showcasing your business's potential and engaging your audience with sleek, modern designs that capture attention. Start with a powerful introduction, leading into an in-depth industry overview that highlights key trends and consumer behaviors. With dedicated sections for emerging technologies, content marketing trends, and data-driven marketing, you'll have everything you need to present your innovative approach. The template also includes slides for social media strategies, influencer marketing, and SEO trends, ensuring you're covering all the bases. Personalization trends and video marketing evolution are featured to show your forward-thinking approach, while the customer experience focus slide emphasizes your commitment to quality. Finish strong with insights into e-commerce trends, brand storytelling, and sustainability in marketing. This template is fully compatible with PowerPoint, Keynote, and Google Slides, making it versatile and easy to use for any marketing presentation.


5 diapositivas
Business Strategy Decision Tree Presentation
Streamline your strategic decisions with this Business Strategy Decision Tree template. Designed to visually map out options, outcomes, and key choices, this slide is perfect for business analysts, consultants, and executives. Featuring hierarchical branching with clear icons and customizable sections, it helps illustrate strategic planning, problem-solving, and risk assessment. Fully compatible with PowerPoint, Keynote, and Google Slides for seamless presentation integration.


7 diapositivas
Target Market Segmentation Infographic Presentation
A Target Market refers to a specific group of customers or consumers that a company or organization aims to sell its products or services too. This template has a design that can compliment your company's or organization's branding elements to make it a professional looking presentation. This template is perfect for the audience with in-depth knowledge of marketing; the template allows you to include important facts and statistics that will make it easily understandable by all types of audiences. The template comes with different chart slides, nice color combinations and graphs!


4 diapositivas
Athletic Event Planning and Scoring Presentation
Plan, organize, and present sports events with the Athletic Event Planning and Scoring template. Featuring a pyramid layout with sports icons, clear section labels, and bold color accents, it’s perfect for scheduling, rules, and scoring breakdowns. Fully editable in Canva, PowerPoint, and Google Slides to match your event’s theme and branding.


5 diapositivas
Competitor Comparison Infographics
A Comparison Infographic is a type of visual representation that displays the similarities and differences between two or more items, concepts, or ideas. This template is perfect to help viewers easily make informed decisions based on the comparison. These infographics are visual representations of data that are used to compare two or more things. These infographics can be used to highlight the differences or similarities between different products, services, companies, or any other entities that can be compared. Included are charts, graphs, tables, and other visual elements to help present information in a clear manner.


20 diapositivas
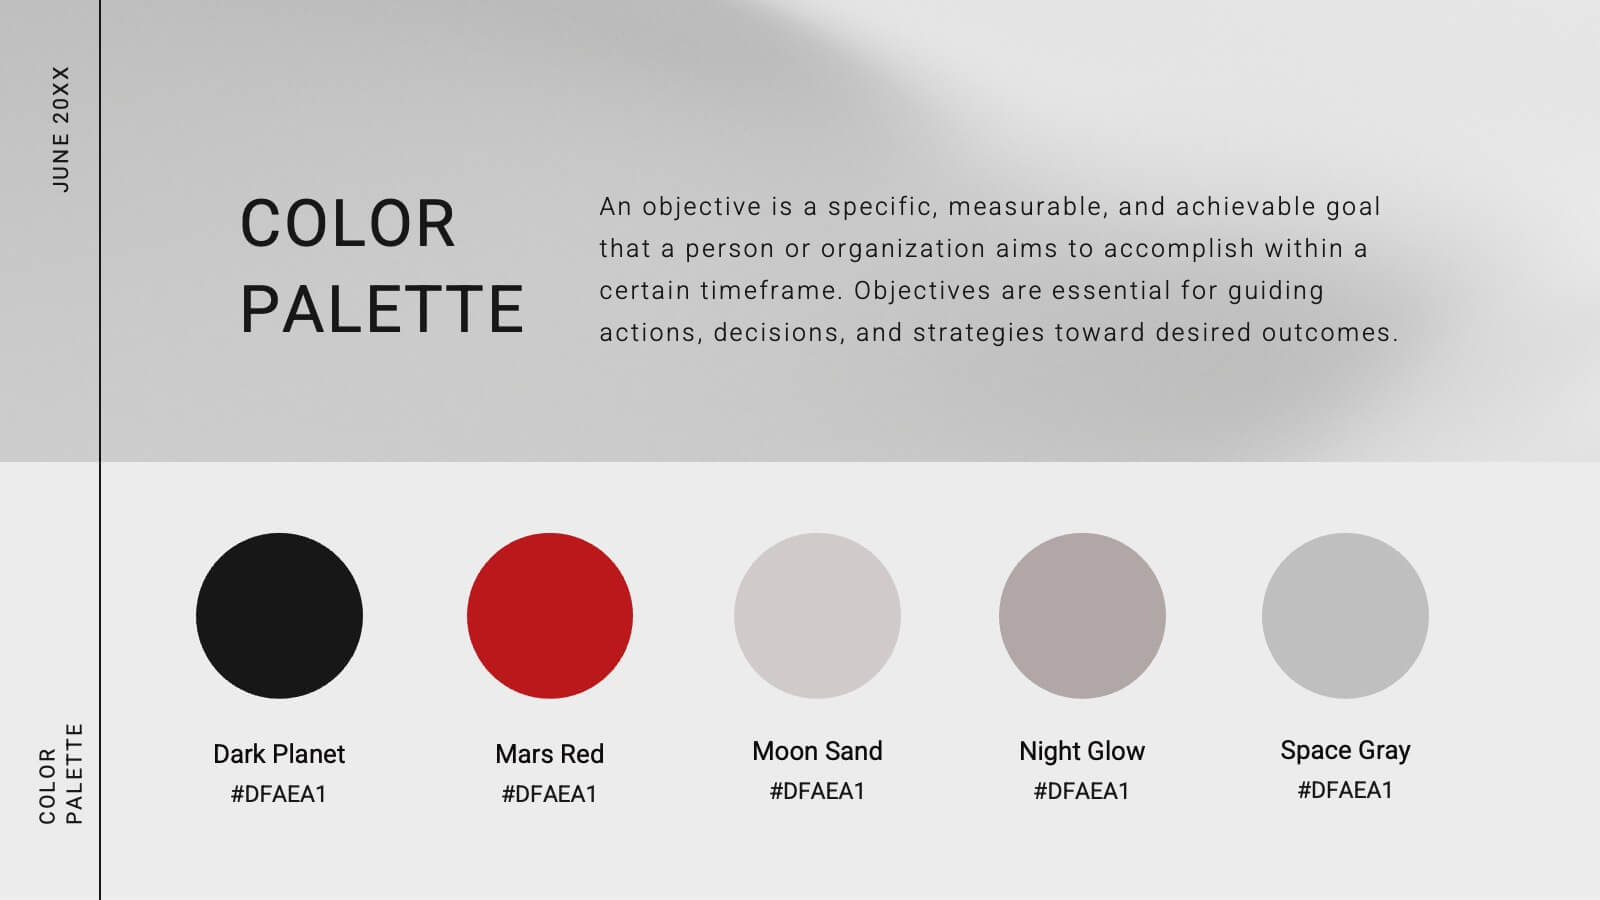
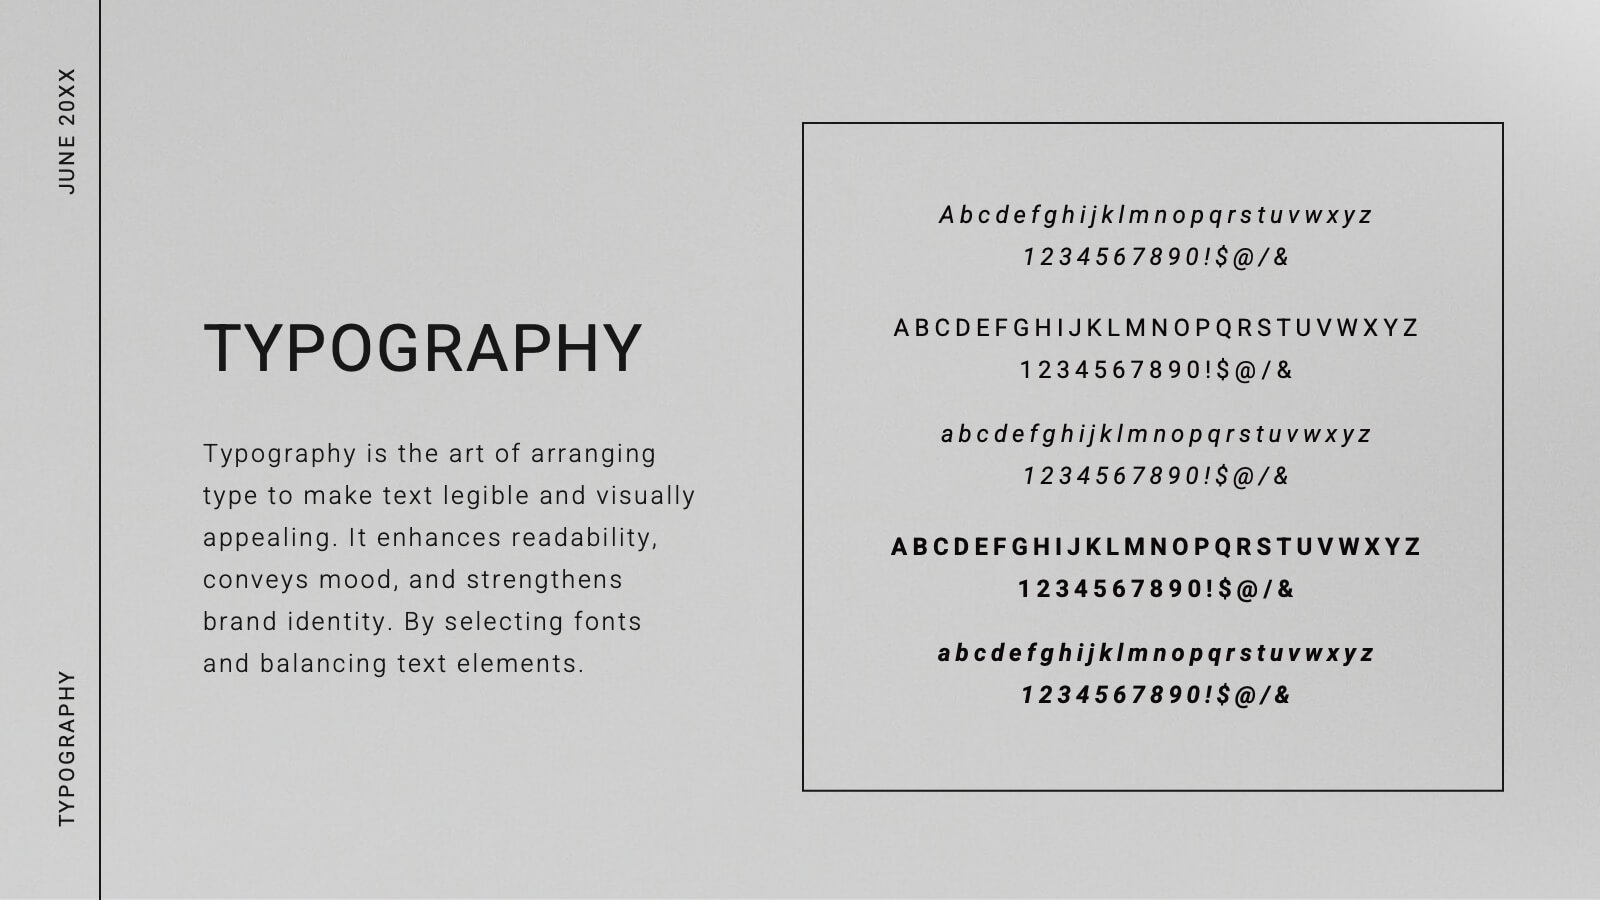
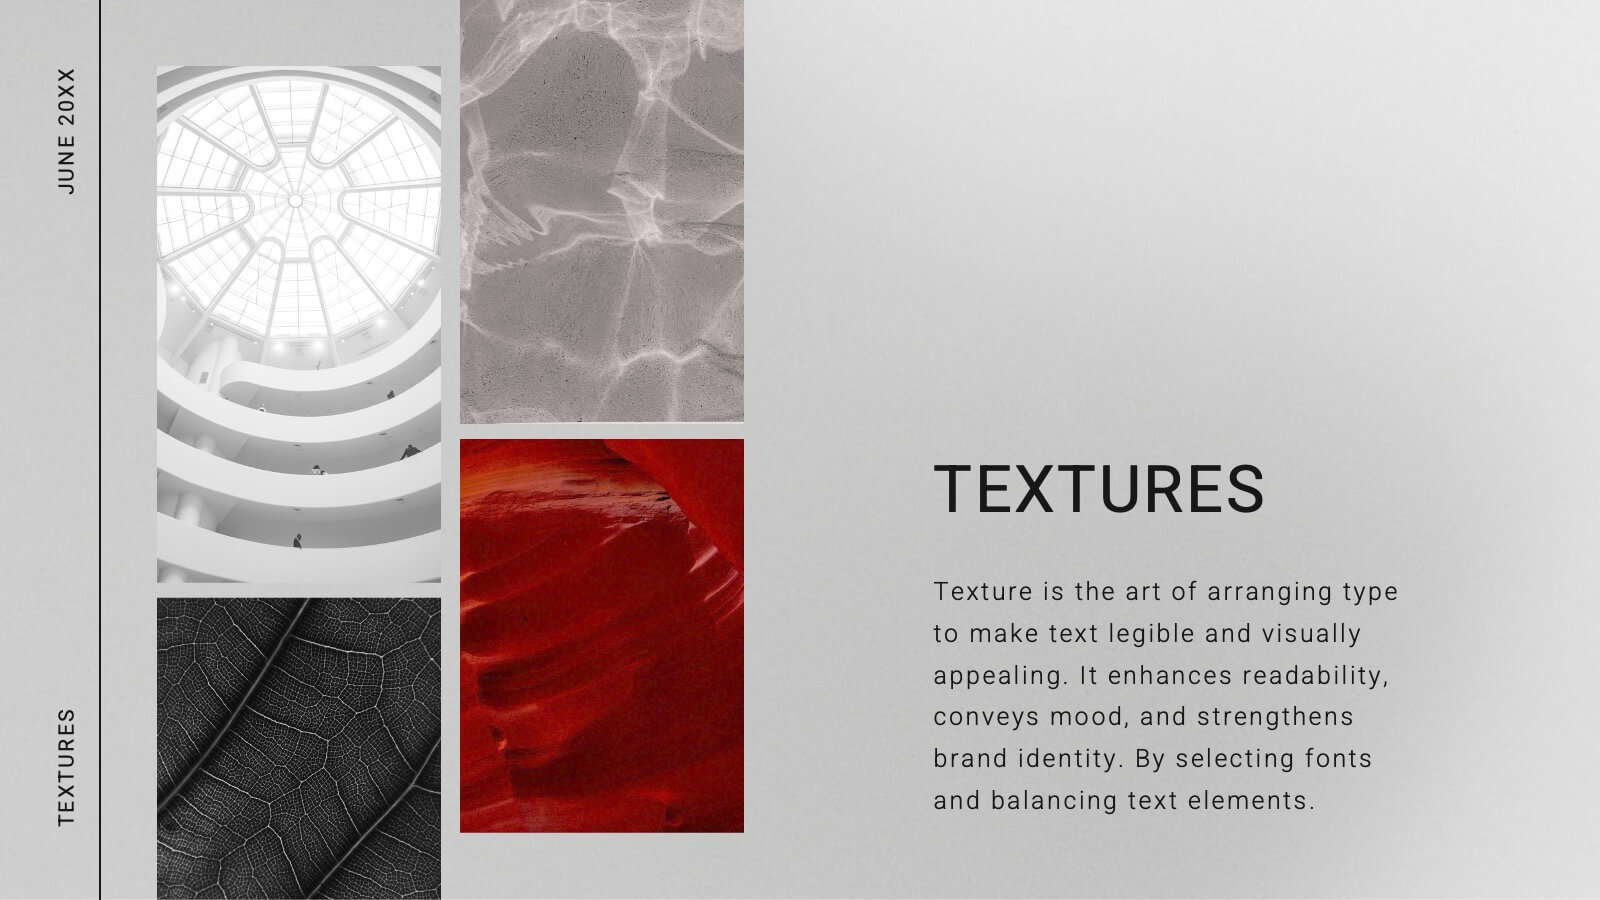
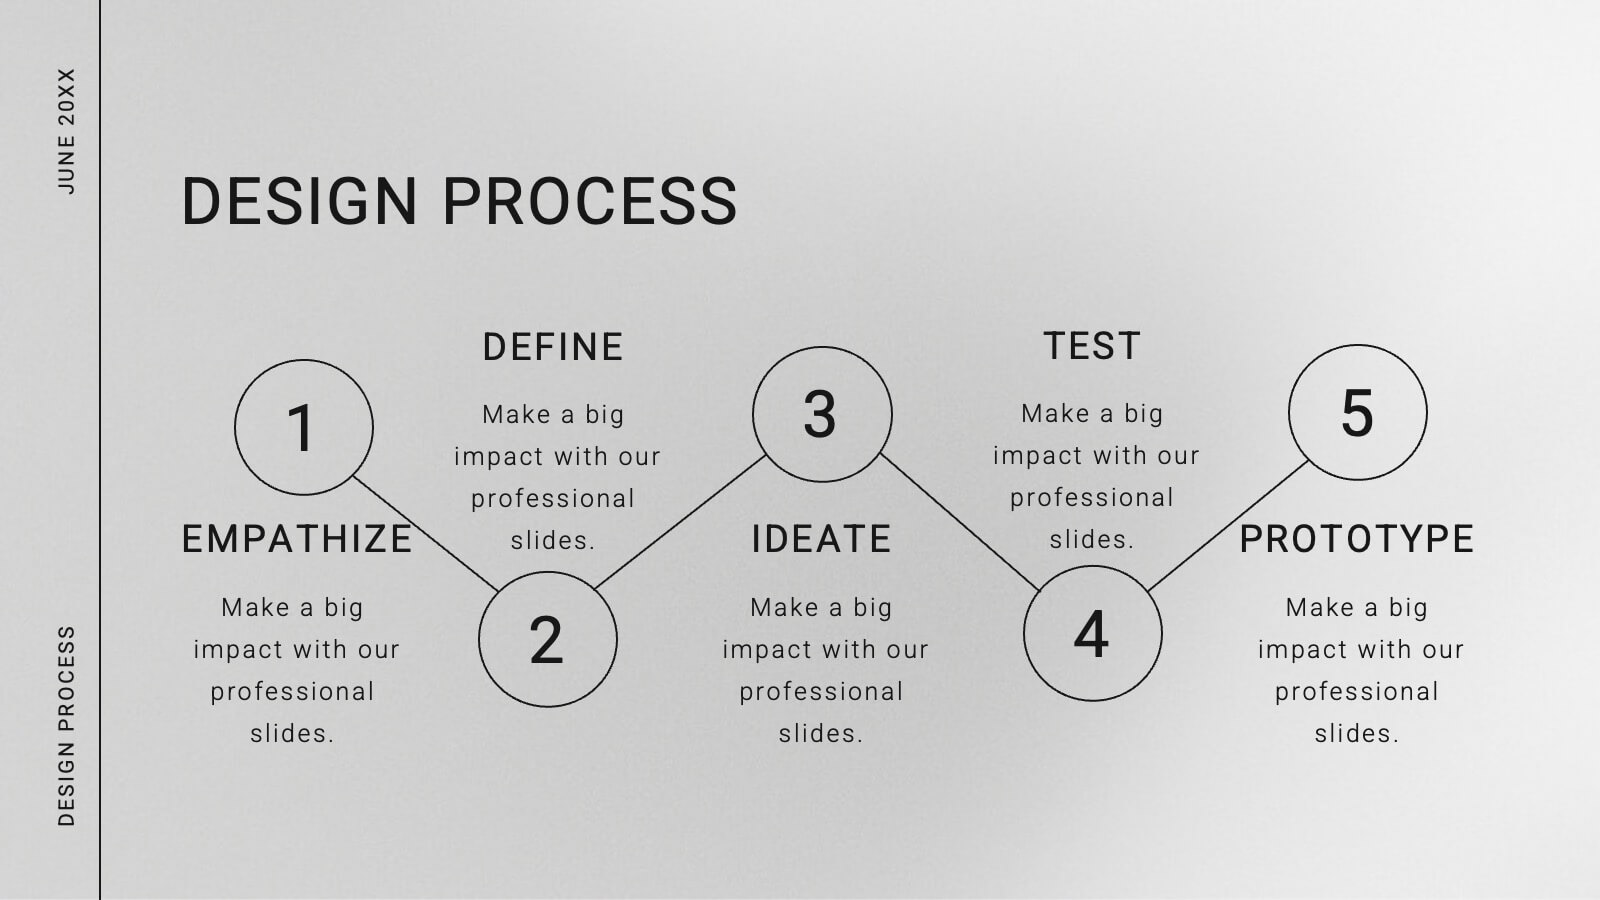
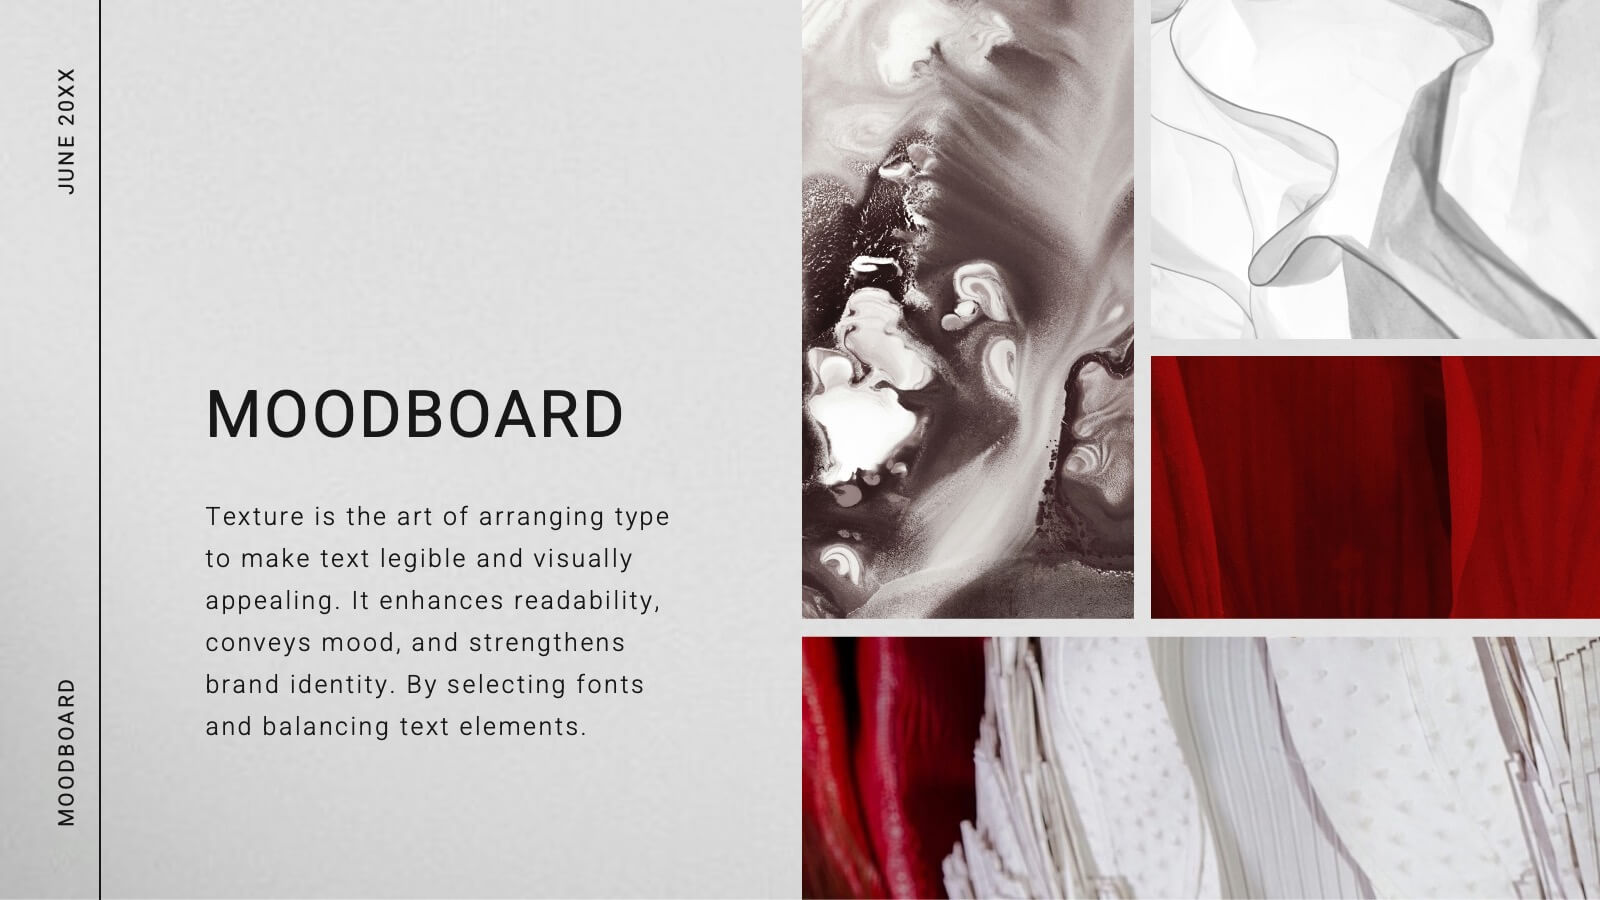
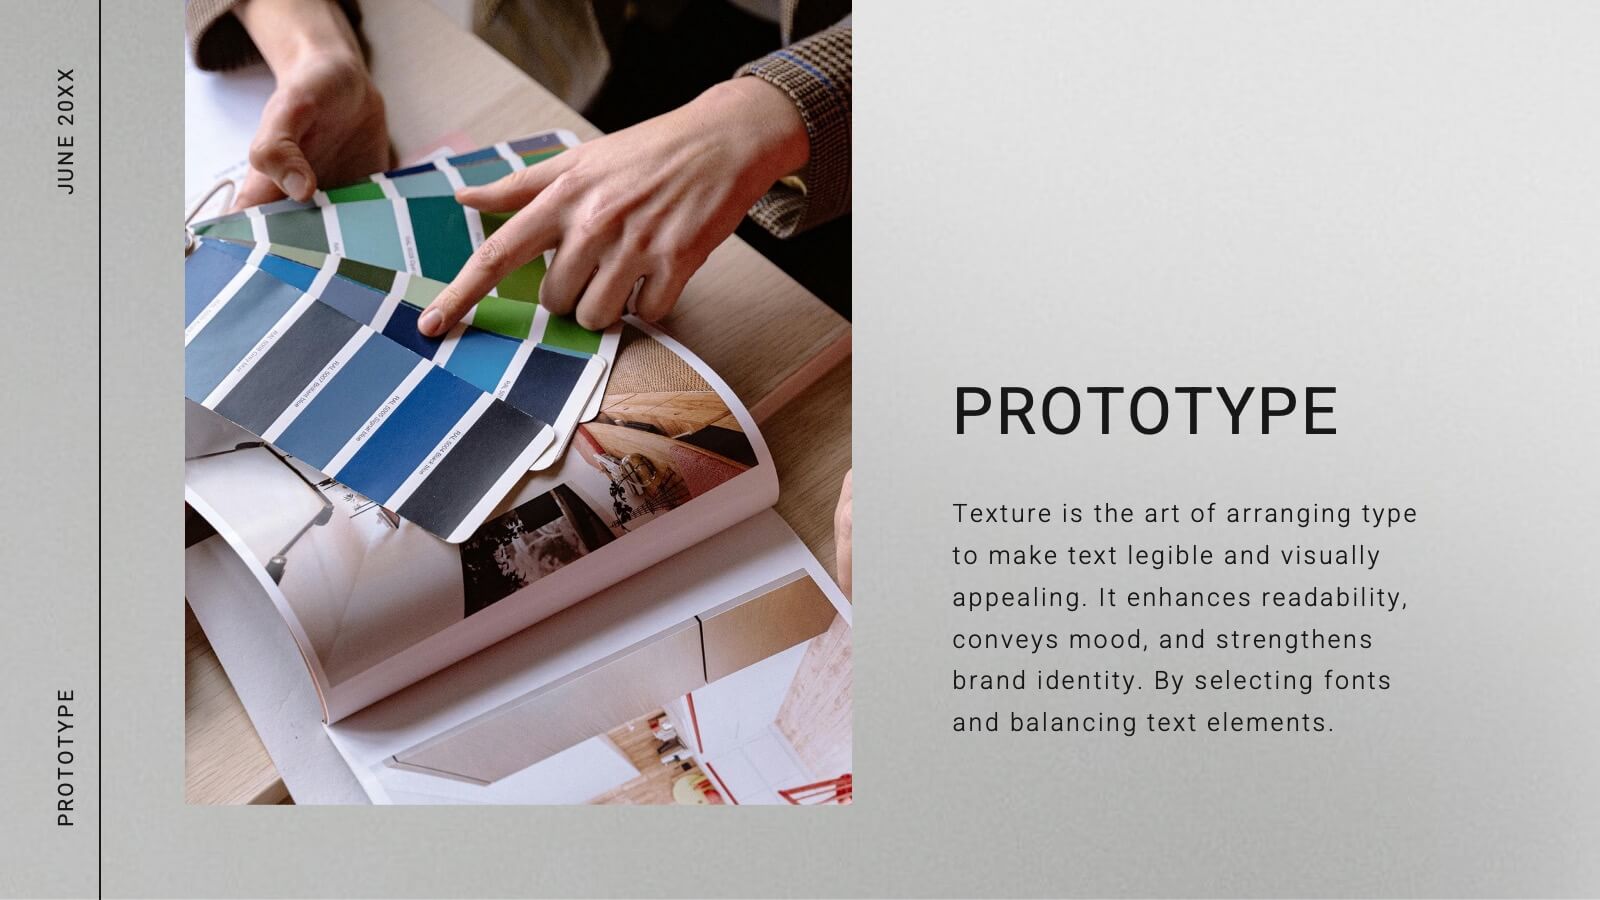
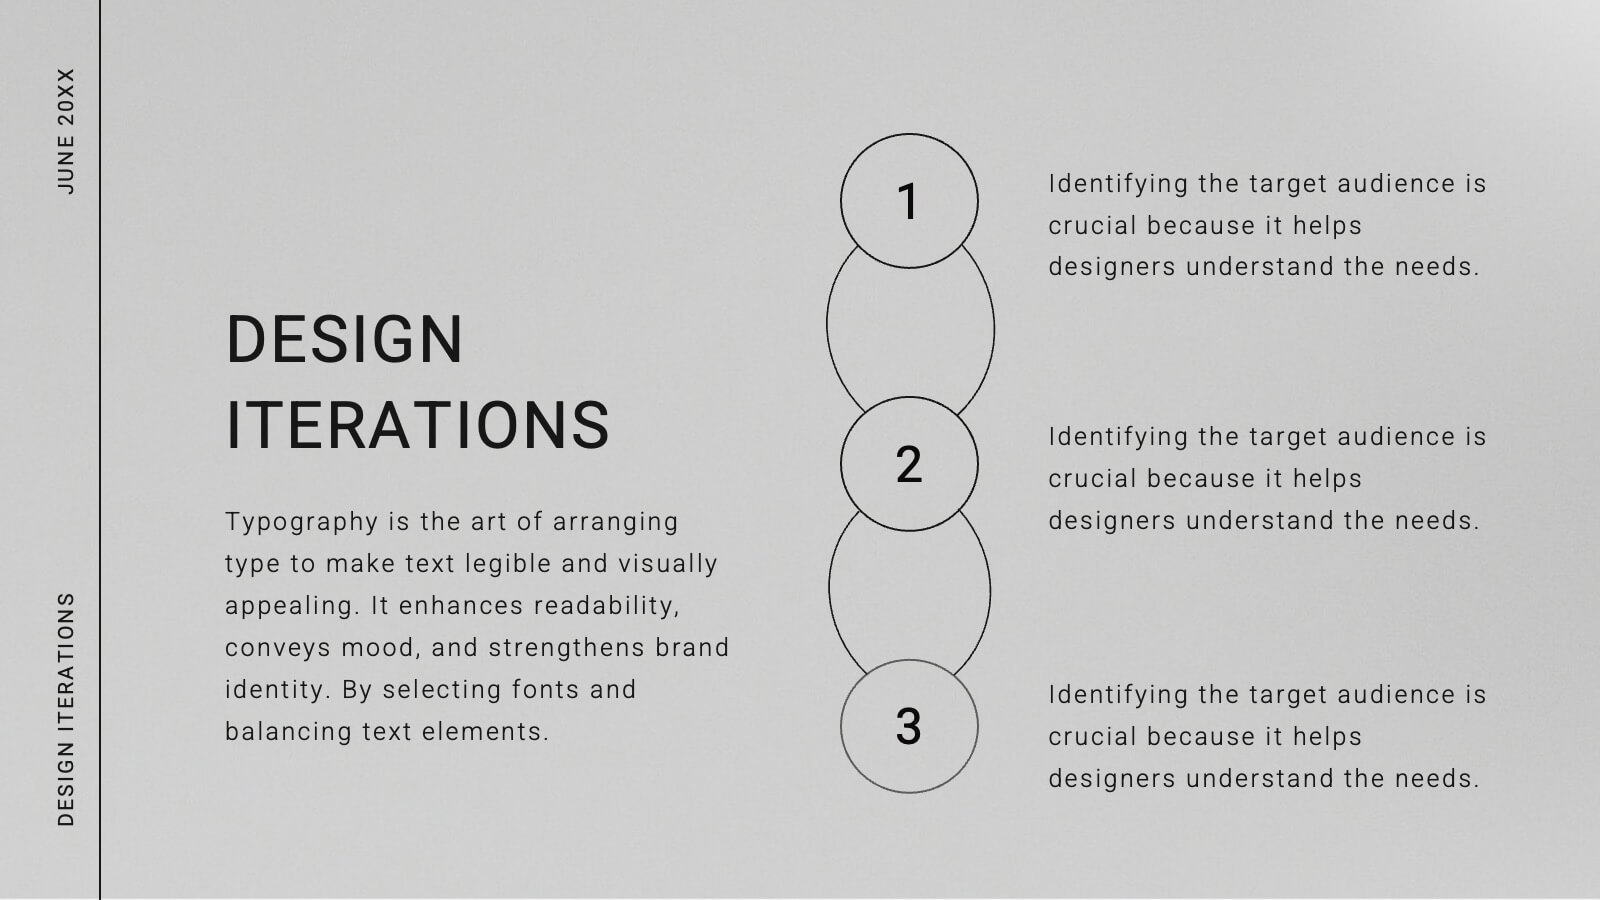
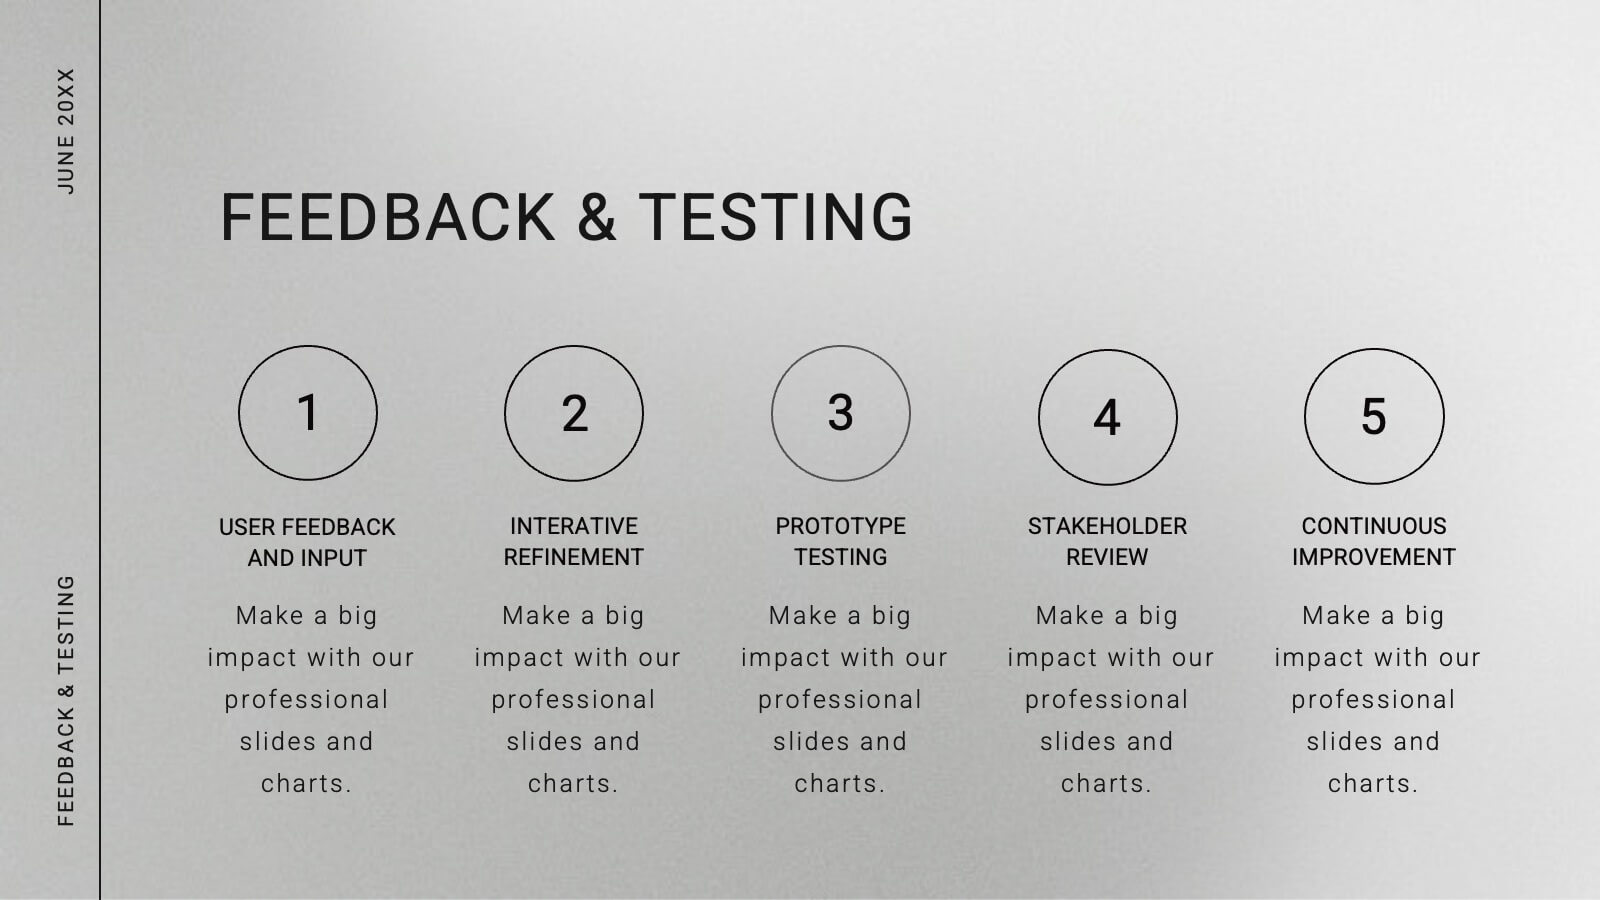
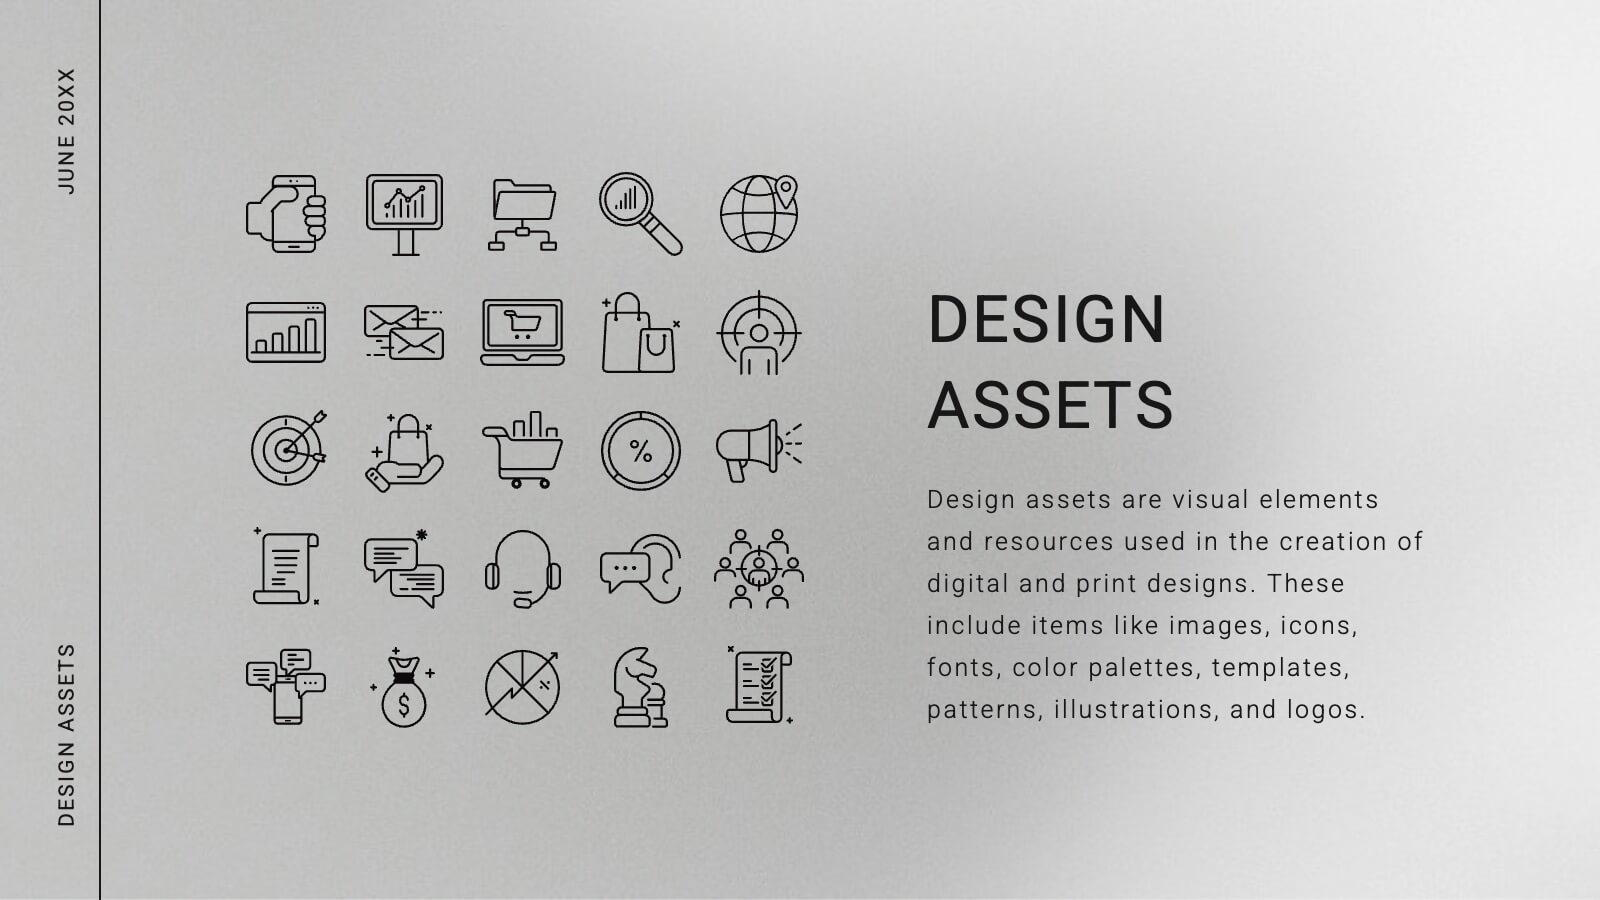
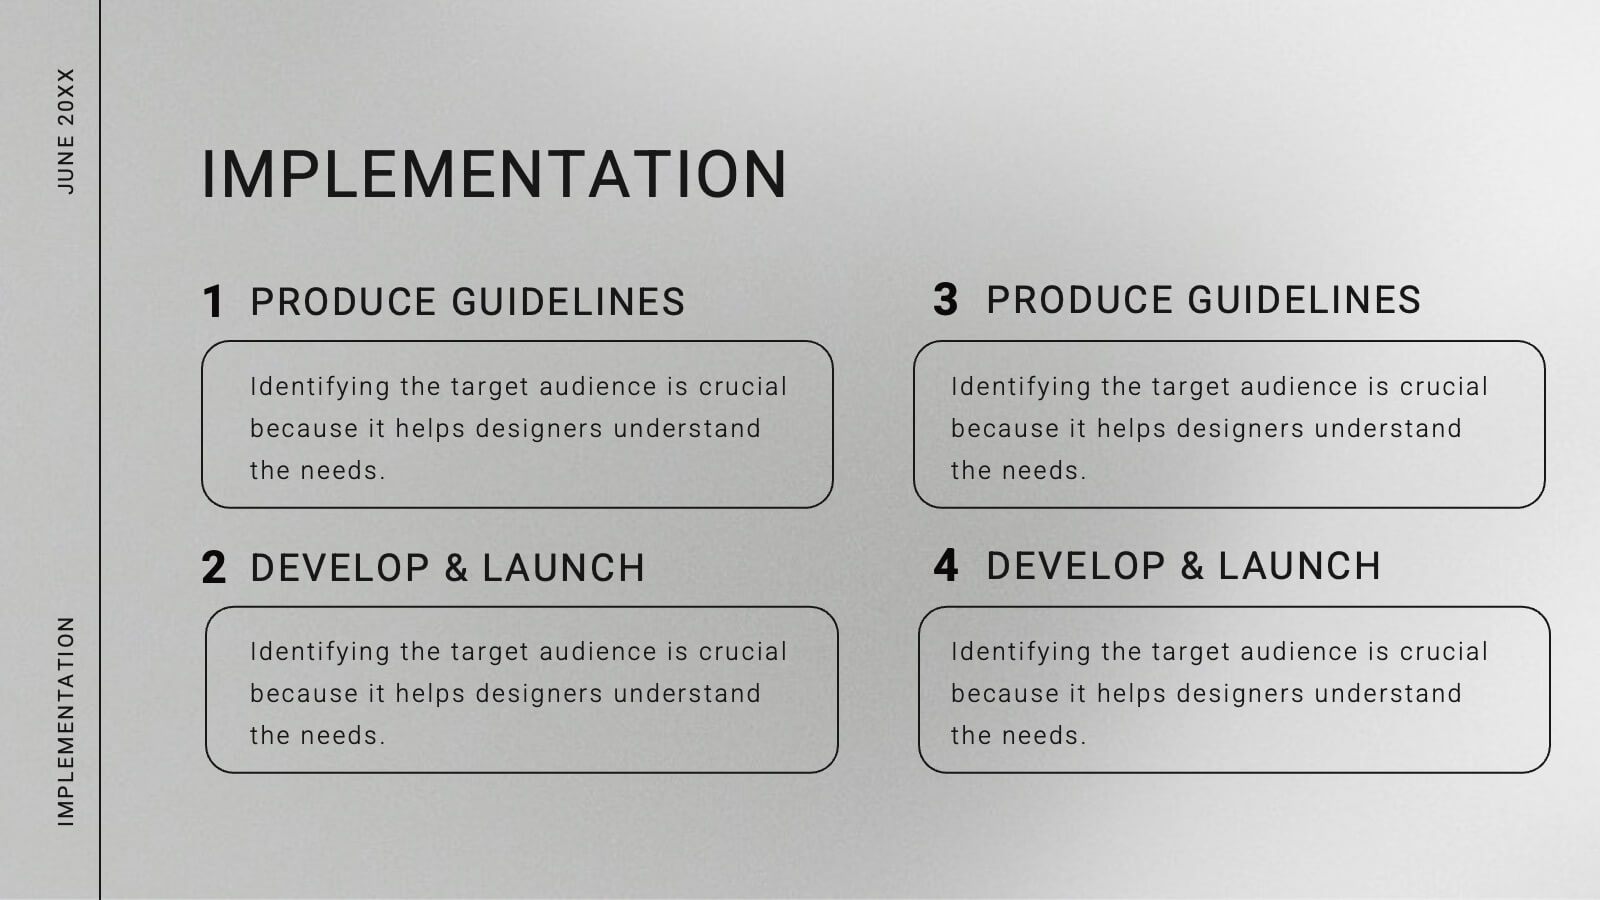
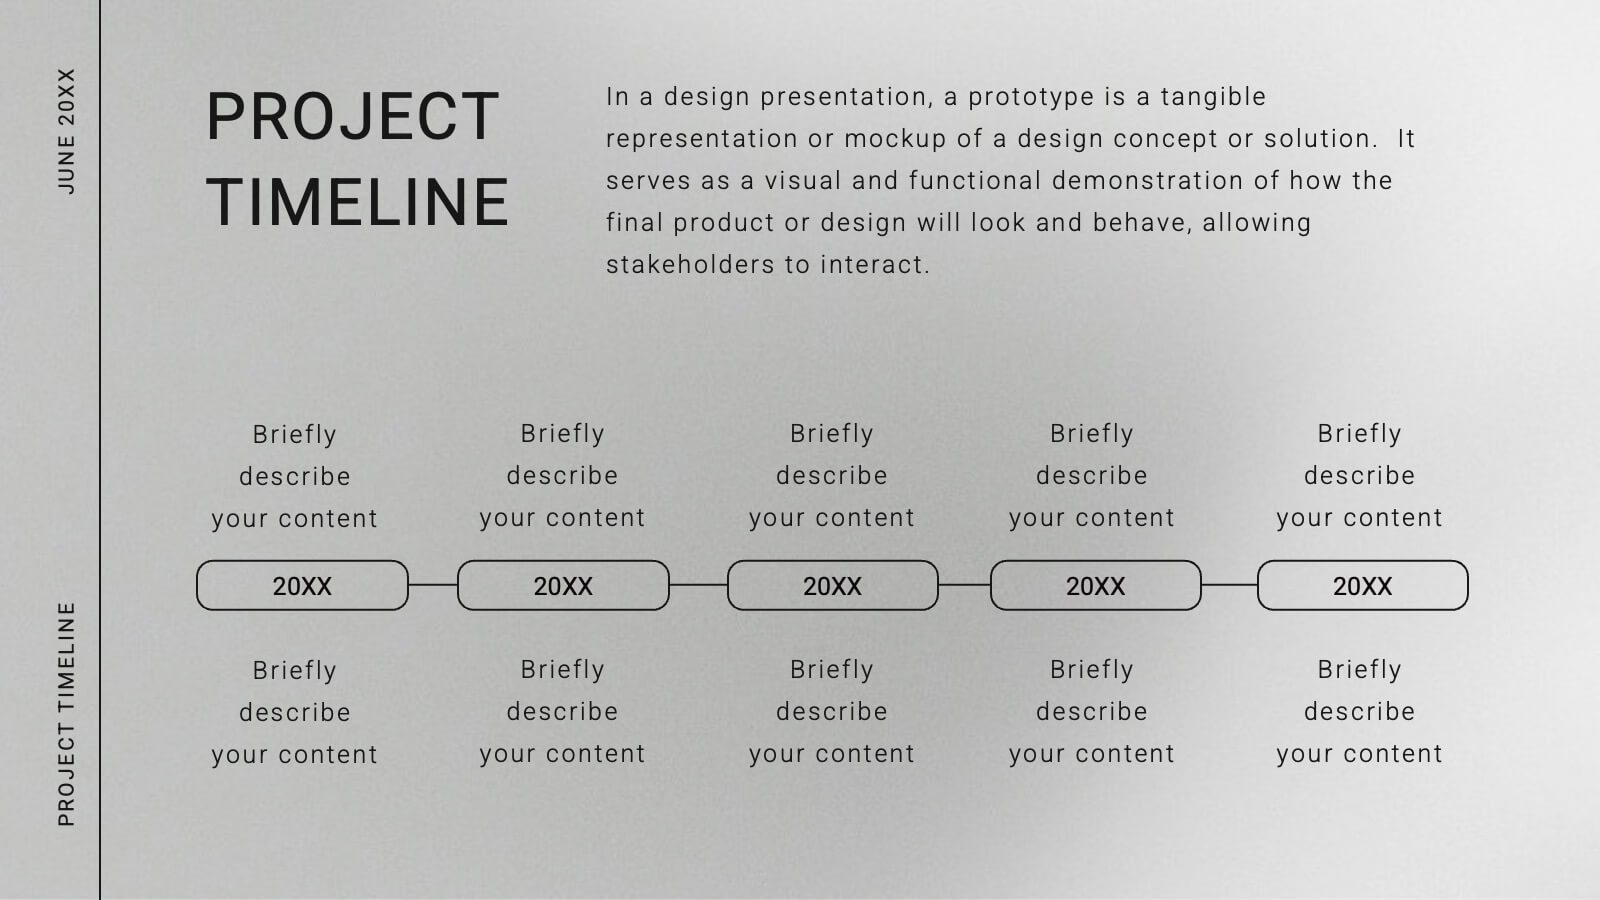
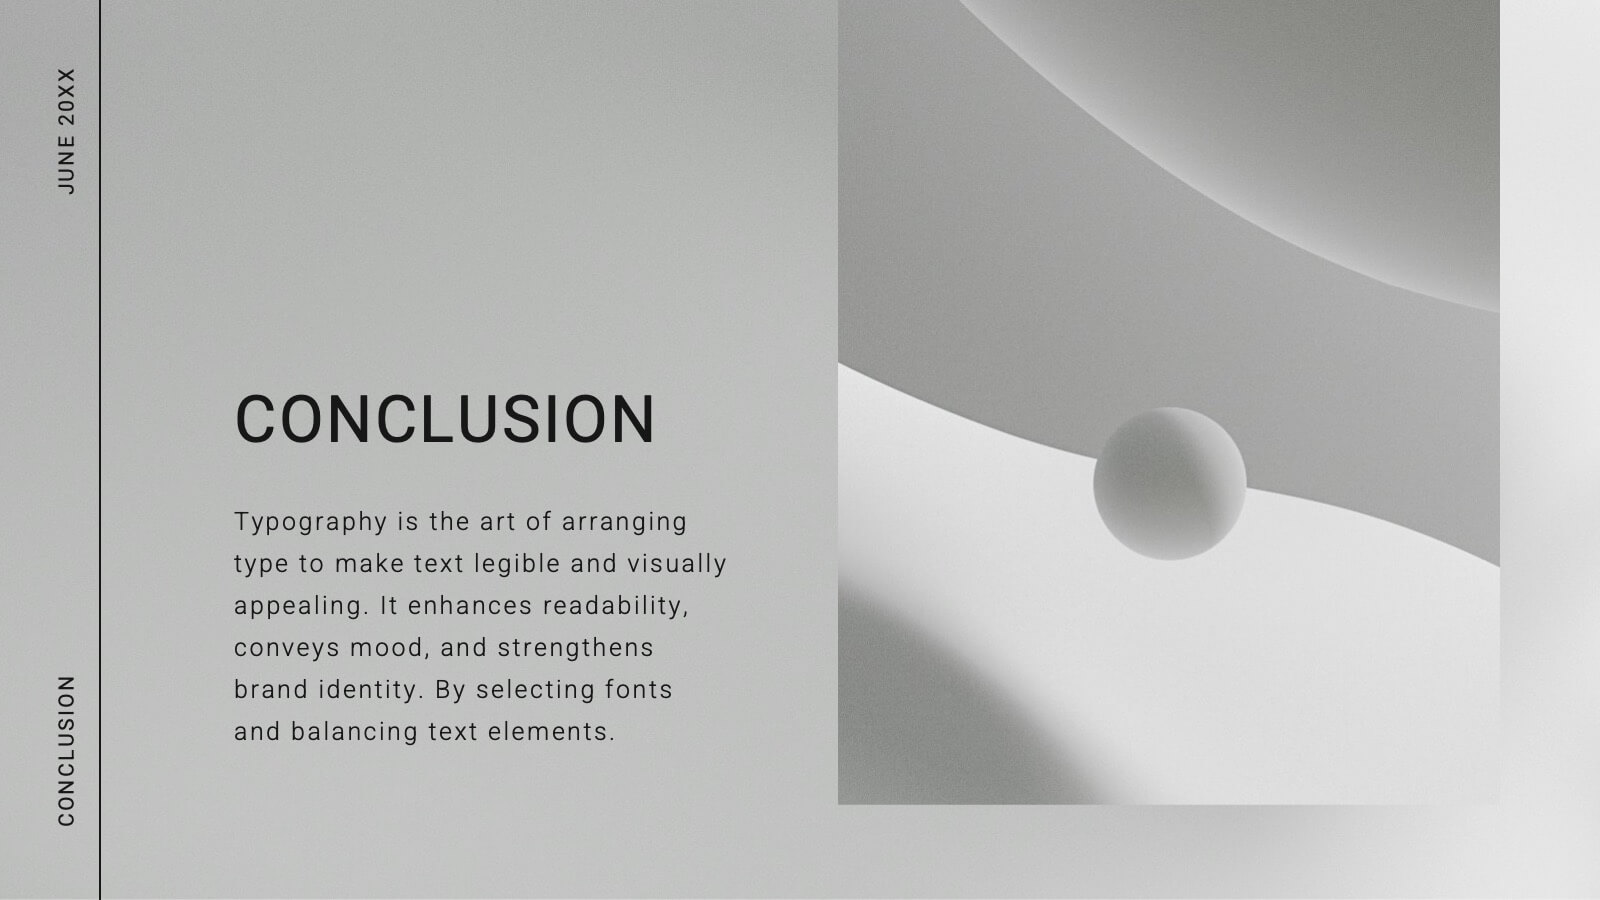
Comet Graphic Design Project Plan Presentation
Craft stunning design project presentations with this elegant template. Showcase objectives, processes, mood boards, and final designs effectively. Ideal for creative teams and clients. Fully compatible with PowerPoint, Keynote, and Google Slides.


5 diapositivas
Real-Time Data Dashboard Presentation
Bring your data to life with a dynamic layout that tracks key metrics as they shift by the moment. This presentation helps you present trends, performance indicators, and live insights with clarity and impact, ideal for fast-moving teams. Fully compatible with PowerPoint, Keynote, and Google Slides.


4 diapositivas
Cost Breakdown for Business Planning Presentation
Visually balance your budget strategy with the Cost Breakdown for Business Planning Presentation. Featuring a scale-style layout, this slide helps you compare two financial metrics or allocations with clarity and simplicity. Ideal for showcasing trade-offs, resource planning, or funding distribution. Fully editable in PowerPoint, Google Slides, Keynote, and Canva.


7 diapositivas
Aviation Infographic Presentation Template
Featuring our light, vibrant and eye-catching aviation infographic template compatible with PowerPoint. The theme is designed to show you the key facts and figures about your topic, so you can easily produce a stunning presentation. This infographic is a visual representation of information related to aviation, presented in a clear and visually appealing way. With this template cover topics such as aviation history or the economic impact of the aviation industry. The information in the template can be in the form of statistics, data visualizations, timelines, maps, or other graphical elements.


6 diapositivas
Process Flow Charts Presentation
Bring your workflow to life with a clean, modern layout that transforms complex steps into a simple visual path. This presentation helps teams explain processes, percentages, and progress with clarity and ease, making it ideal for planning and optimization. Fully compatible with PowerPoint, Keynote, and Google Slides.


5 diapositivas
Corporate Goal Alignment and Execution Presentation
Drive strategic clarity with this streamlined Corporate Goal Alignment and Execution slide. This template visually connects key initiatives with execution pathways and end goals, using a funnel-style layout that highlights the flow from strategic inputs to measurable outcomes. Perfect for aligning teams, reporting progress, or visualizing OKRs. Fully customizable in PowerPoint, Keynote, and Google Slides.


8 diapositivas
Europe Market Trends with Europe Map Presentation
Showcase key market insights with this Europe-focused presentation. Highlight regional trends using data-driven visuals, including percentage indicators and color-coded country comparisons. Ideal for marketing reports, business expansion plans, or performance reviews. Fully editable and compatible with PowerPoint, Keynote, and Google Slides for seamless customization across platforms.


7 diapositivas
Root Cause Analysis Infographic Presentation Template
Root cause analysis is a method of problem solving that identifies the cause of an issue and tries to prevent similar issues from happening again. Root cause analysis can be used in any industry, including IT, manufacturing, telecommunications, industrial process control, accident analysis and healthcare to eliminate misunderstandings. This template is perfect if you need an essential problem-solving method. This root cause analysis template includes a helpful timeline to keep track of items that cross through each stage in the process, and a diagram of all the possible causes.