


Características


¿Tienes alguna pregunta?
Recomendar


6 diapositivas
Geographic Asia Overview Template Presentation
Discover insights across Asia with a clean, professional layout that brings your regional data to life. Perfect for showcasing demographics, market distribution, or geographic highlights, this visual map design ensures clarity and impact in every slide. Fully compatible with PowerPoint, Keynote, and Google Slides for effortless editing and presentation.


4 diapositivas
Stakeholder Analysis Template for Projects Presentation
Turn complex stakeholder relationships into clear, actionable insights with this dynamic and modern quadrant design. Ideal for visualizing influence, communication strategies, and engagement priorities, it helps teams build stronger collaboration frameworks. Fully editable and compatible with PowerPoint, Keynote, and Google Slides for effortless professional use.


26 diapositivas
Nahla Presentation Template
Brand guidelines are the set of rules that define the overall look and feel of your brand. They allow you to build a brand identity. A brand style guide is the ultimate resource for communicating your brand’s identity to everyone on your team. Use the Nahla template to help define your company's branding the correct way. This is a highly customizable, responsive template. Create a unique ambience that your customers and audience can recognize across all platforms. Nahla provides a platform for the design team to help shape the direction of your brand, while ensuring consistency.


8 diapositivas
Employee Performance Review Presentation
Assess and visualize team performance effectively with these "Employee Performance Review" presentation templates. Crafted to simplify performance analysis, these slides allow you to pinpoint strengths and areas for improvement through clear, sequential visual layouts. They are perfect for managers looking to foster growth and productivity, and are fully compatible with PowerPoint, Keynote, and Google Slides.


6 diapositivas
Defining Project Scope
Visualize your project's key components with this sleek hexagonal layout, perfect for outlining milestones, deliverables, and priorities. This six-part diagram helps teams align goals and clarify scope early in the process. Ideal for PMs, strategists, and consultants. Fully editable in PowerPoint, Keynote, and Google Slides.


6 diapositivas
Preventative Healthcare and Fitness Presentation
Promote wellness and proactive care with this colorful and clean slide layout. Featuring a clipboard-style design with stacked icons and aligned descriptions from A to E, it’s perfect for presenting fitness tips, health programs, or preventative strategies. The vibrant sections help guide viewers through key points at a glance. Fully editable and compatible with PowerPoint, Keynote, and Google Slides.


5 diapositivas
Breast Cancer Treatment Infographics
Breast cancer is a type of cancer that develops in the breast cells. These vertical infographics serve as a valuable resource for healthcare professionals, patients, advocacy groups, and educational institutions involved in breast cancer awareness and support. They provide a visually engaging and informative overview of common causes, different treatment options, stages, side effects, survivorship, and ongoing research in breast cancer treatment. This template will help you convey crucial information in a clear manner, empowering individuals with knowledge about breast cancer treatment options and fostering informed decision-making.

22 diapositivas
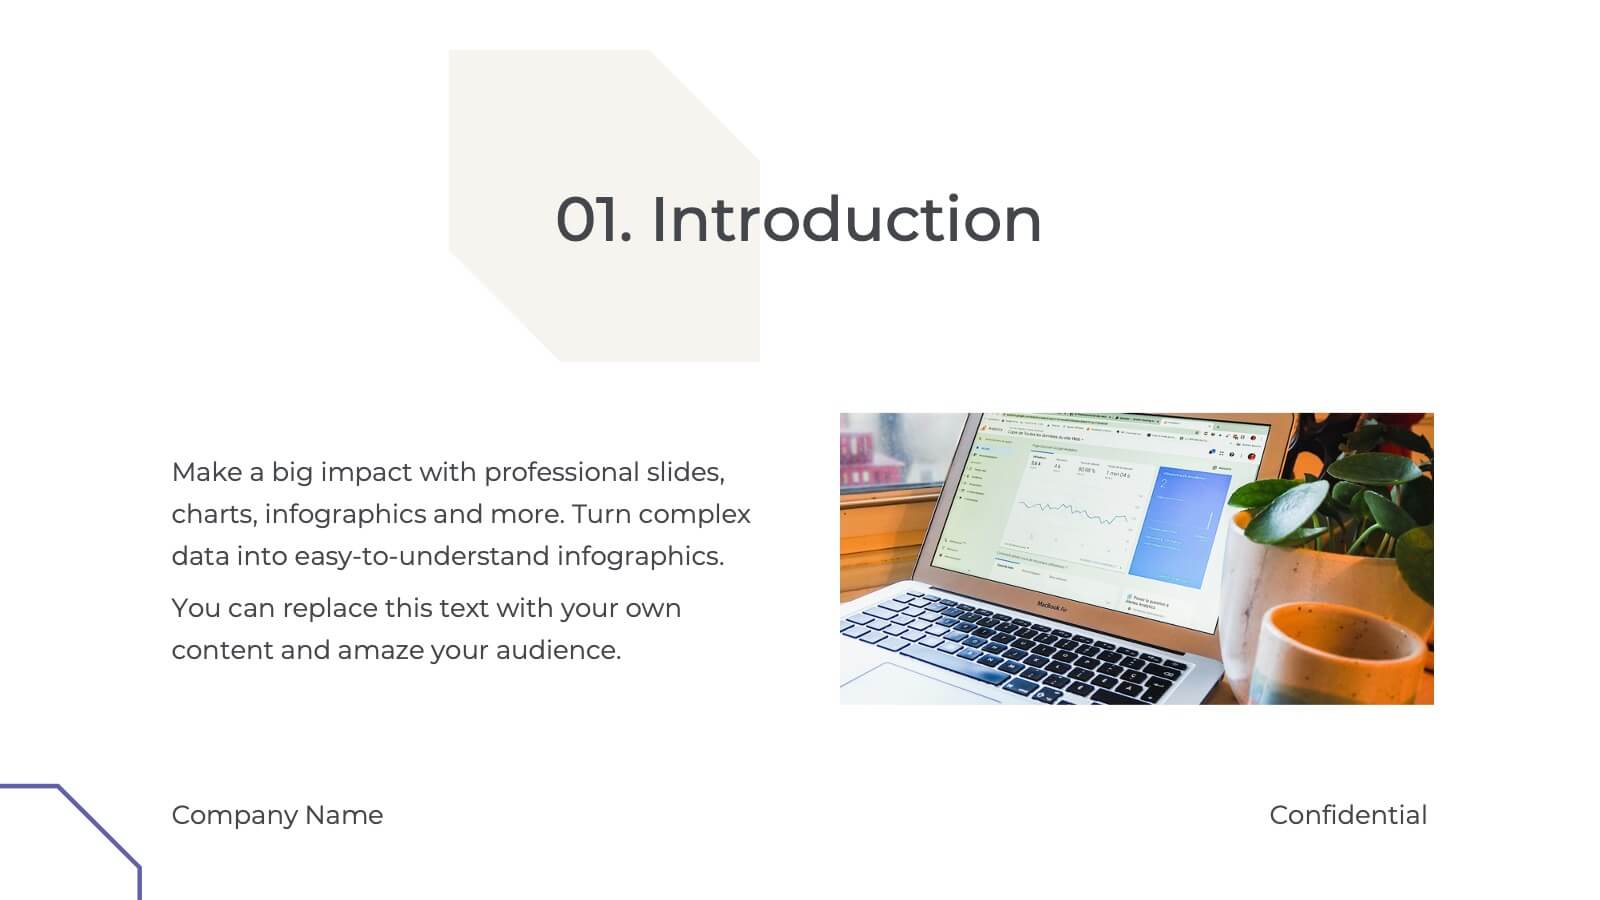
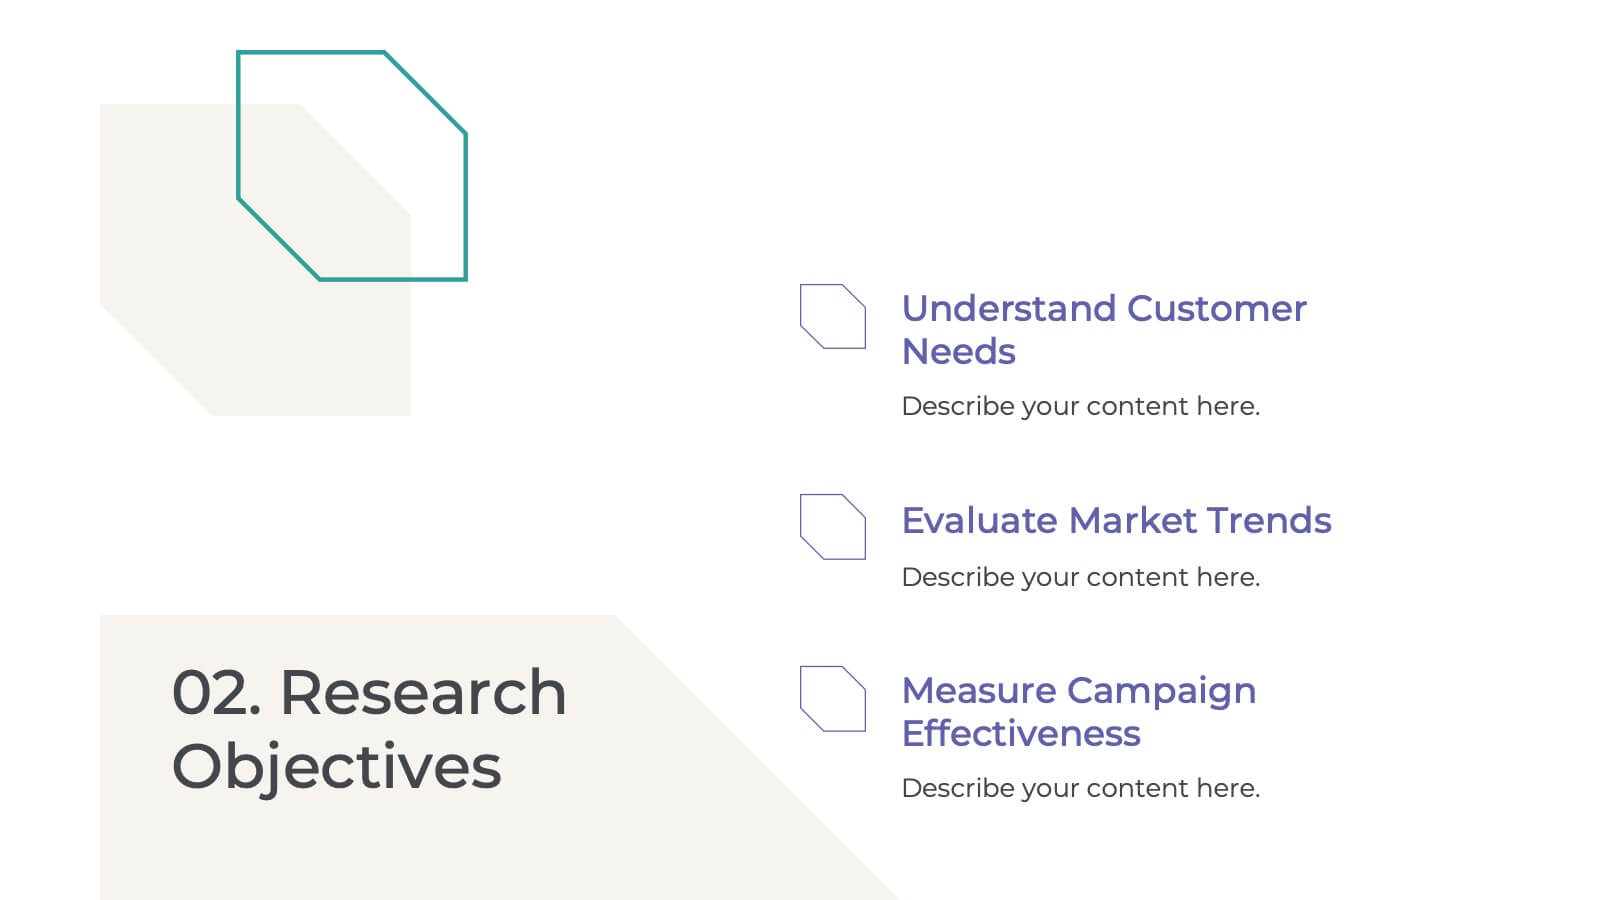
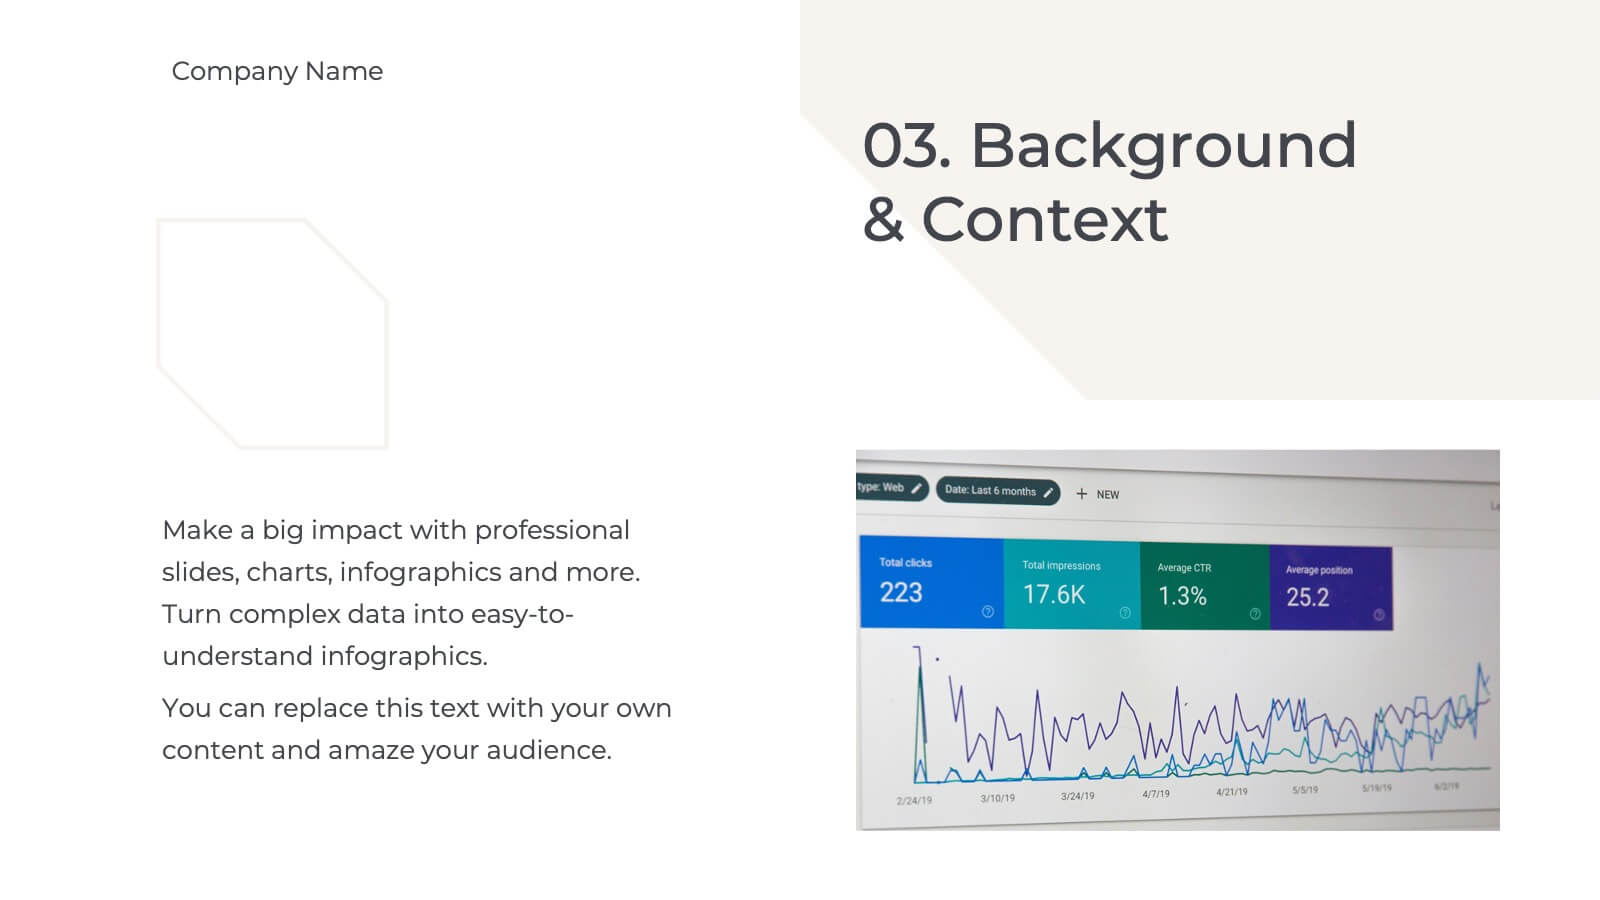
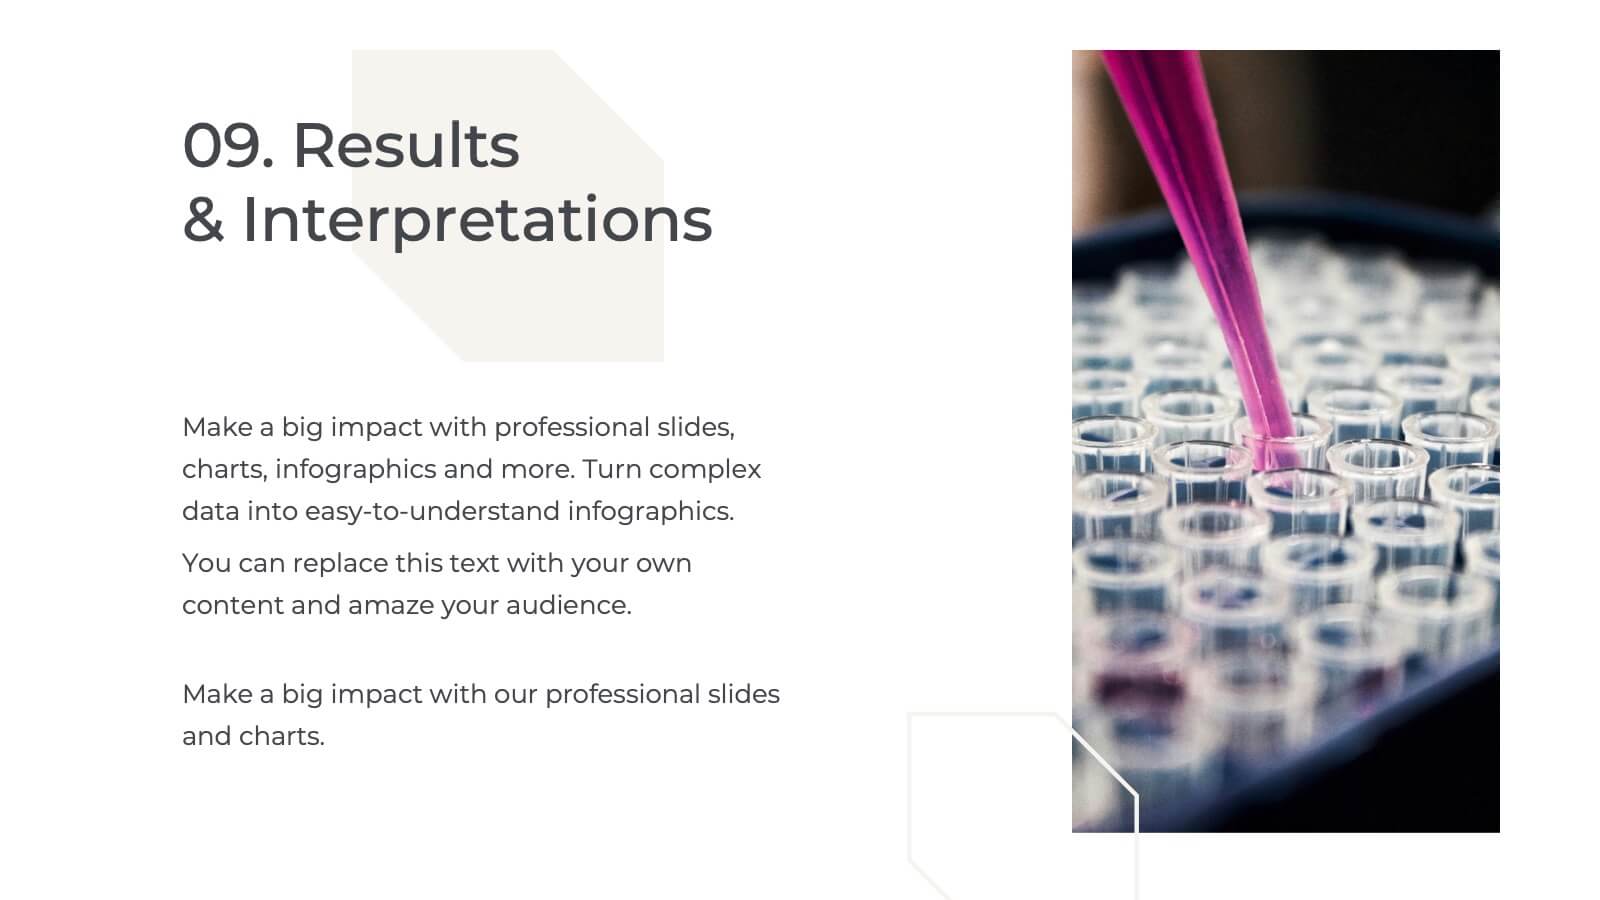
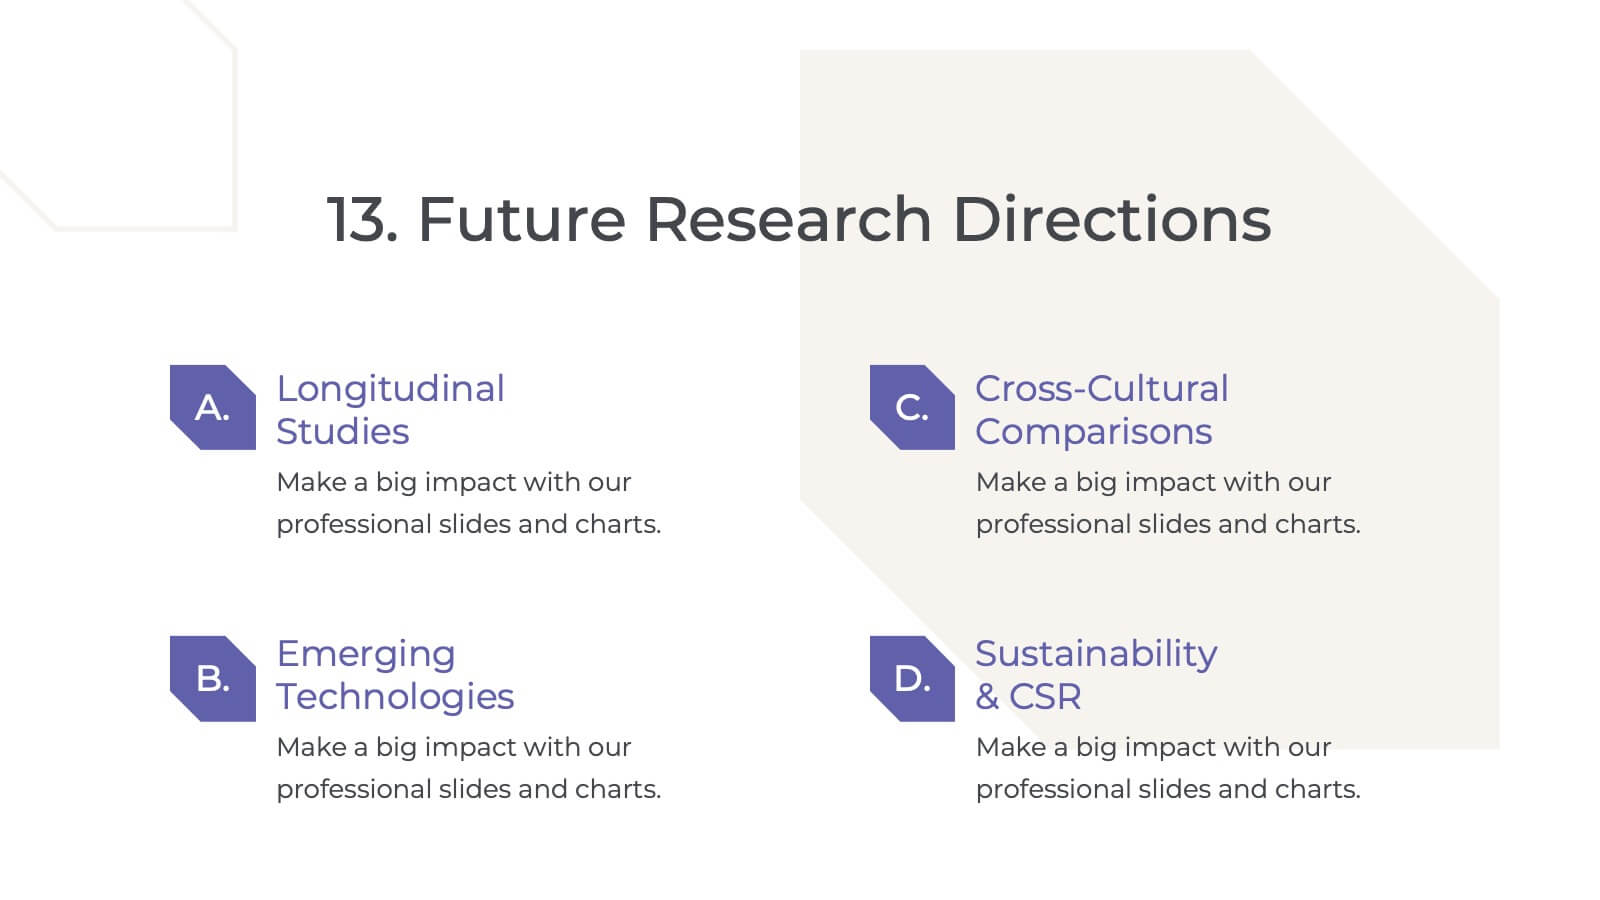
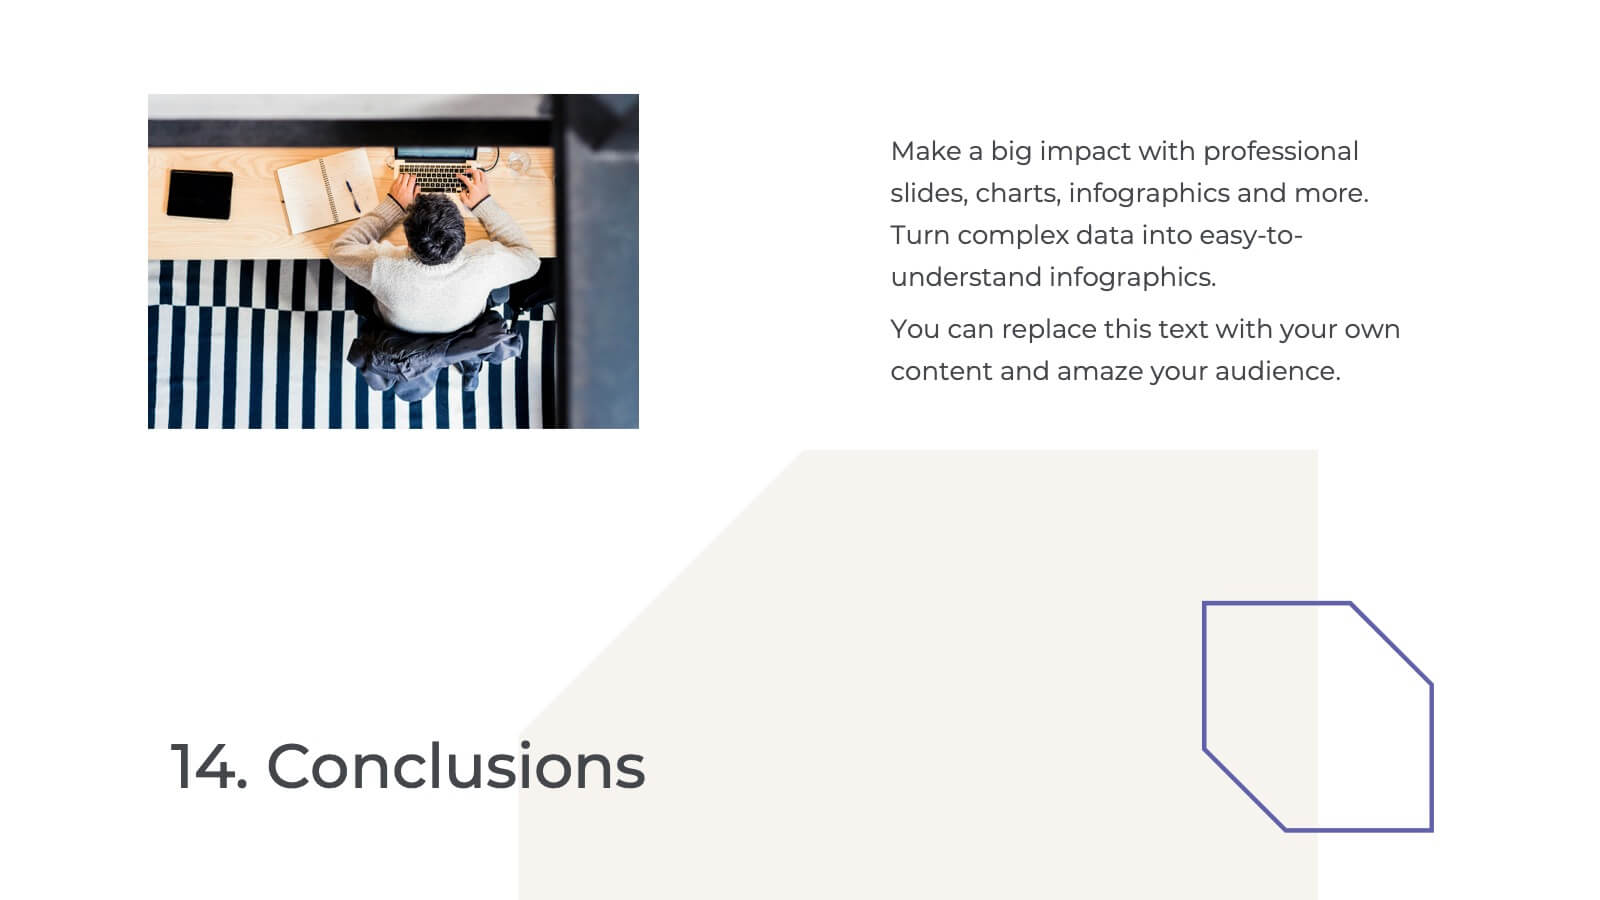
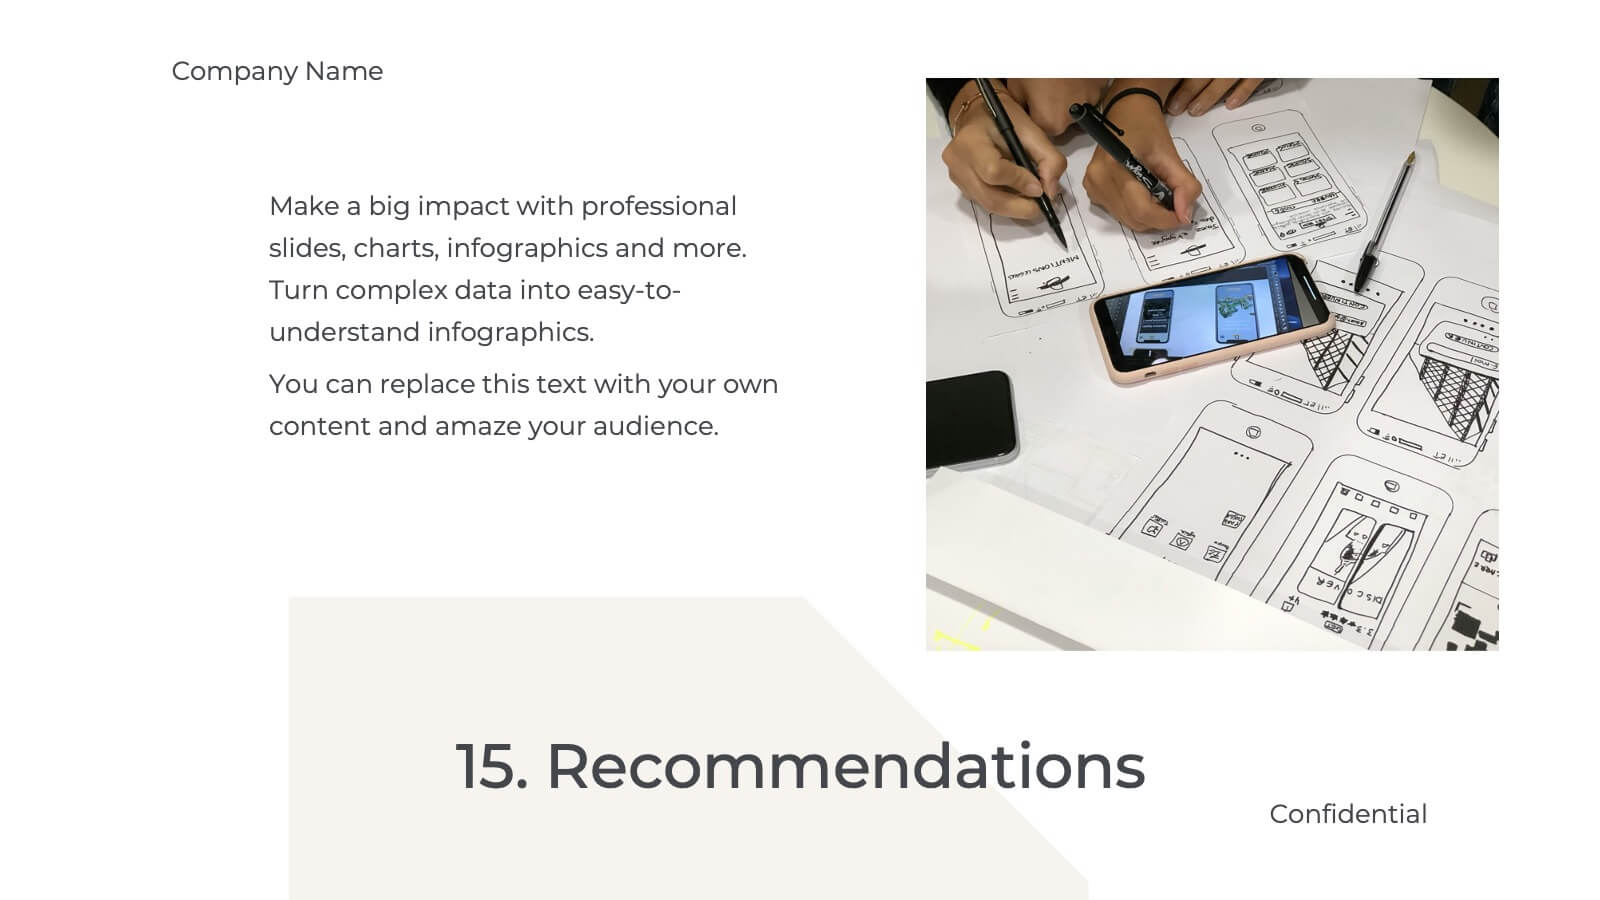
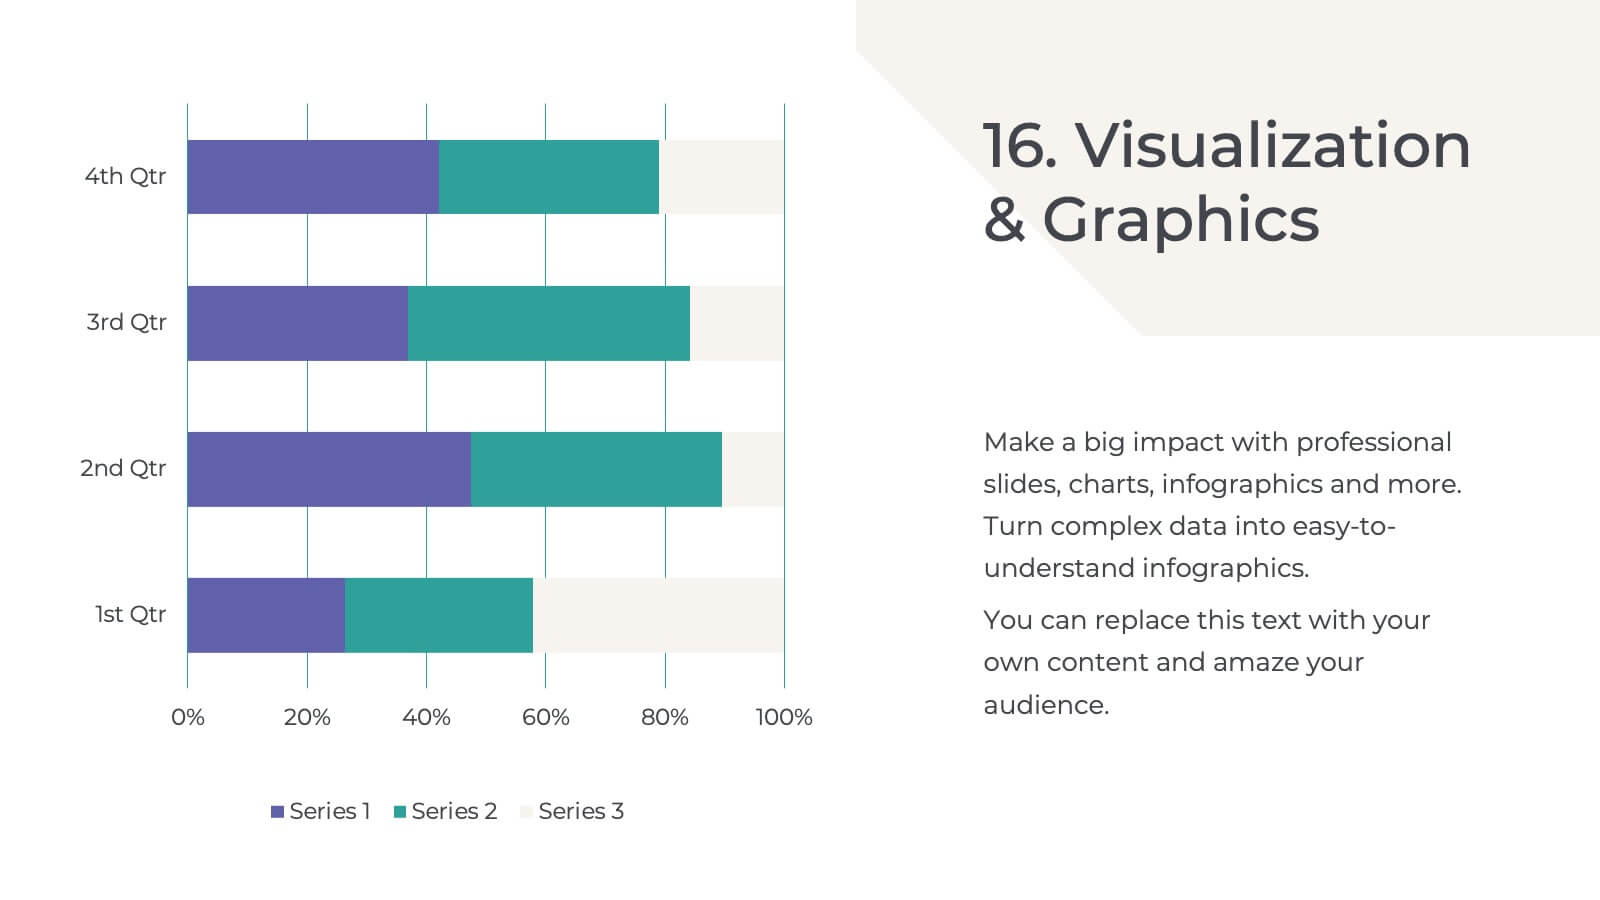
Palladium Qualitative Research Findings Presentation
Present your qualitative research findings effectively with this sleek, professional template. It includes sections for objectives, data analysis, key findings, and recommendations. Ideal for organizing research insights clearly, it's customizable and compatible with PowerPoint, Keynote, and Google Slides, ensuring smooth collaboration and impactful presentations for your audience.


8 diapositivas
Airline Business Strategy Presentation
Leverage key insights into the aviation sector with the "Aviation Industry Market Analysis" presentation template. This design allows professionals in the aviation industry to effectively communicate market trends and forecasts. Its compatibility with PowerPoint, Keynote, and Google Slides ensures a versatile use across different platforms, making it ideal for industry analyses, investor meetings, or internal strategy discussions.


20 diapositivas
Museara Sales Pitch Deck Presentation
Create a compelling sales pitch with this dynamic and modern presentation template. It includes key sections like company overview, competitive analysis, pricing strategy, and future opportunities to help you showcase your value proposition effectively. Ideal for startups and enterprises alike. Compatible with PowerPoint, Keynote, and Google Slides for easy editing.


23 diapositivas
Quest Corporate Strategy Proposal Presentation
Unlock success with this powerful corporate strategy template! Detail strategic objectives, market trends, and growth opportunities. Ideal for business leaders aiming to drive growth. Compatible with PowerPoint, Keynote, and Google Slides, this template ensures your strategy is clear, professional, and compelling. Make your vision a reality with impactful presentations.


6 diapositivas
Target Audience Demographics Presentation
The "Target Audience Demographics" presentation employs an innovative spiral chart design to display key demographic data in an engaging and easy-to-understand format. Each segment of the spiral represents a different demographic characteristic with percentages clearly marked, enabling quick insights into audience composition. This design is well-suited for marketing presentations or any scenario where understanding audience segments is crucial. The placeholders are conveniently set up to add specific details or insights, making the template not only visually appealing but also highly functional for strategic planning and audience analysis.


5 diapositivas
Business Planning and Execution Presentation
Align your business objectives and execution plan with this modern, arrow-themed presentation slide. Featuring four sequential sections with bold icons and customizable titles, this layout is perfect for showcasing milestones, KPIs, or phases of a strategic process. Designed for clarity and impact, it's compatible with PowerPoint, Keynote, and Google Slides.


6 diapositivas
Visual Business Concept Triangle
Communicate processes, concepts, or growth stages with this dynamic triangle layout. Perfect for highlighting five key ideas or steps in a sleek, professional way. Fully customizable in PowerPoint, Keynote, and Google Slides for easy personalization.


4 diapositivas
Corporate Strategy Business Case Presentation
Develop a winning corporate strategy with this structured business case template! Perfect for analyzing finances, operations, market trends, and client insights, this clean and organized layout helps businesses communicate key strategies effectively. Fully customizable and compatible with PowerPoint, Keynote, and Google Slides for seamless, professional presentations.


20 diapositivas
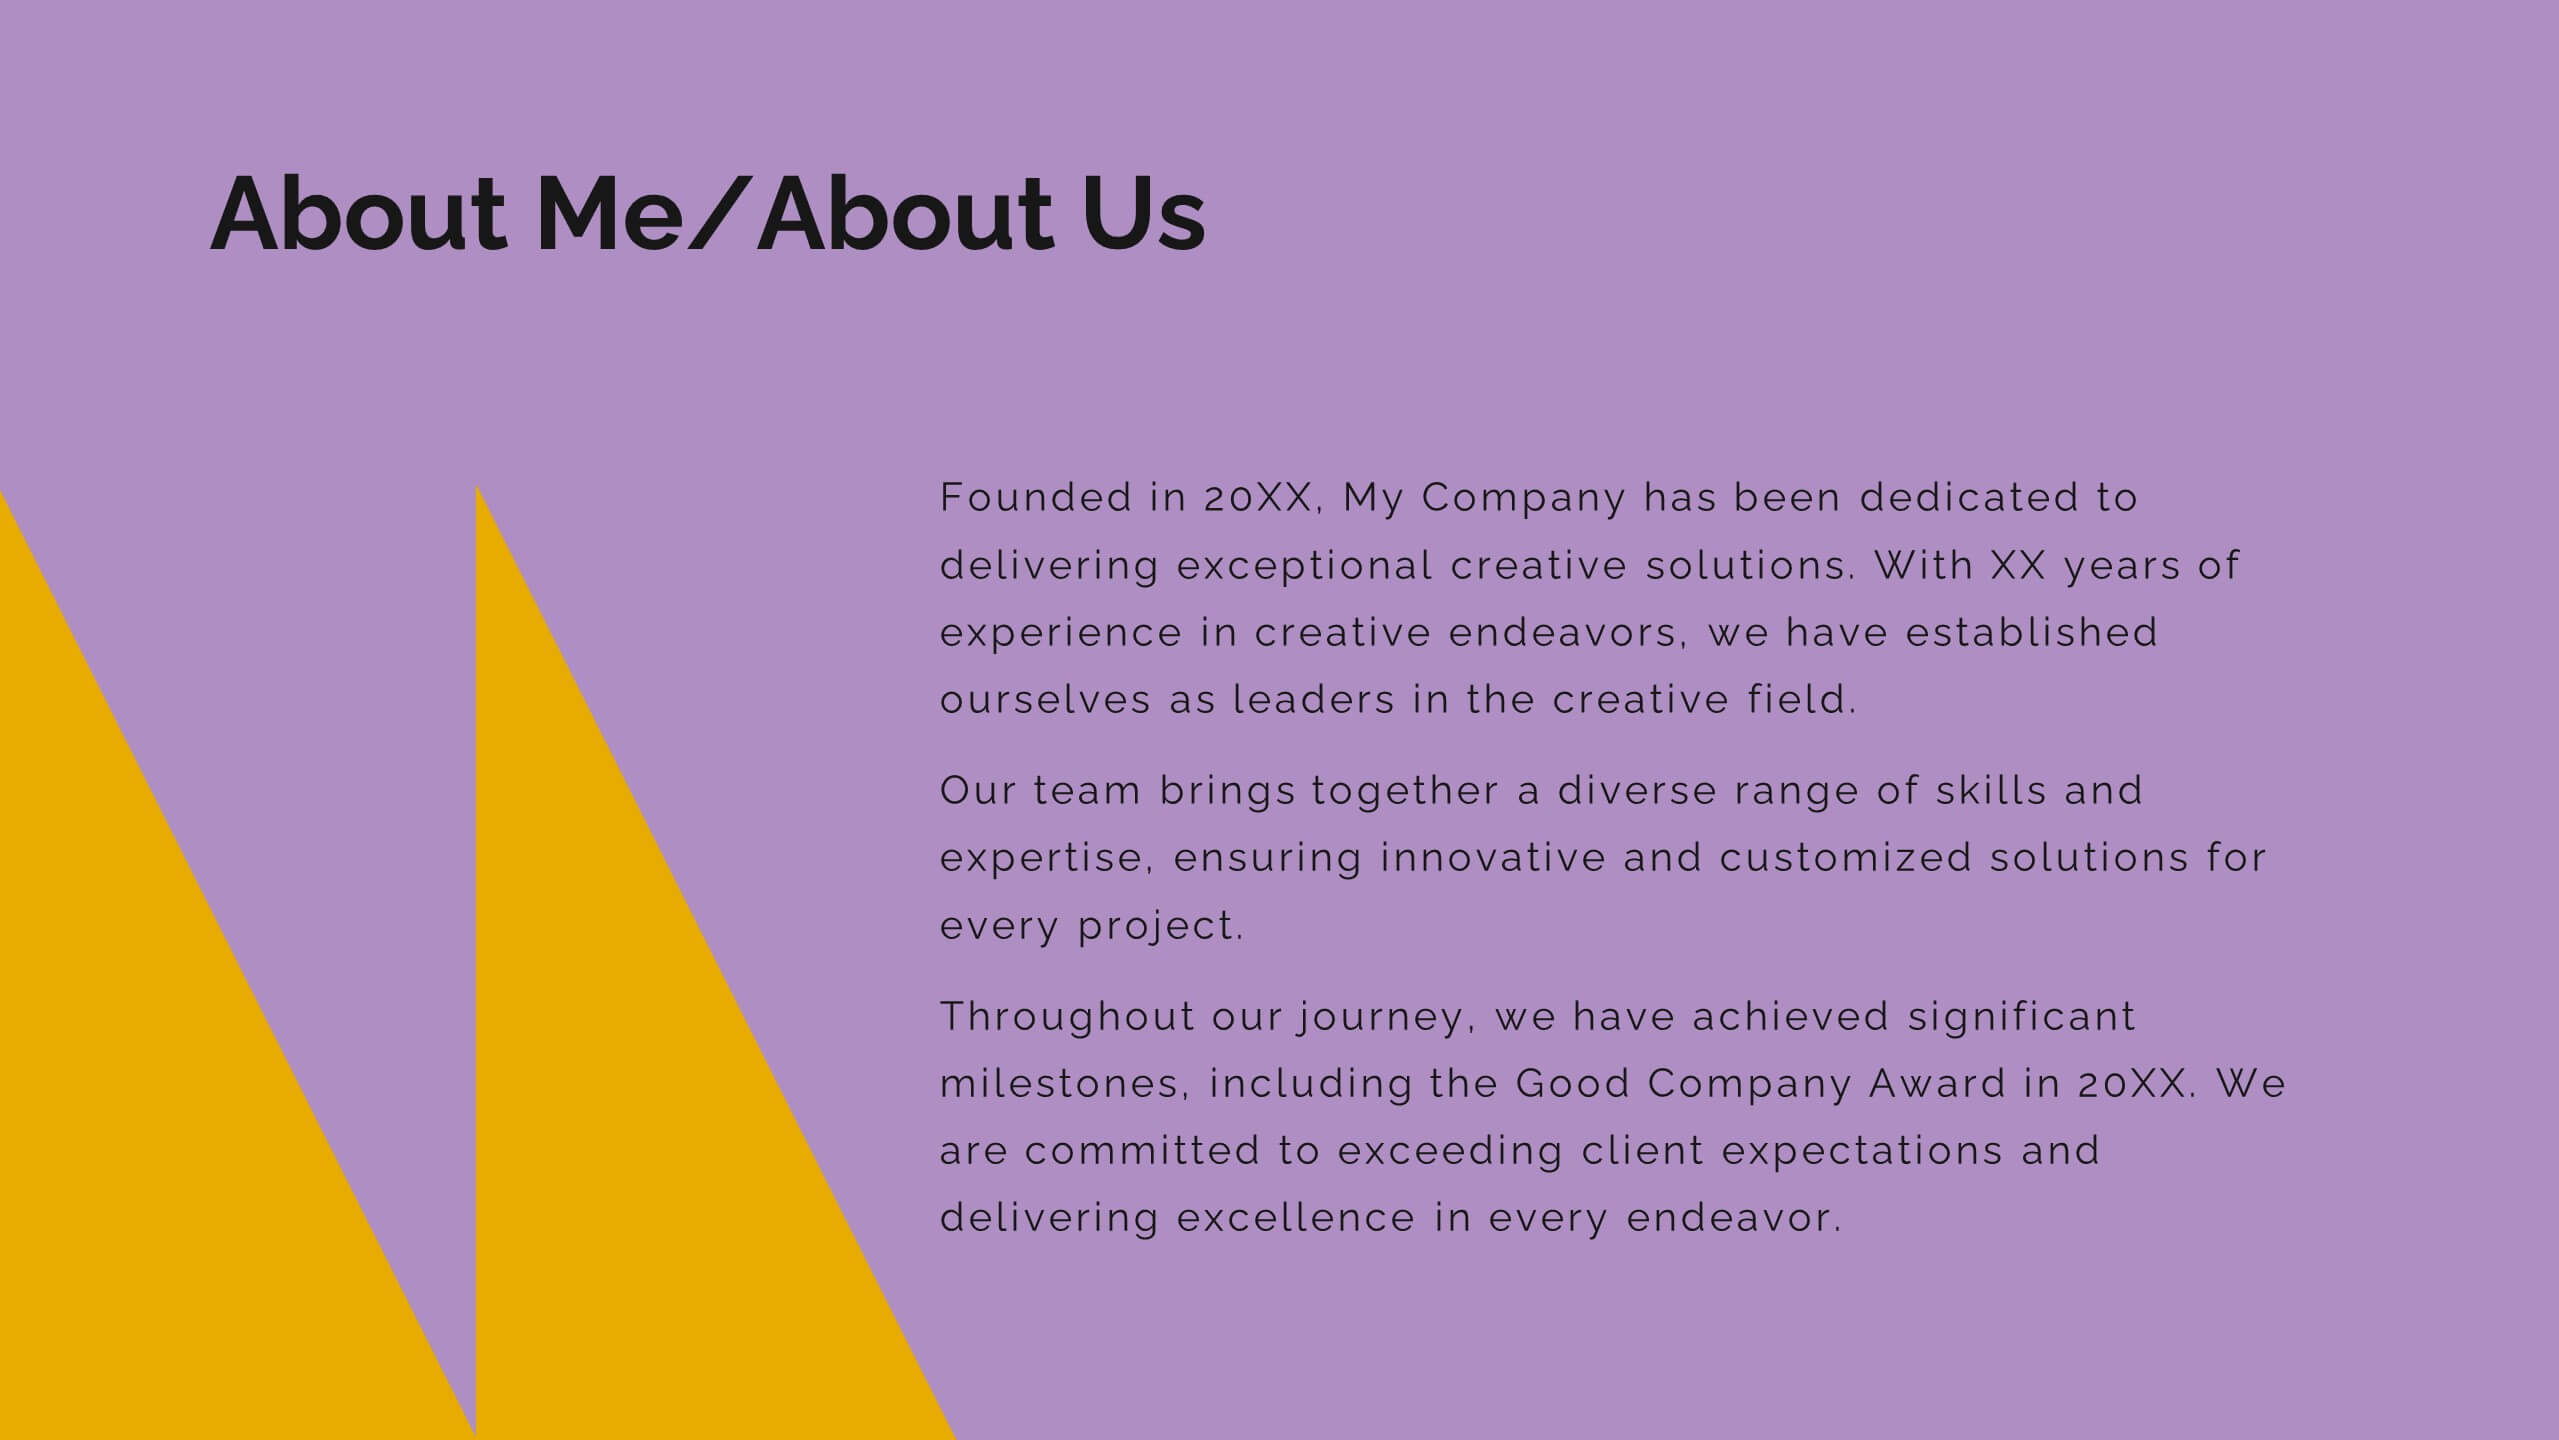
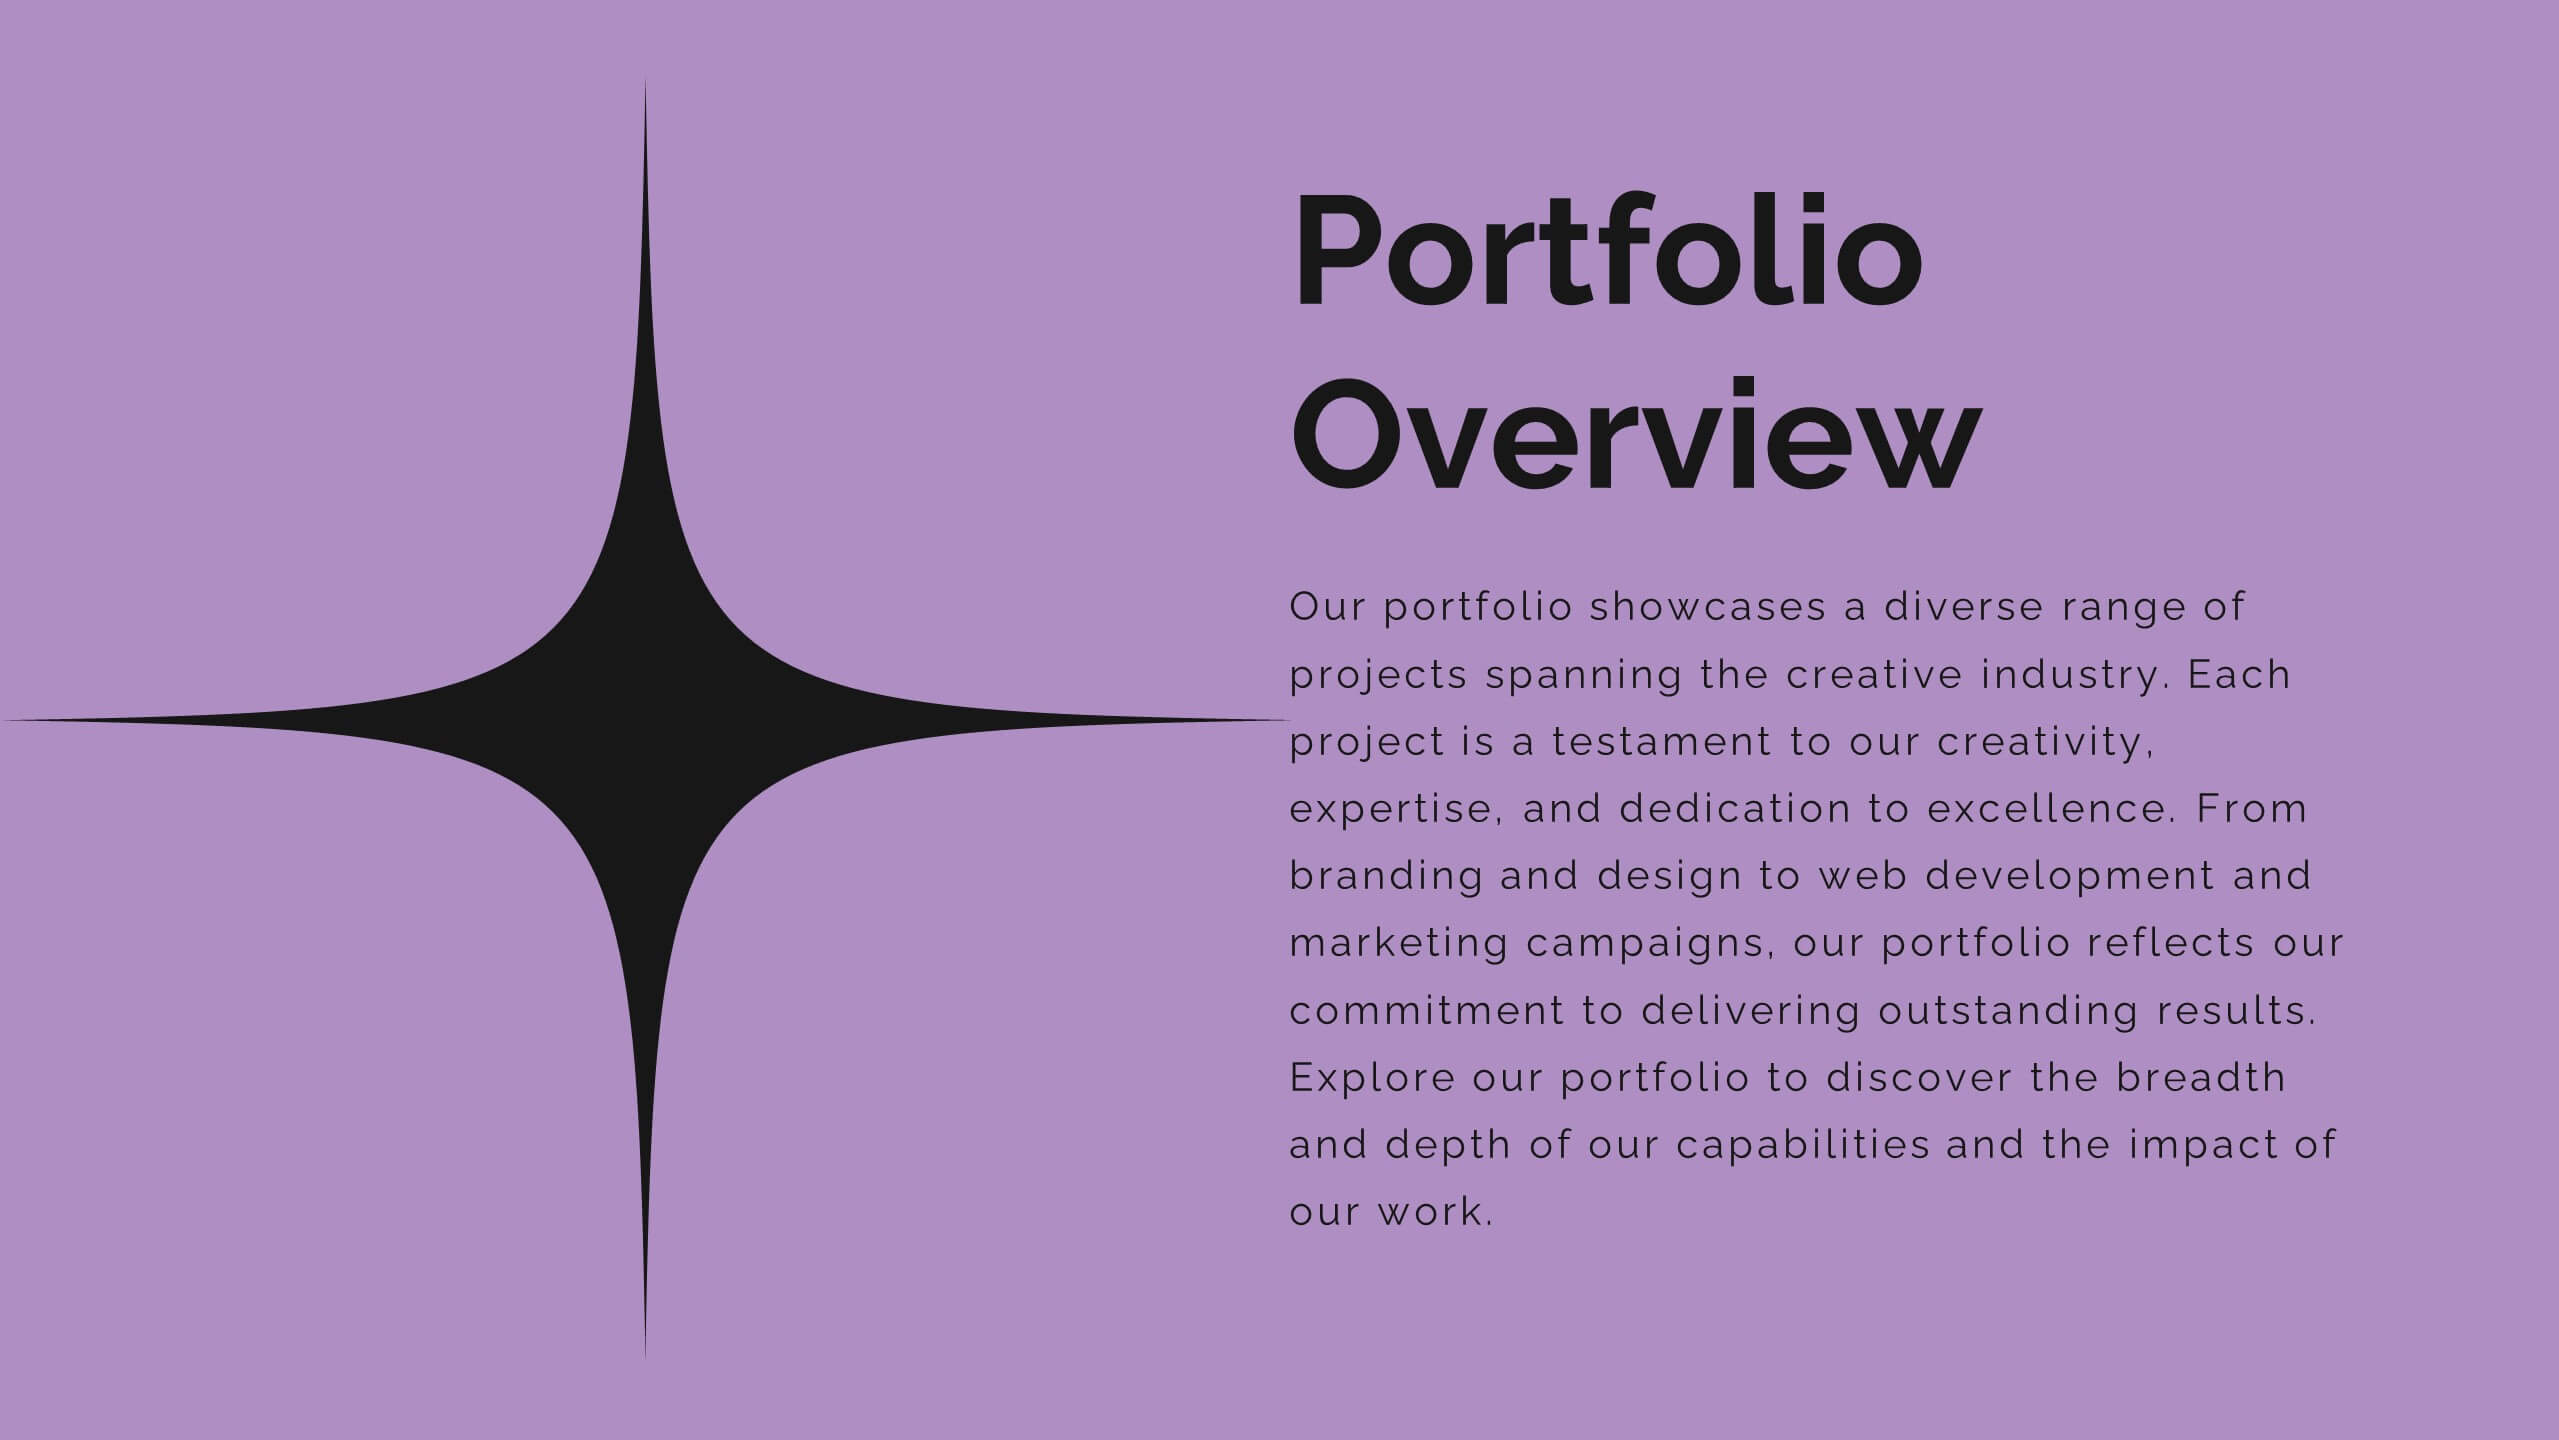
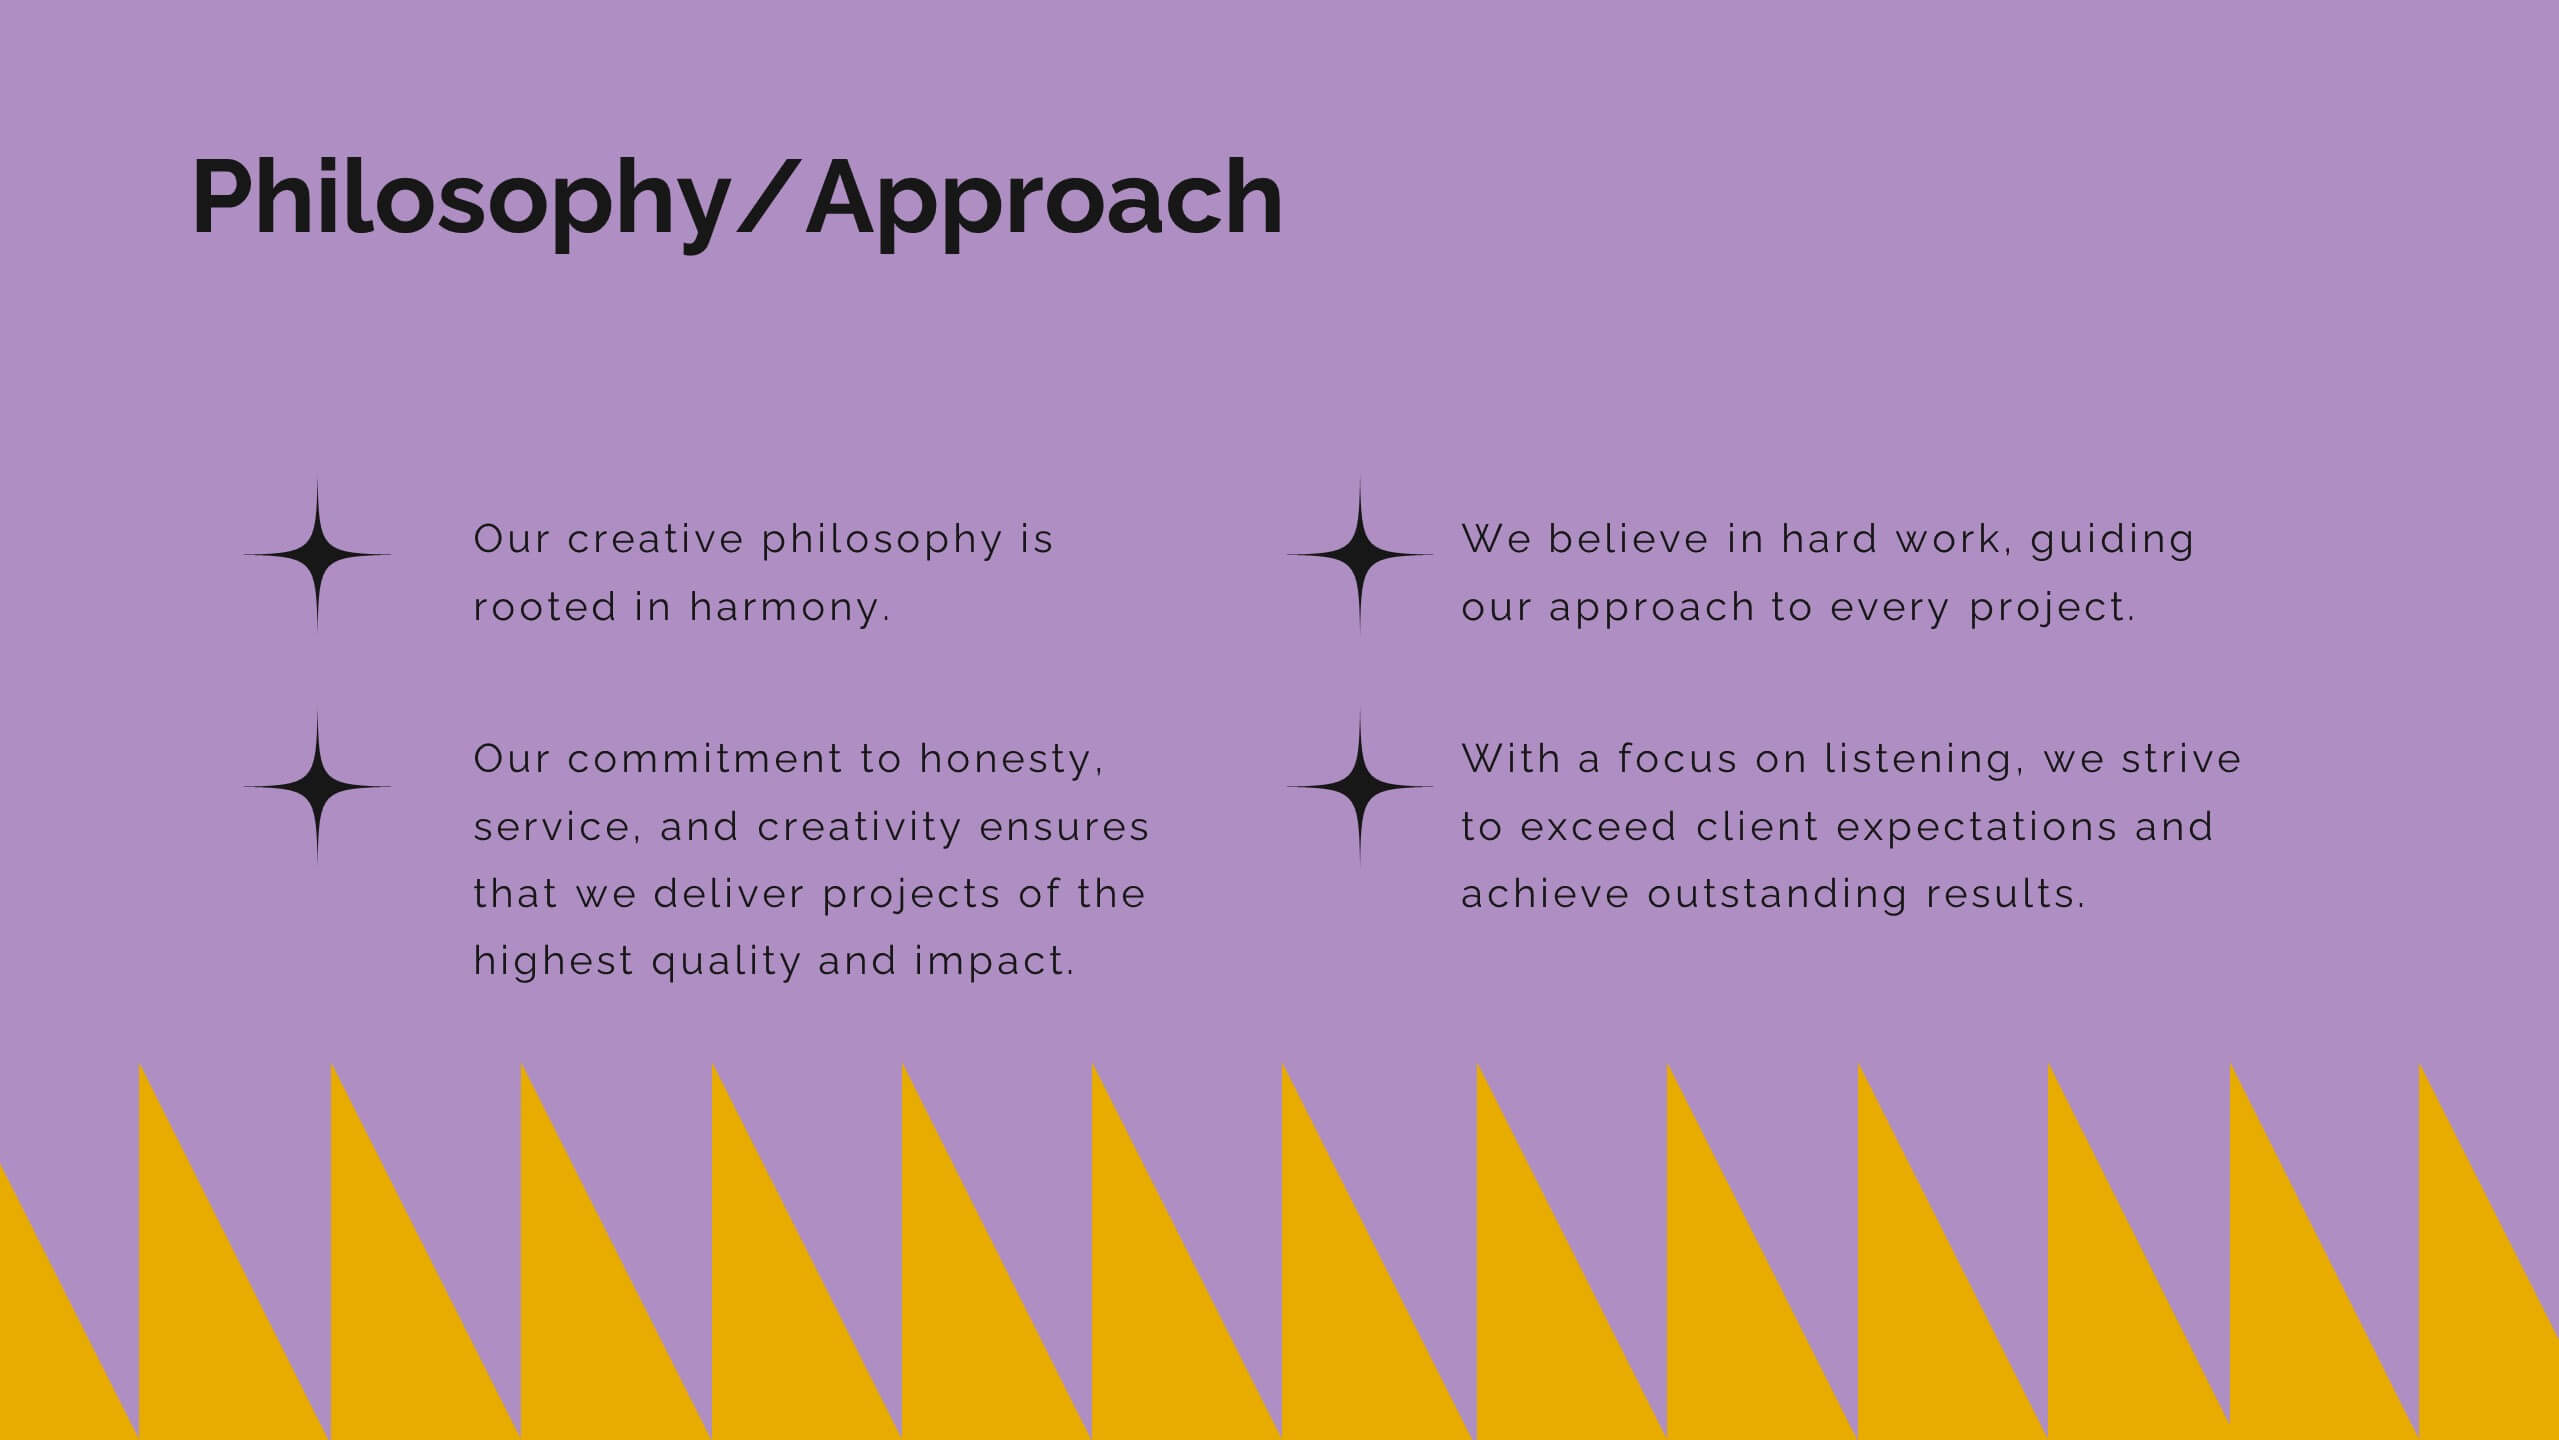
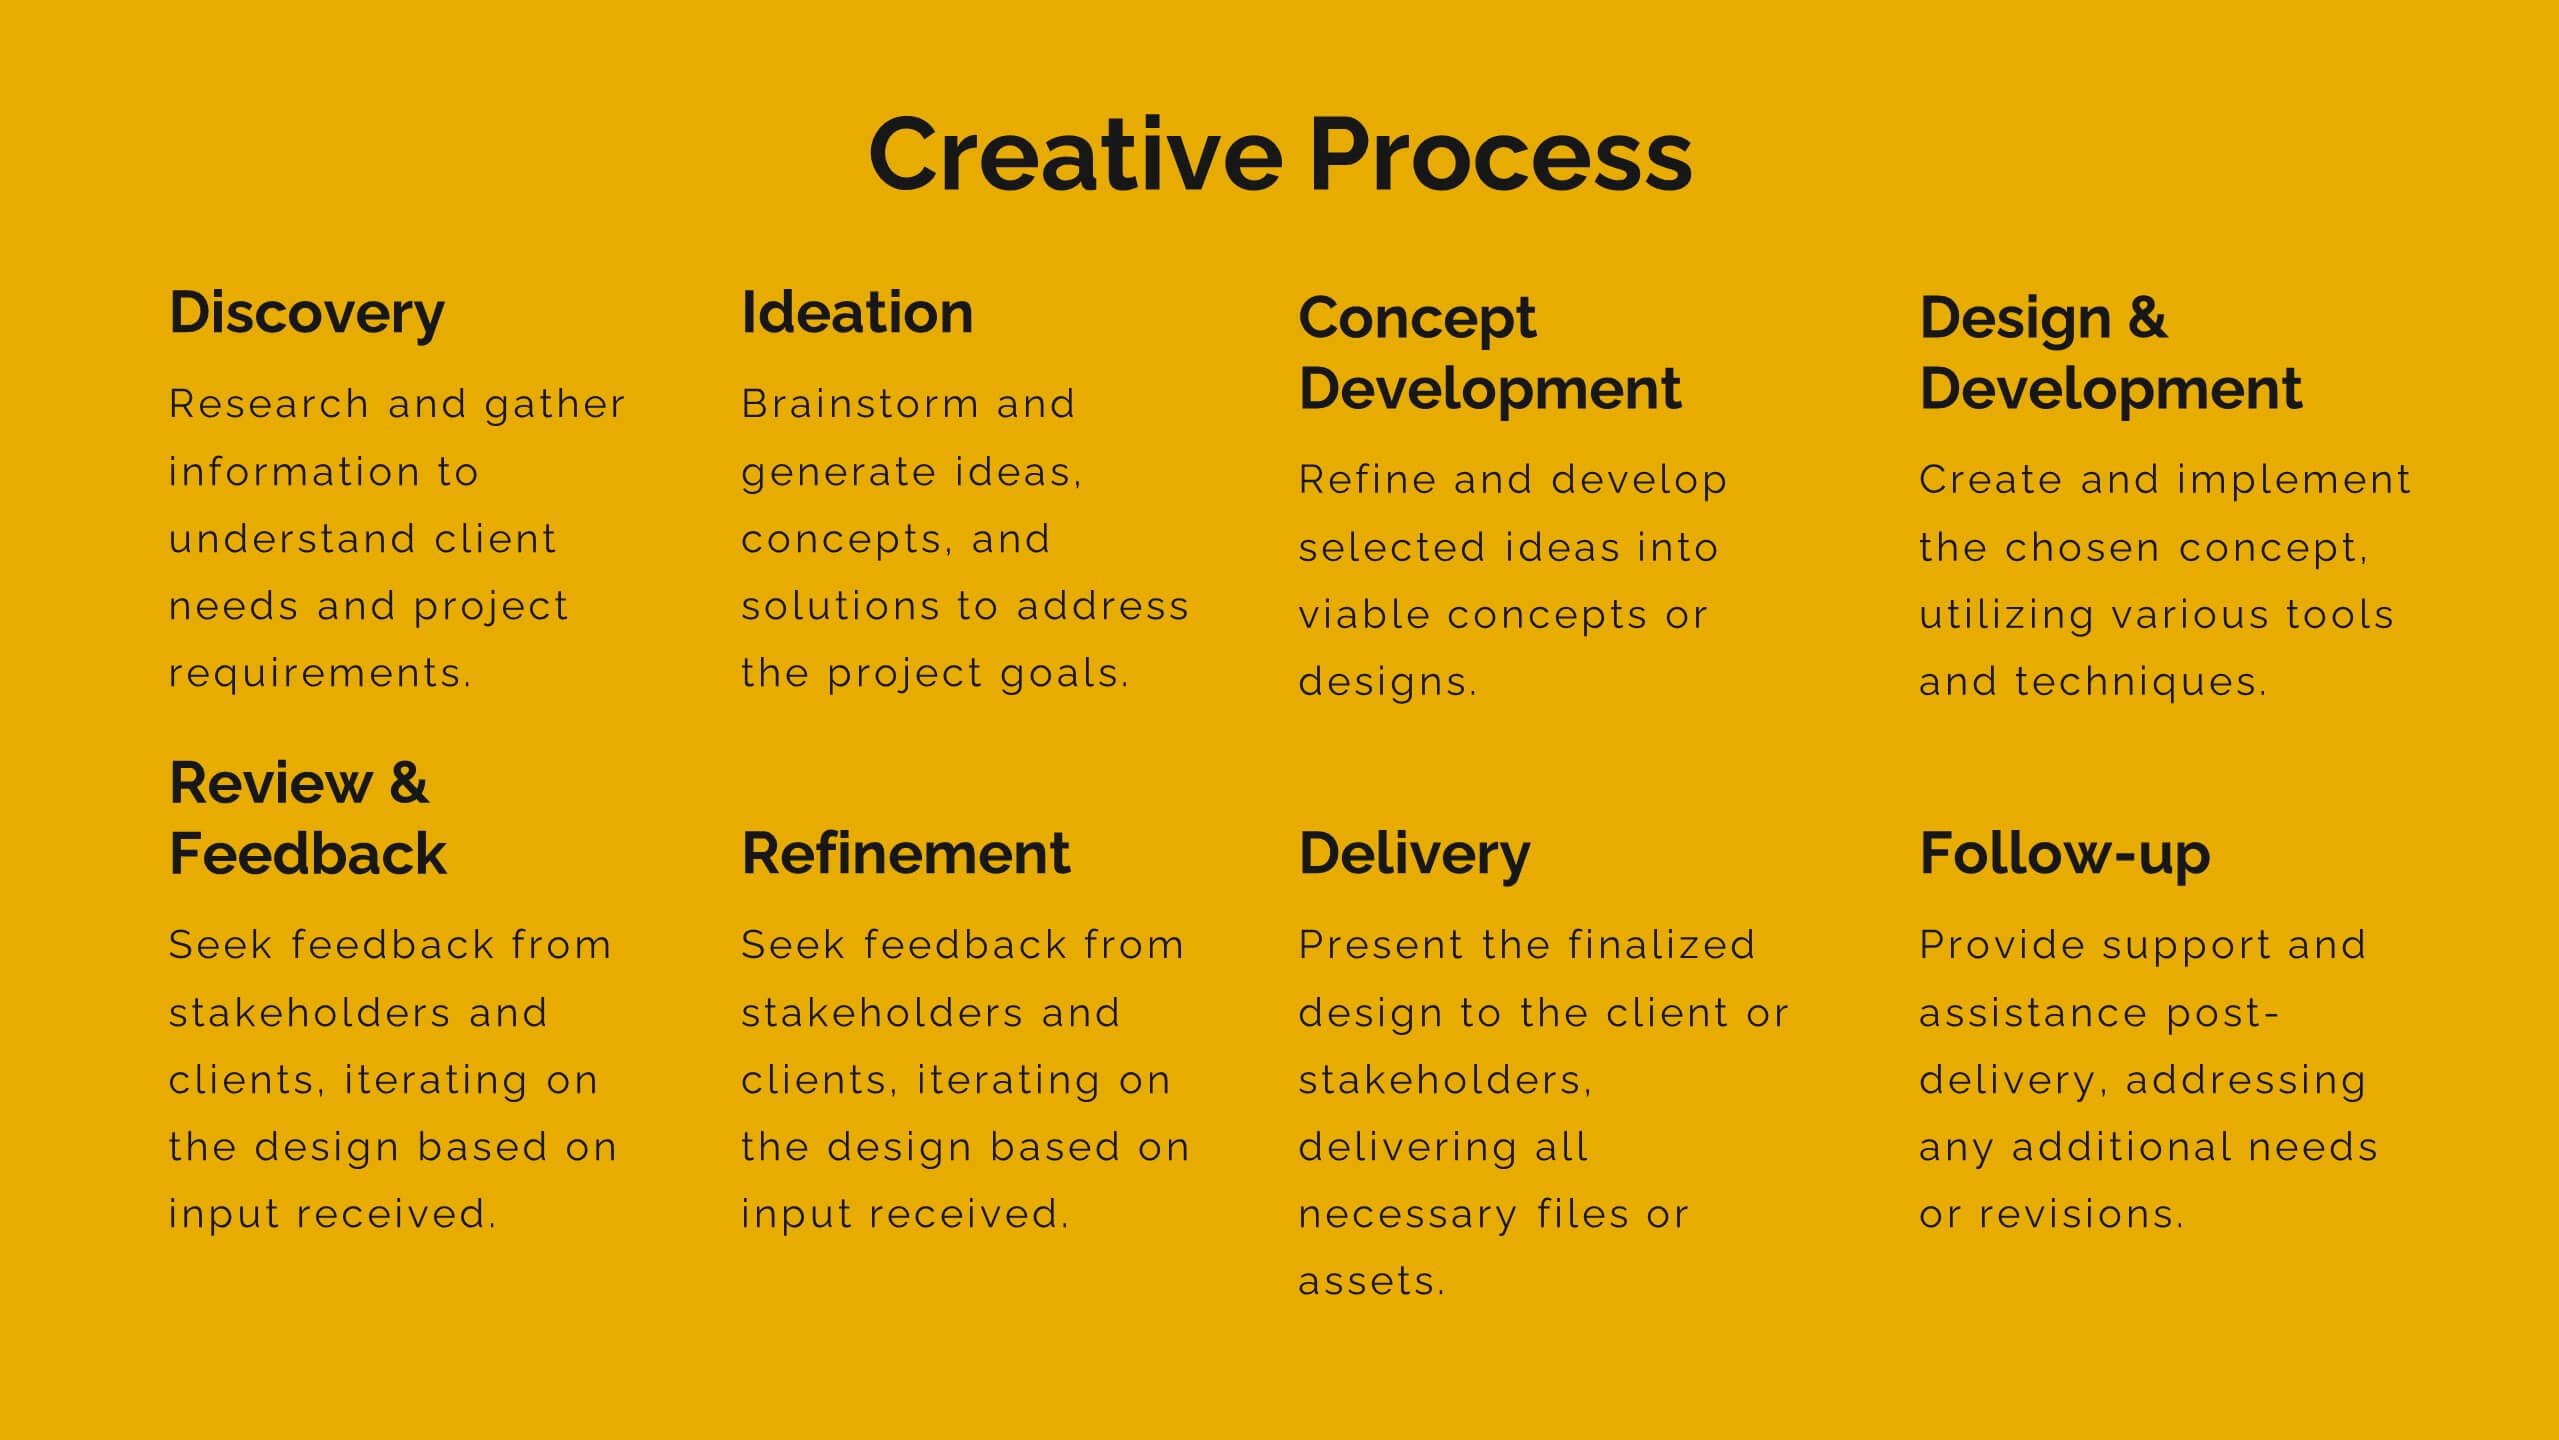
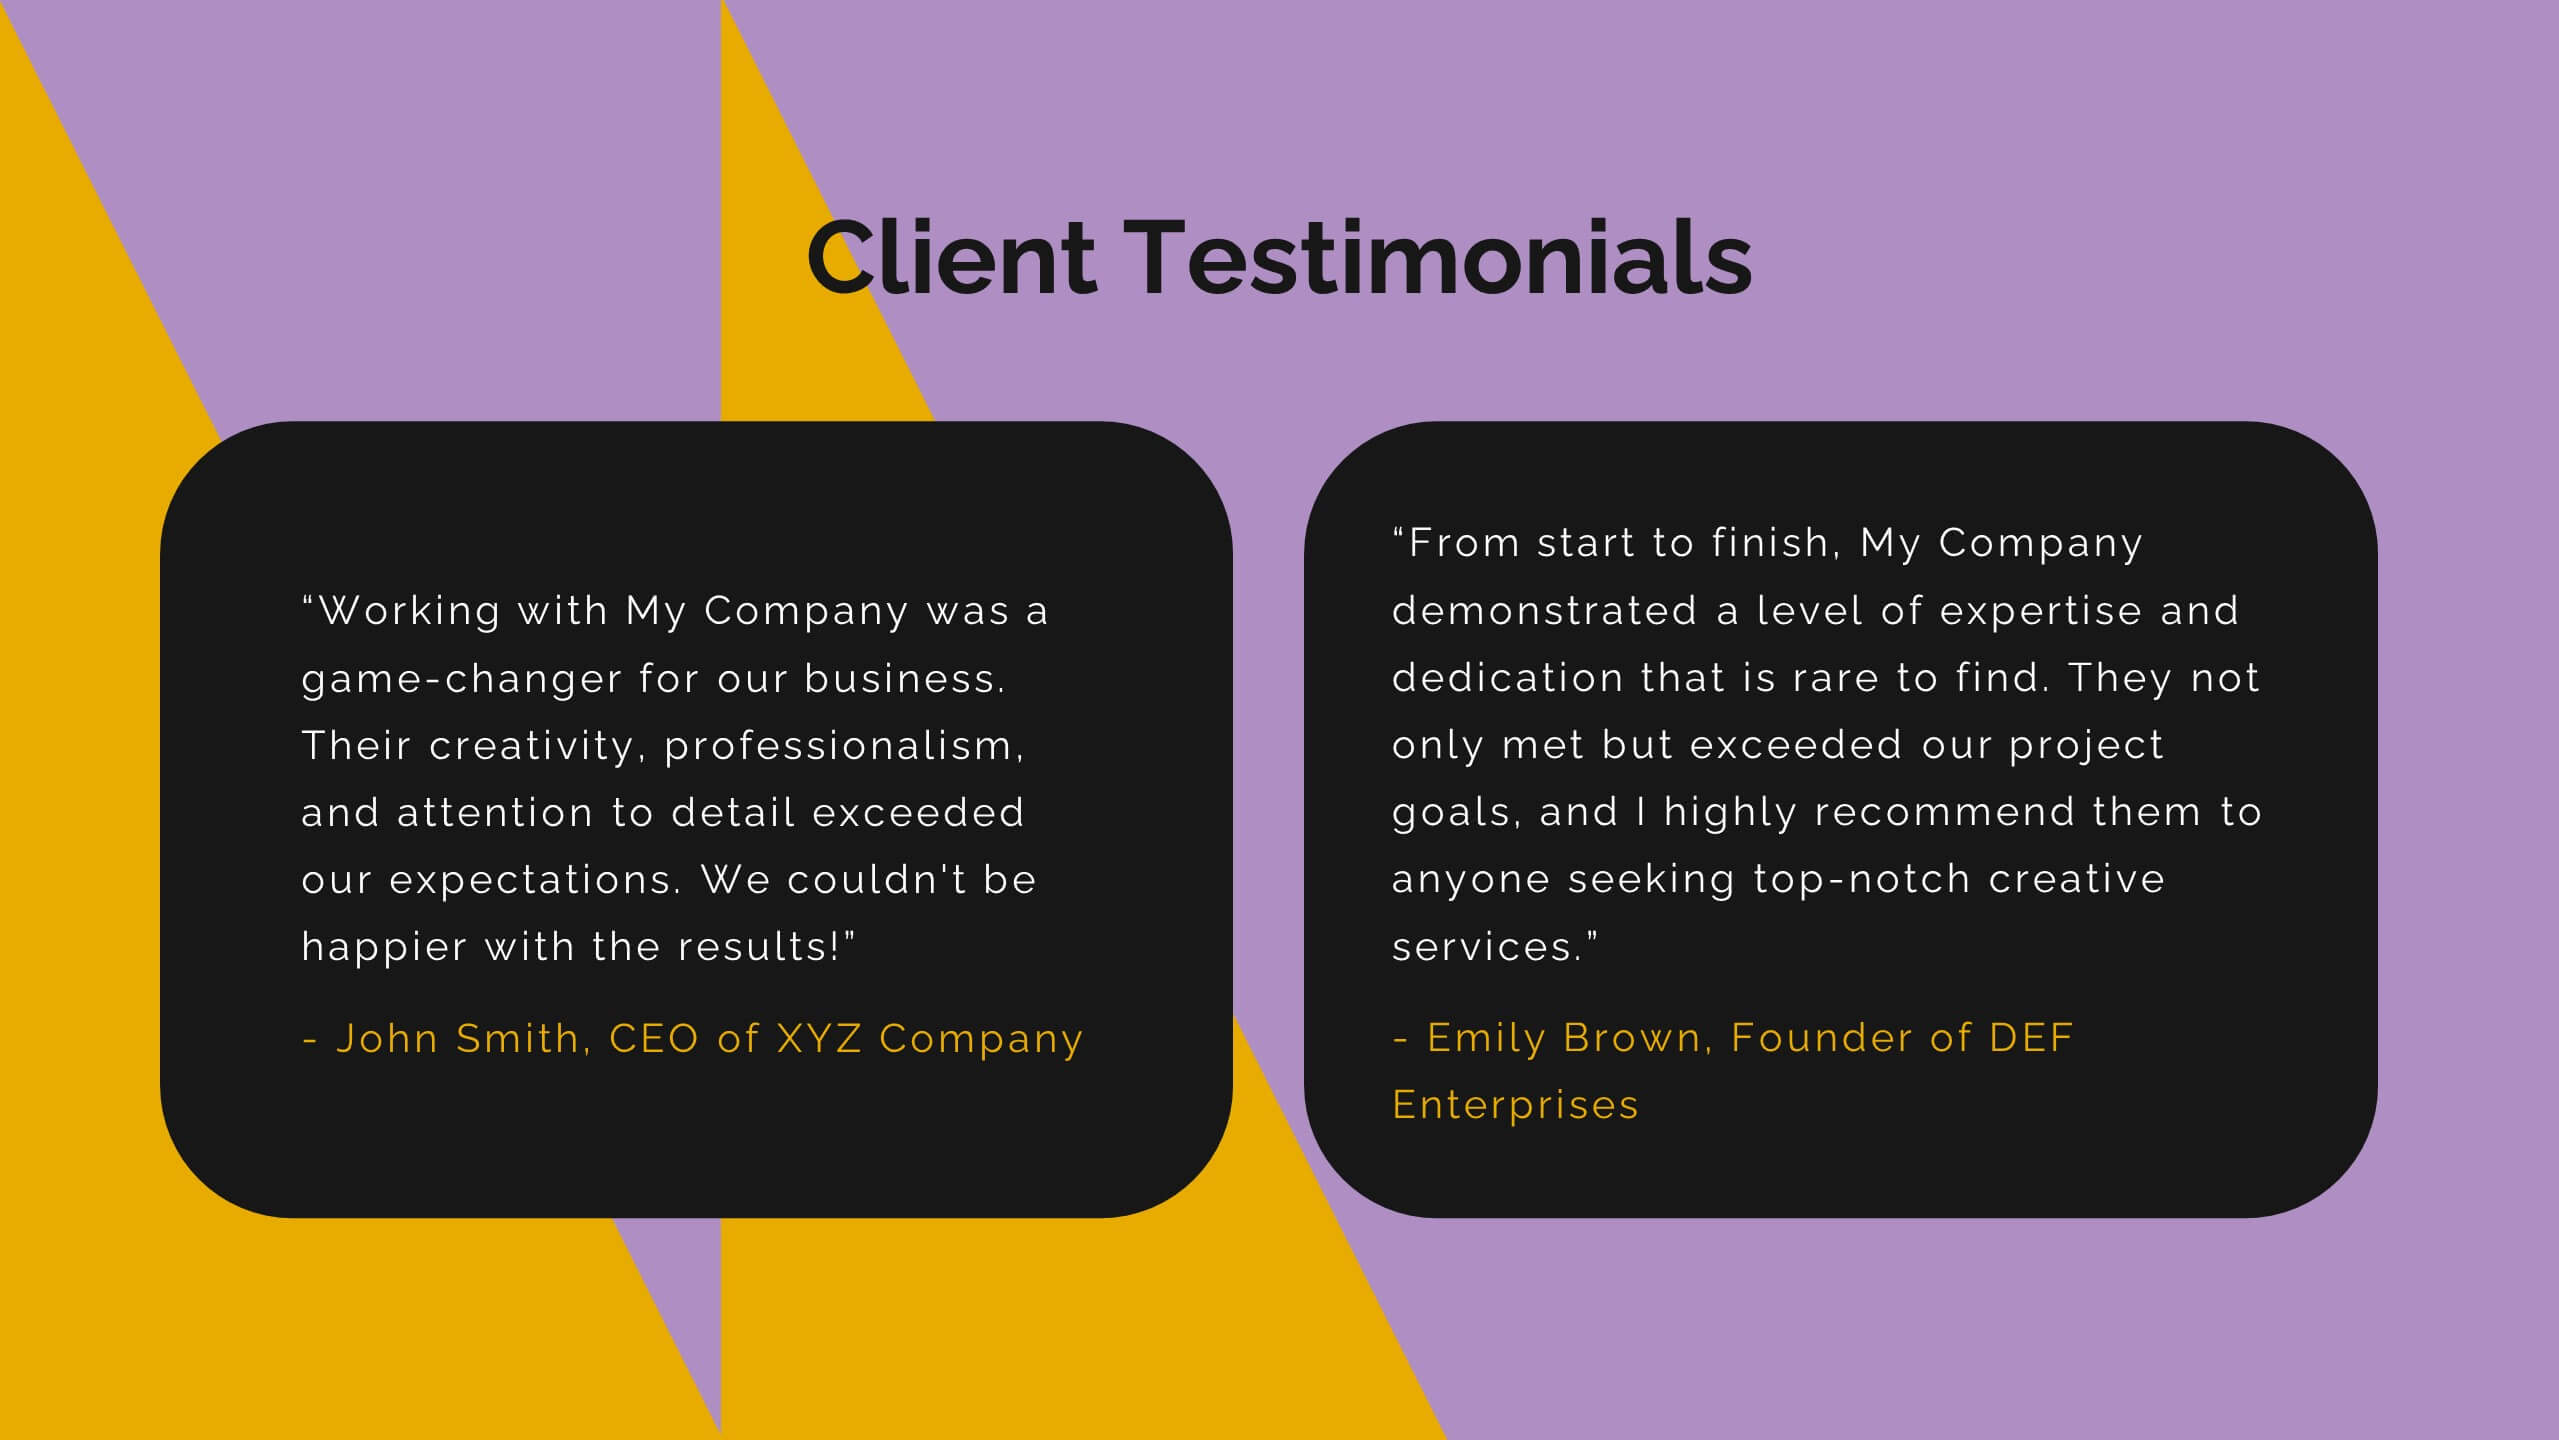
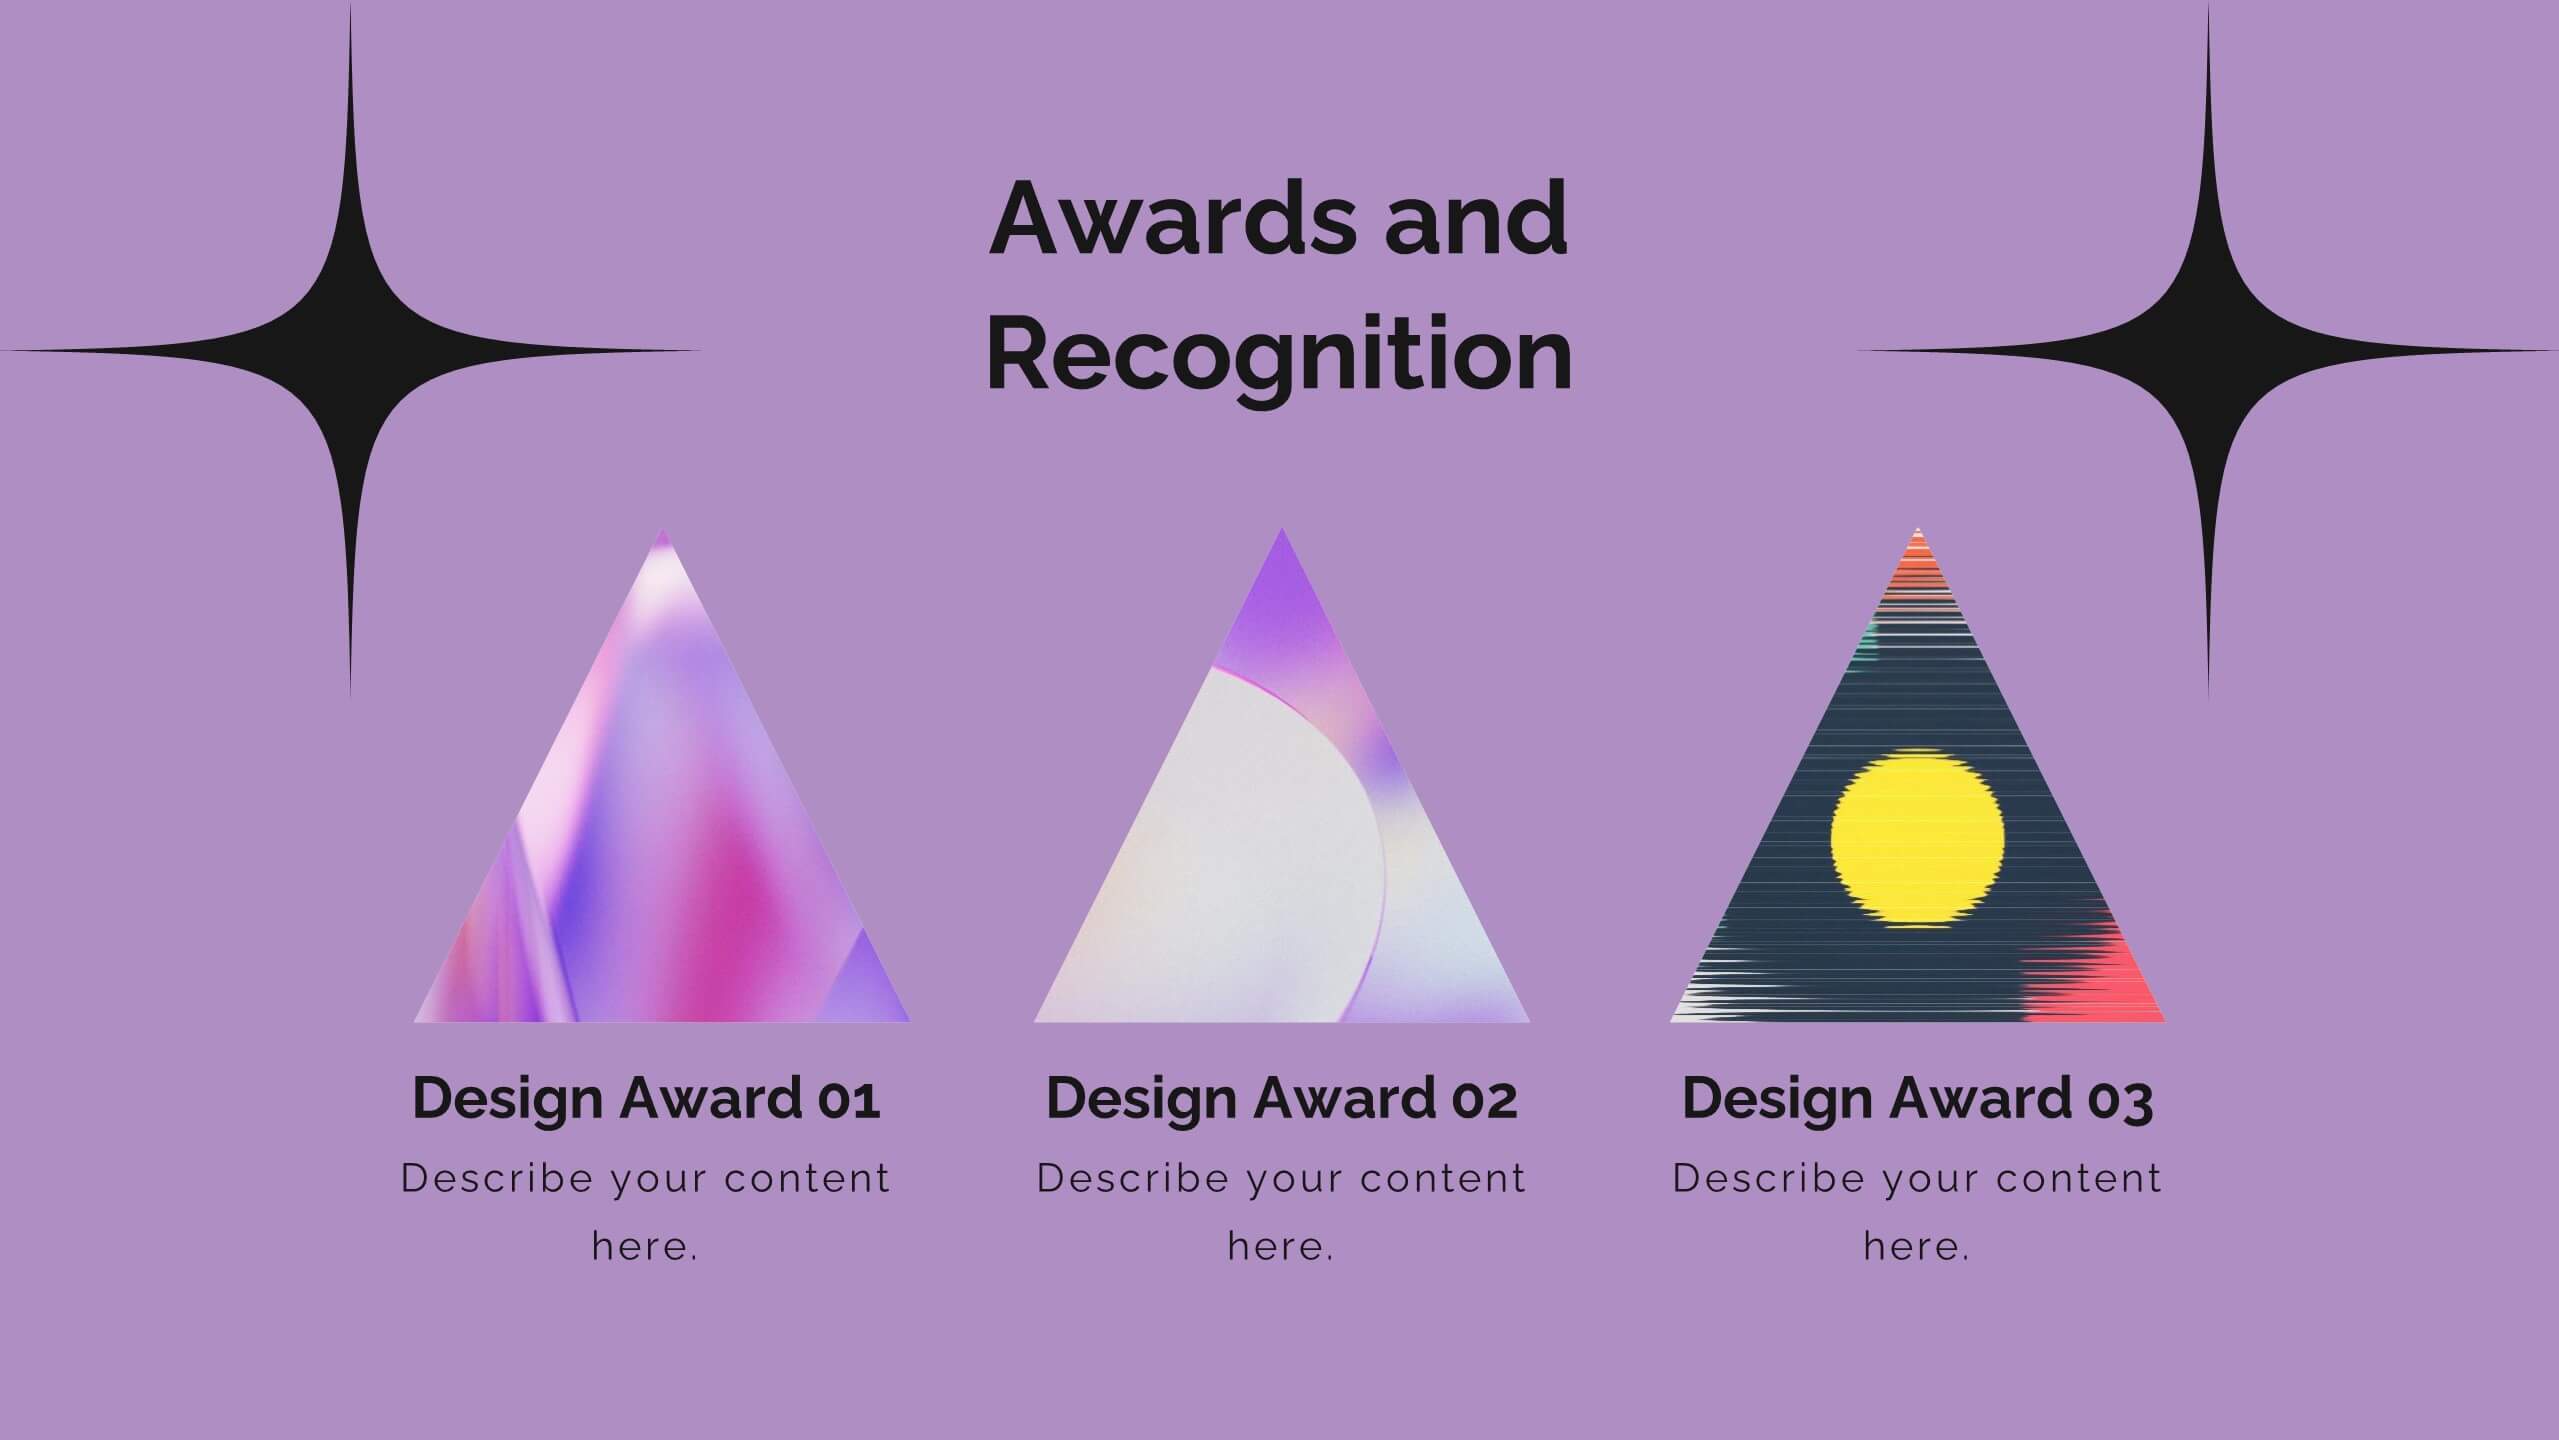
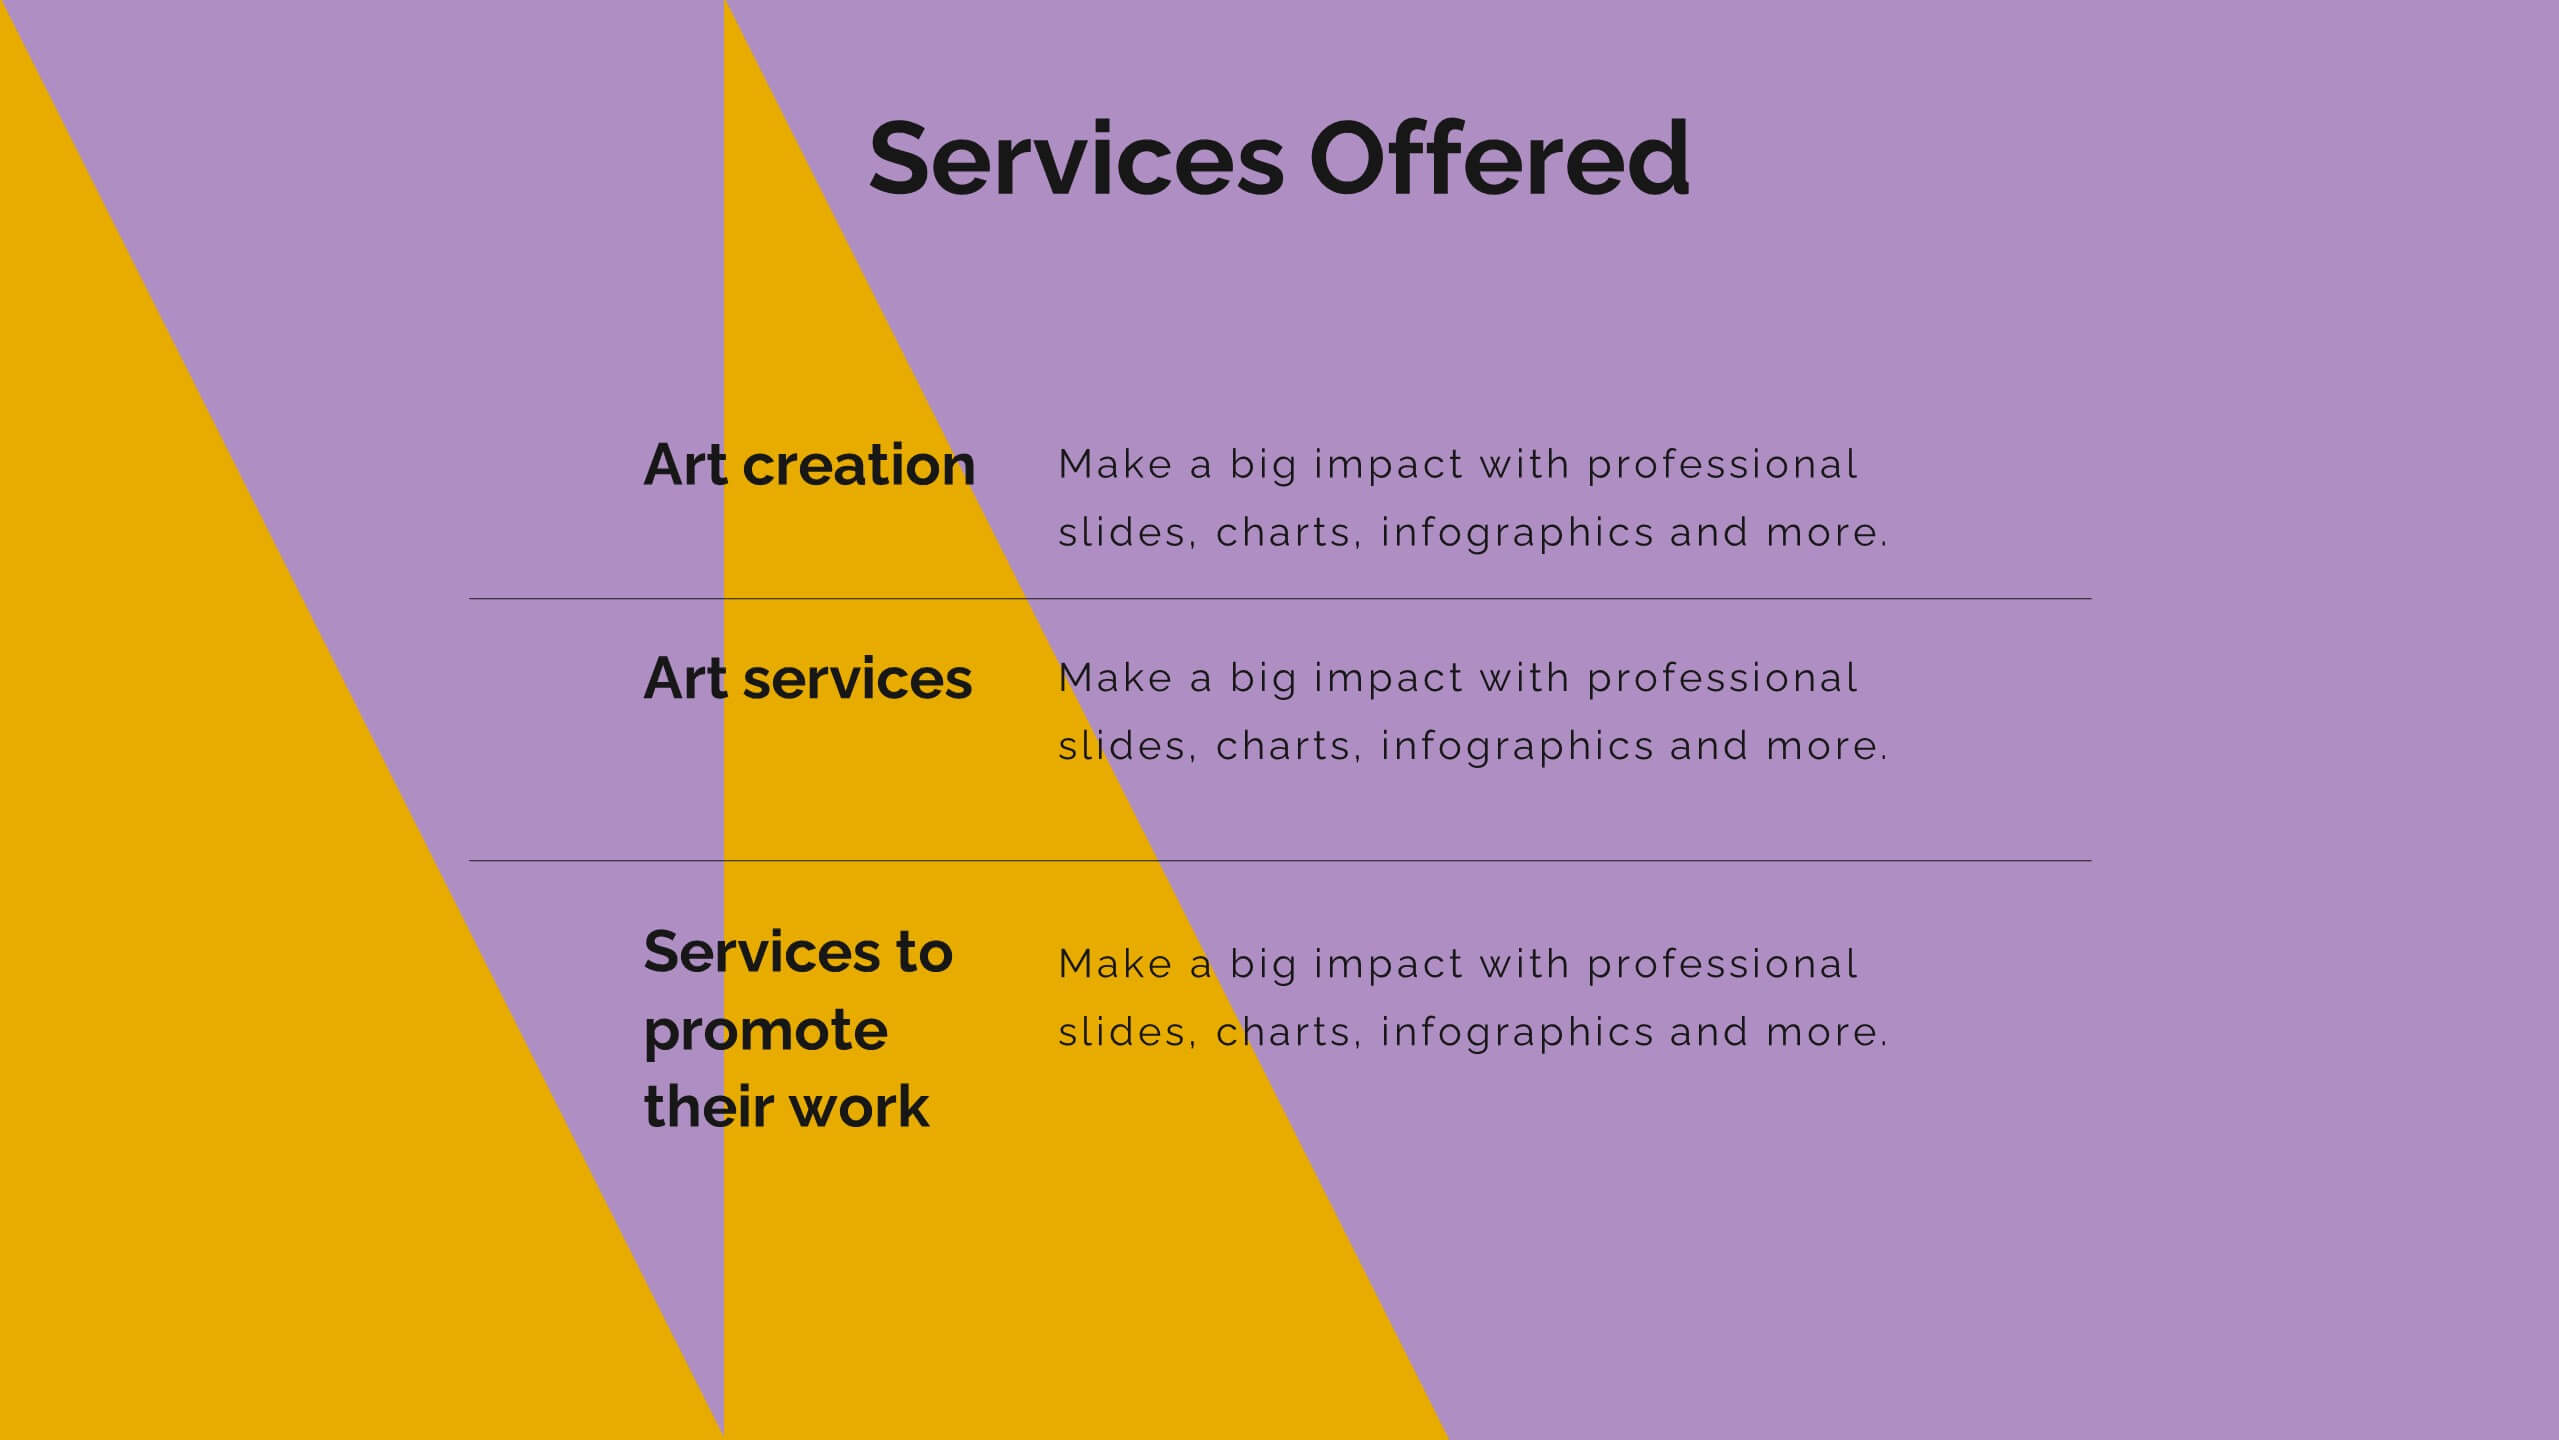
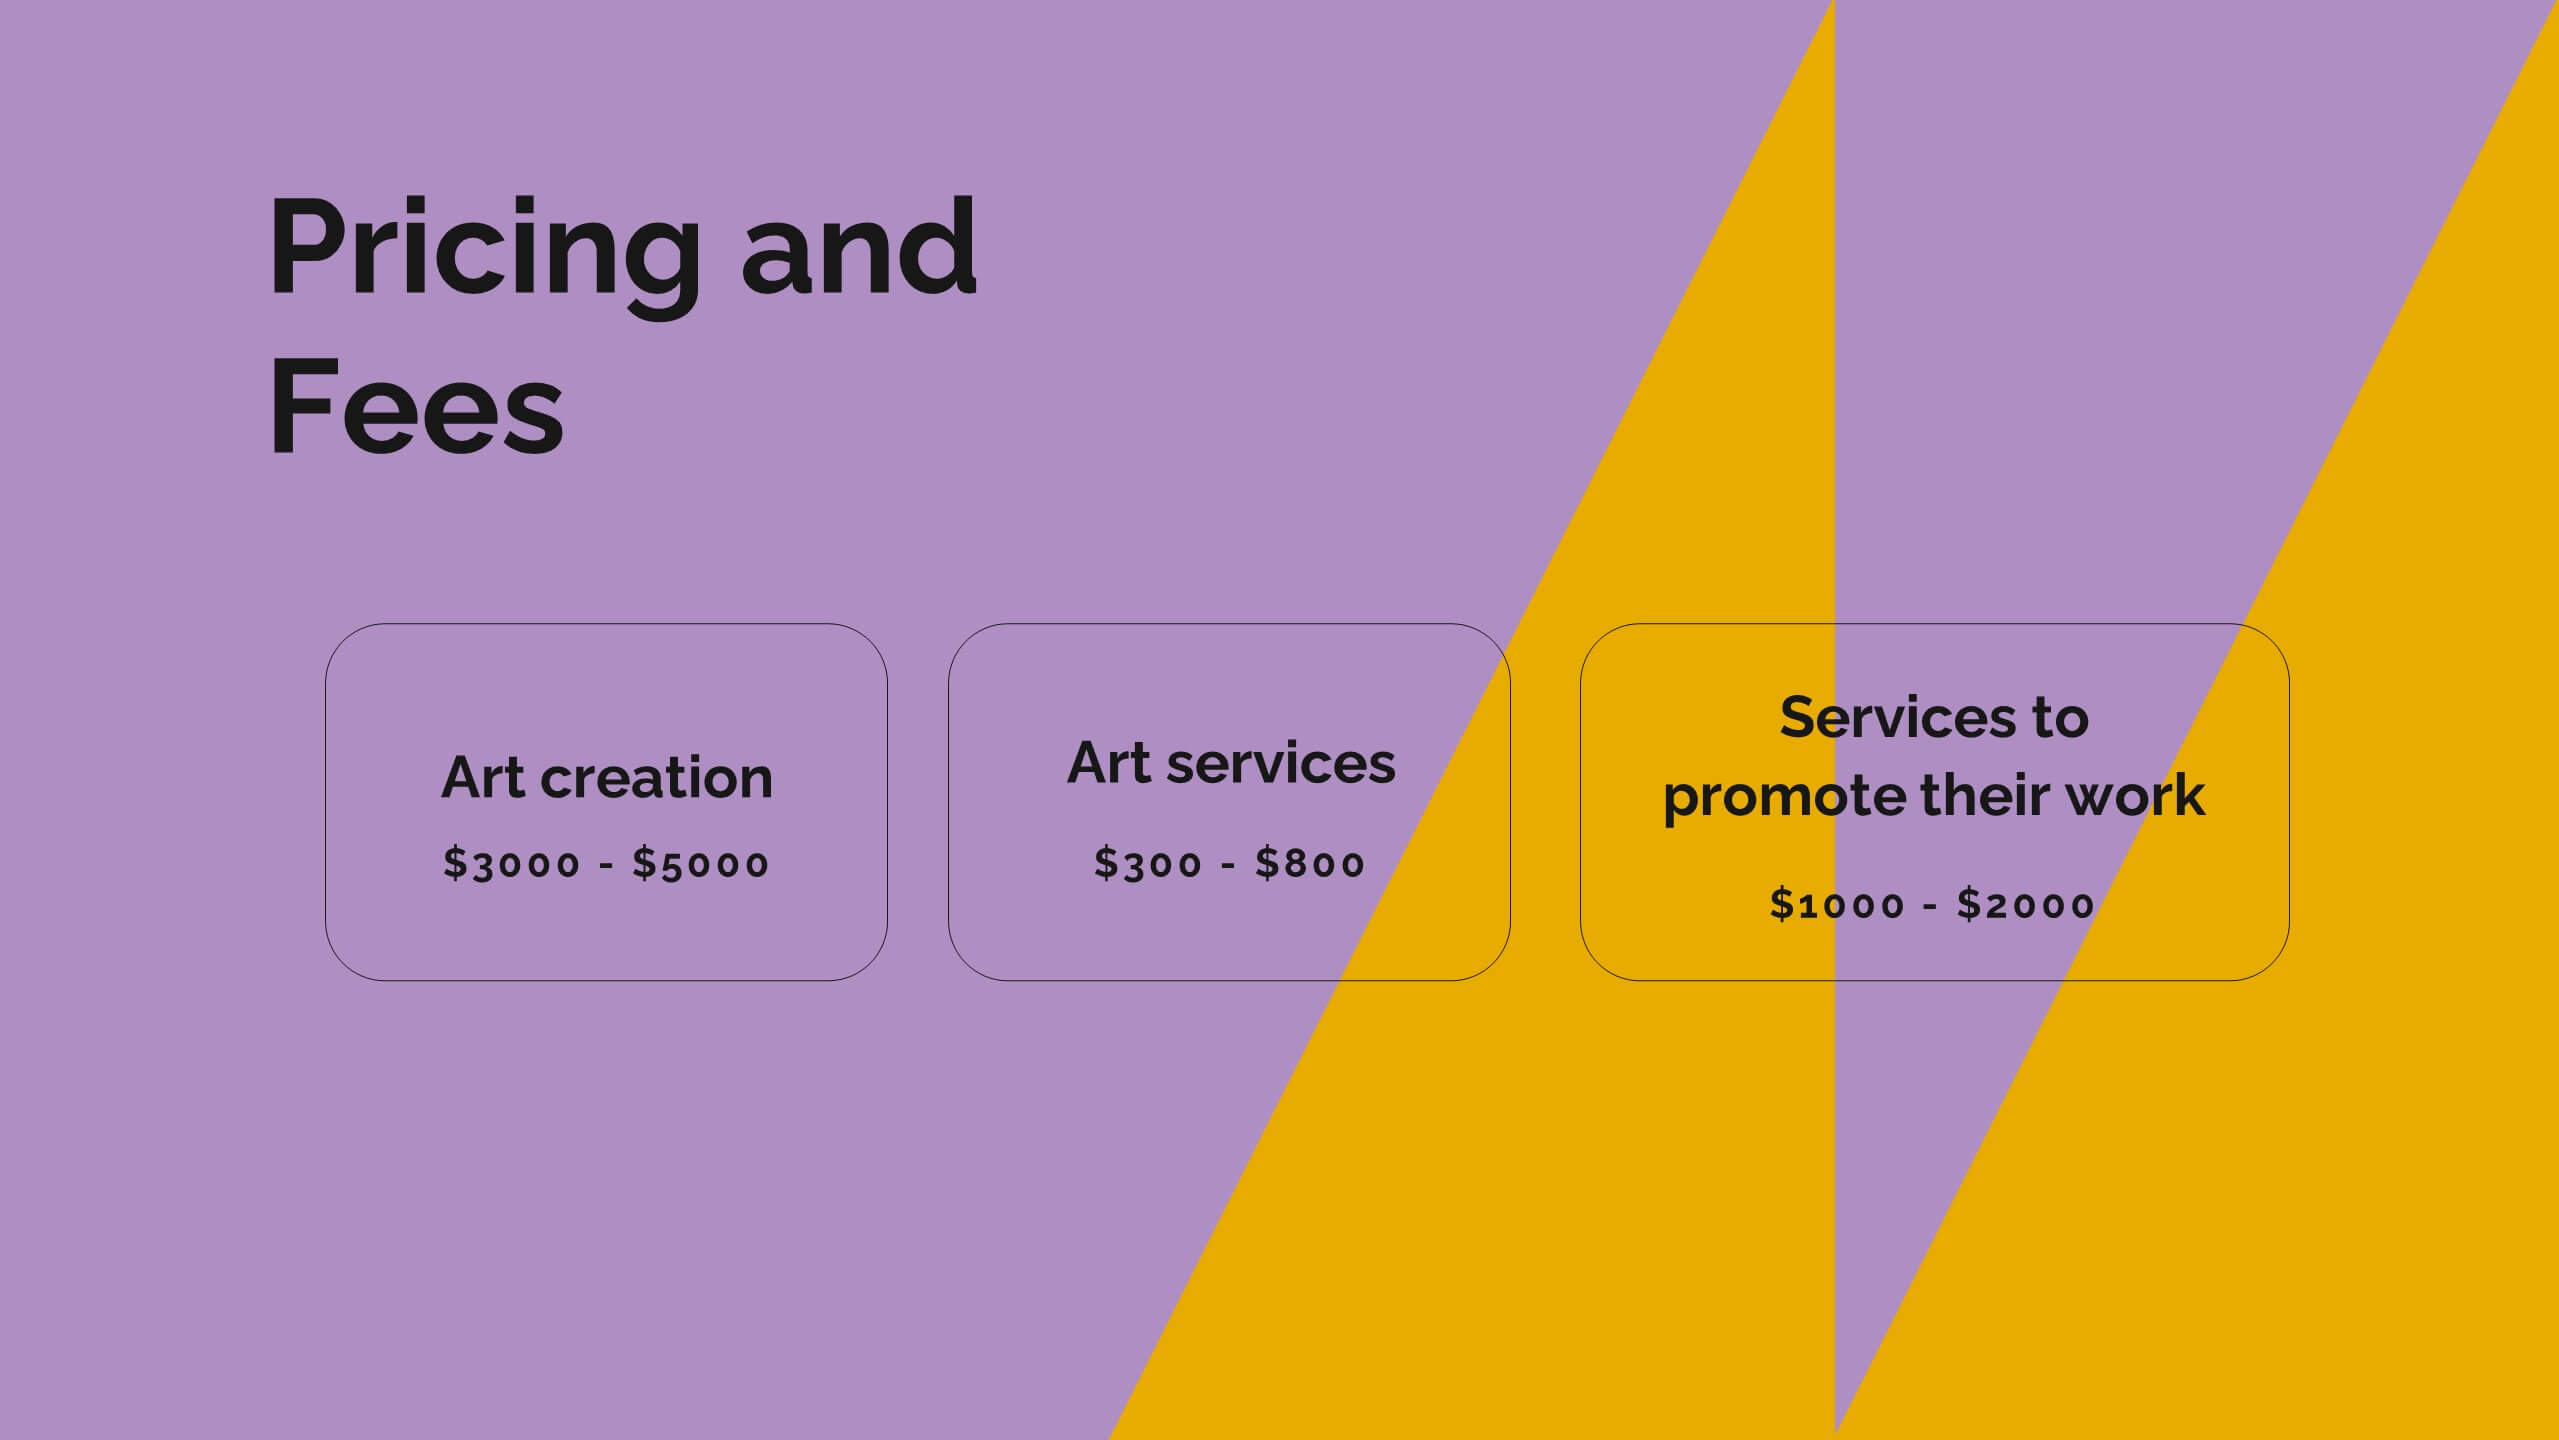
Vortex Artist Portfolio Template Presentation
Showcase your artistic brilliance with this eye-catching portfolio presentation template! Perfect for highlighting your projects, creative process, and awards, it features vibrant slides for your philosophy, collaborations, and client testimonials. Impress potential clients and collaborators with a stunning, well-organized portfolio. Compatible with PowerPoint, Keynote, and Google Slides for seamless presentations on any platform.


6 diapositivas
End-to-End Value Chain Process Presentation
Visualize every link in your process with the End-to-End Value Chain Process Presentation. This modern chain diagram helps illustrate each stage of your business or production flow—from initial input to final output. It's ideal for strategy, supply chain, and operational planning. Fully editable in PowerPoint, Keynote, Canva, or Google Slides.