


Características


¿Tienes alguna pregunta?
Recomendar


5 diapositivas
Company Vision and Operations Overview Presentation
Present your company’s mission and structure with this Company Vision and Operations Overview Presentation. Designed around a central eye graphic, it highlights four strategic pillars or core values. Ideal for executive summaries, leadership decks, or internal briefings. Fully editable in Canva, PowerPoint, or Google Slides.


6 diapositivas
Personal Productivity Time Management Techniques Presentation
Streamline your workflow with the Personal Productivity Time Management Techniques presentation slide. Featuring a step-by-step staircase layout, this template visually maps out five core techniques or habits leading to improved efficiency and goal achievement. Each step includes an icon and placeholder text for easy customization. Ideal for productivity coaches, corporate trainers, or time management workshops. Fully editable in PowerPoint, Keynote, and Google Slides.


6 diapositivas
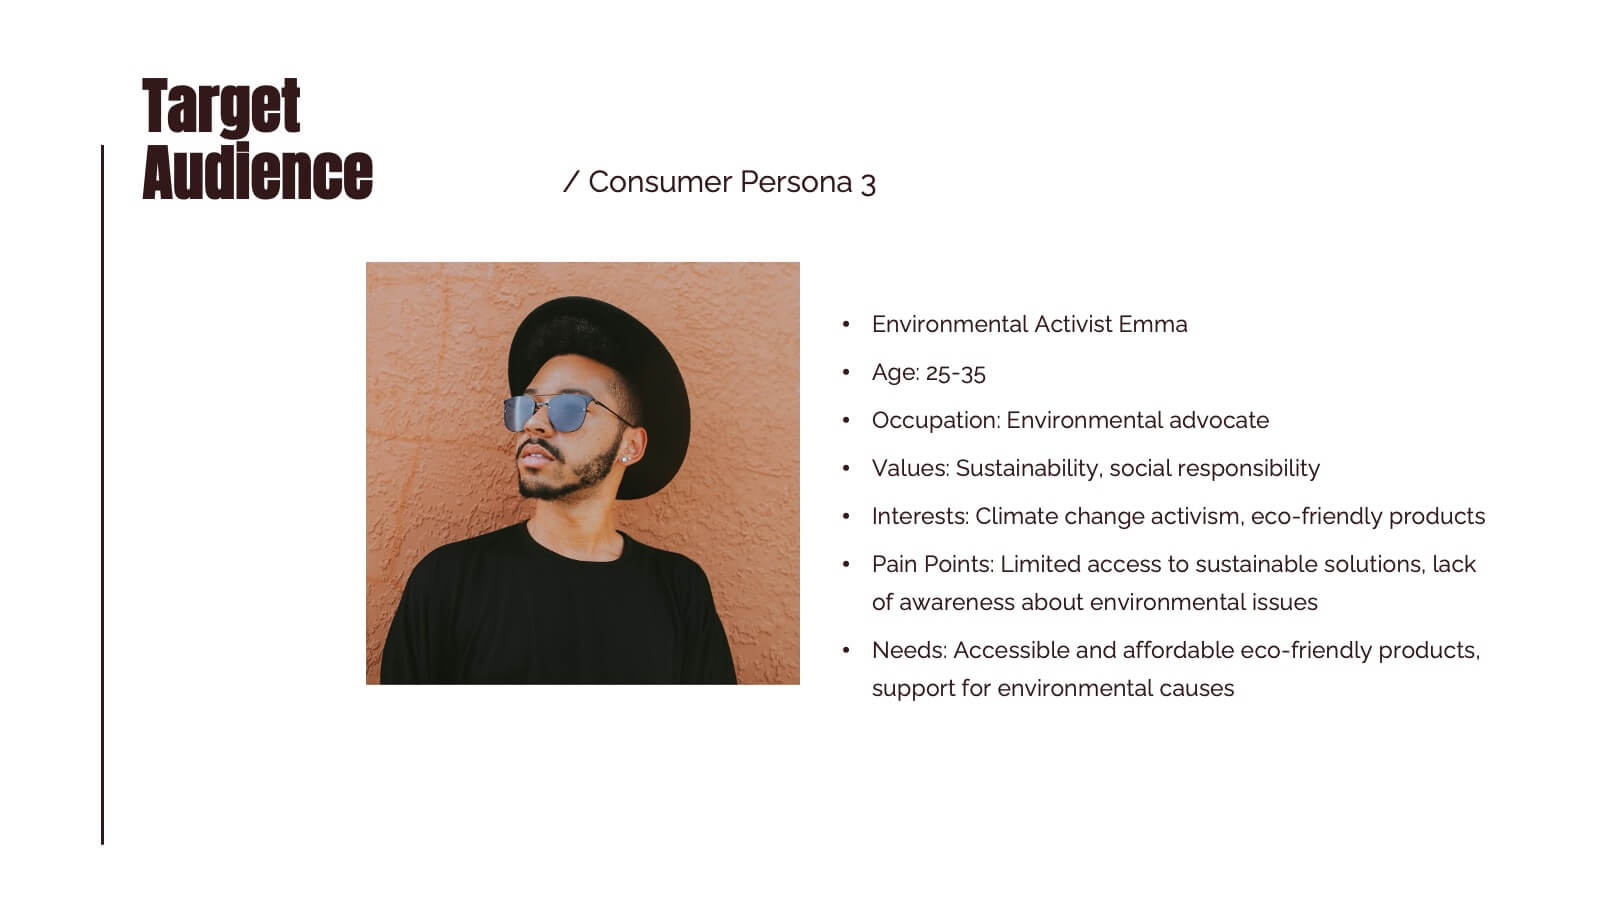
Creating Effective Buyer Persona Strategies Presentation
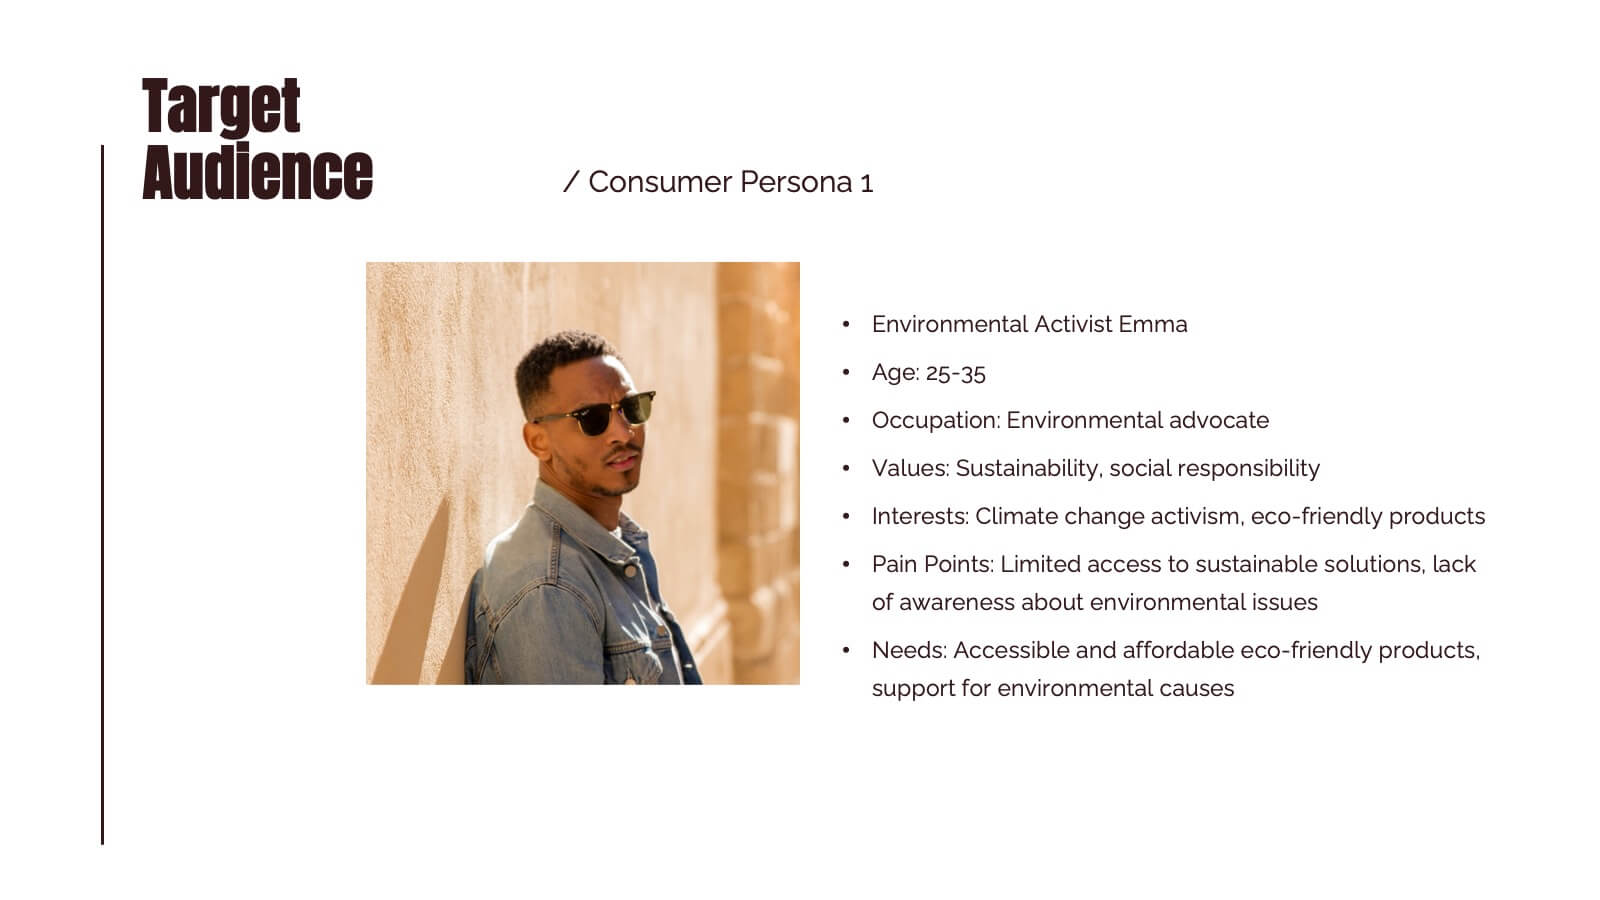
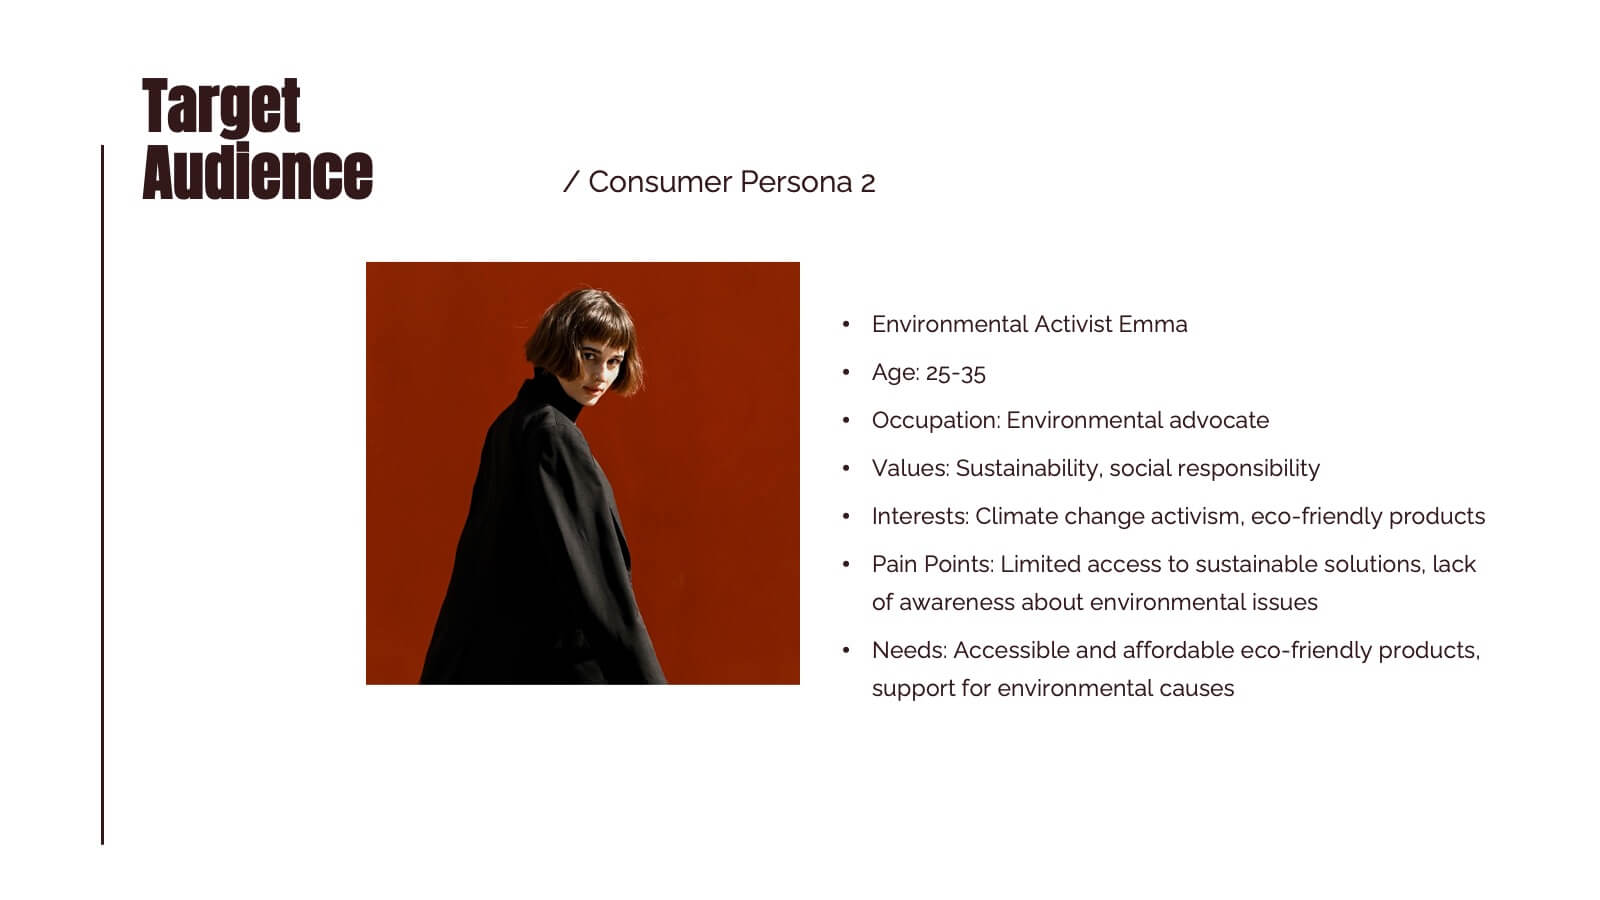
Present your audience research with clarity using this buyer persona strategy slide. Designed with a radial layout of five icons leading to a central profile, this template helps communicate key traits, behaviors, and preferences. Ideal for marketing teams, branding workshops, and product strategy sessions. Easily customizable in PowerPoint, Keynote, and Google Slides.


8 diapositivas
Cognitive Psychology and Decision Making
Unlock the logic behind human choices with this eye-catching presentation template that puts cognitive puzzles into perspective—literally. Dive into how thought patterns, mental shortcuts, and biases influence decision making, all illustrated through clean visuals and digestible layouts. Easily customizable for PowerPoint, Keynote, and Google Slides.


3 diapositivas
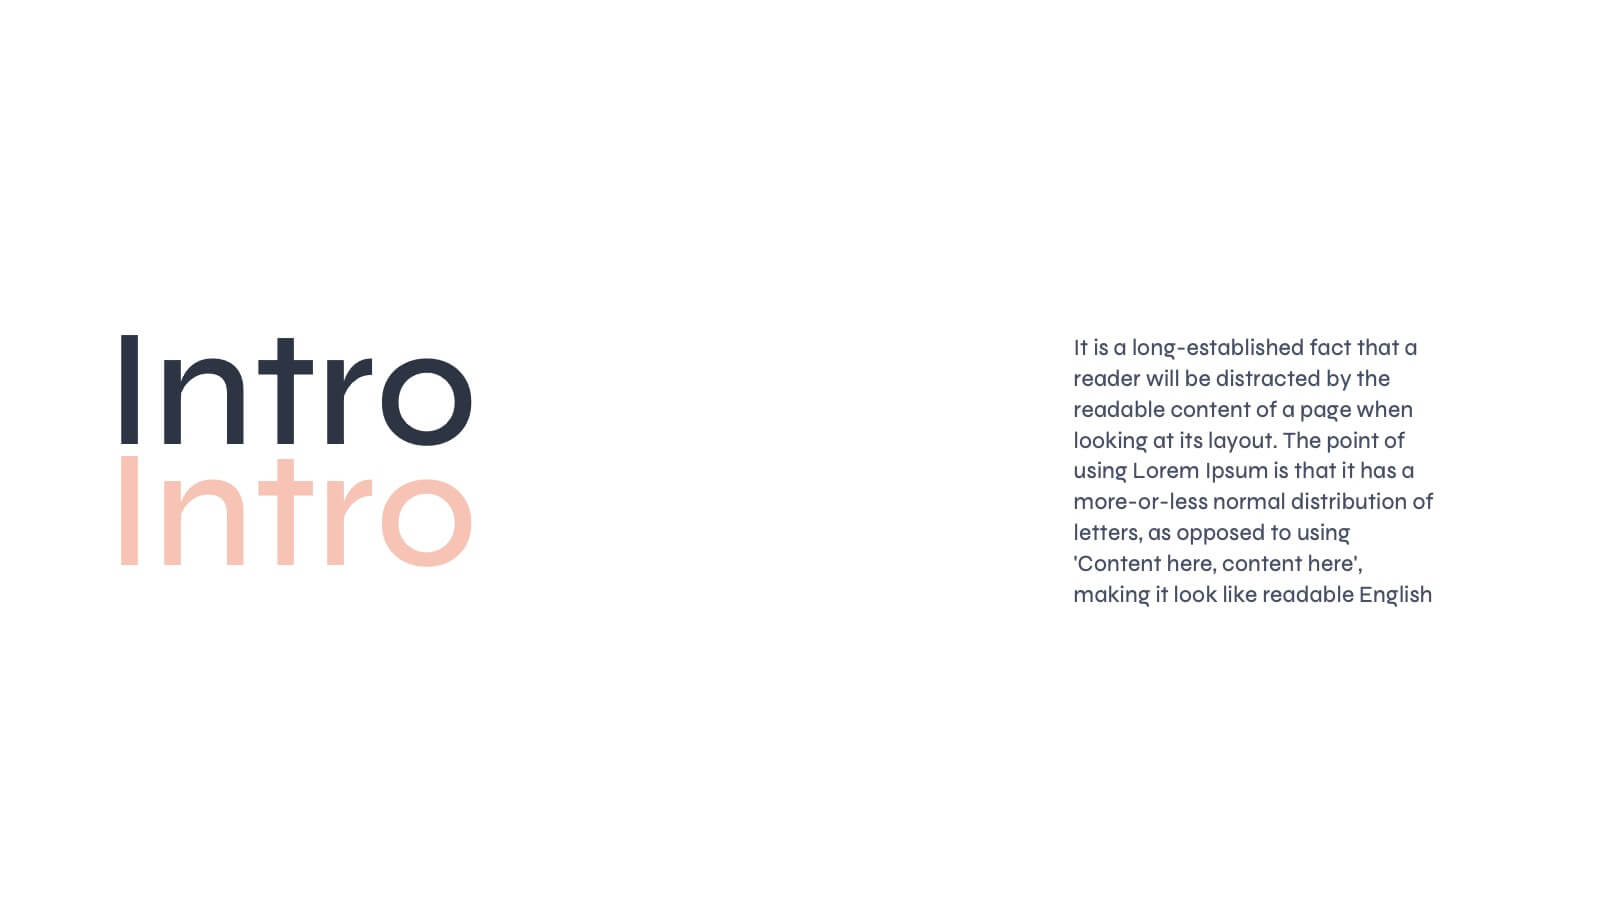
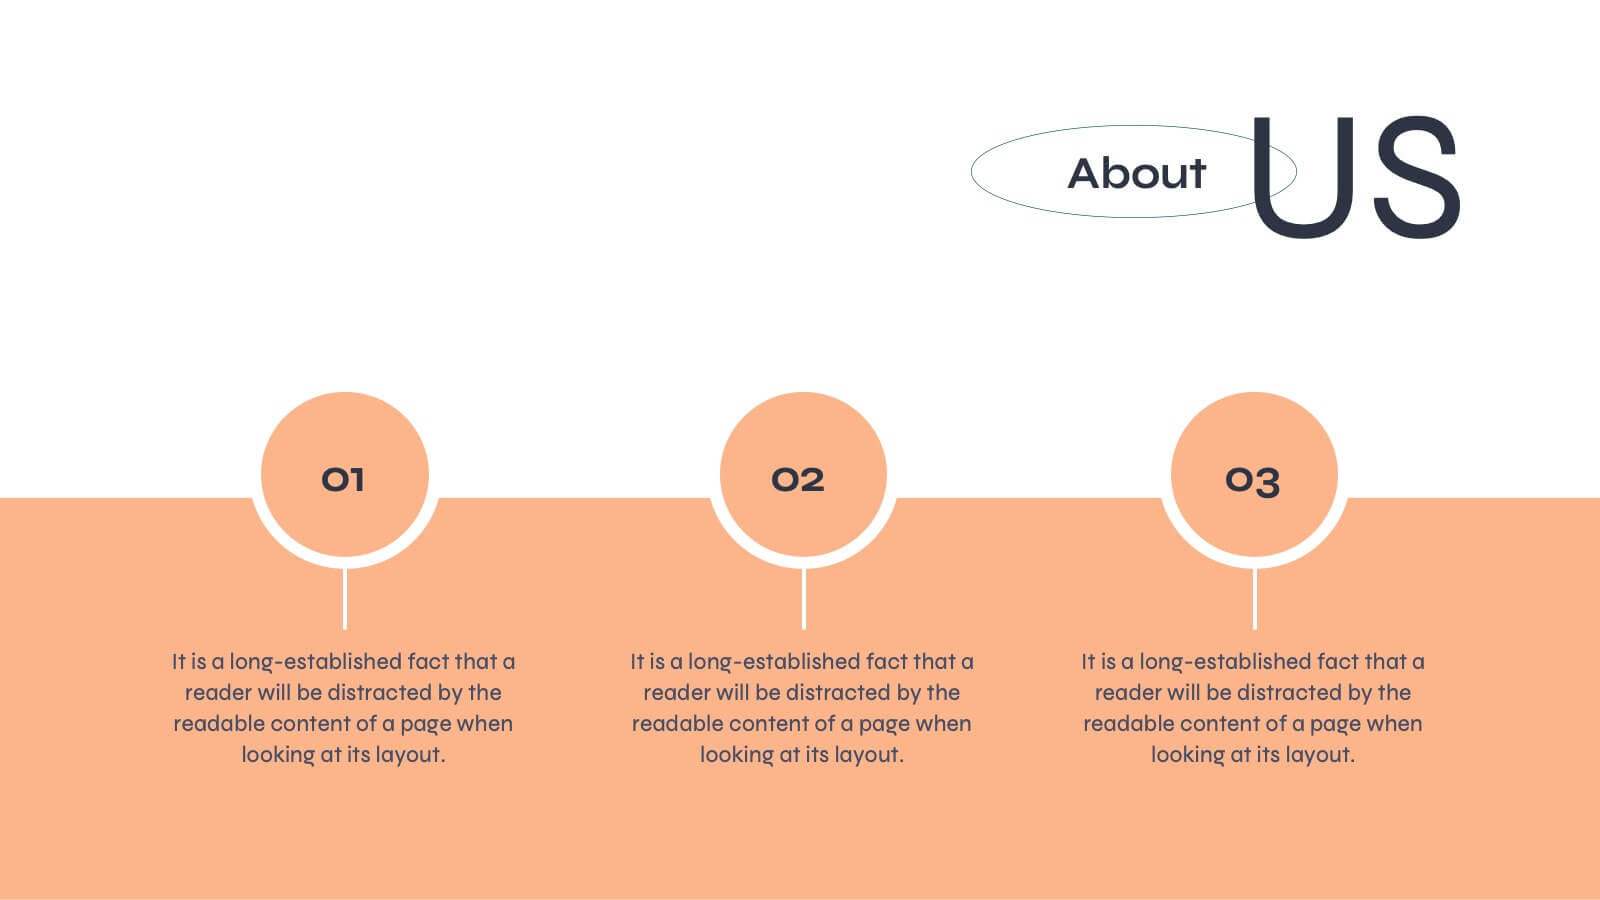
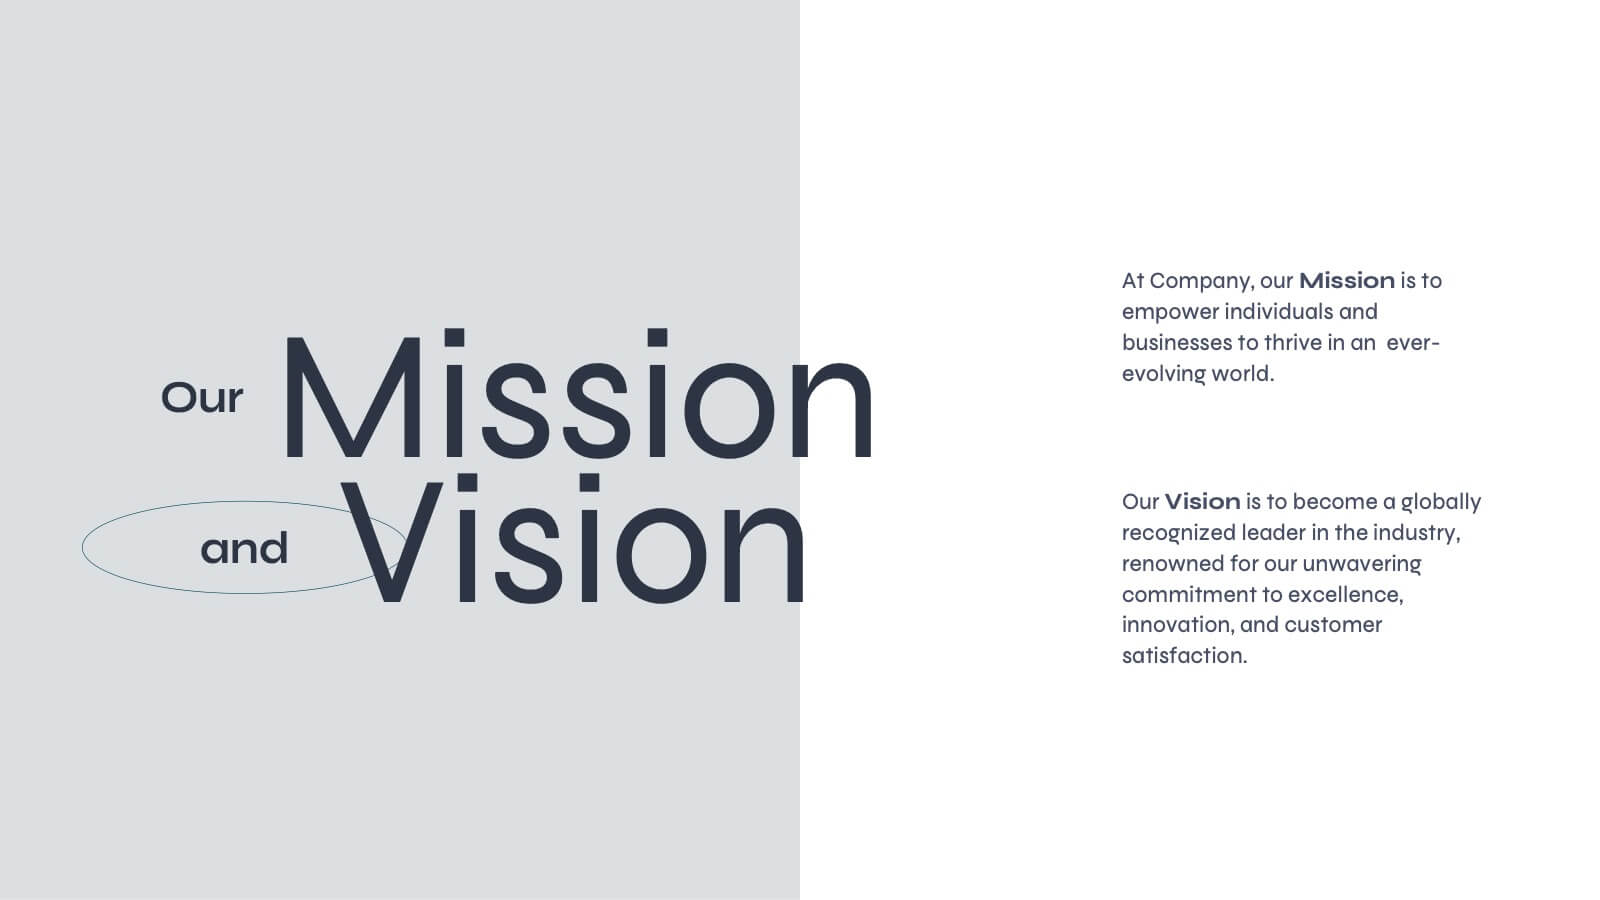
Professional Introduction Slide
Introduce team members with clarity and style using this profile-focused slide. Designed to highlight key stats, roles, and responsibilities, it’s perfect for internal presentations, onboarding, or proposals. Easily customizable in PowerPoint, Keynote, and Google Slides.


4 diapositivas
Regional Business Focus on Asia Presentation
Showcase your company’s strategic footprint with the Regional Business Focus on Asia Presentation. This clean, icon-labeled map layout helps illustrate key markets, logistics routes, or development hubs across Asia. Ideal for business expansion plans, investment updates, or regional performance overviews. Fully editable in PowerPoint, Keynote, Google Slides, and Canva.


7 diapositivas
Network Solutions Infographics
The Network Solutions Infographic is designed to showcase the complexities and interconnectivity of network systems in a clear, visual format. It is perfect for IT professionals, educators, and students to communicate the intricacies of network architecture, pathways, and protocols. This infographic can be tailored to highlight various network types, such as LAN, WAN, or VPN, and to illustrate the flow of data through different network layers and devices. It can also be used to explain concepts like network security, data management, and the impact of emerging technologies on networking. Whether used for training purposes, presentations, or as part of a marketing strategy for tech companies, the Network Solutions Infographic simplifies the transfer of detailed network information and engages the audience with its visual appeal.


5 diapositivas
Scrum Team Roles Presentation
A clear, engaging layout brings this presentation to life, making it easy to explain how each role contributes to a productive, collaborative workflow. Designed to simplify complex team structures, it helps you communicate responsibilities with confidence and clarity. Fully compatible with PowerPoint, Keynote, and Google Slides.


8 diapositivas
Root Cause Visual via Ishikawa Method
Clarify root causes and drive actionable solutions with the Root Cause Visual via Ishikawa Method Presentation. This fishbone-style infographic layout uses six categorized nodes mapped directly to a streamlined fish silhouette, ideal for visualizing complex problems. Easily editable in PowerPoint, Keynote, and Google Slides.
25 diapositivas
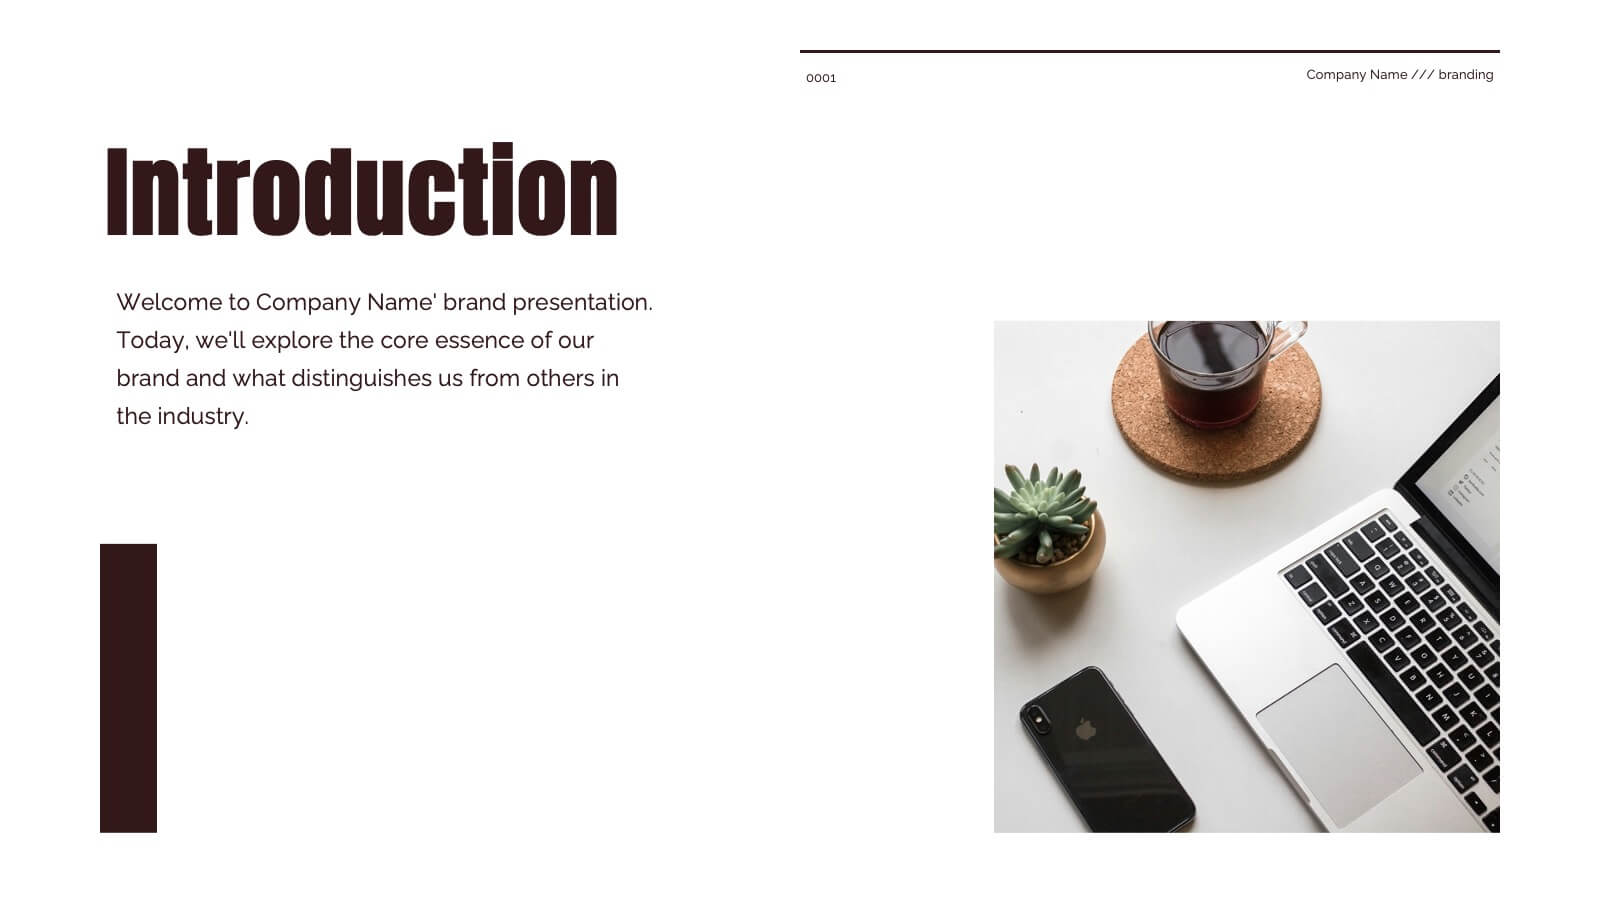
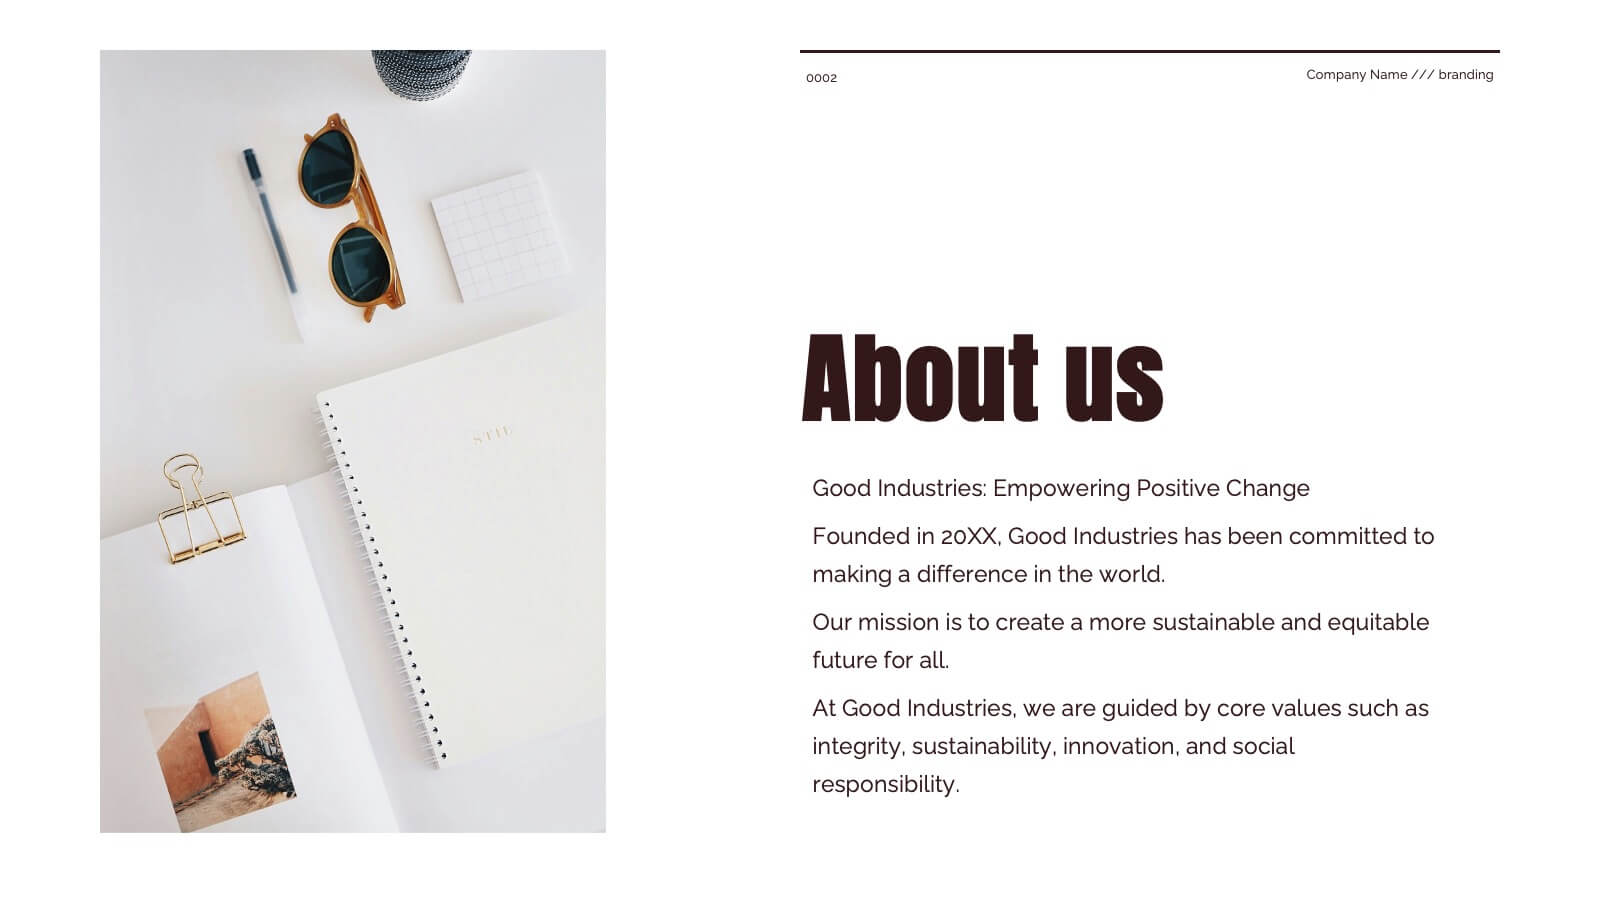
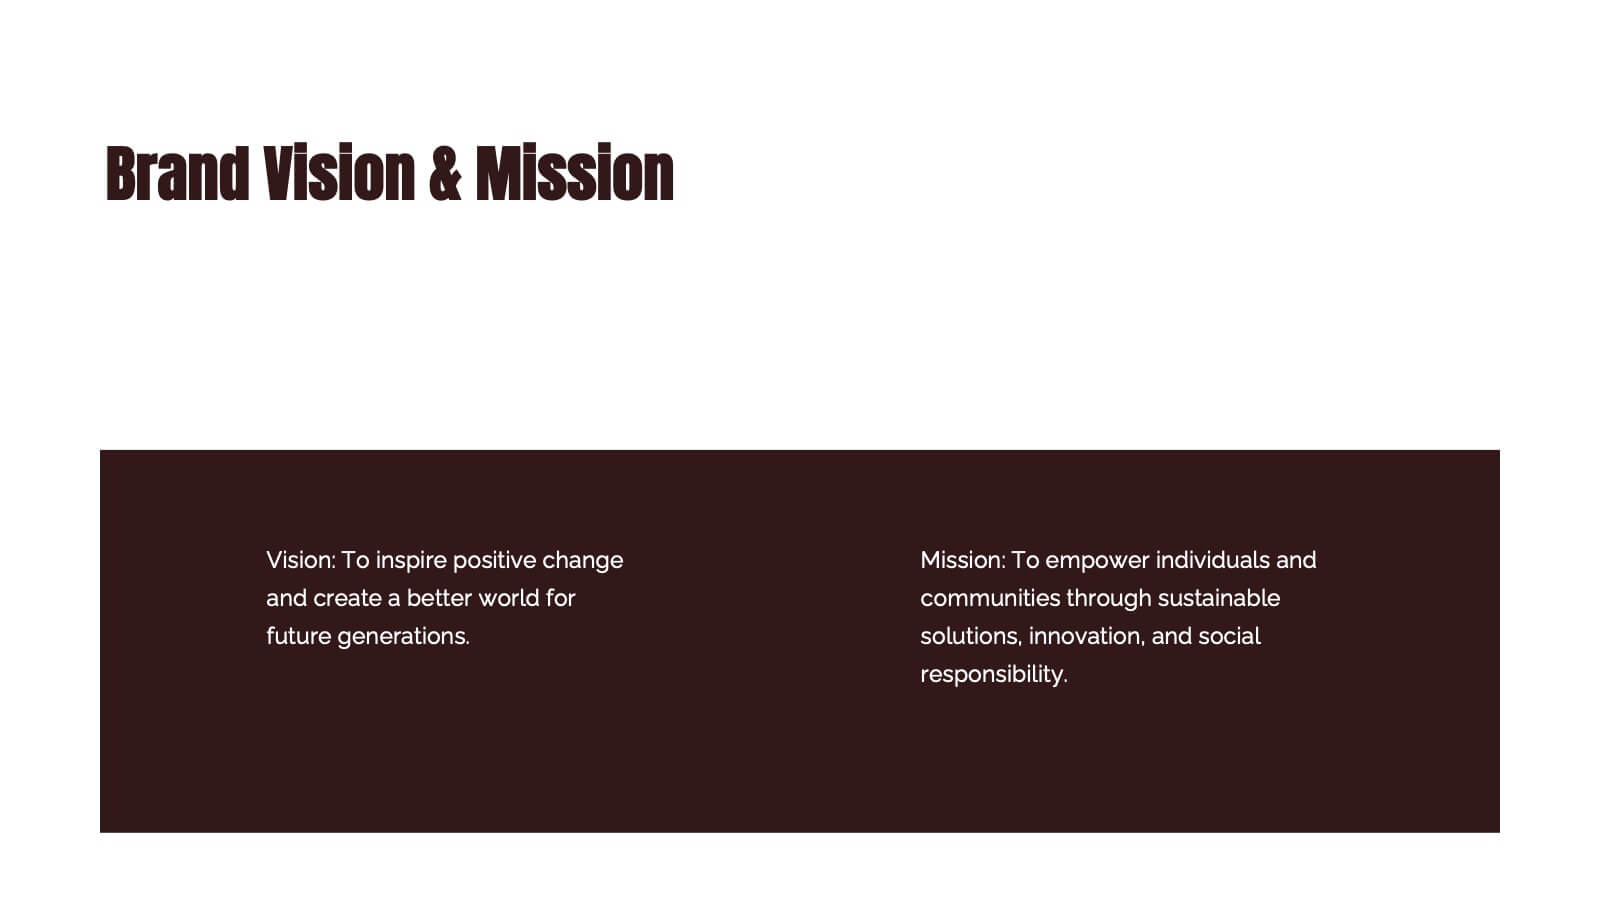
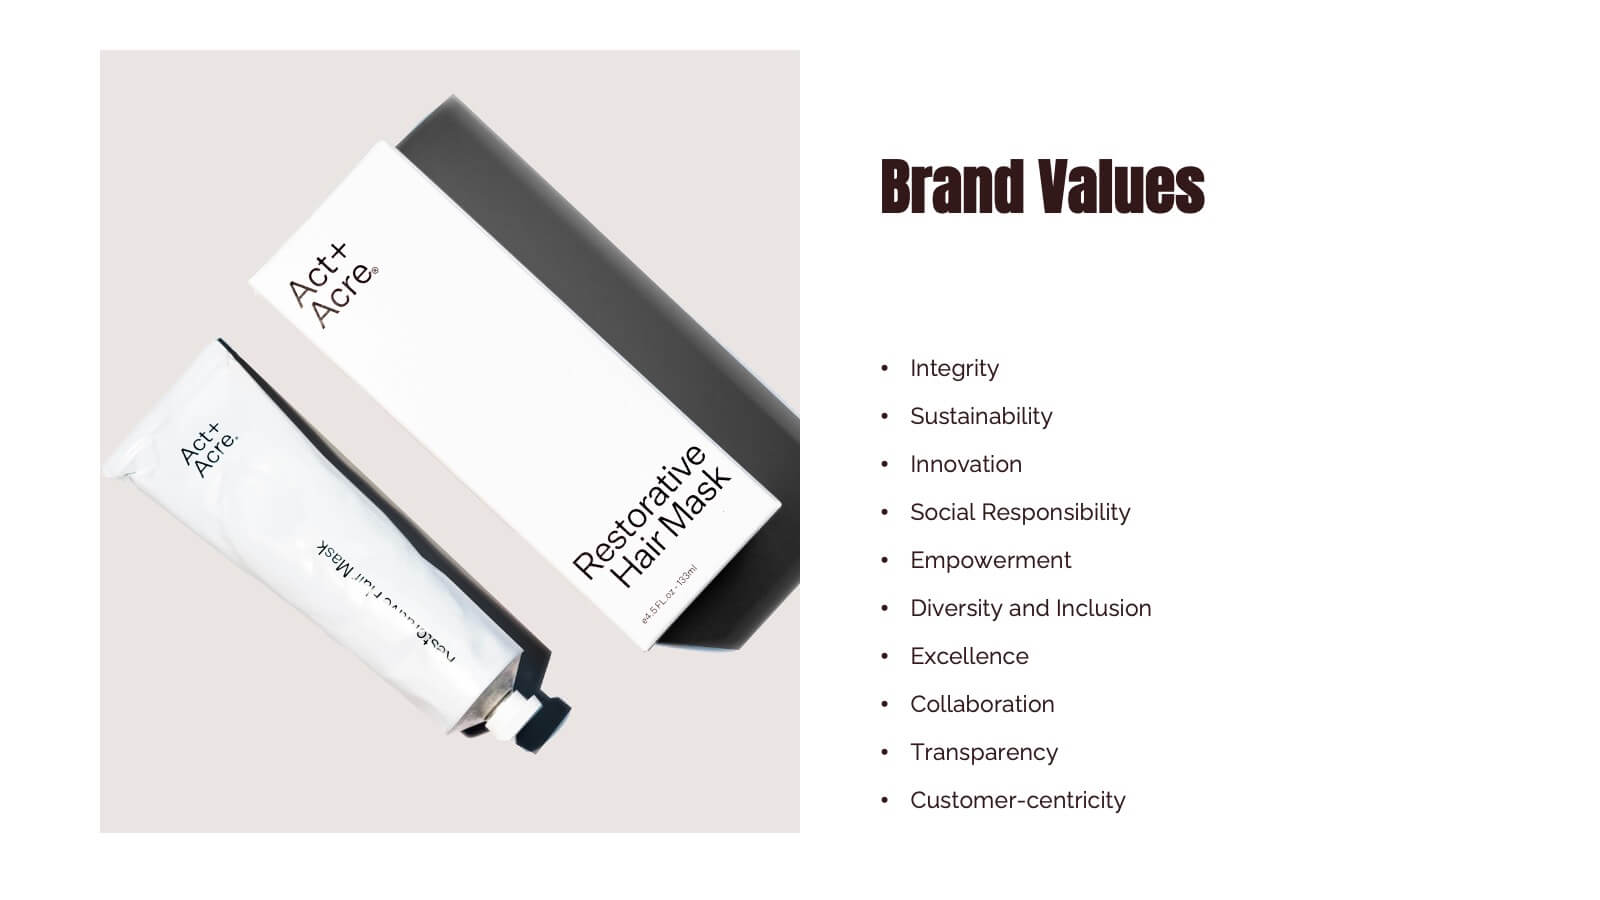
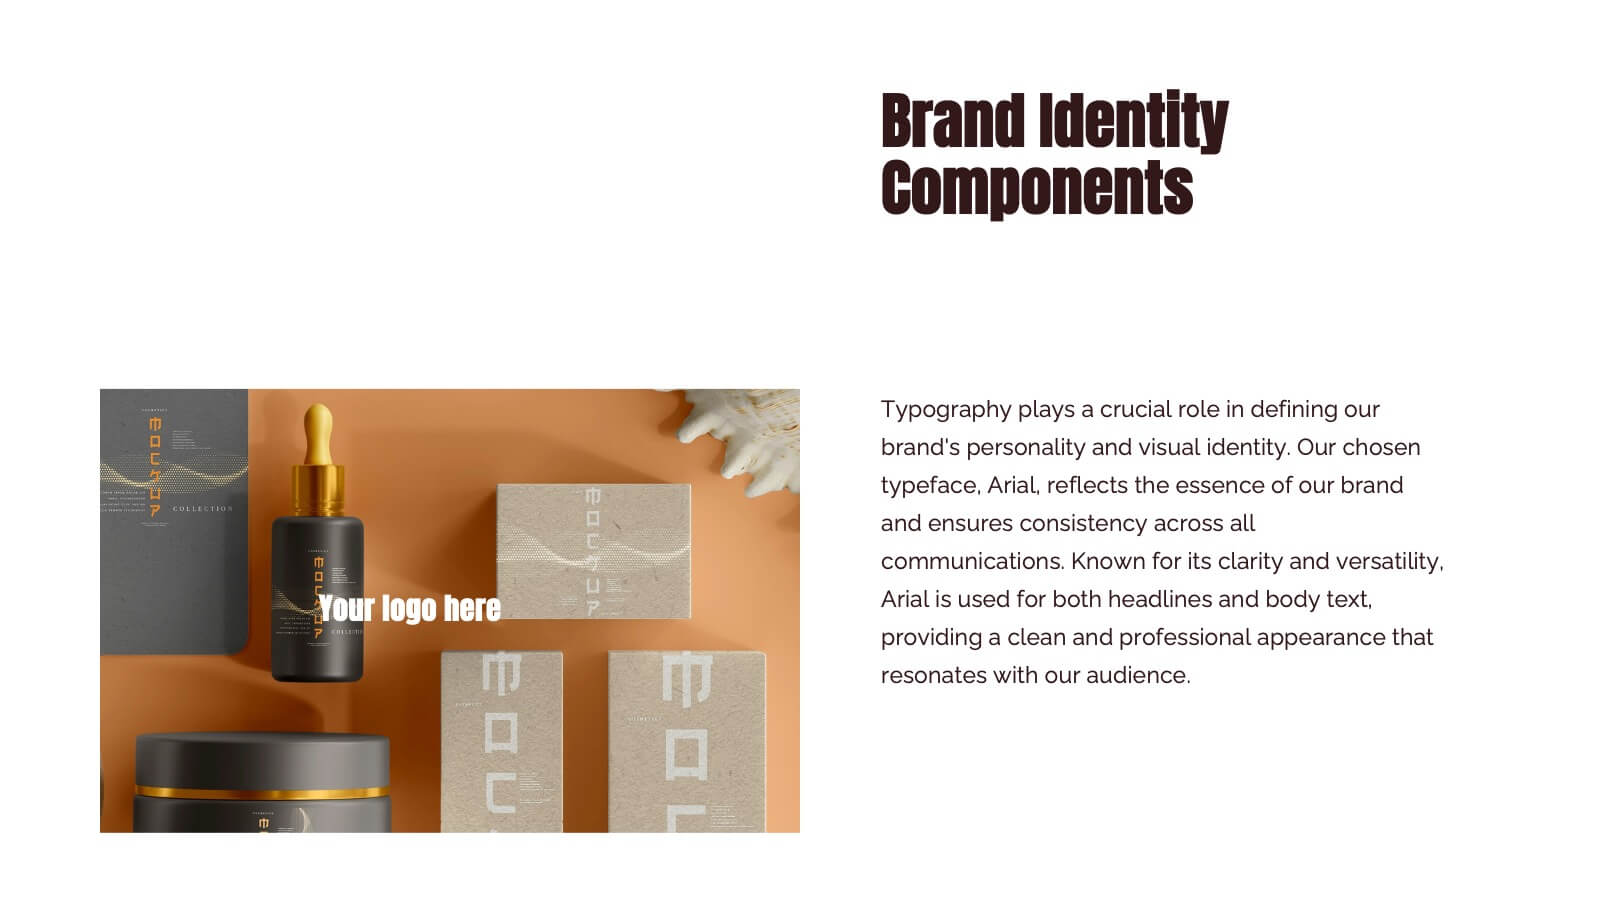
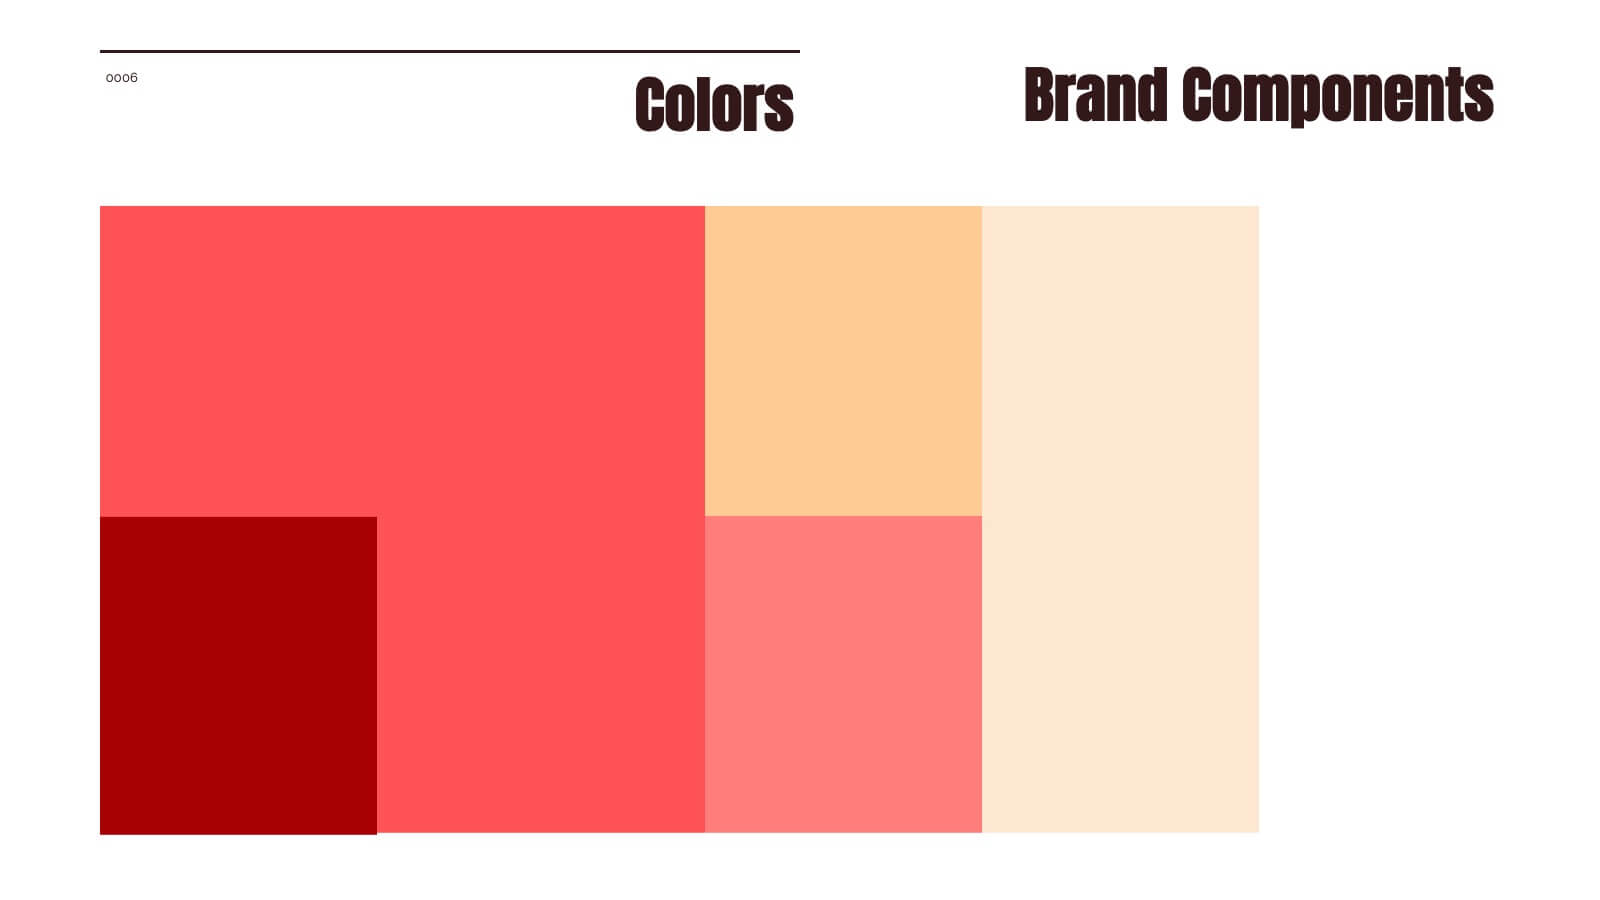
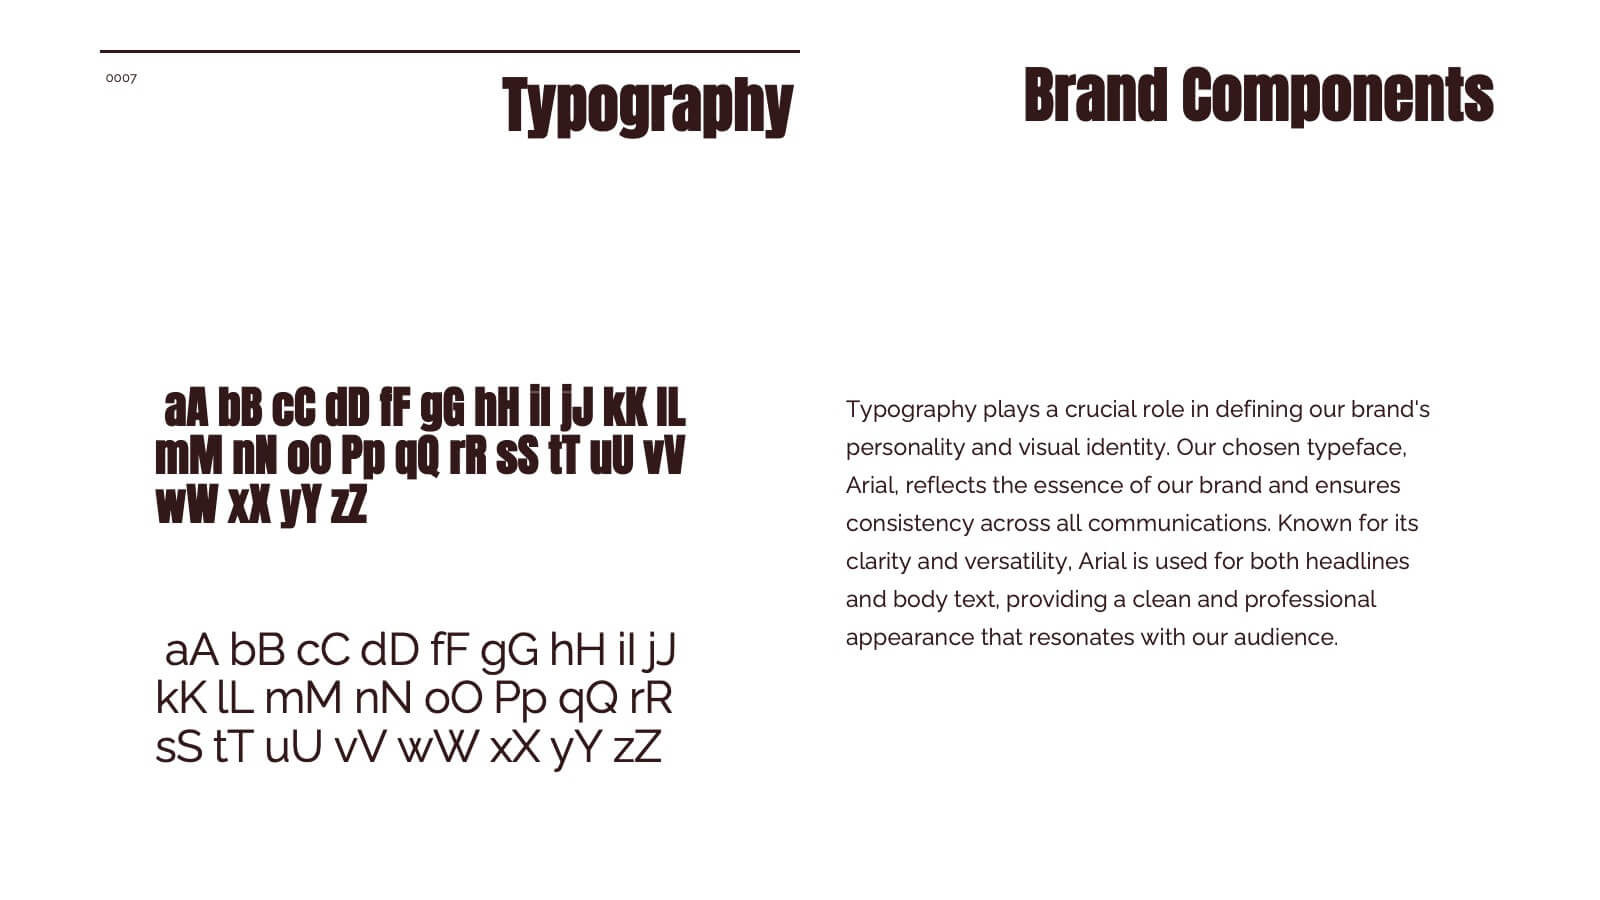
Blaze Brand Identity Presentation
Ignite your brand's potential with this vibrant, blaze-inspired presentation! Ideal for showcasing your brand identity, this template highlights key elements like logo design, color palette, and brand messaging with bold visuals and a modern layout. Perfect for making your brand stand out. Compatible with PowerPoint, Keynote, and Google Slides.


22 diapositivas
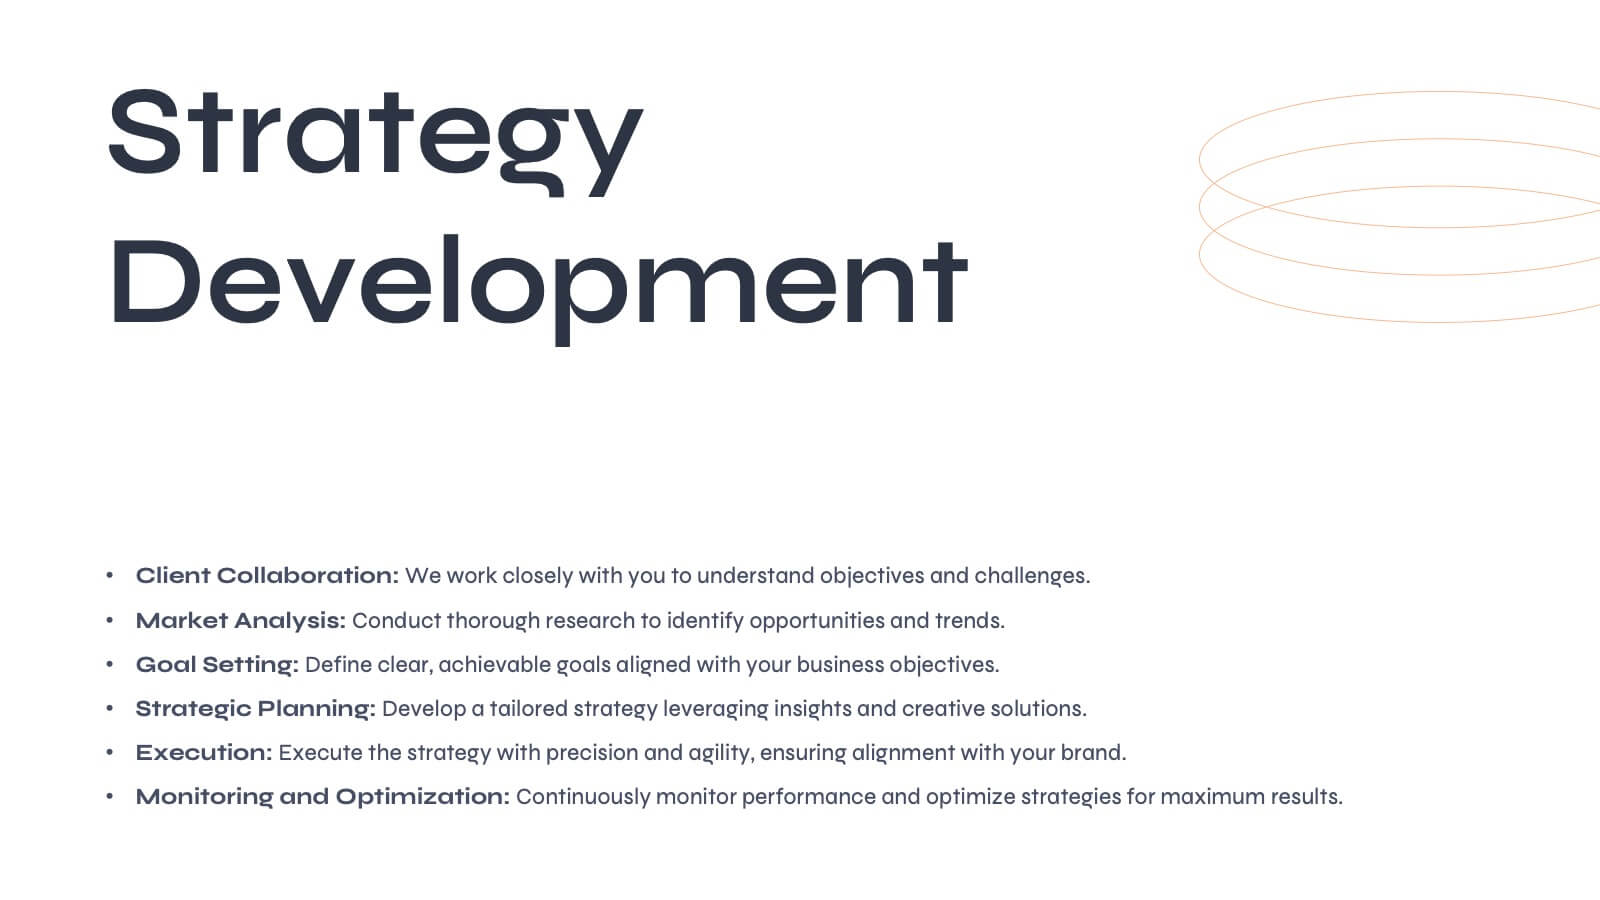
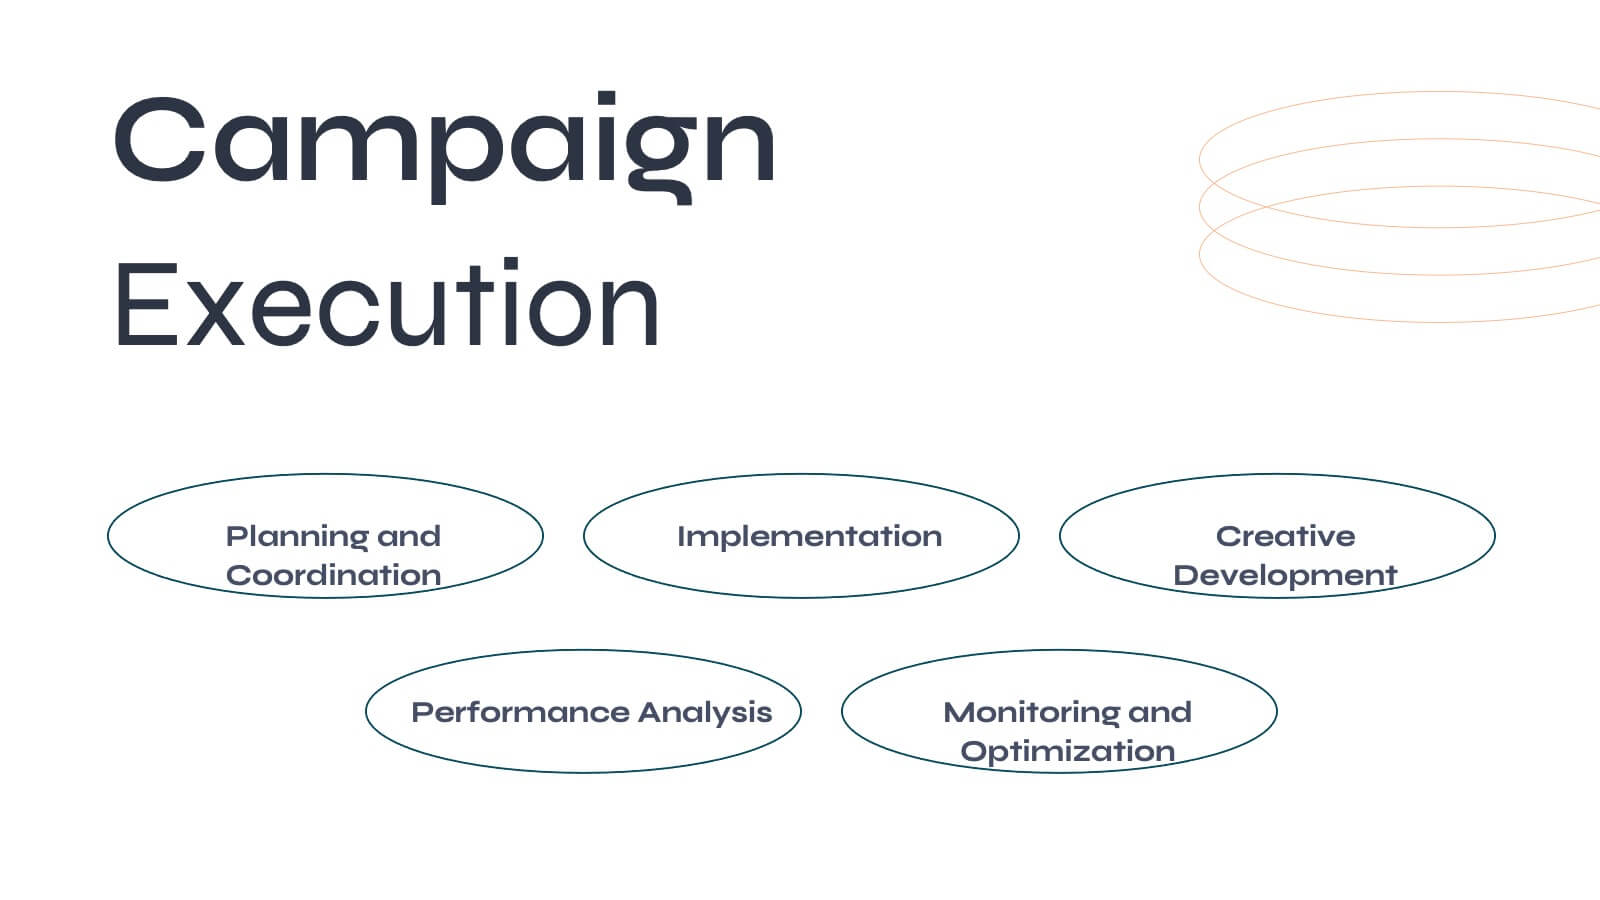
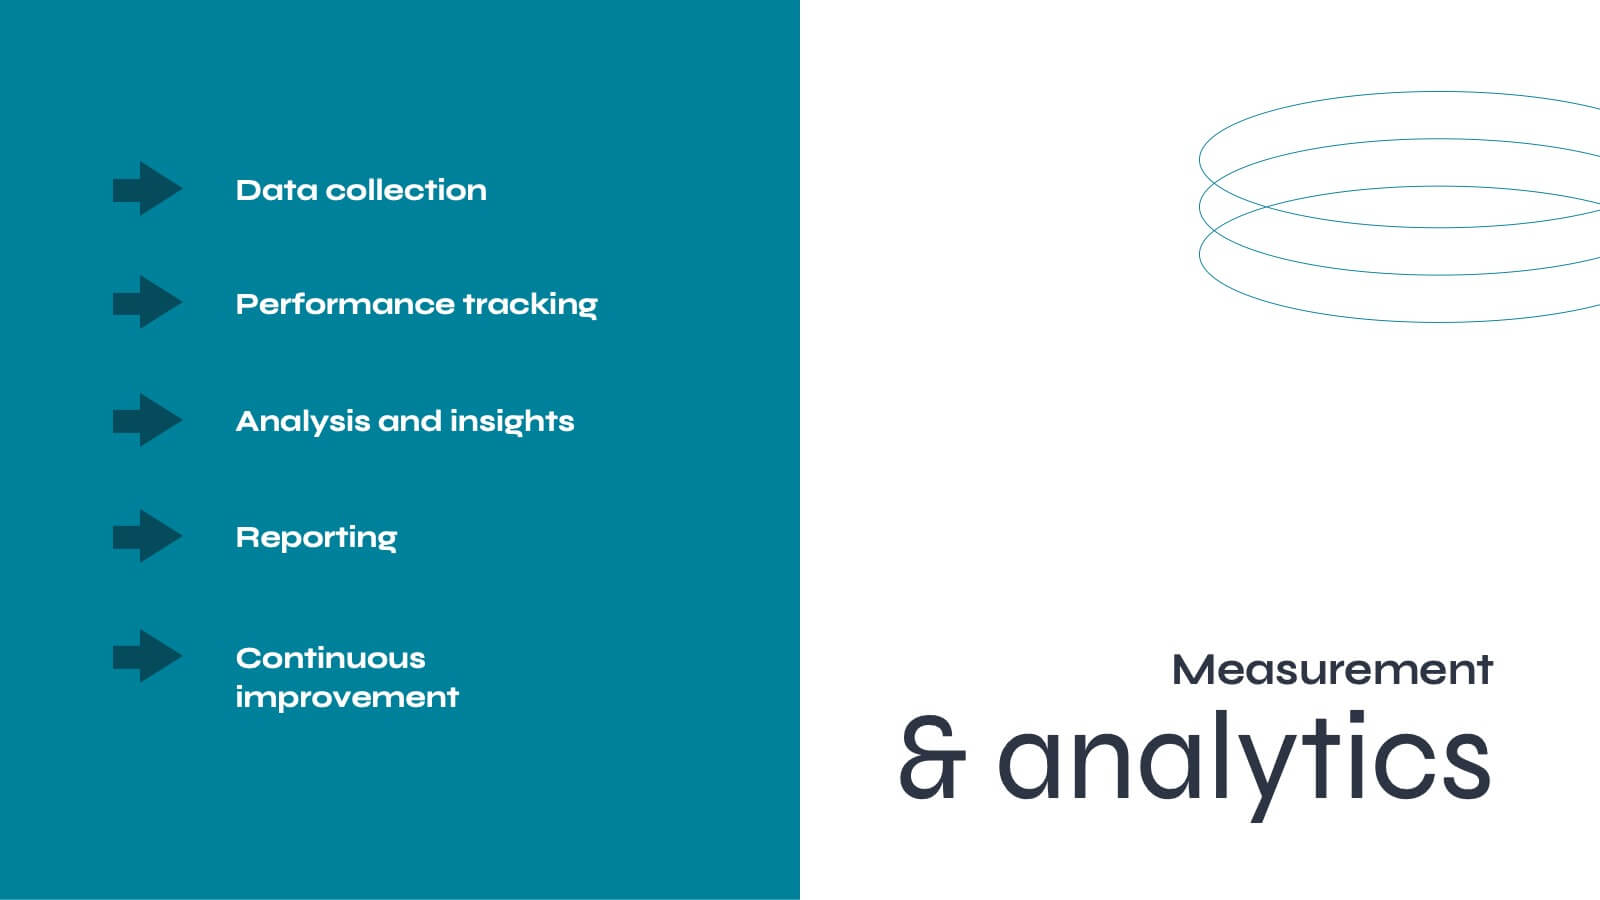
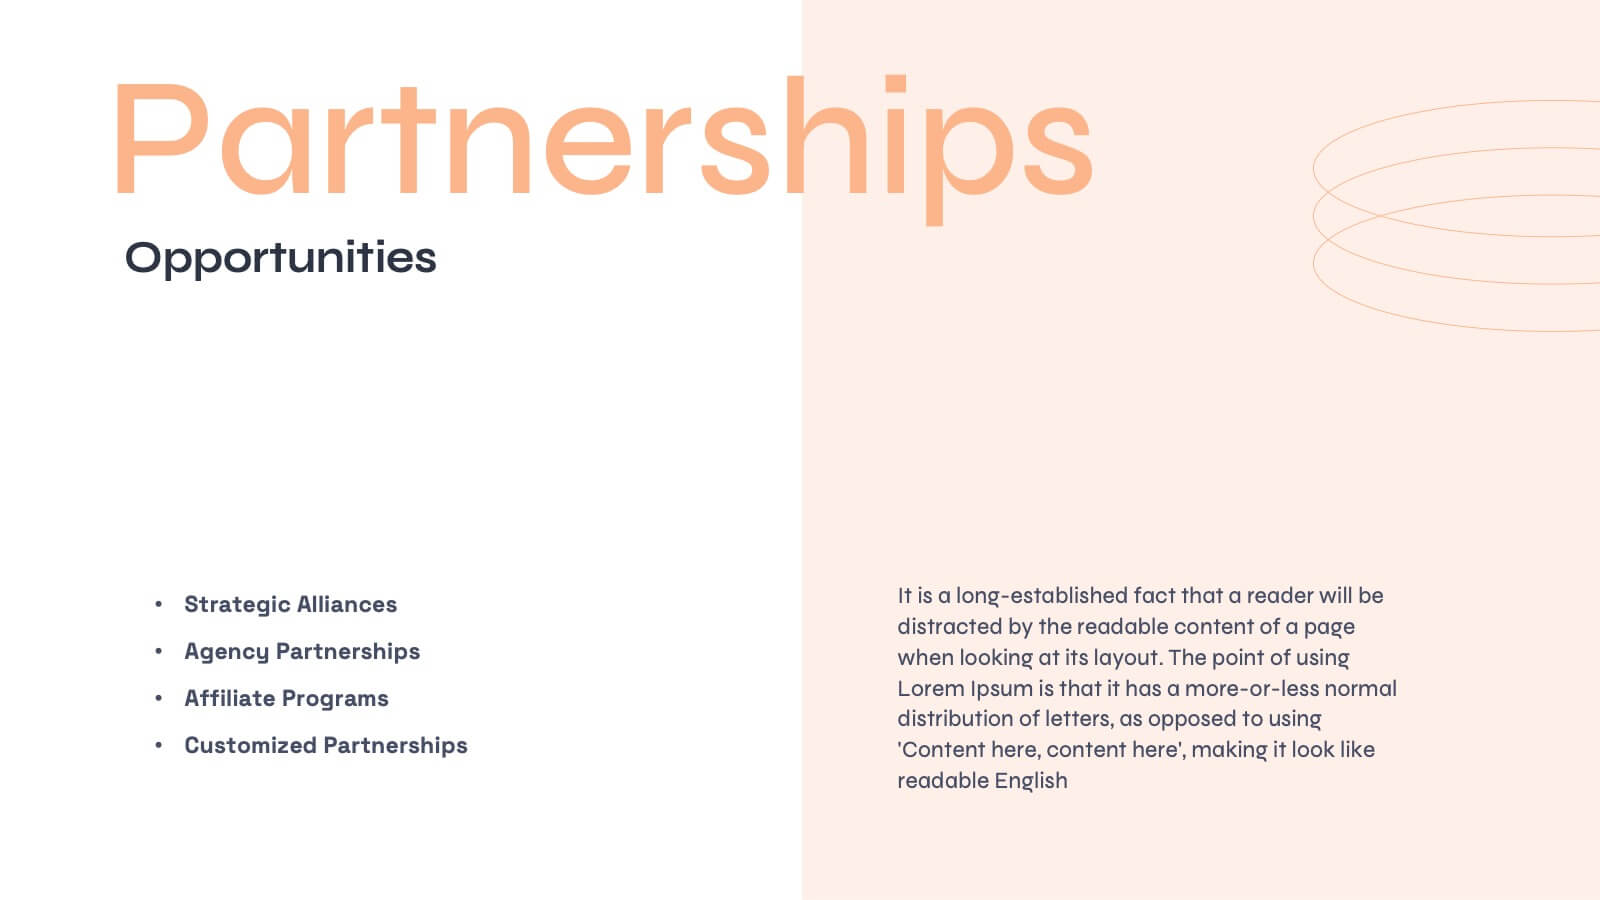
Helioshift Advertising Agency Proposal Presentation
Win clients and showcase your agency’s strengths with a compelling proposal! This presentation highlights sections like case studies, services, team structure, and market trends, ensuring a clear strategy to impress potential partners. Designed for both internal planning and client presentations, it’s fully compatible with PowerPoint, Keynote, and Google Slides.


6 diapositivas
Isometric 3D Elements Presentation
Add depth and dimension to your ideas with this sleek 3D visual layout that transforms flat concepts into engaging graphics. Perfect for showing connected processes, stages, or data structures, it balances clarity with creativity. Fully editable and compatible with PowerPoint, Keynote, and Google Slides for effortless customization.


10 diapositivas
Water Resource Management Presentation
Present your strategy with this clean and modern Water Resource Management slide. Featuring droplet graphics and percentage visuals, it's ideal for showcasing water usage, sustainability goals, or conservation data. Easily customizable with titles, icons, and insights. Compatible with PowerPoint, Keynote, and Google Slides for seamless editing.


22 diapositivas
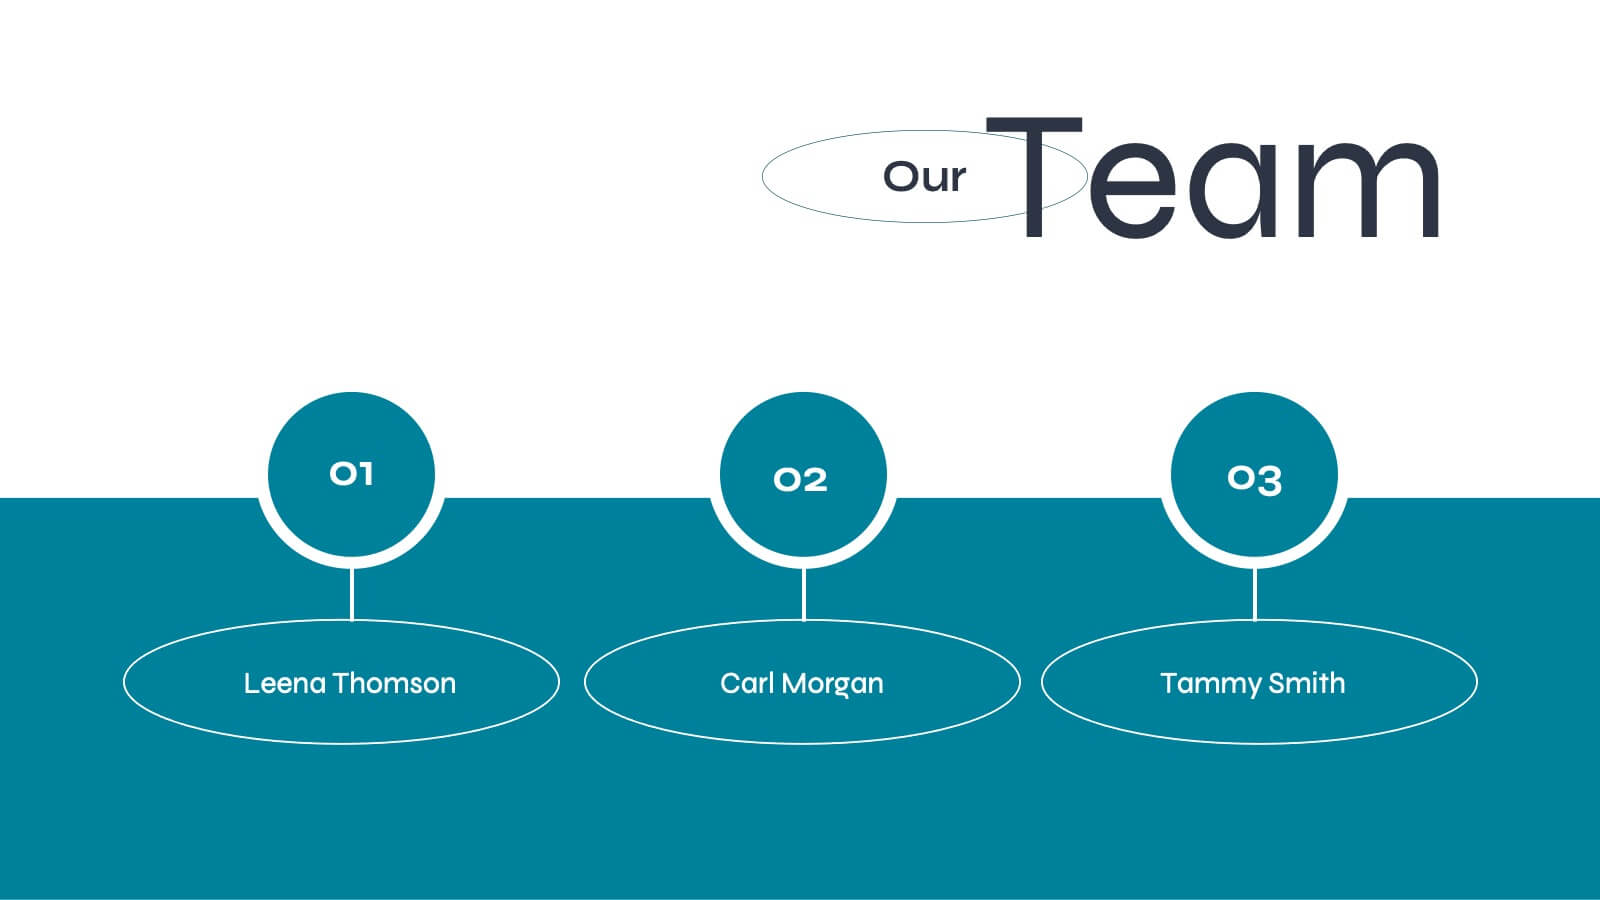
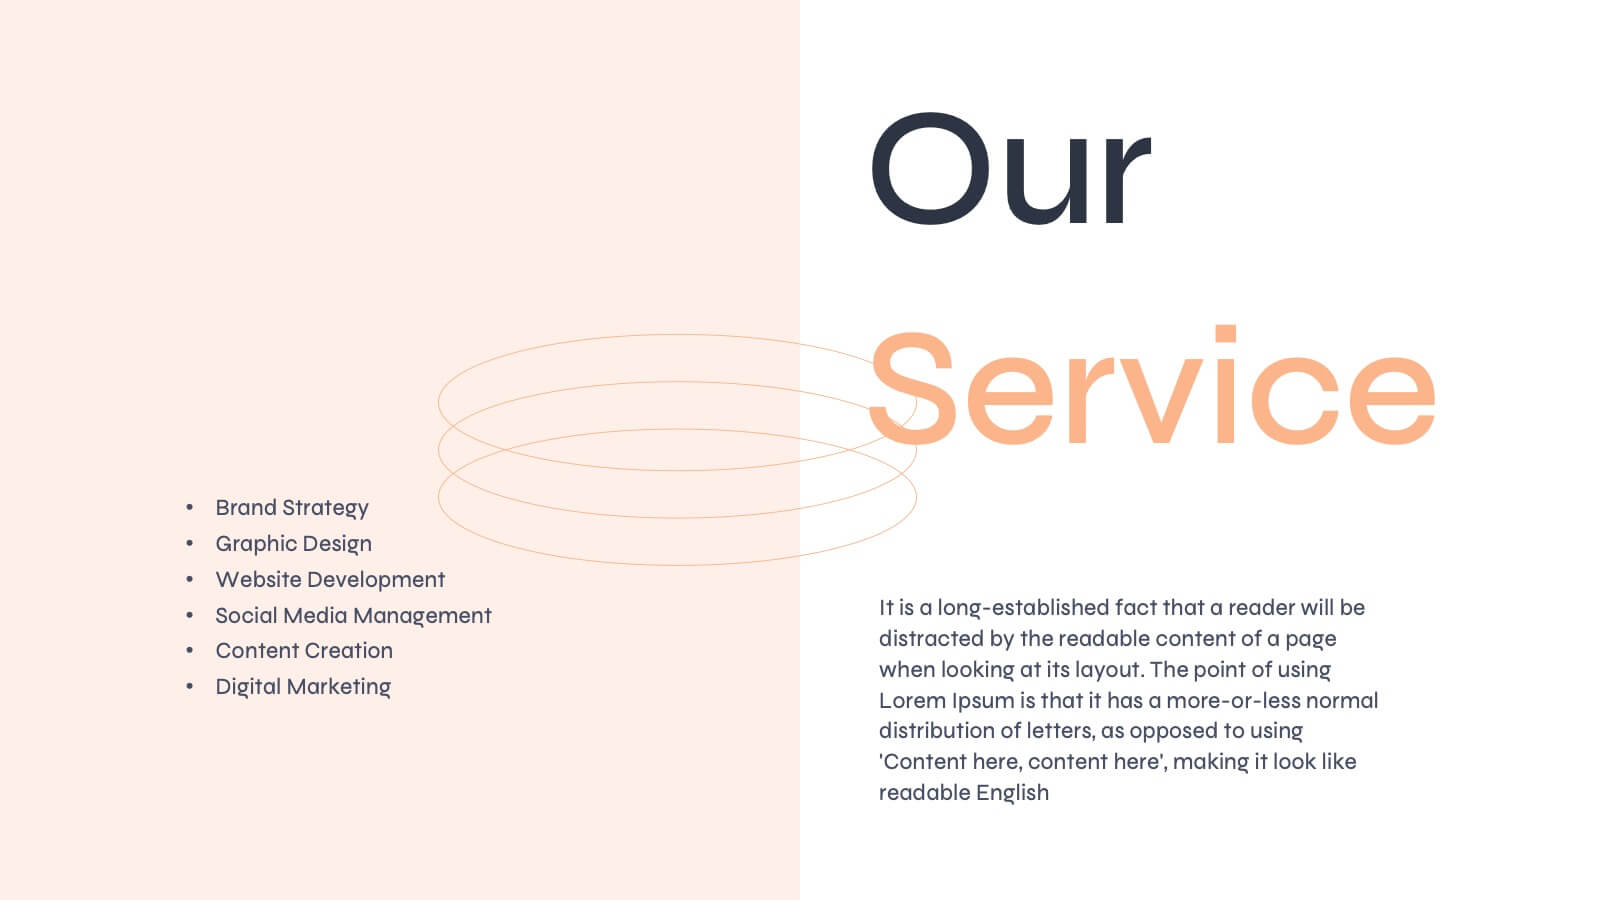
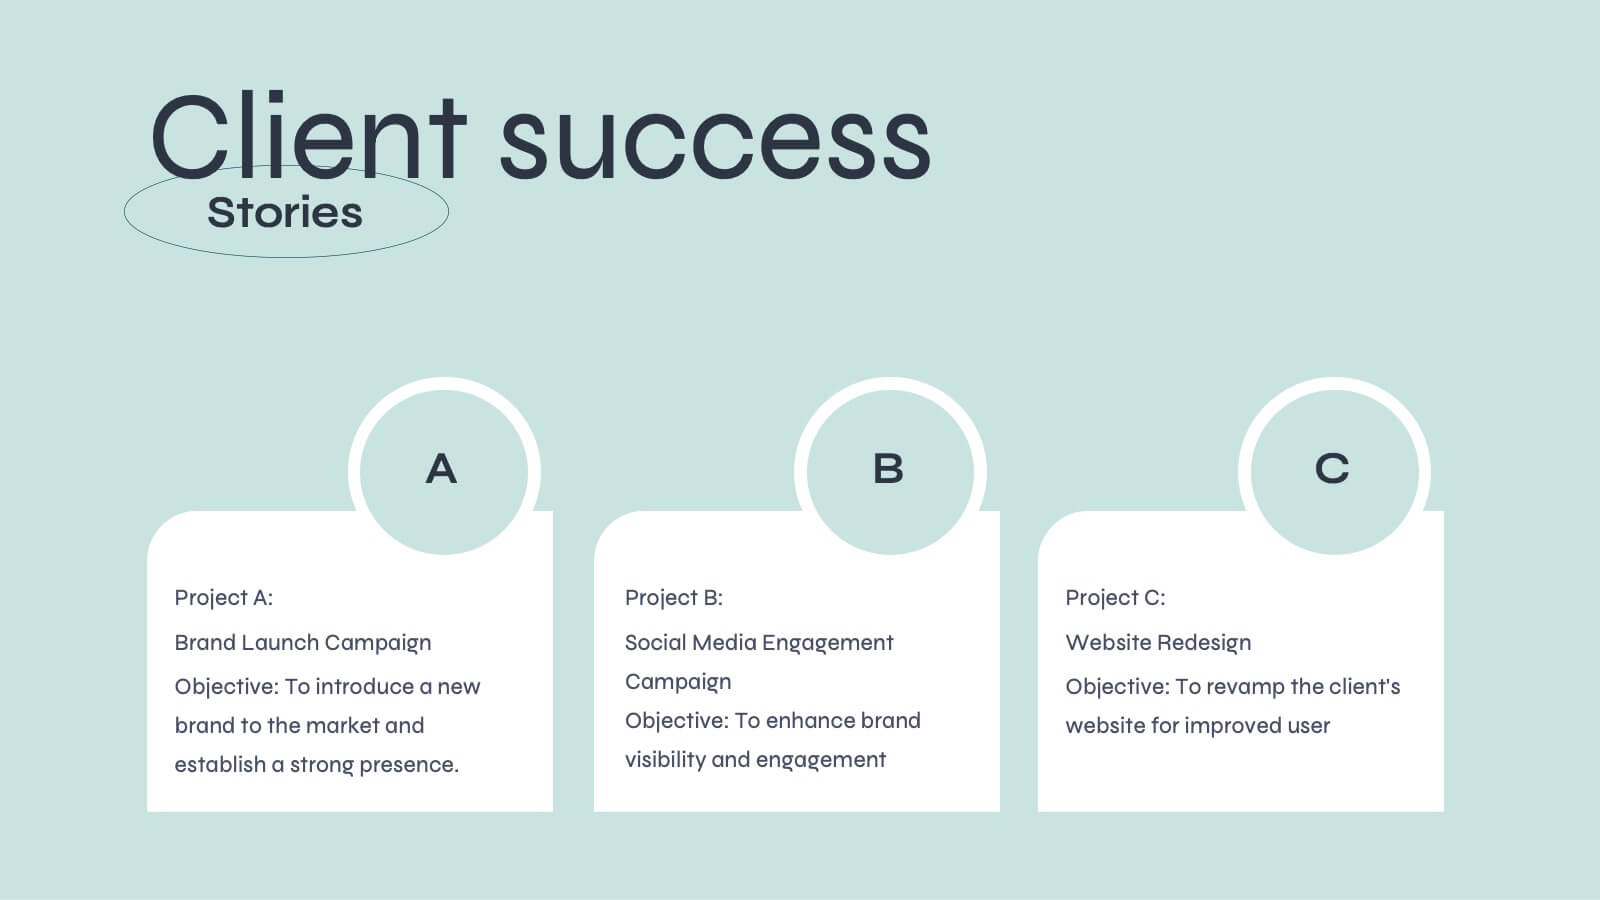
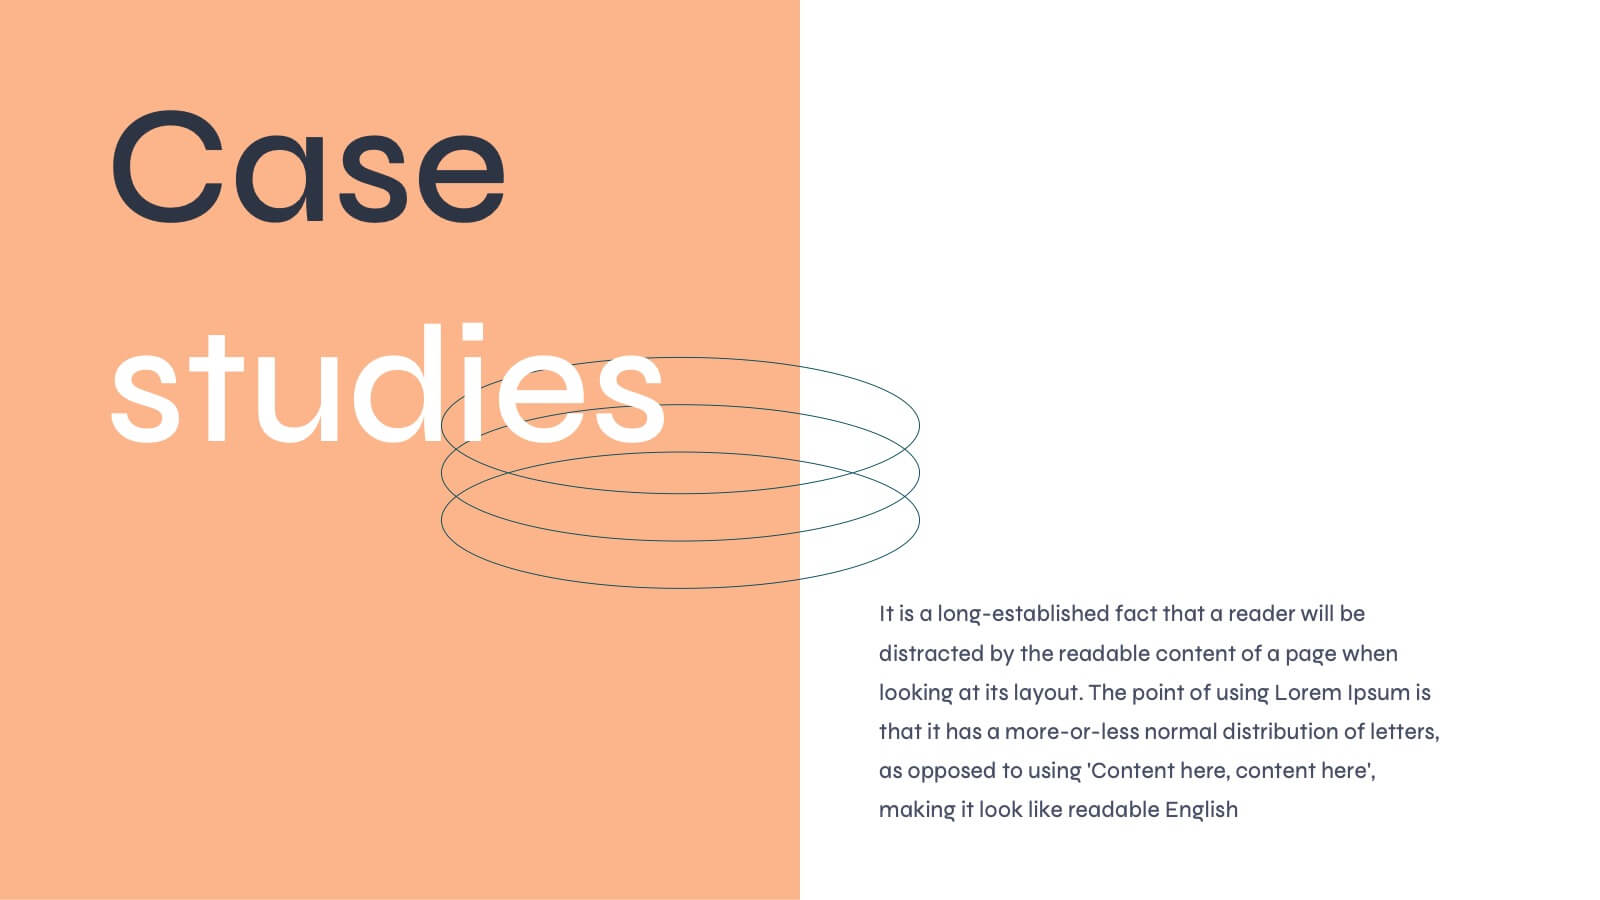
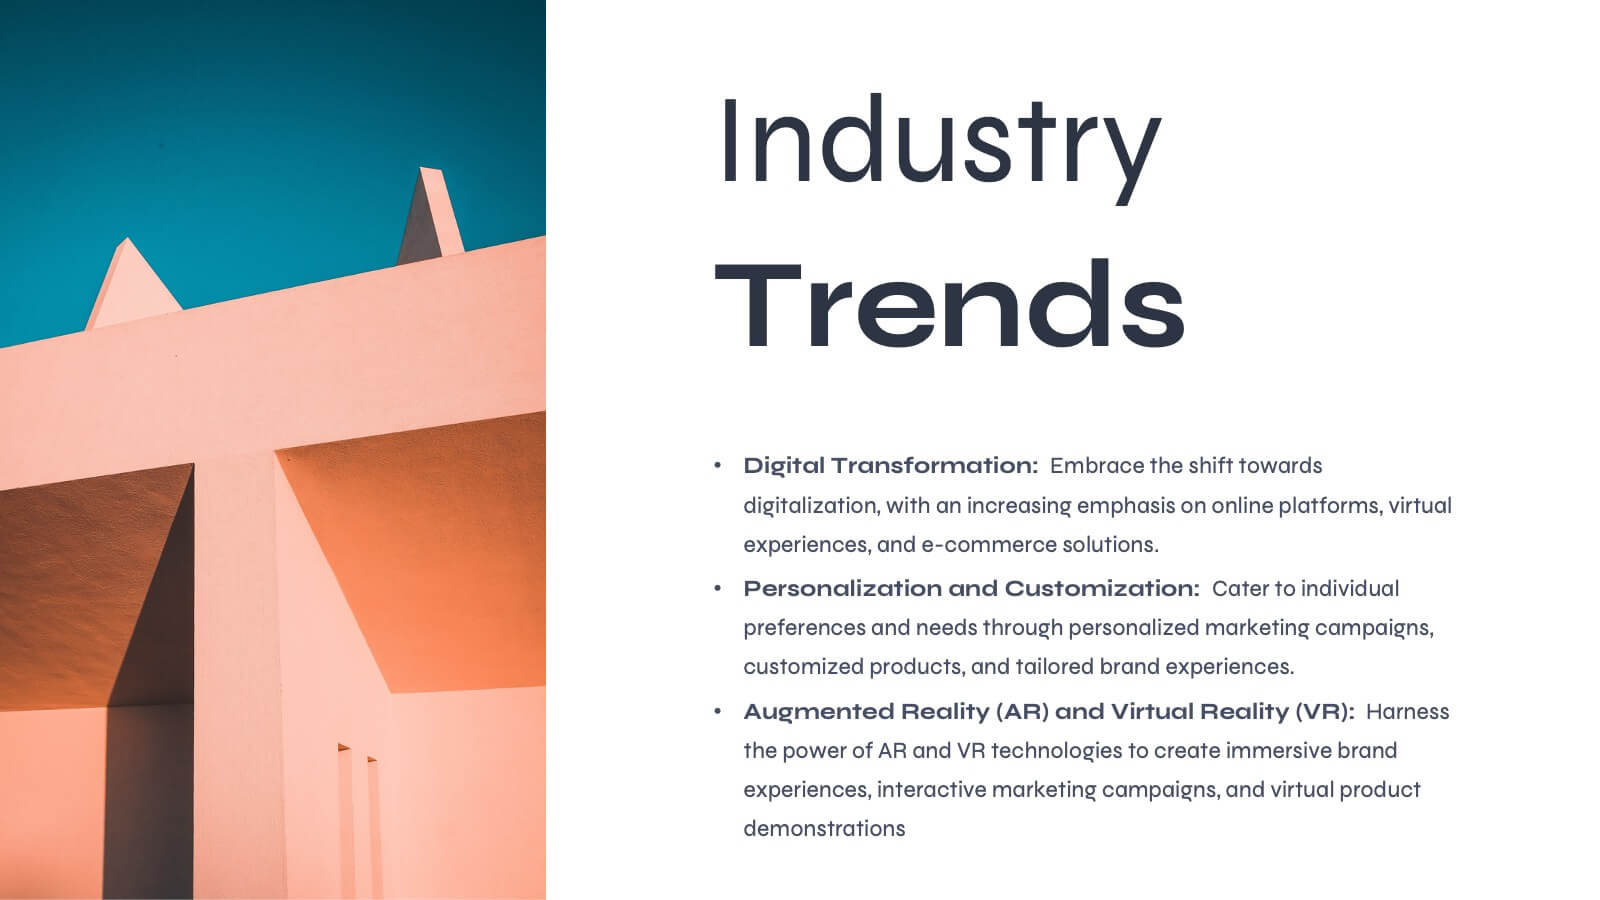
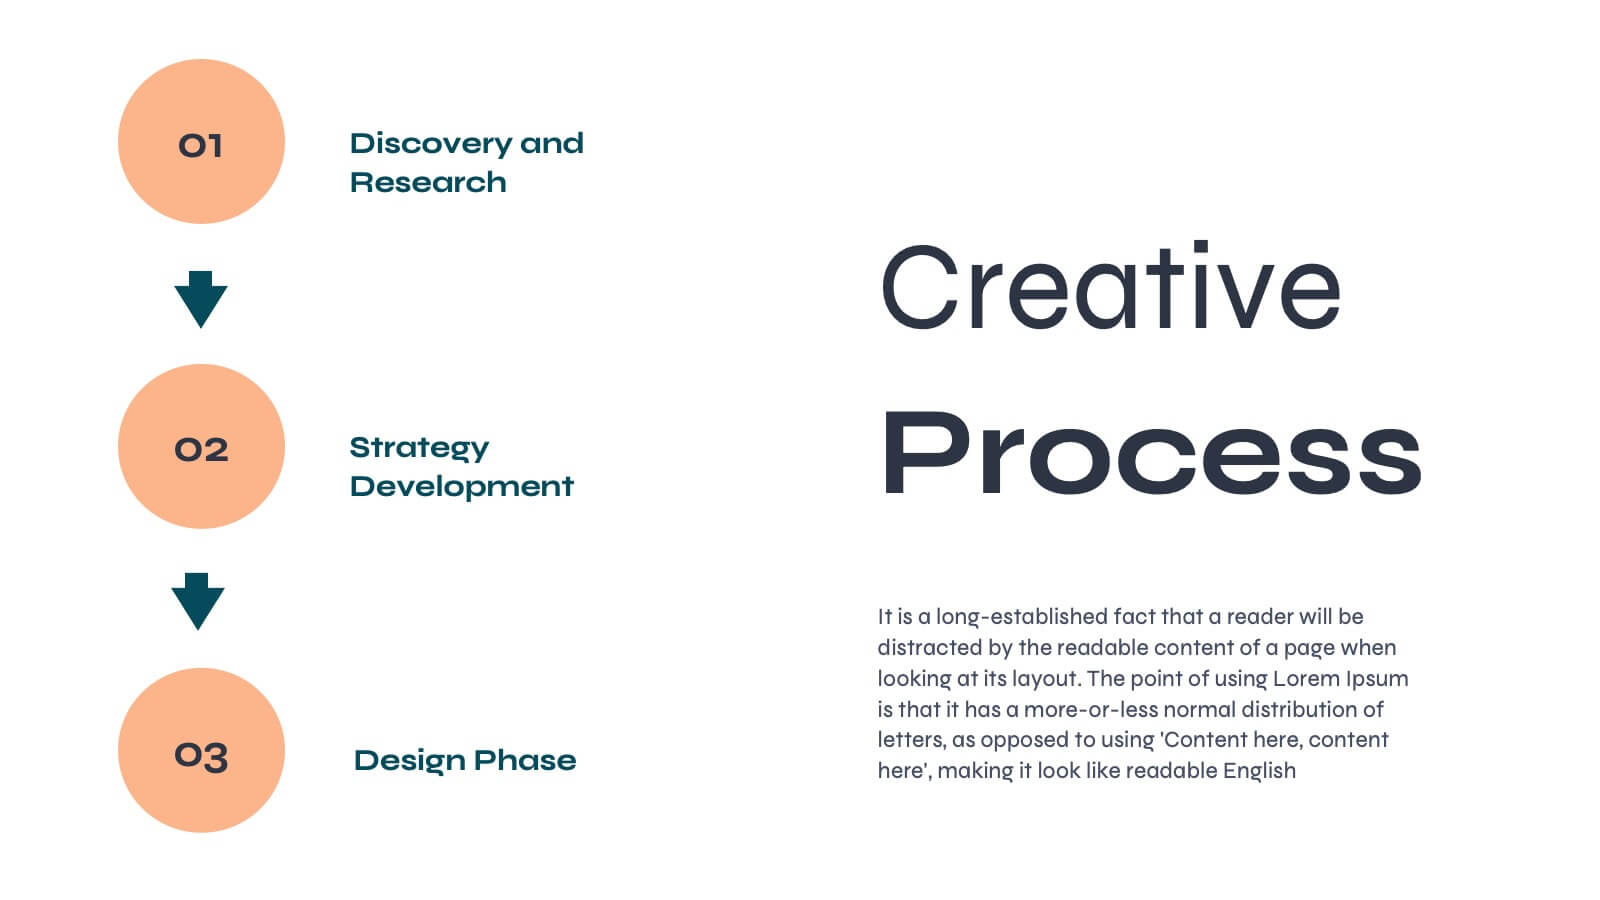
Aurora Agency Portfolio Presentation
Showcase your agency's strengths with this polished, modern presentation template. Perfect for presenting market analysis, client success stories, and creative processes, it features a clean and professional design. Highlight your team's expertise and strategic approach to impress potential clients. Compatible with PowerPoint, Keynote, and Google Slides, it ensures seamless presentations on any platform.


7 diapositivas
Medical Center Infographic
A medical center, often referred to as a healthcare center, is a facility or establishment where a range of medical services and care are provided to individuals in need of medical attention. This infographic template is designed to provide a comprehensive overview of the medical center, emphasizing its services, healthcare professionals, facilities, patient satisfaction, and community engagement. This infographic is fully customizable and compatible with Powerpoint, Keynote, and Google Slides. Easily customize and design this to align with your specific medical center's brand and message.


6 diapositivas
Hierarchical Thought Flow Mind Map Presentation
Present your ideas with clarity using this Hierarchical Thought Flow Mind Map presentation. Designed for structured thinking, this layout displays six key concepts radiating from a central theme, making it ideal for workflows, strategies, or team roles. Fully editable in Canva, PowerPoint, and Google Slides for total customization.


10 diapositivas
5G Technology and Network Advancements Presentation
Showcase key milestones and trends in modern telecom evolution with this dynamic 5G network infographic. The slide features a clean, wave-like flow connecting five signal tower icons, perfect for outlining technological phases, speed upgrades, or infrastructure rollouts. Suitable for IT professionals, telecom analysts, and future-tech strategists. Fully customizable in PowerPoint, Keynote, and Google Slides.