


Características


¿Tienes alguna pregunta?
Recomendar


24 diapositivas
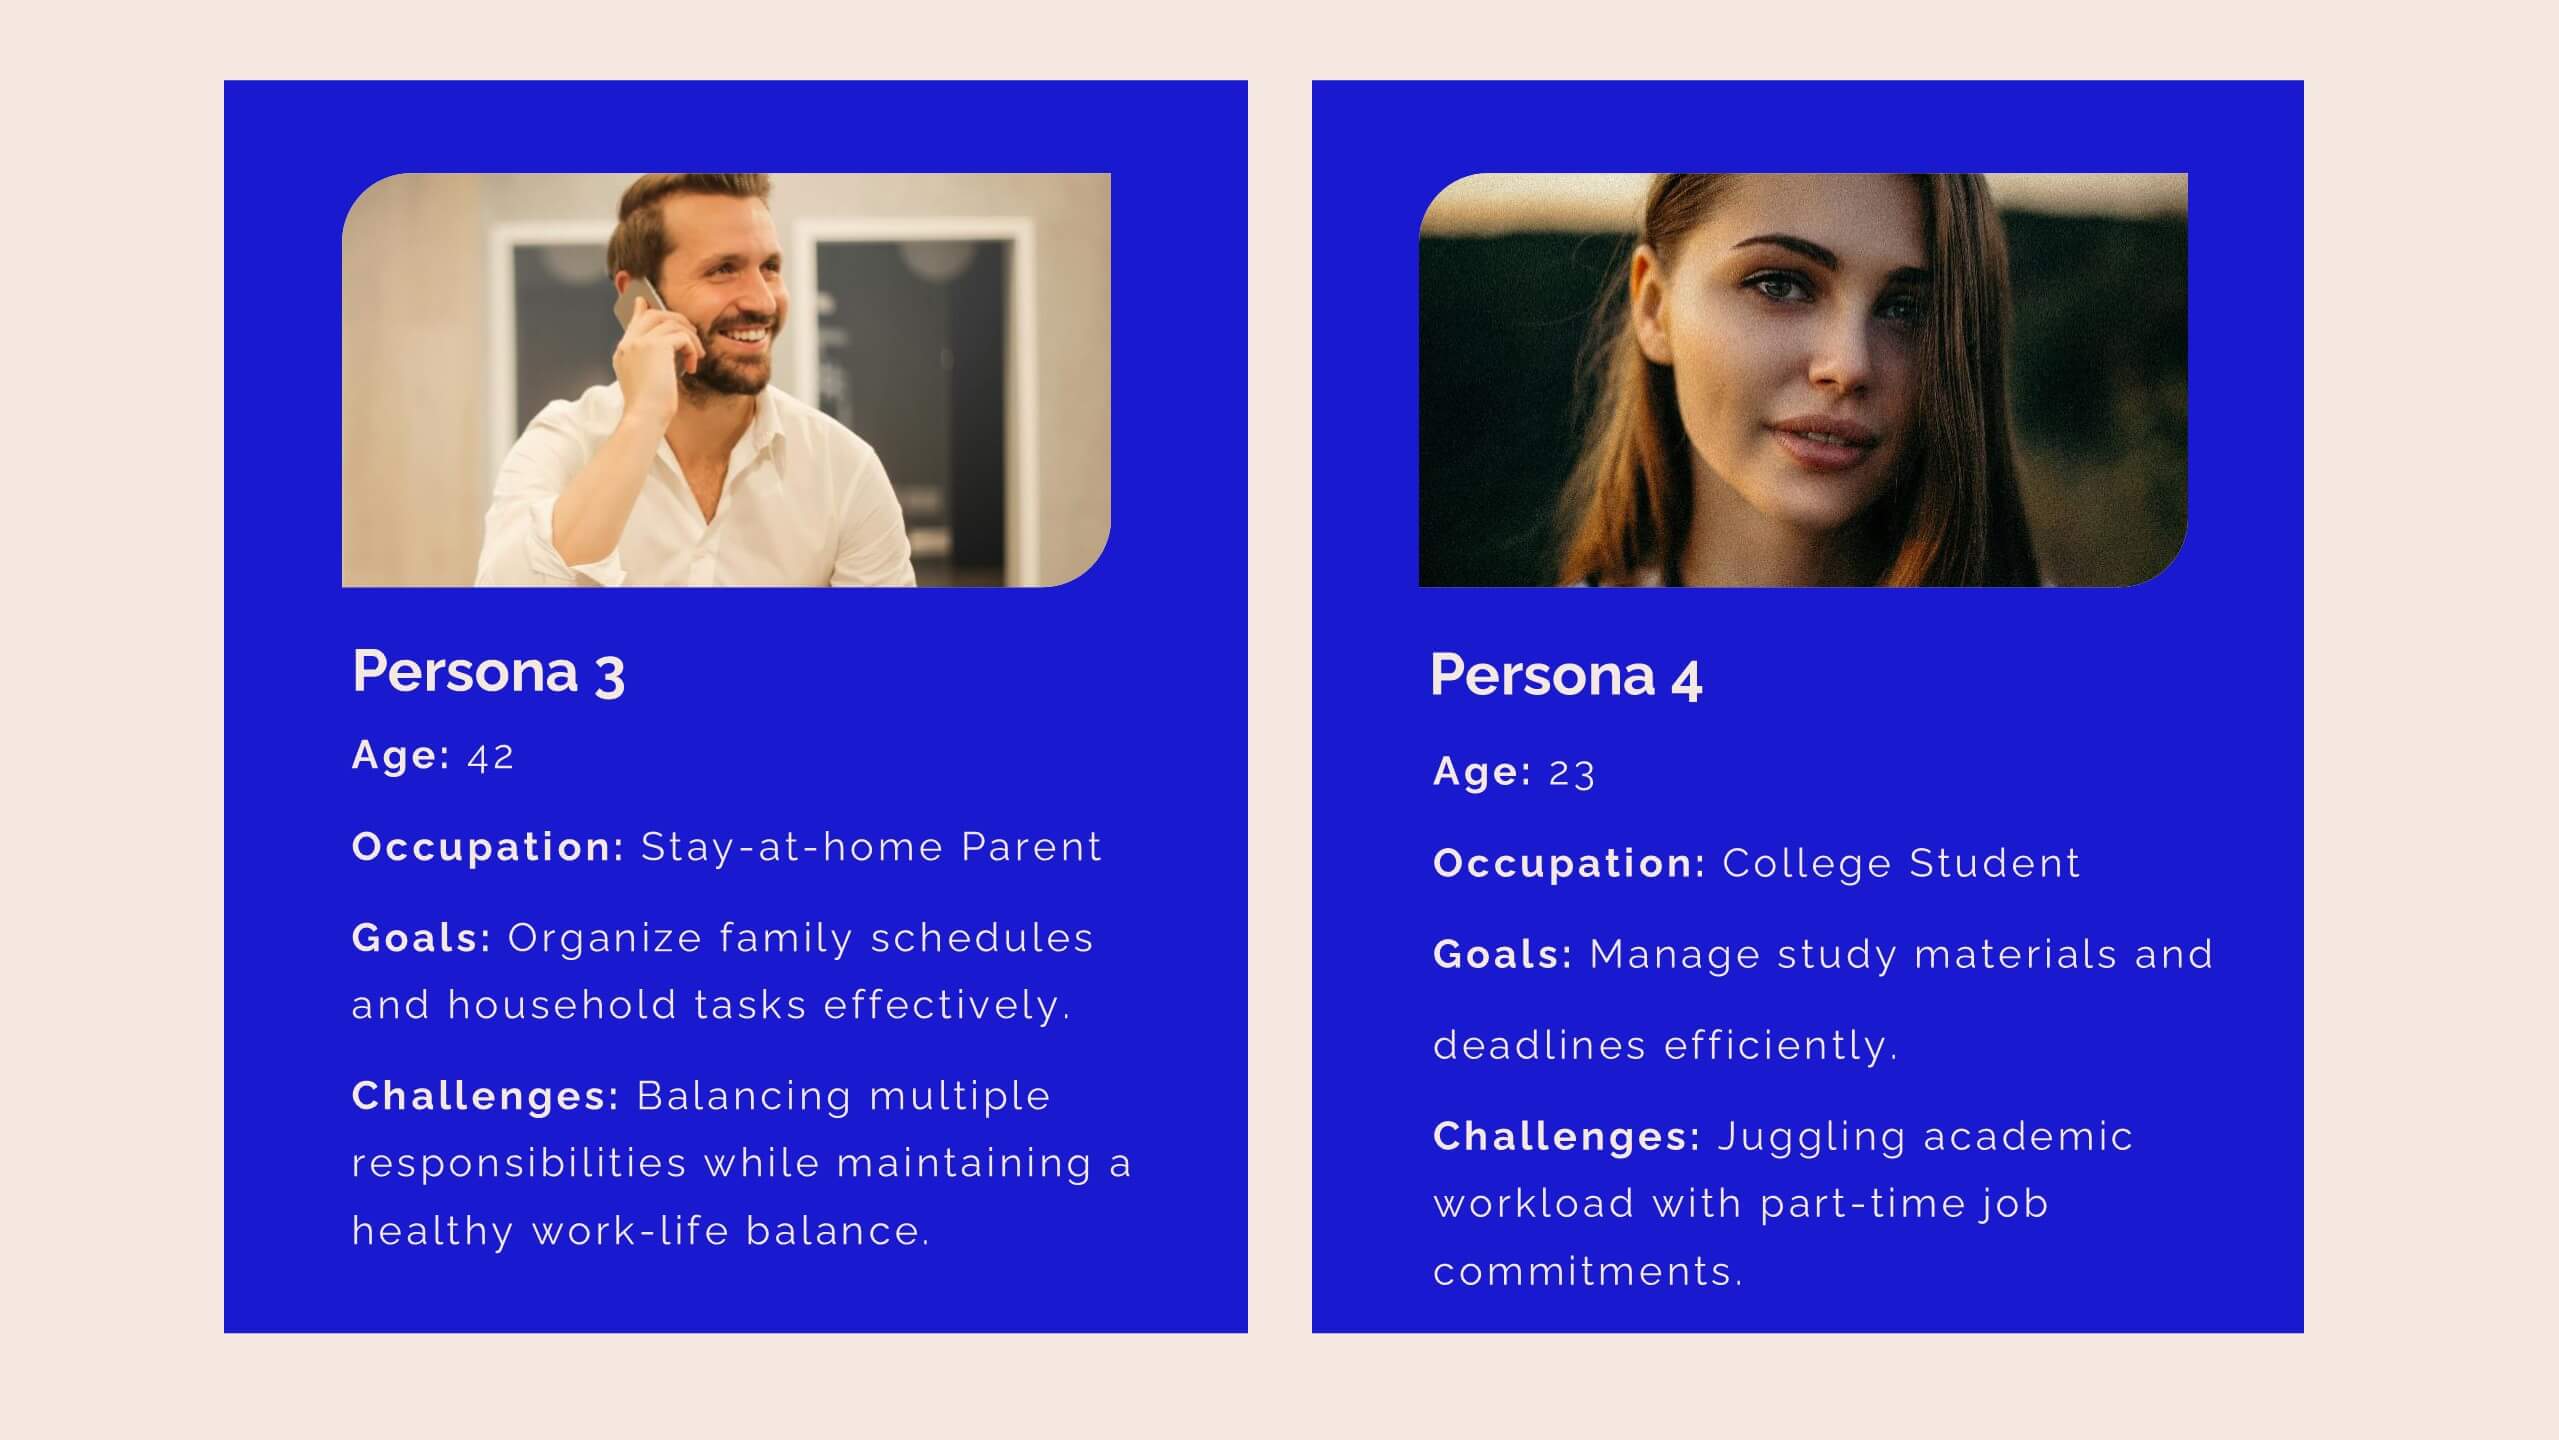
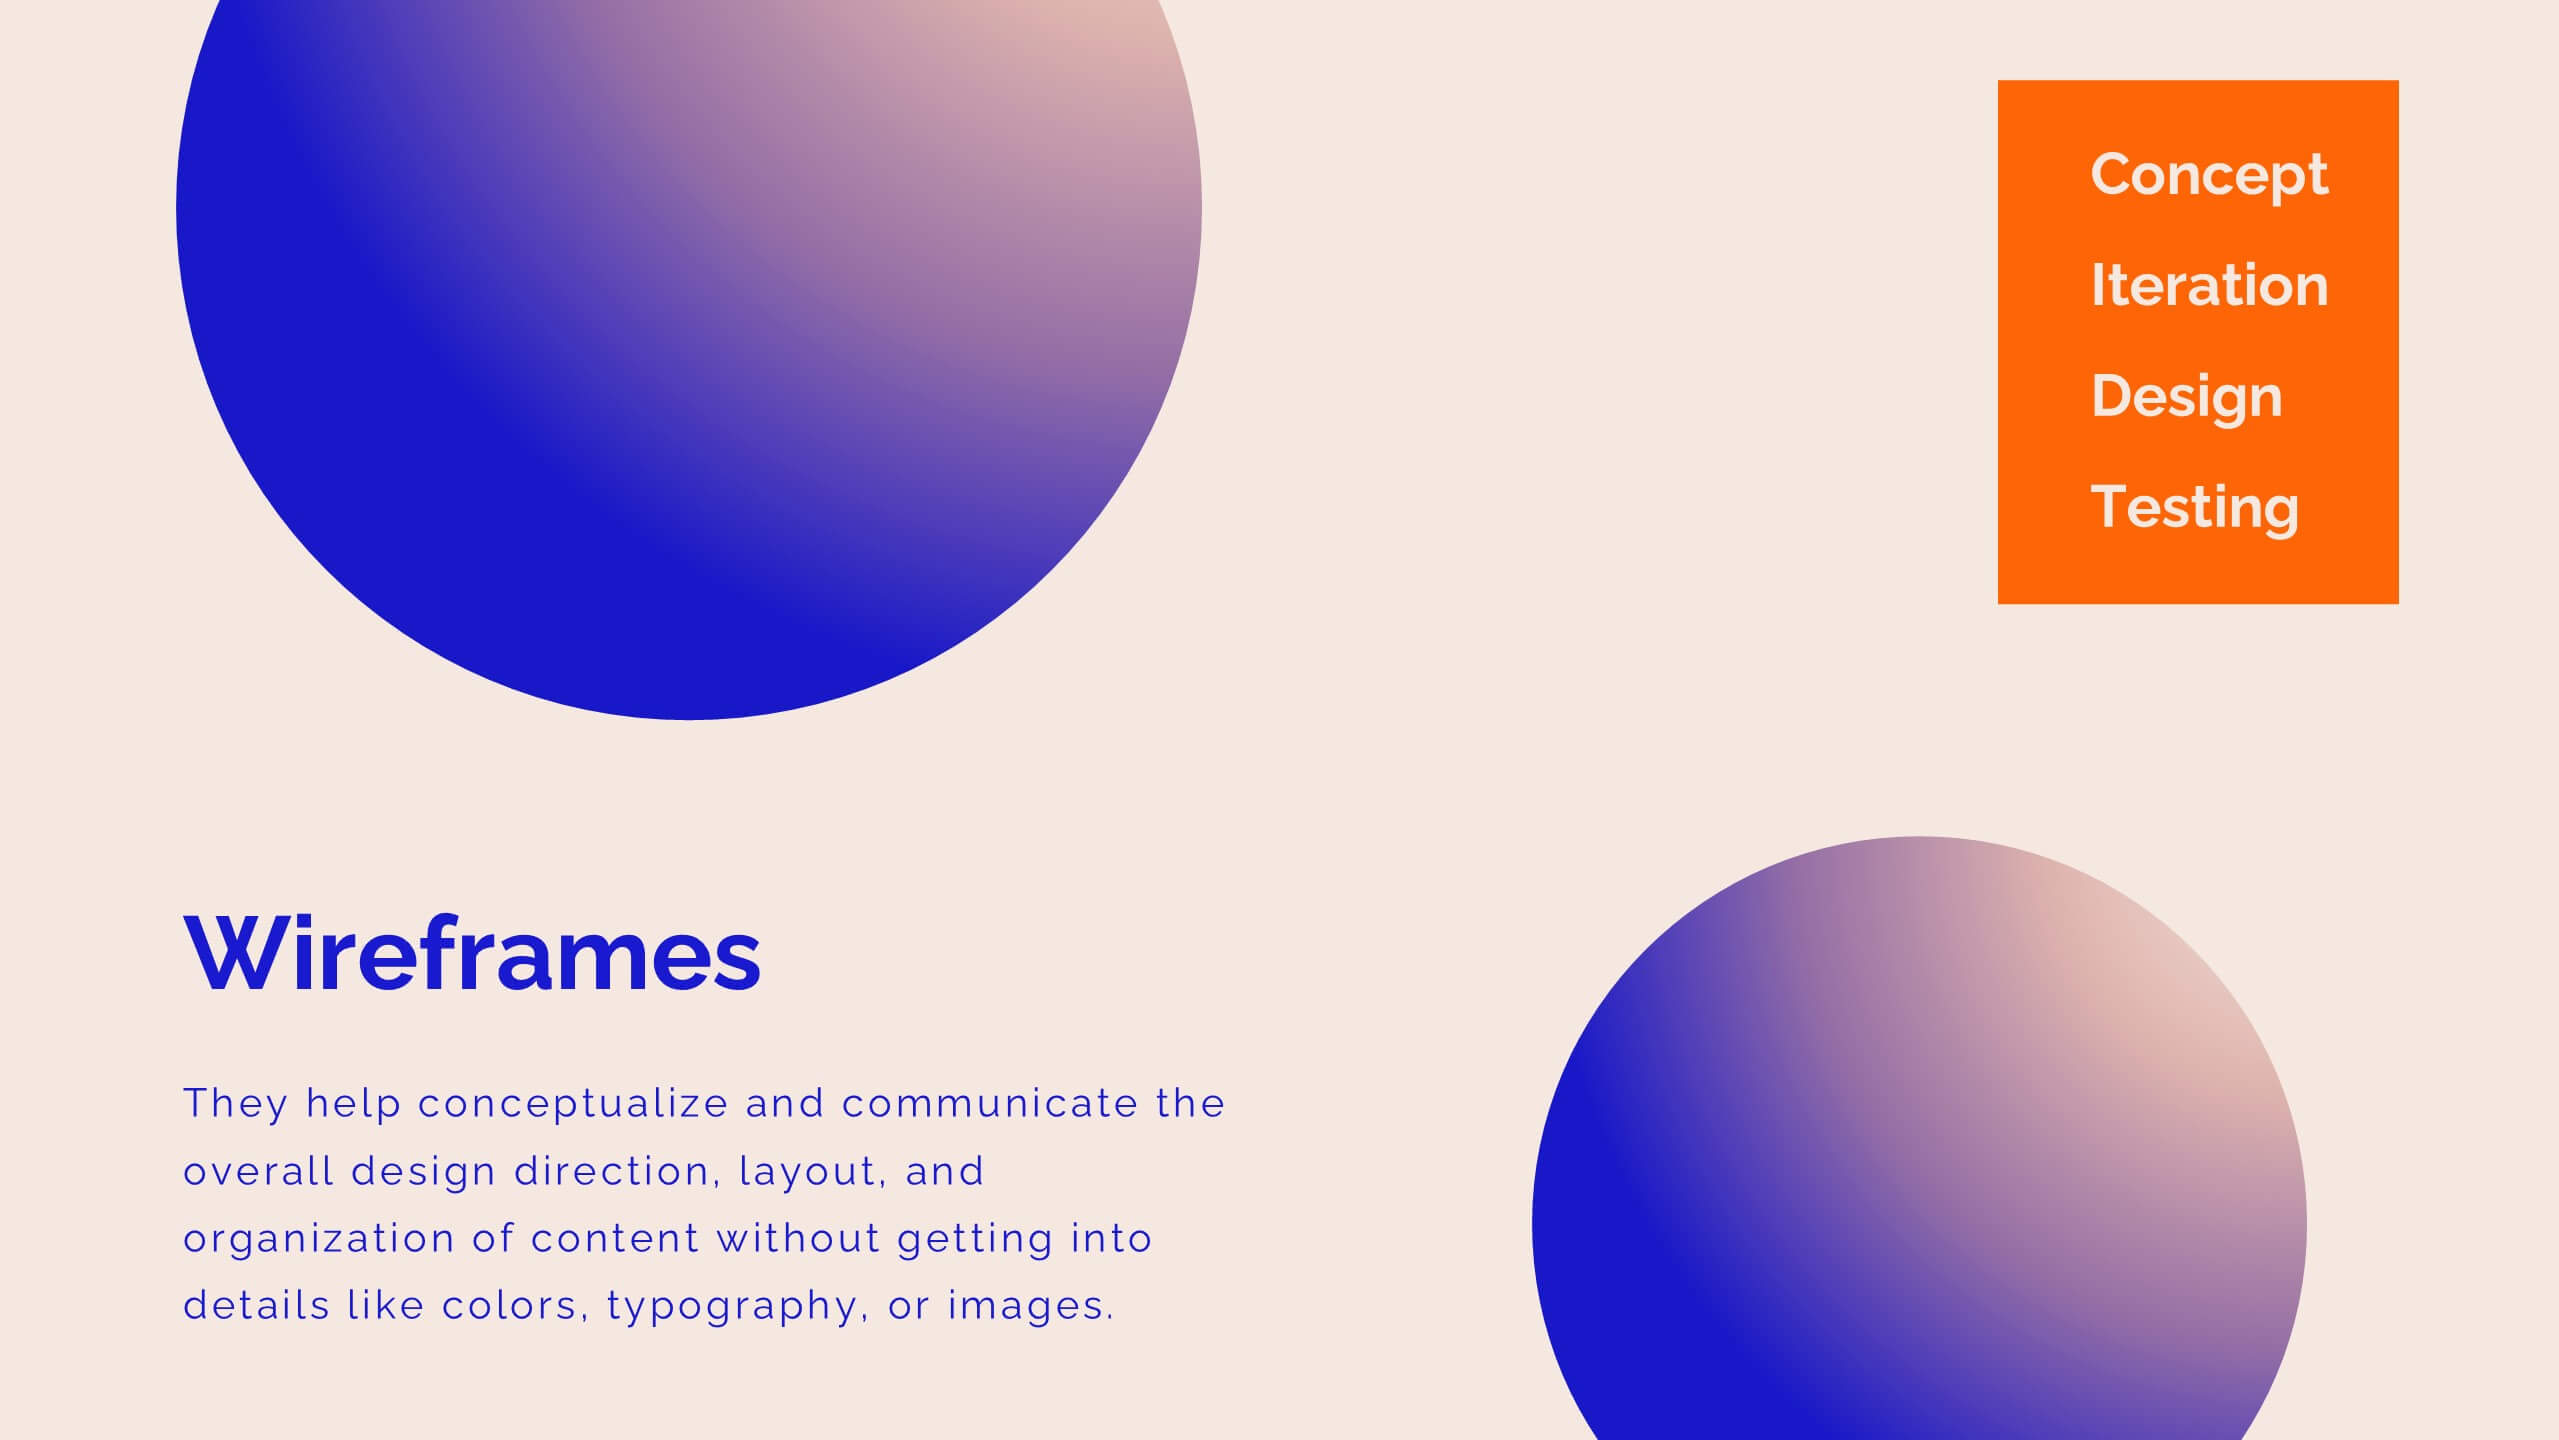
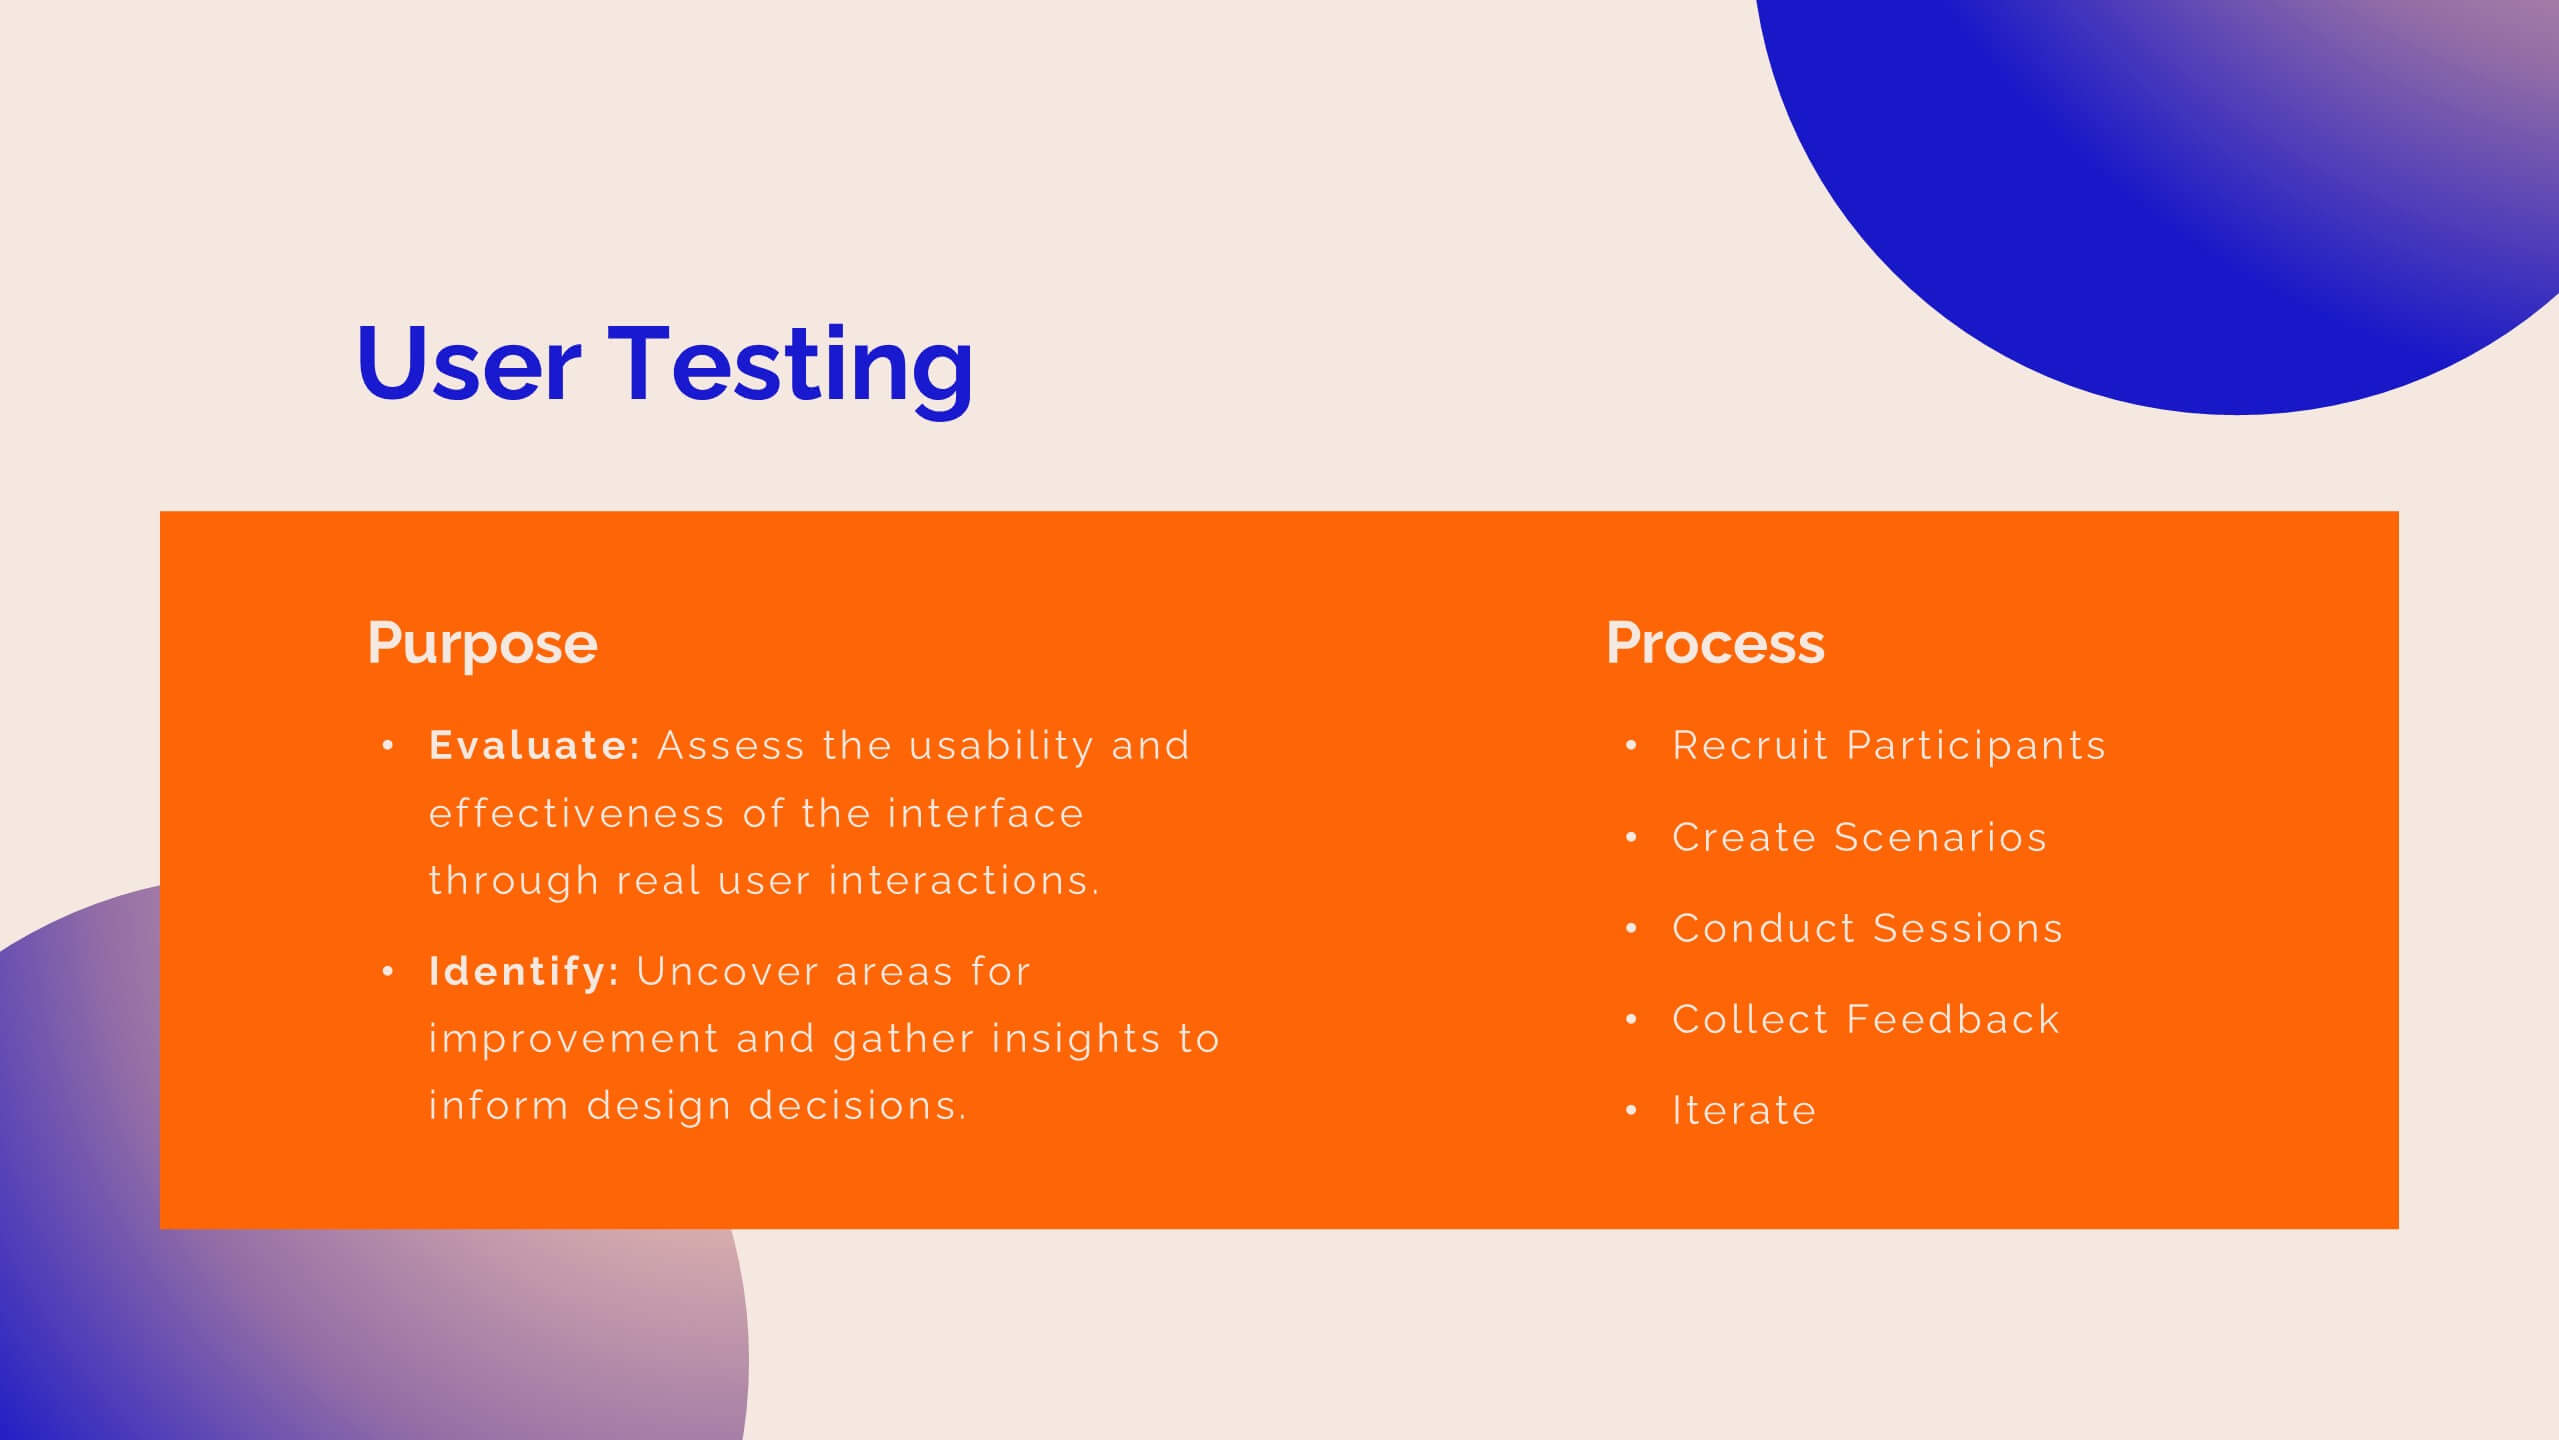
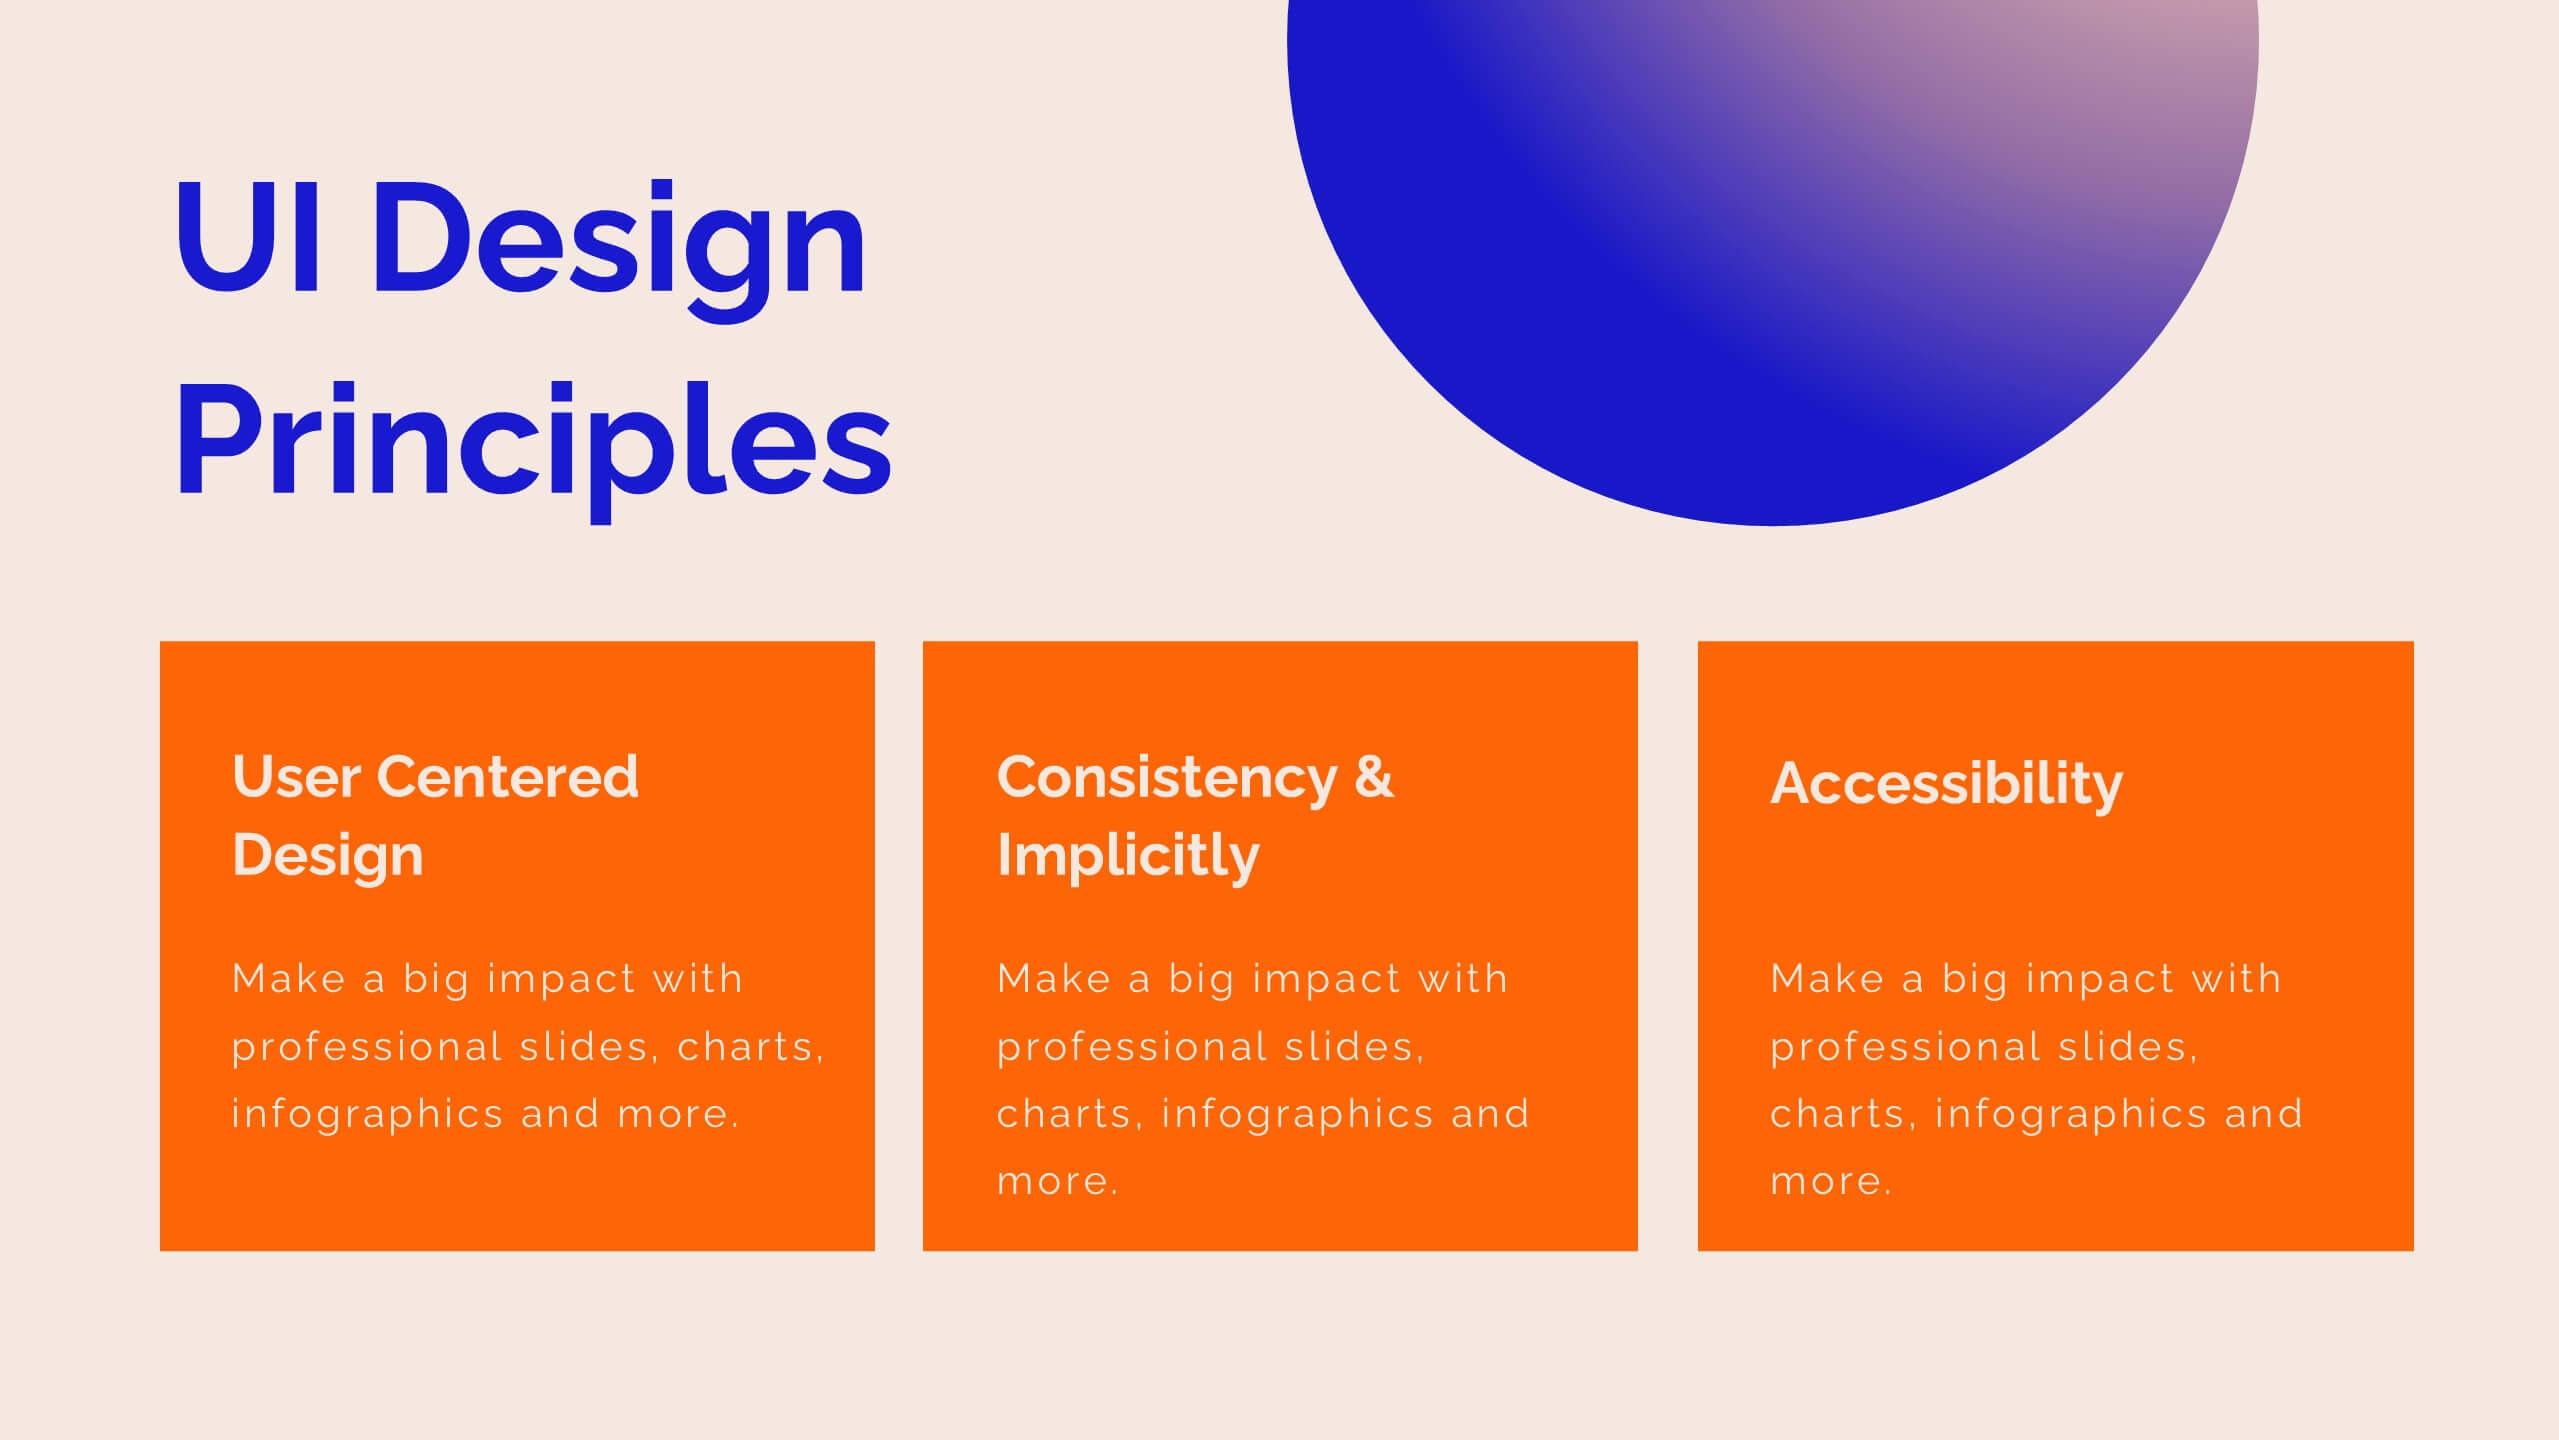
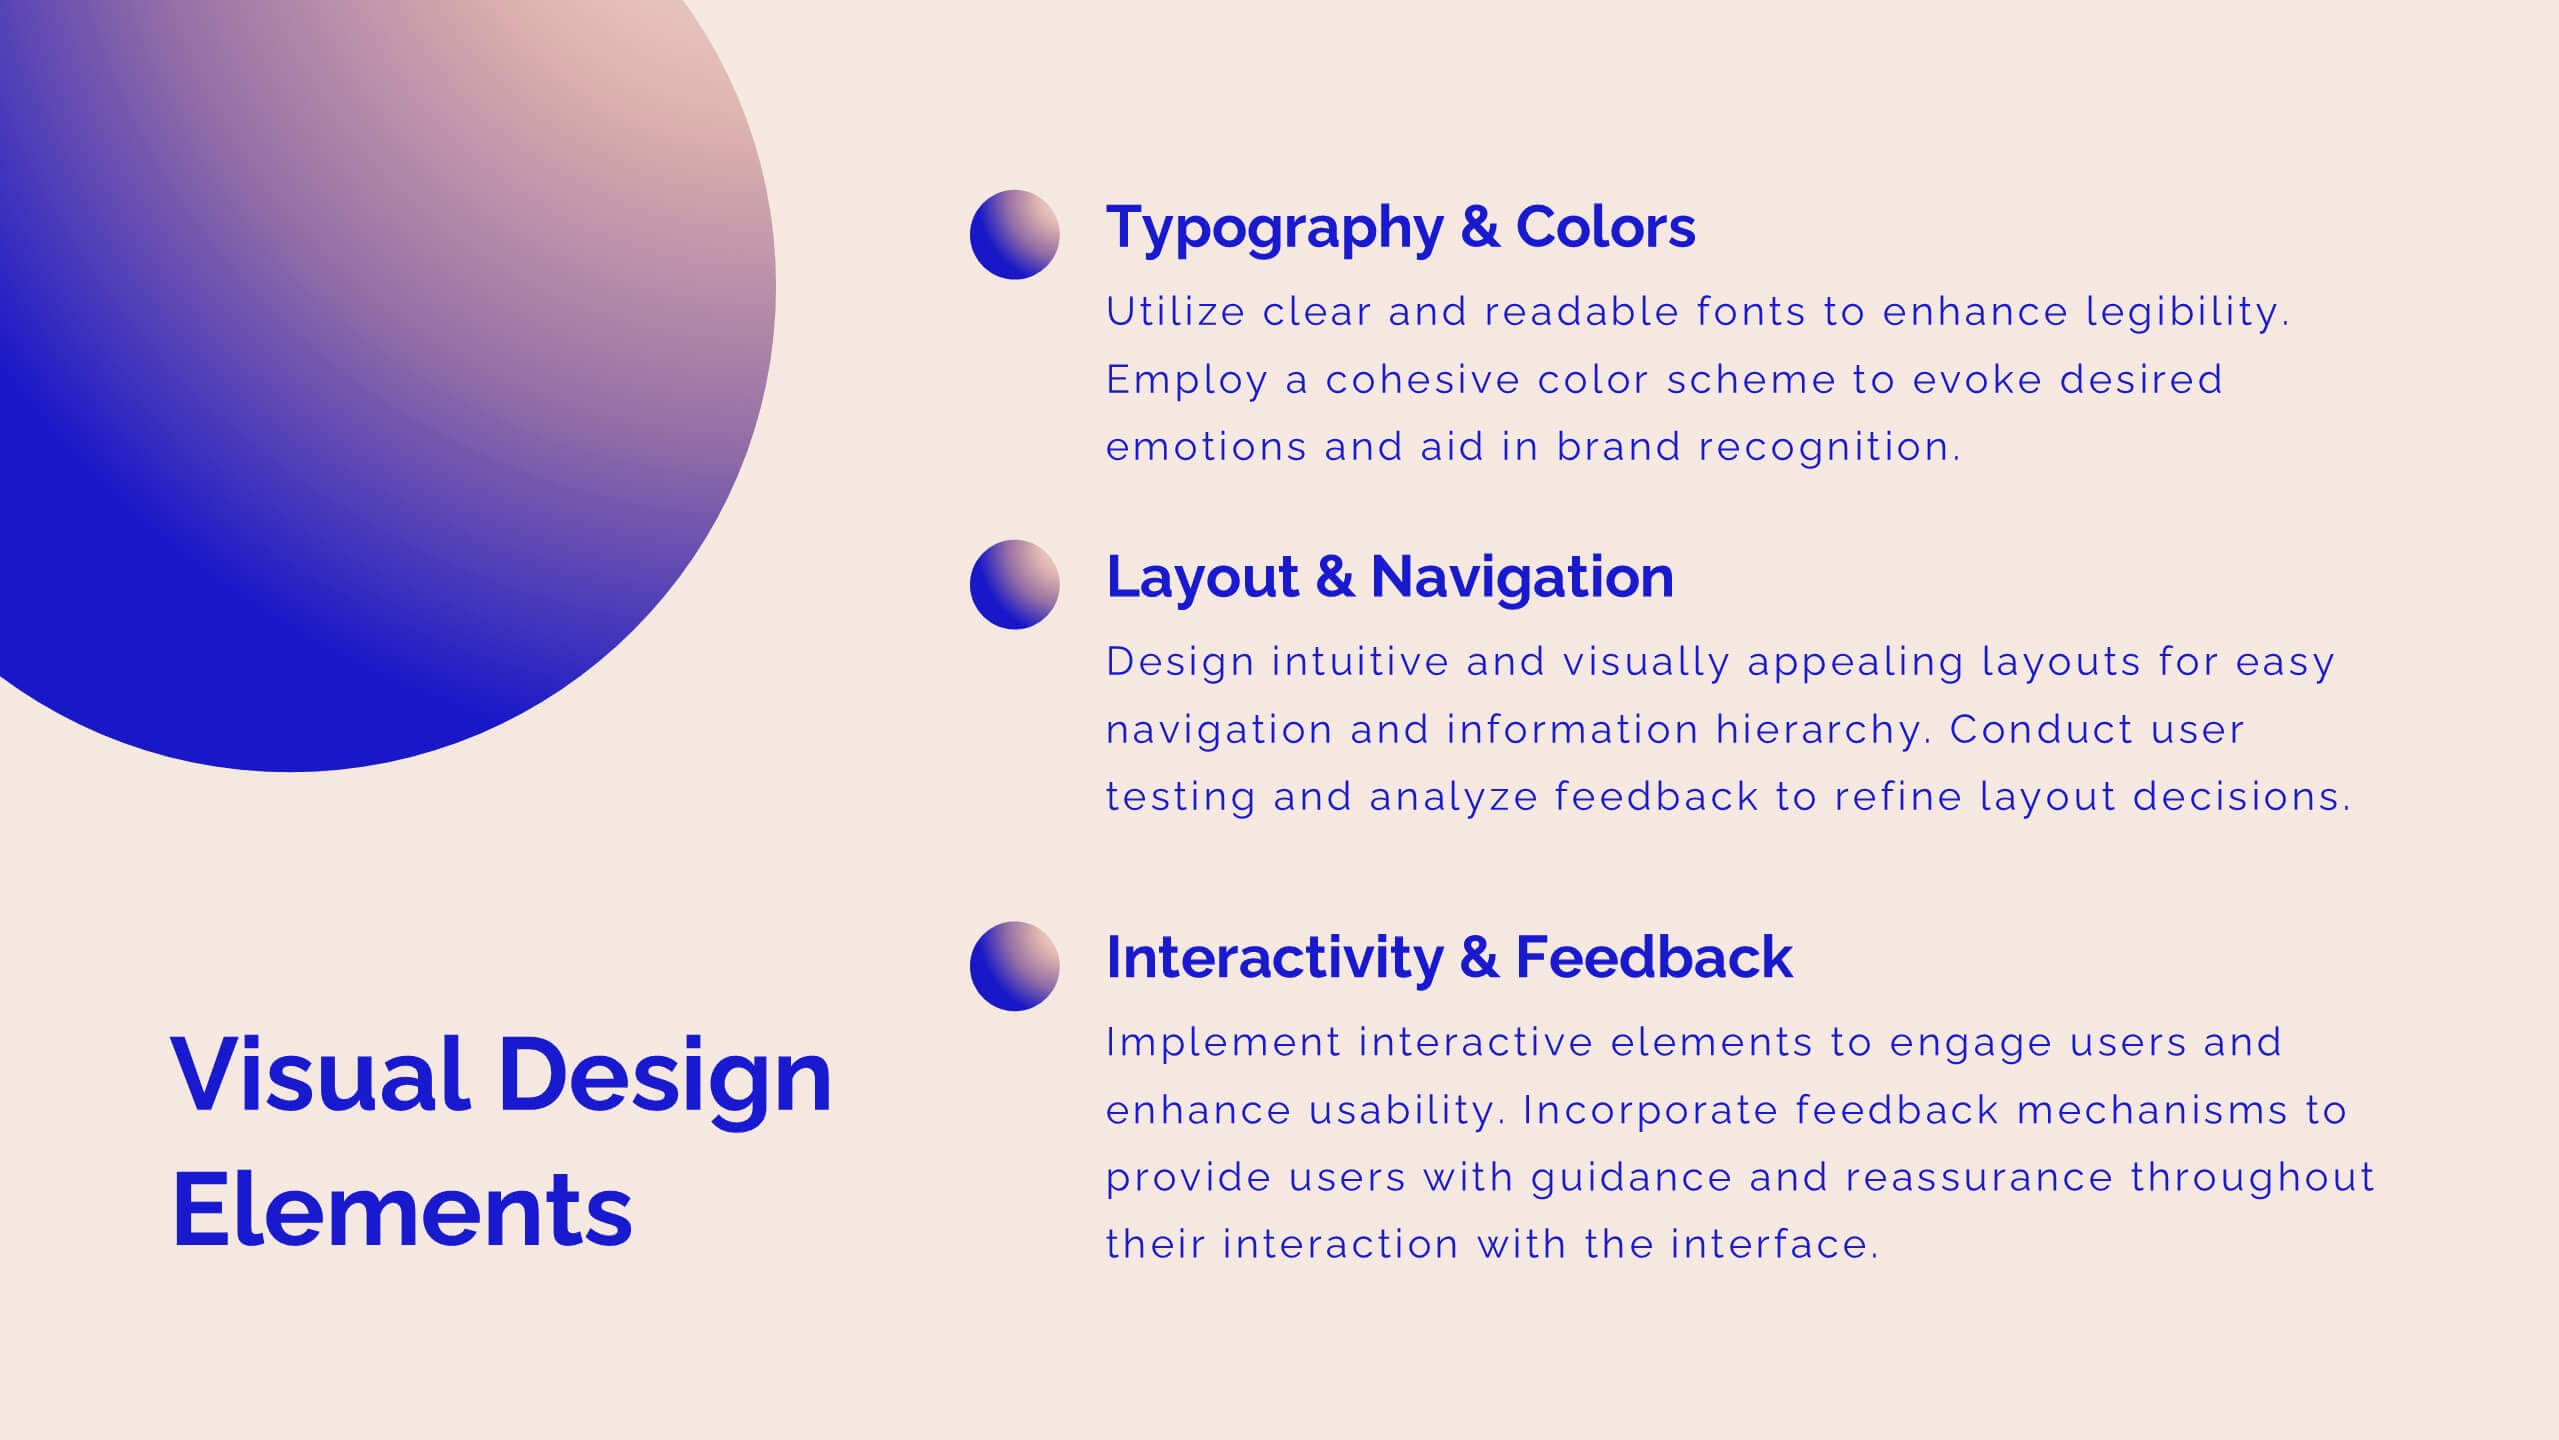
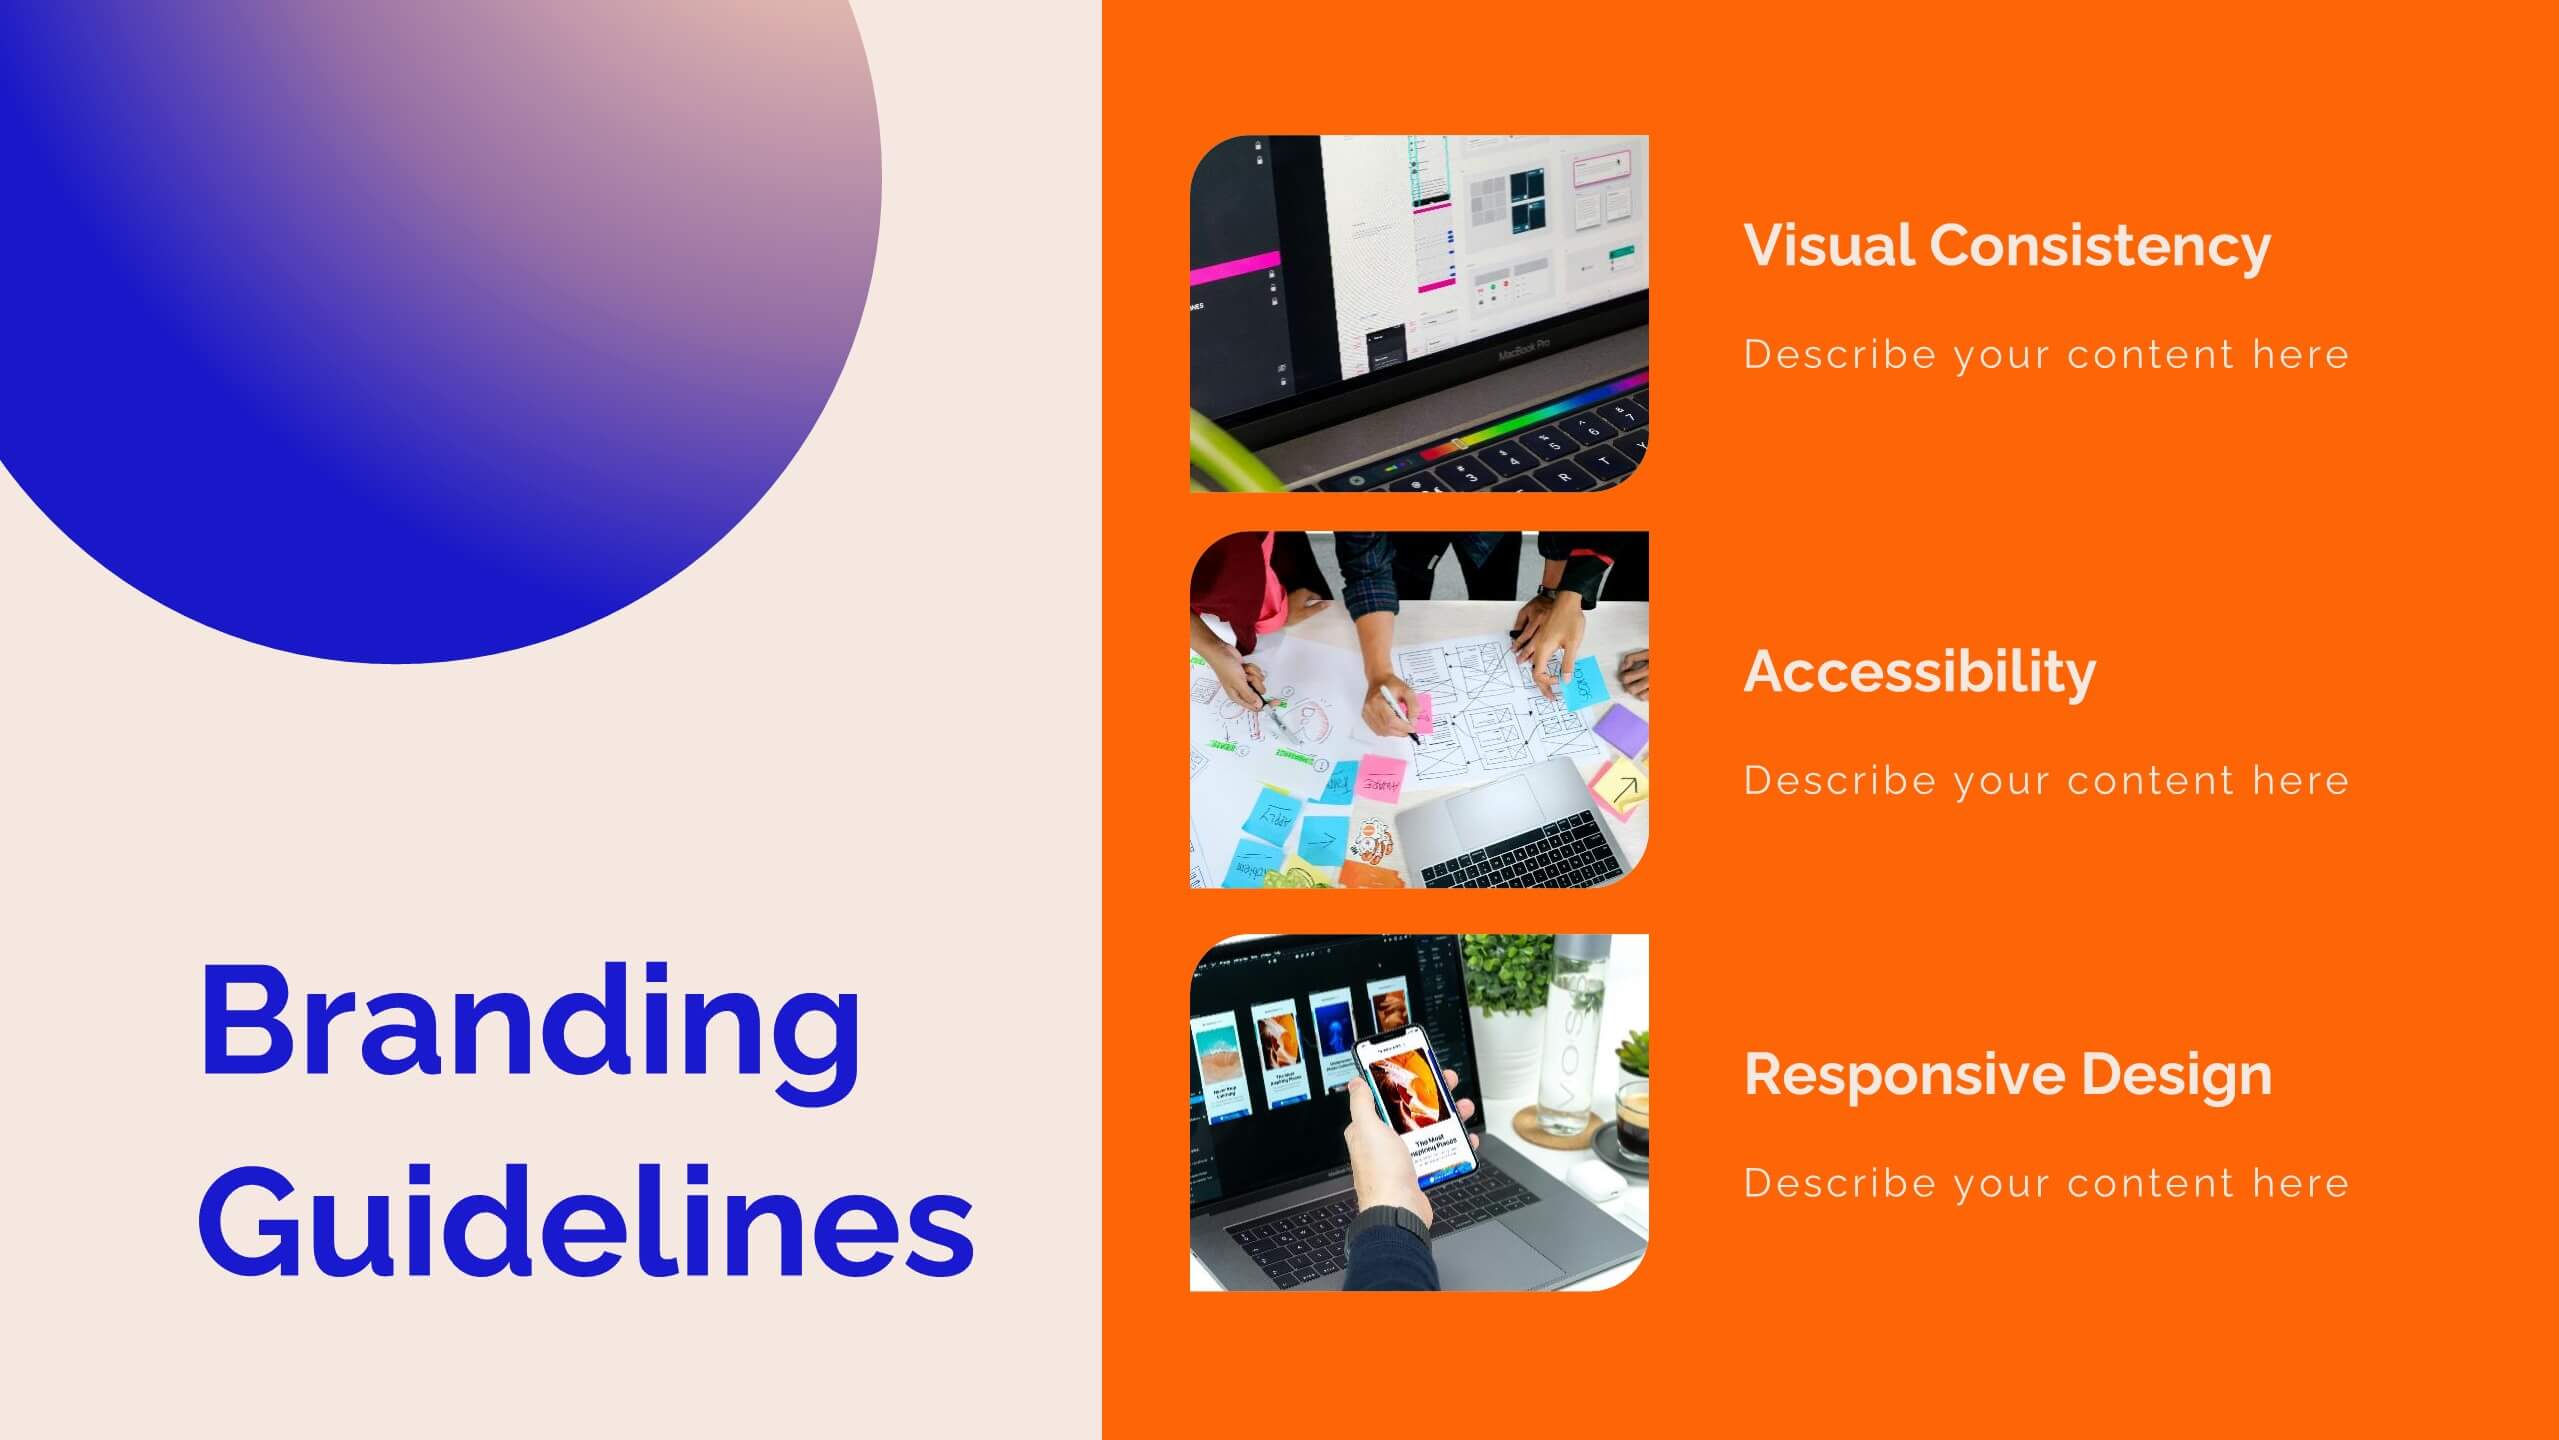
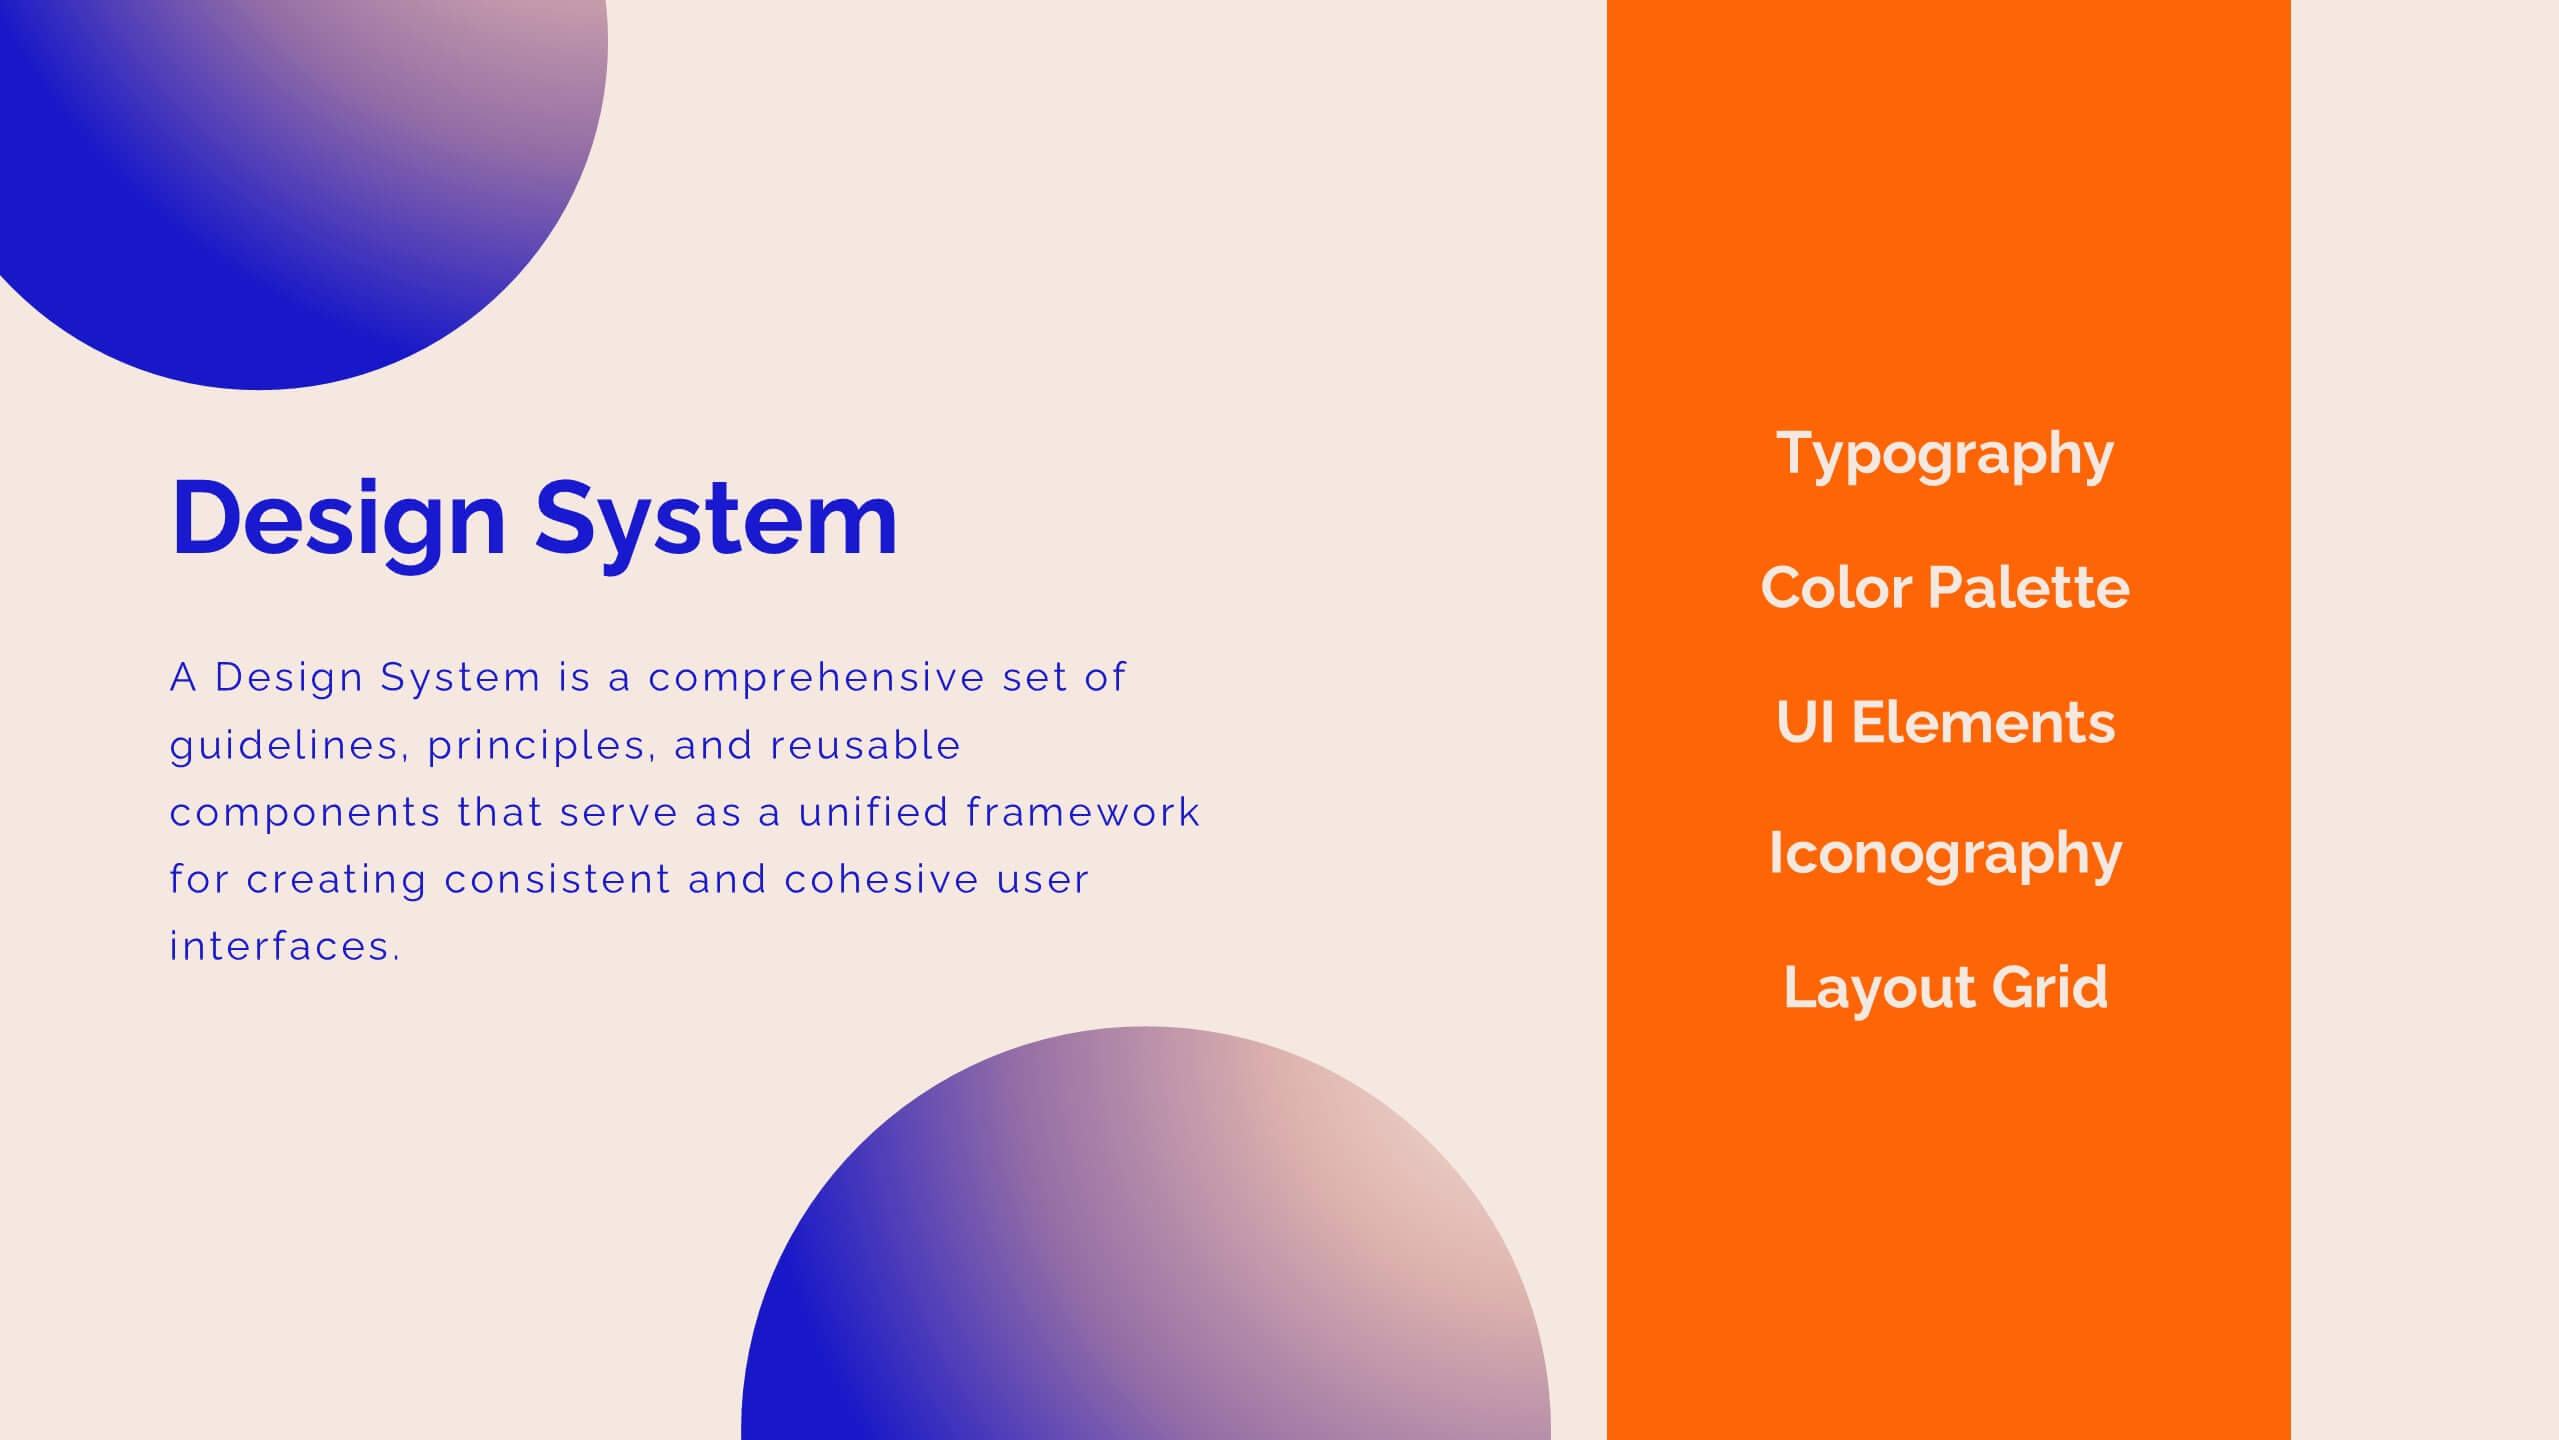
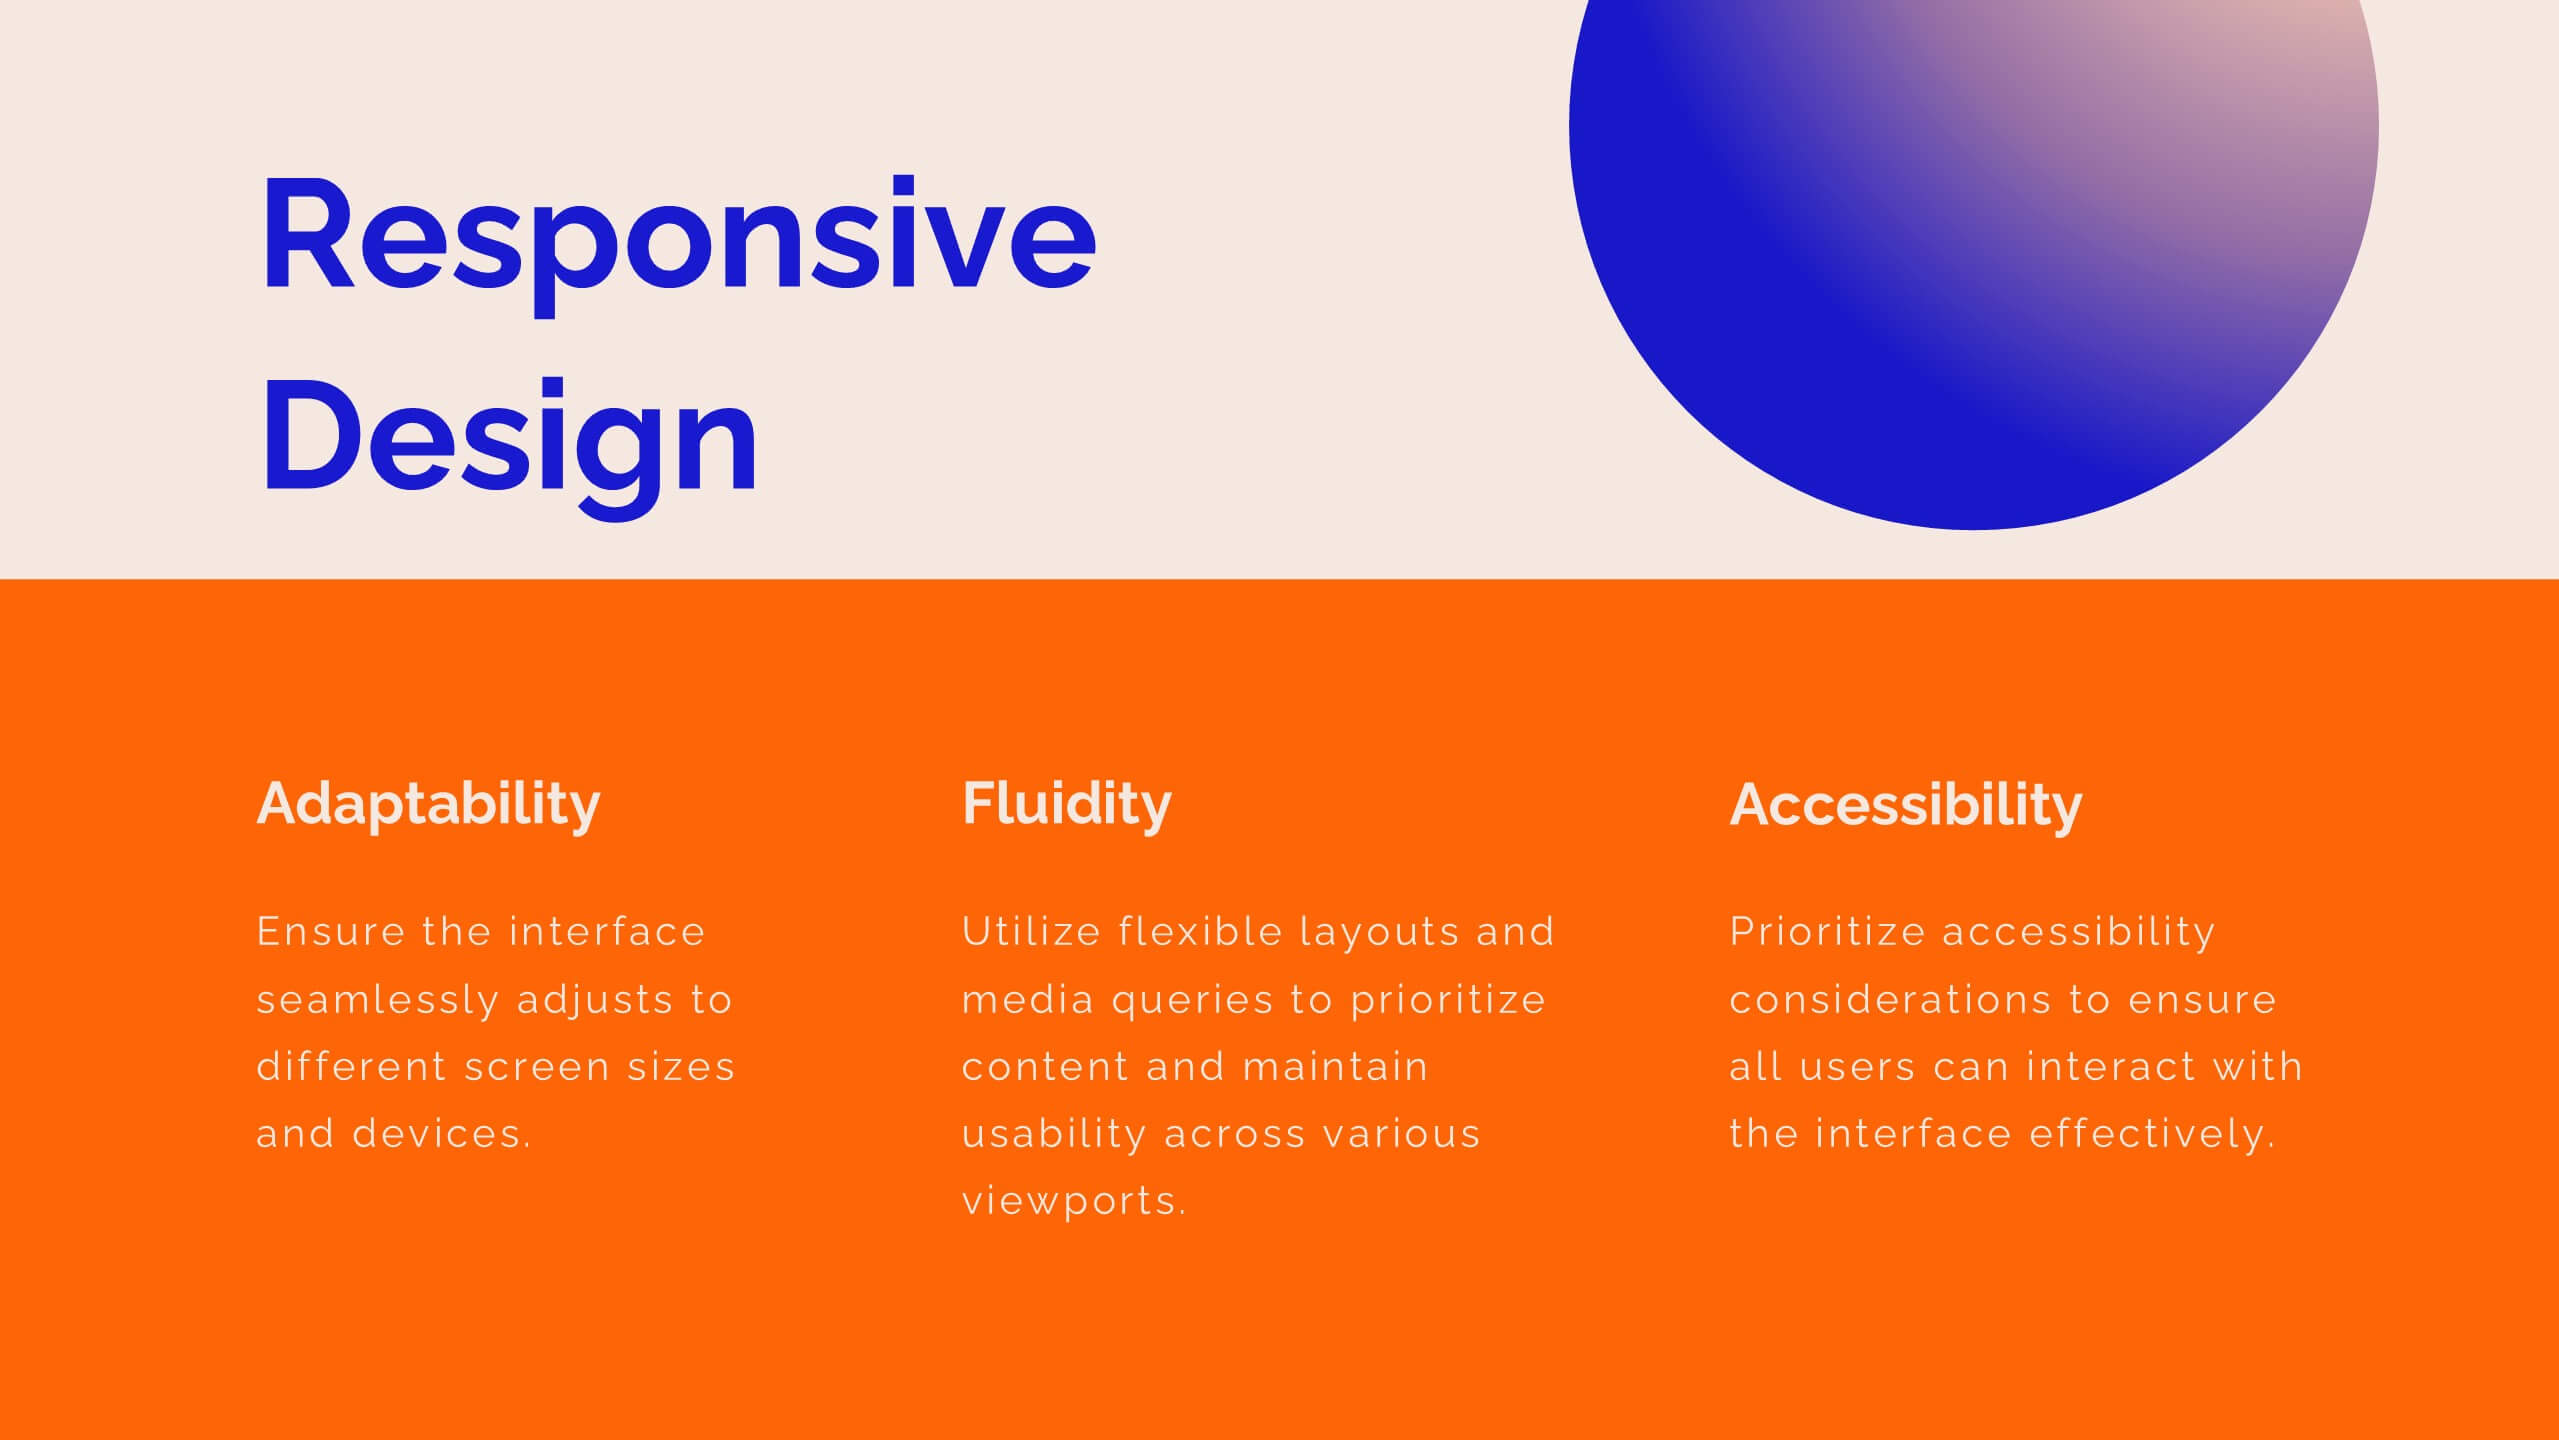
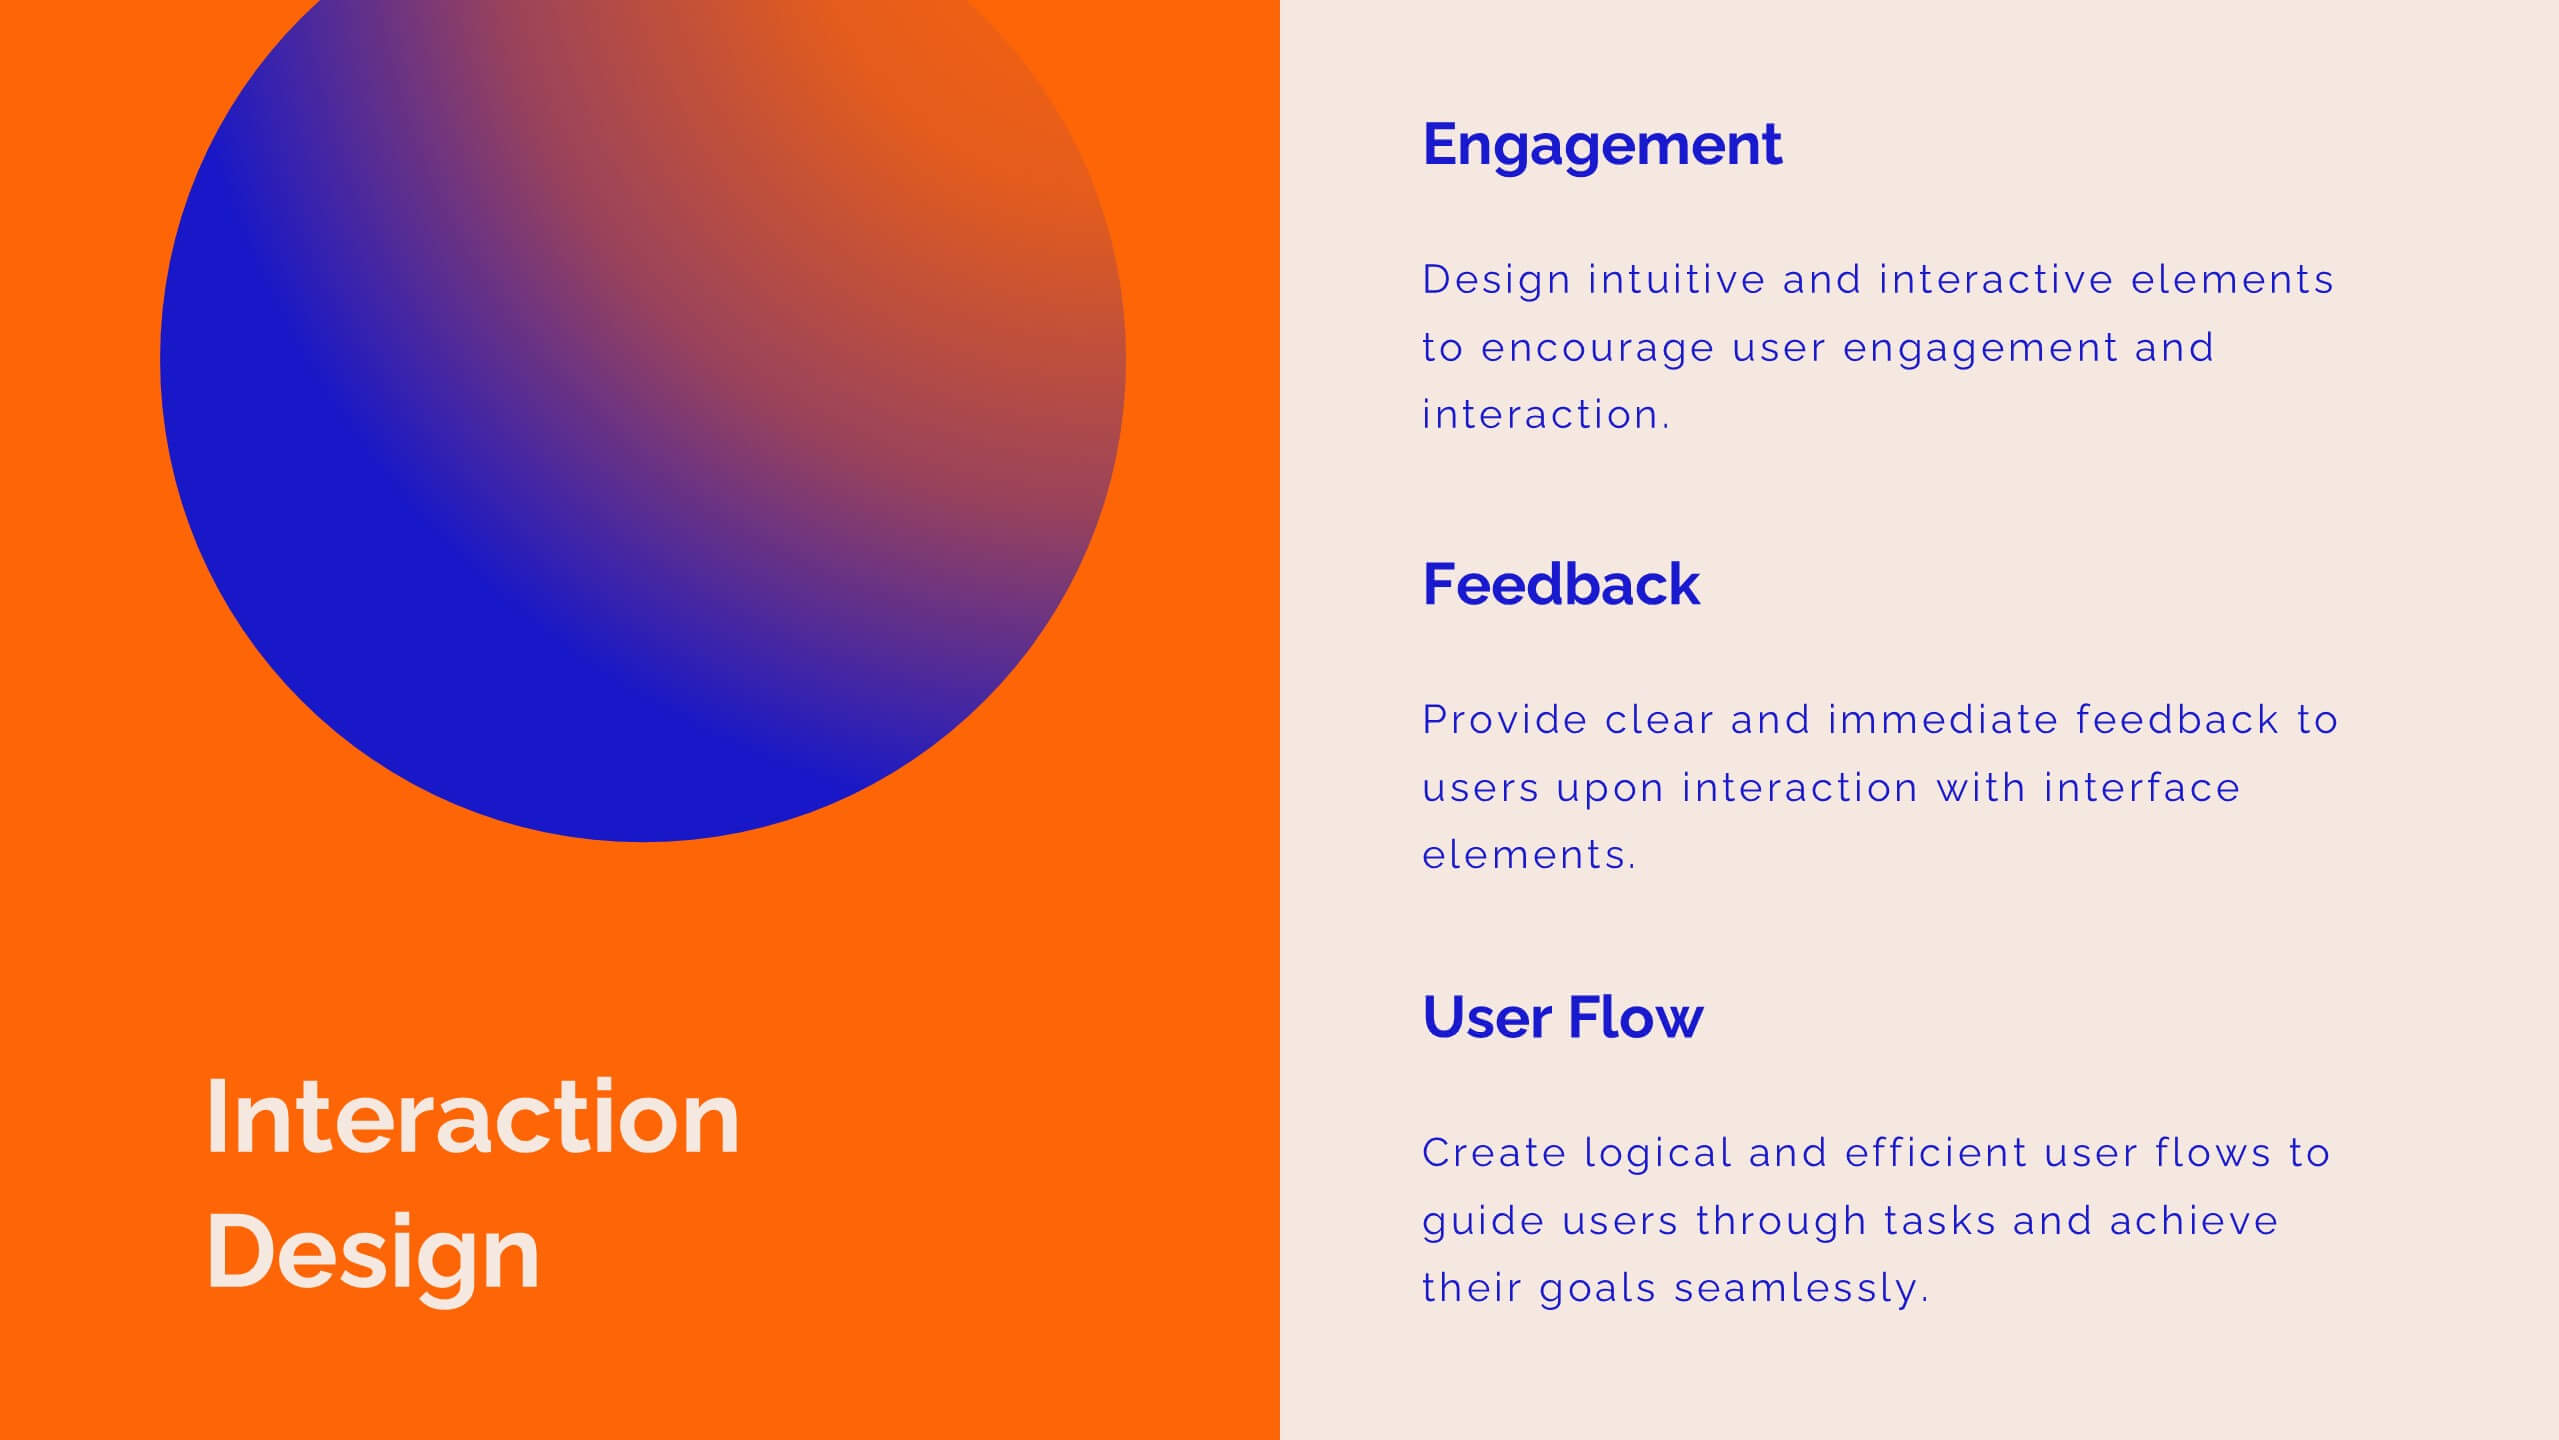
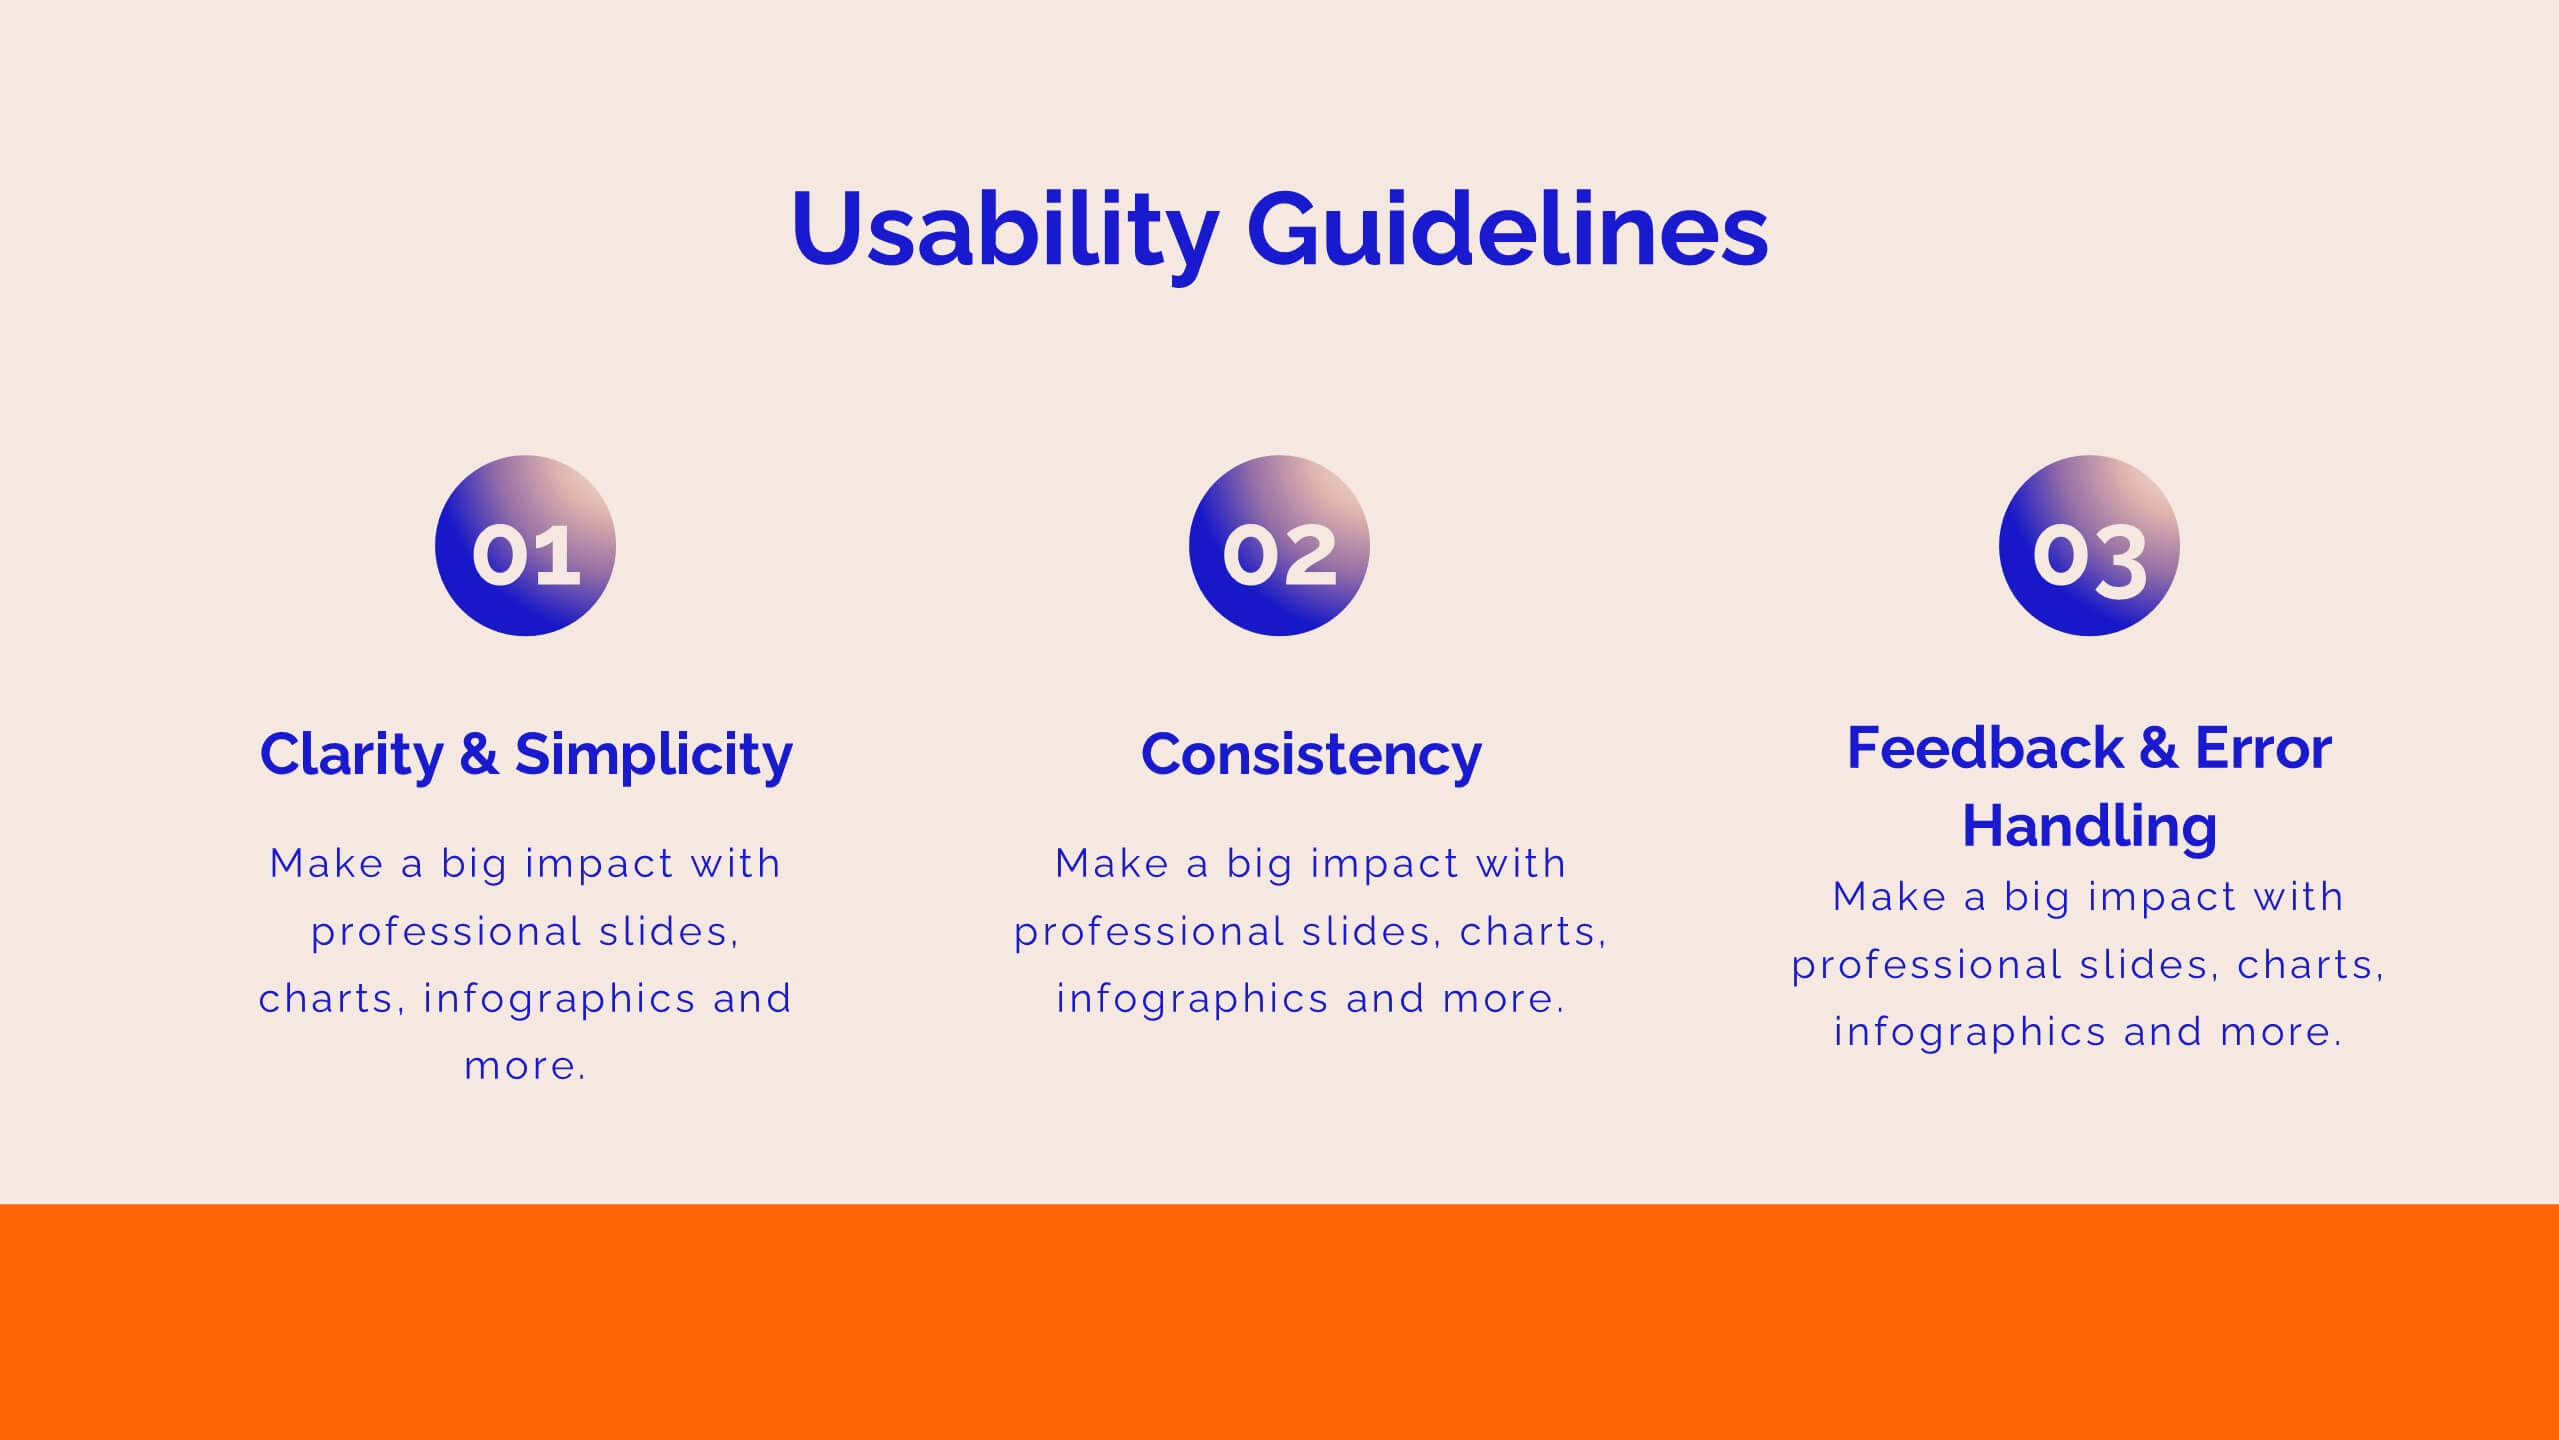
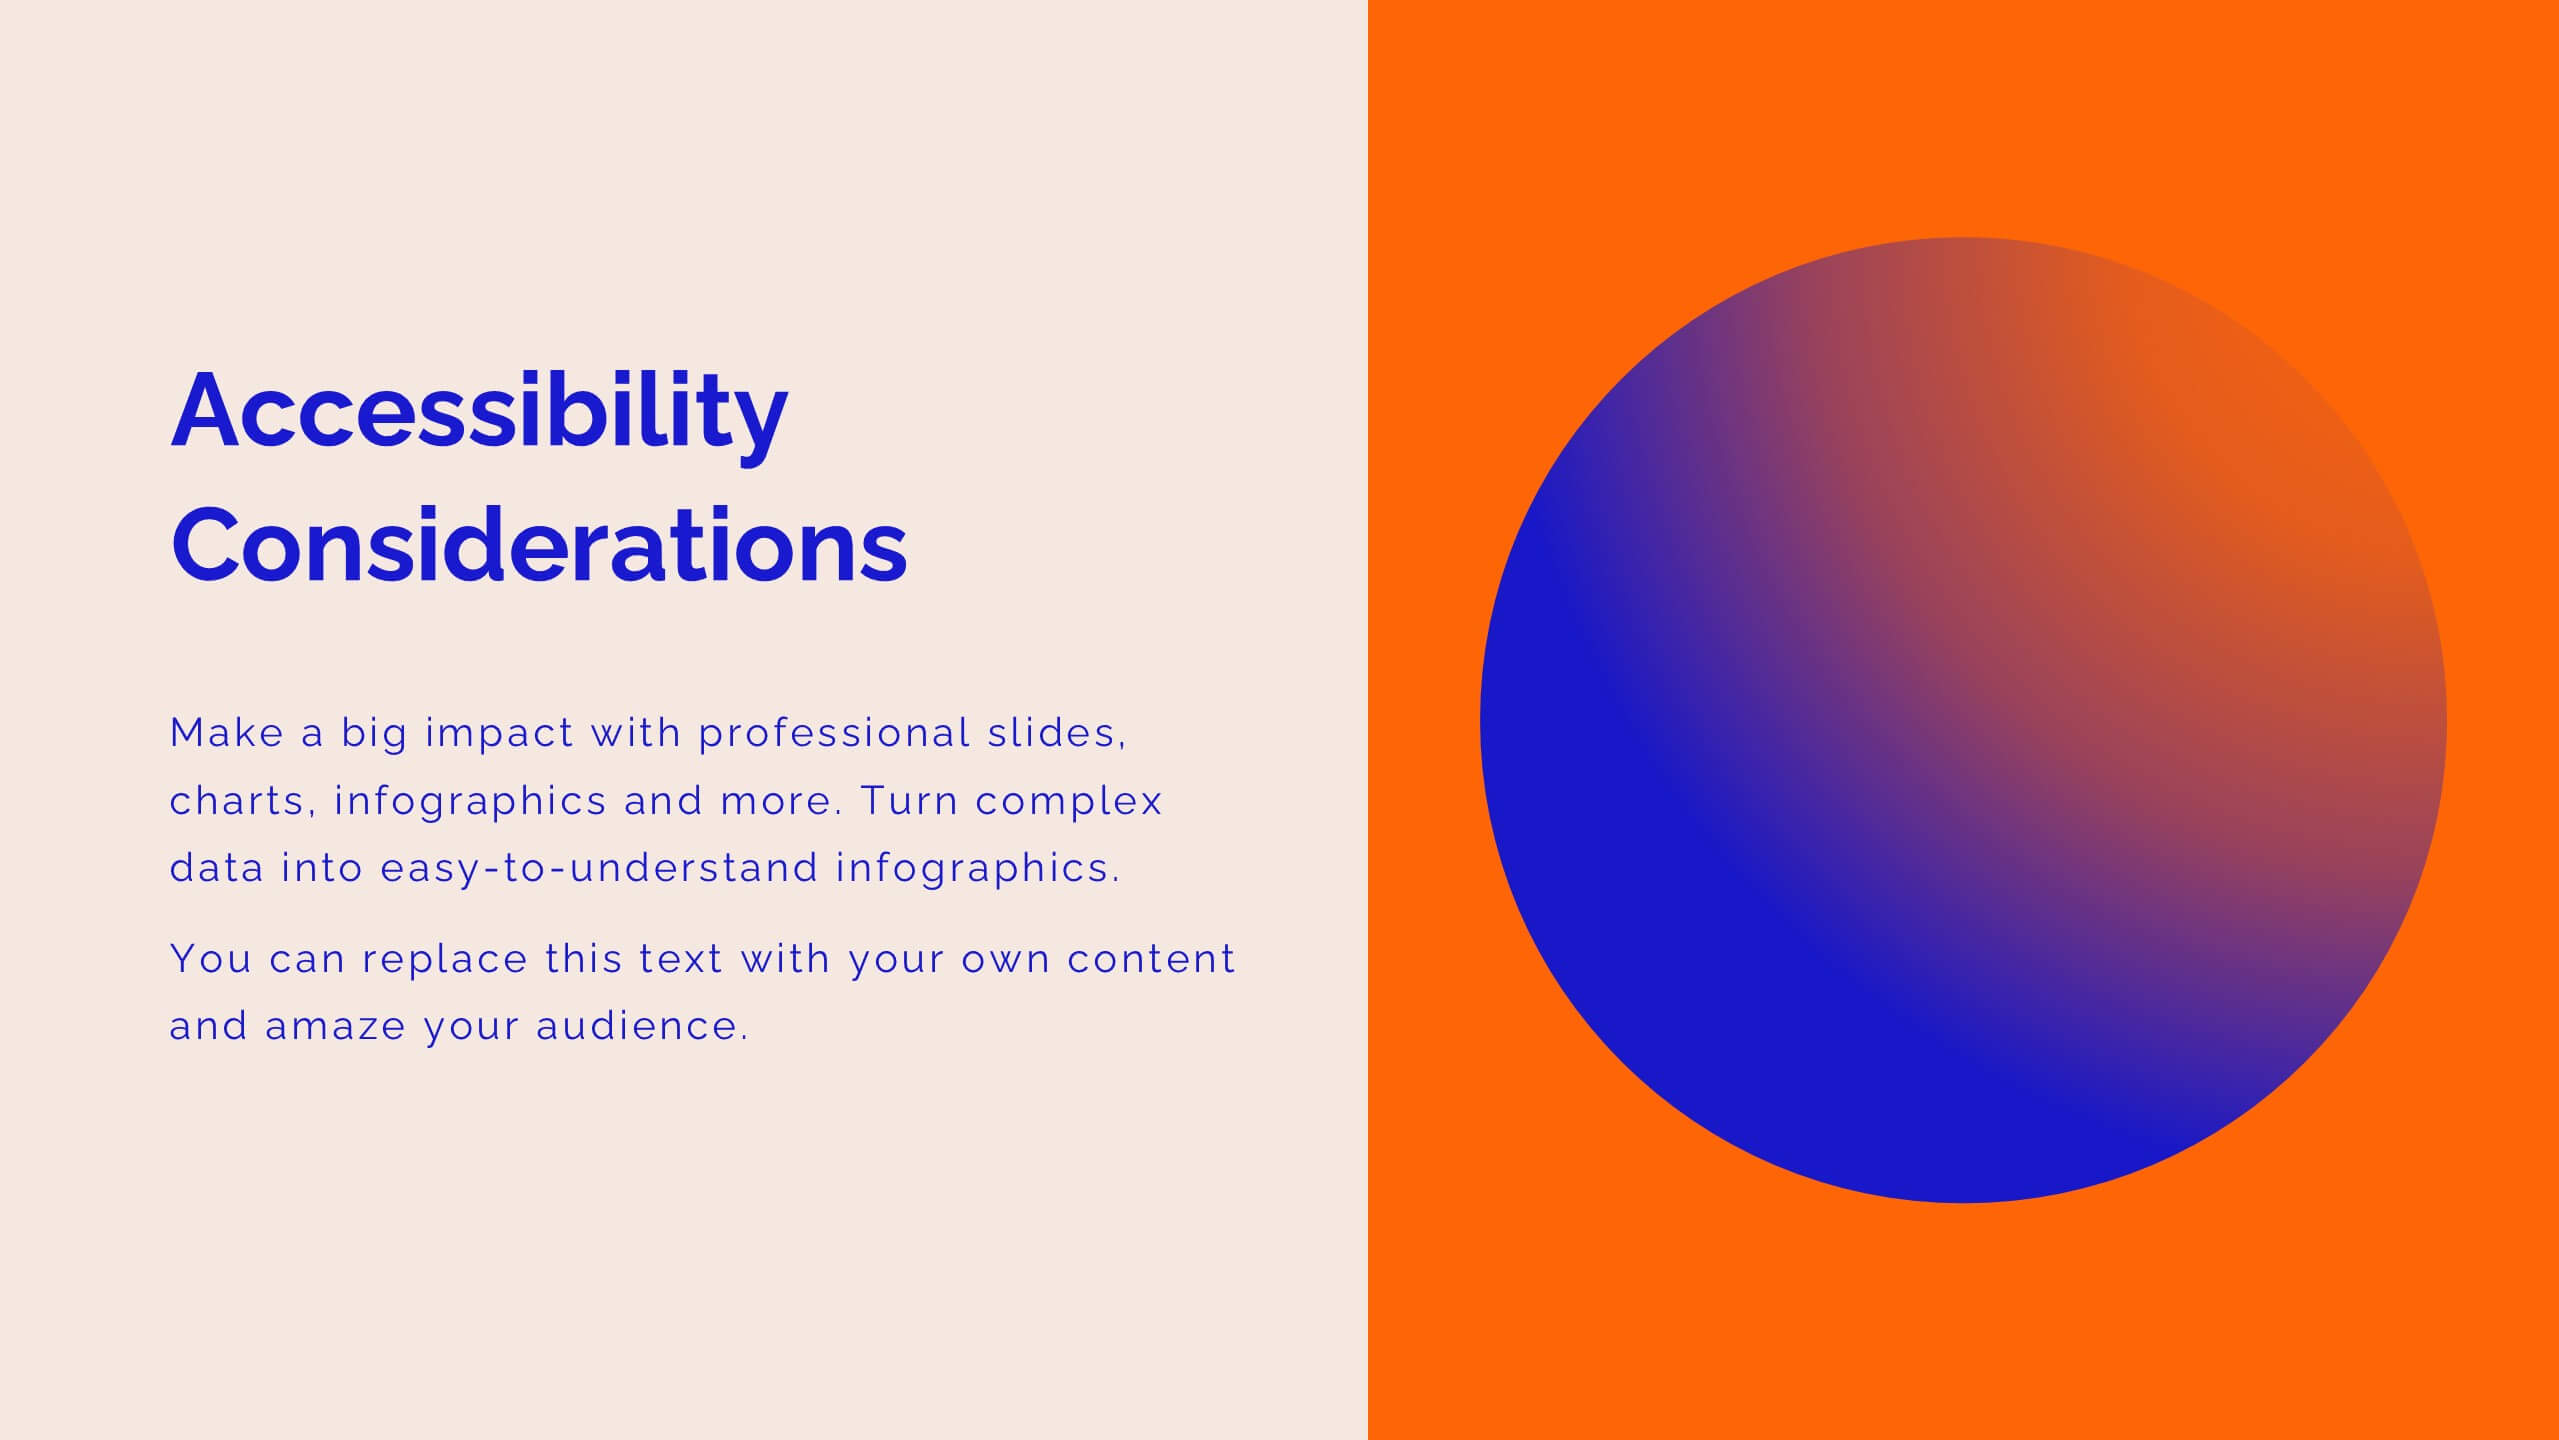
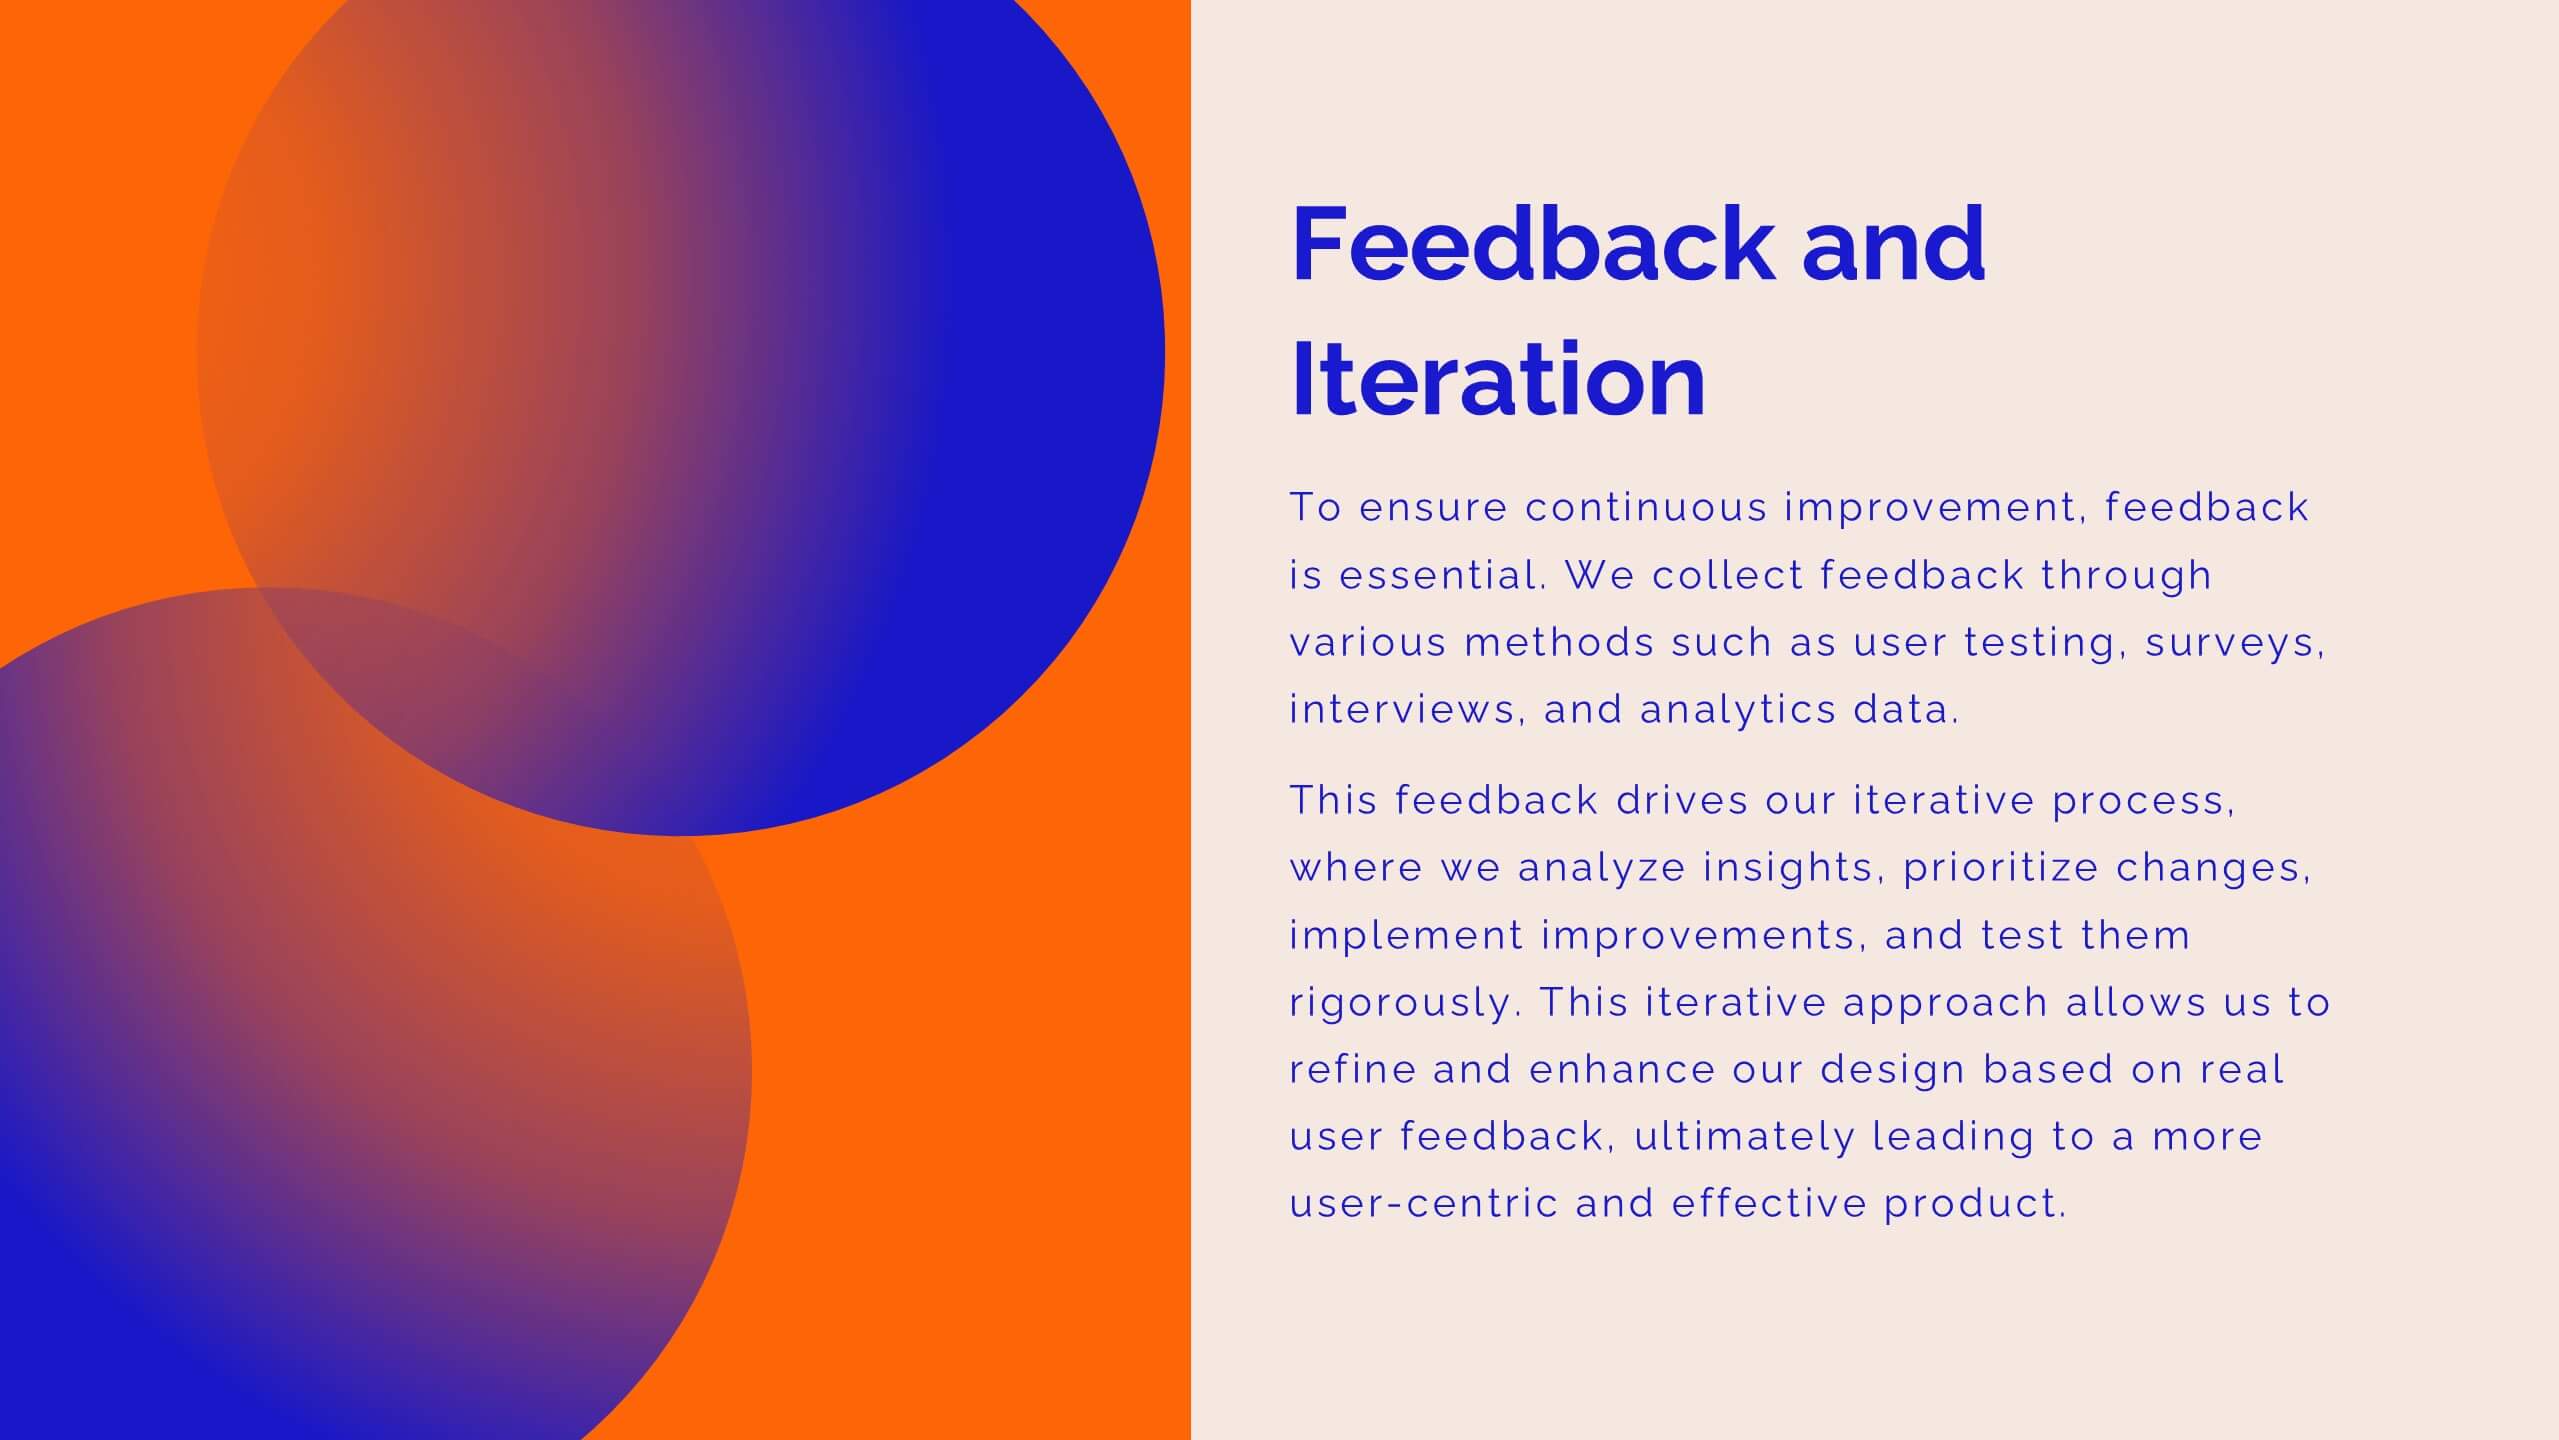
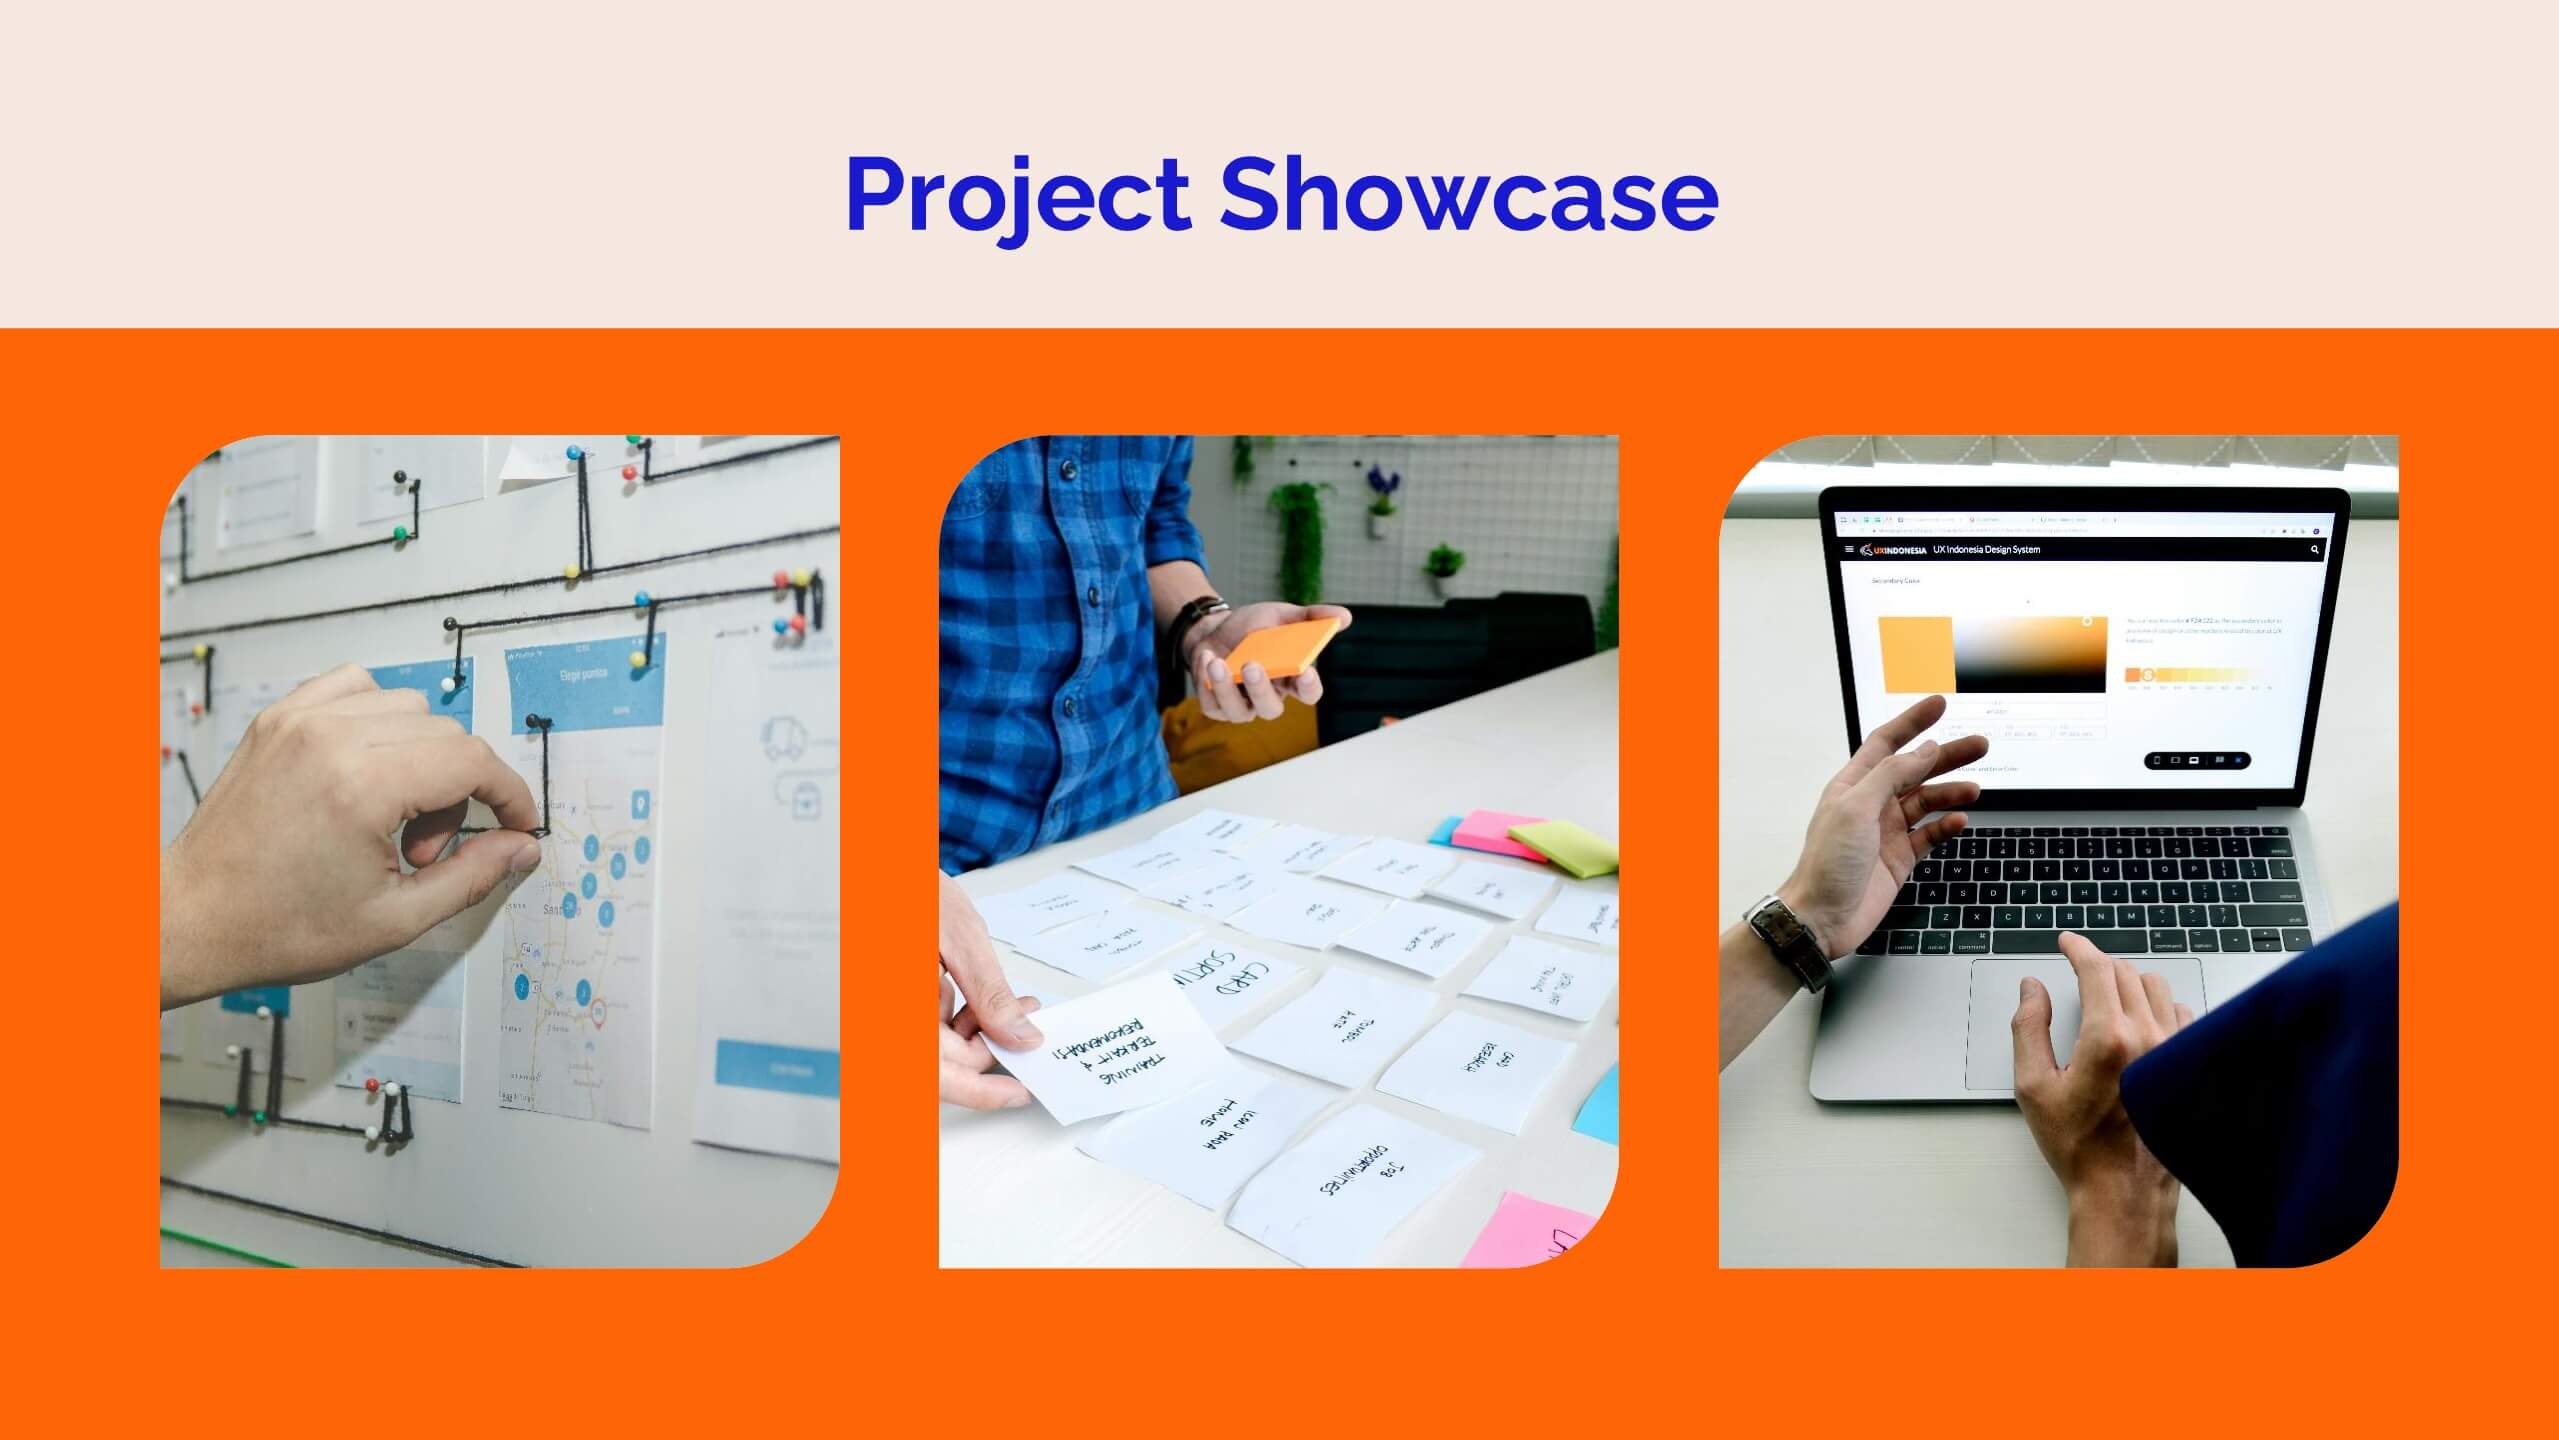
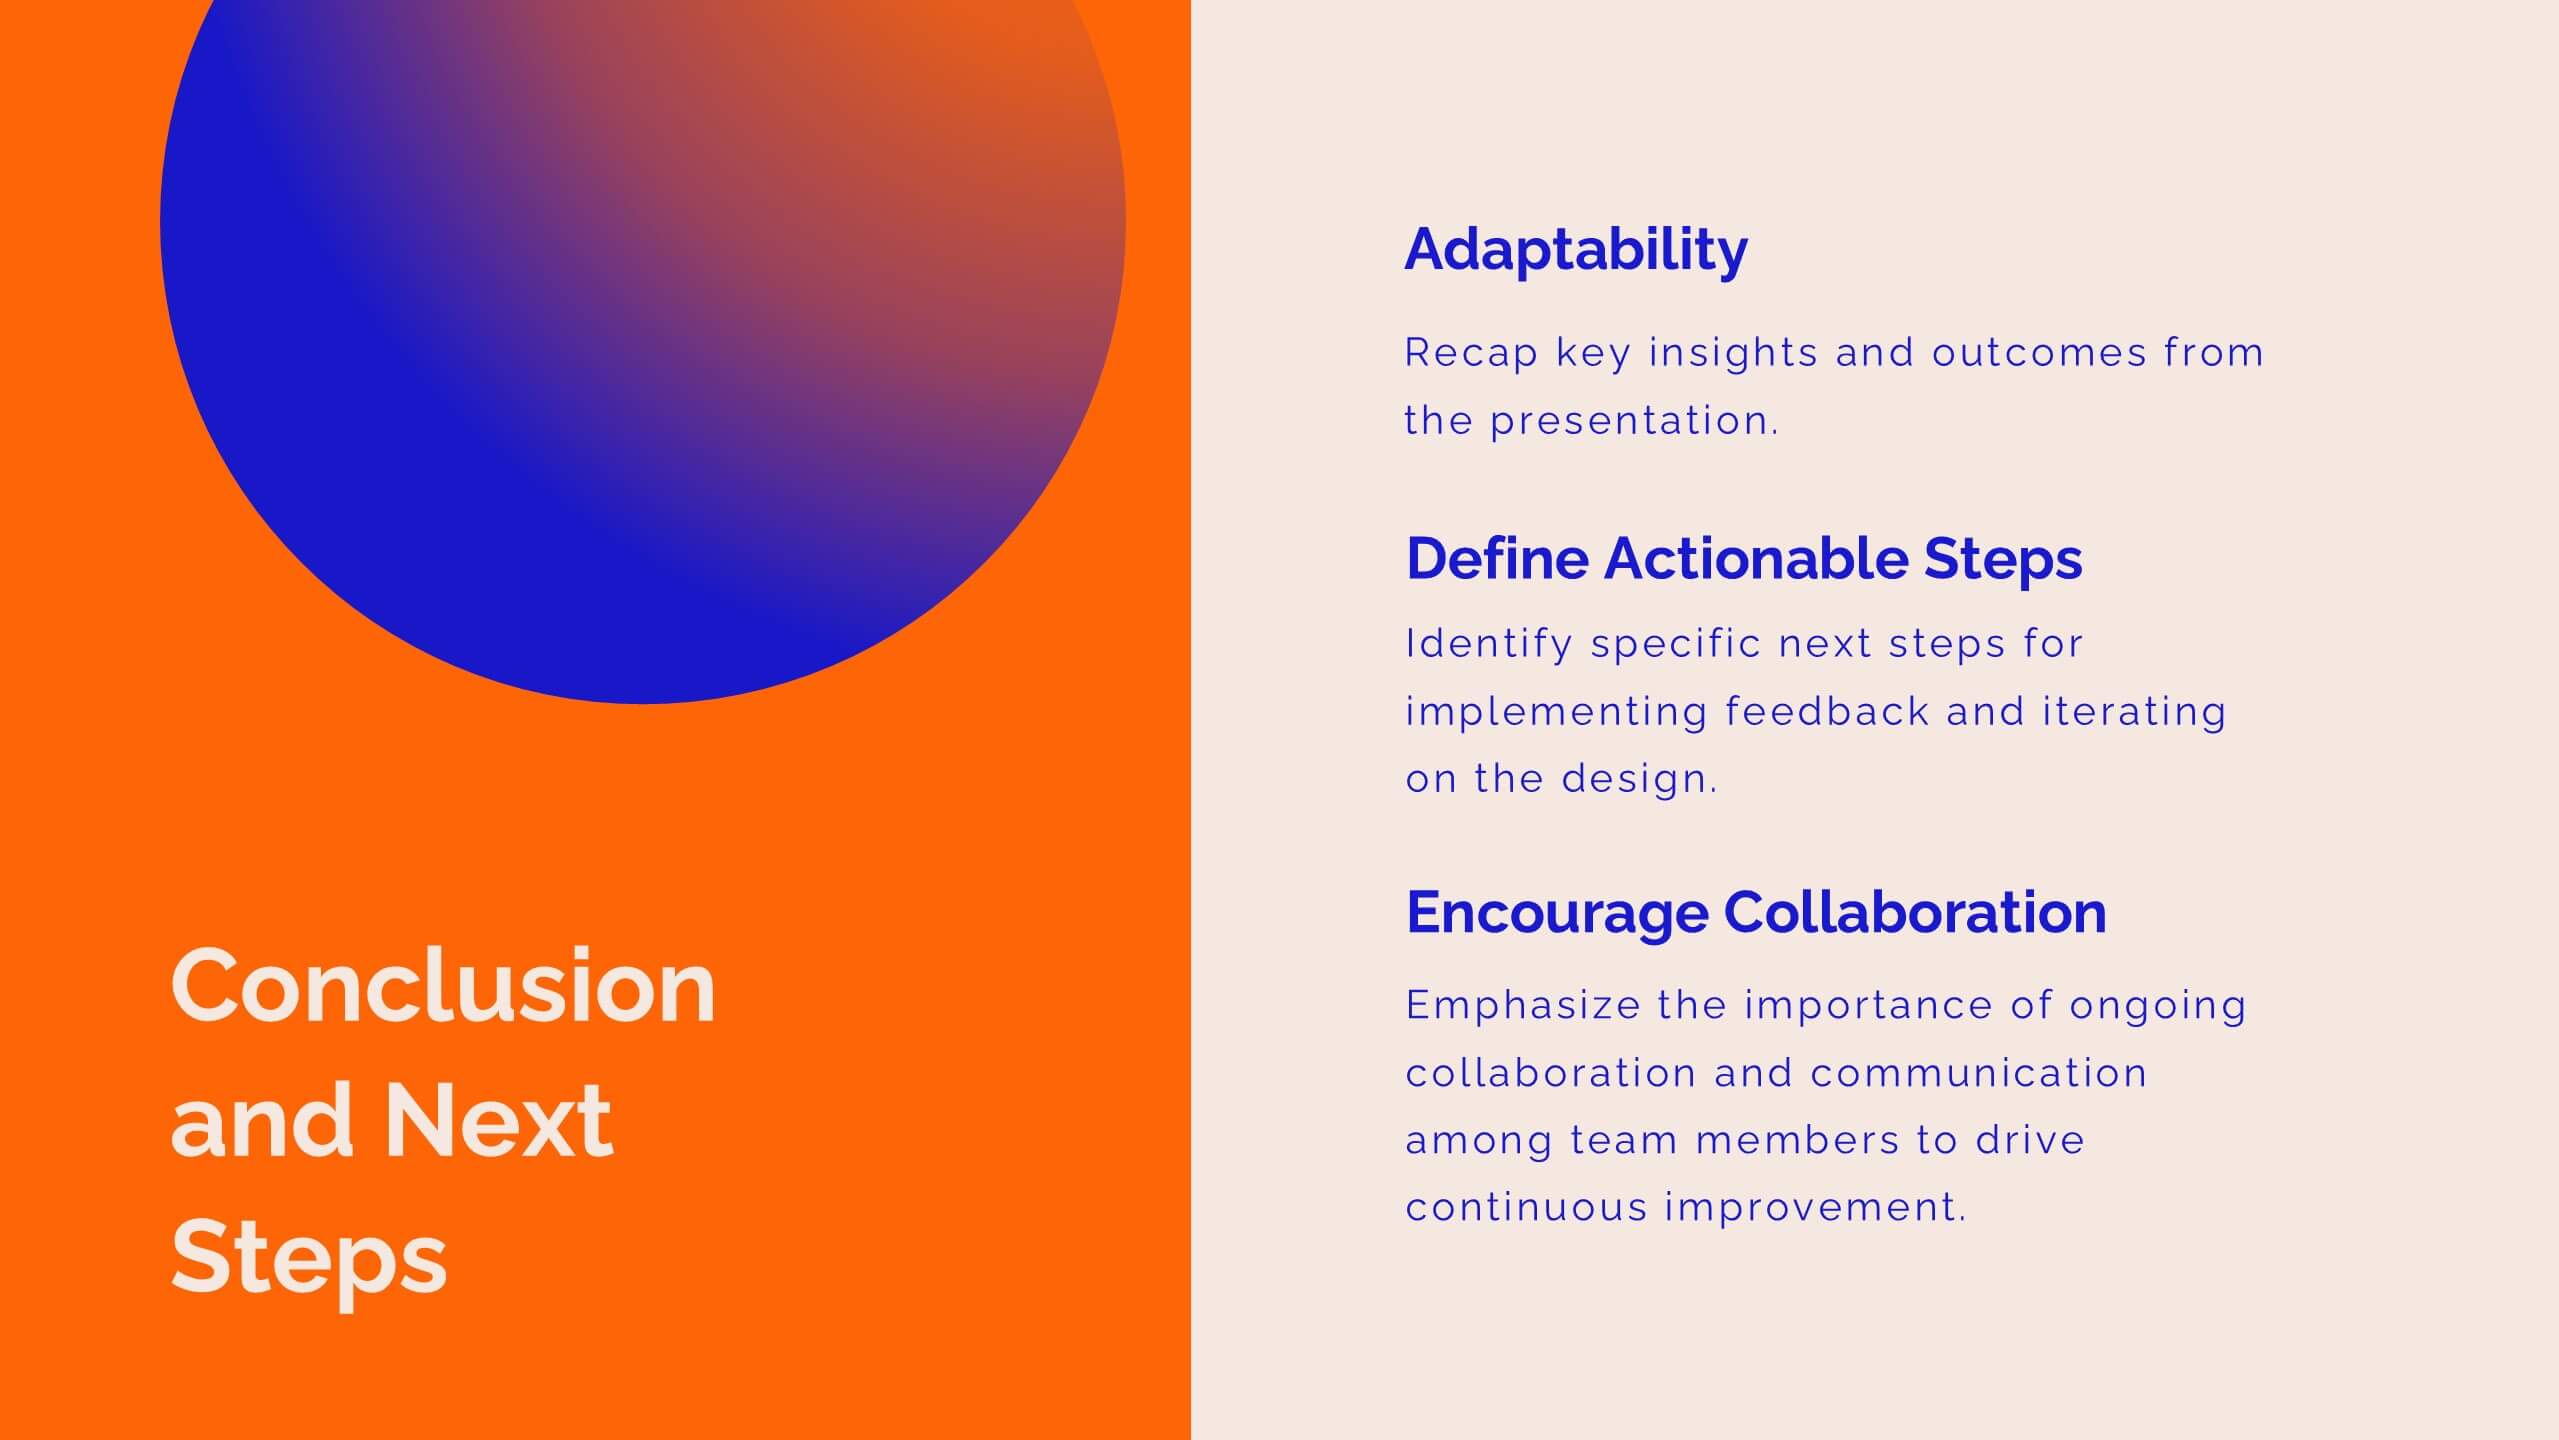
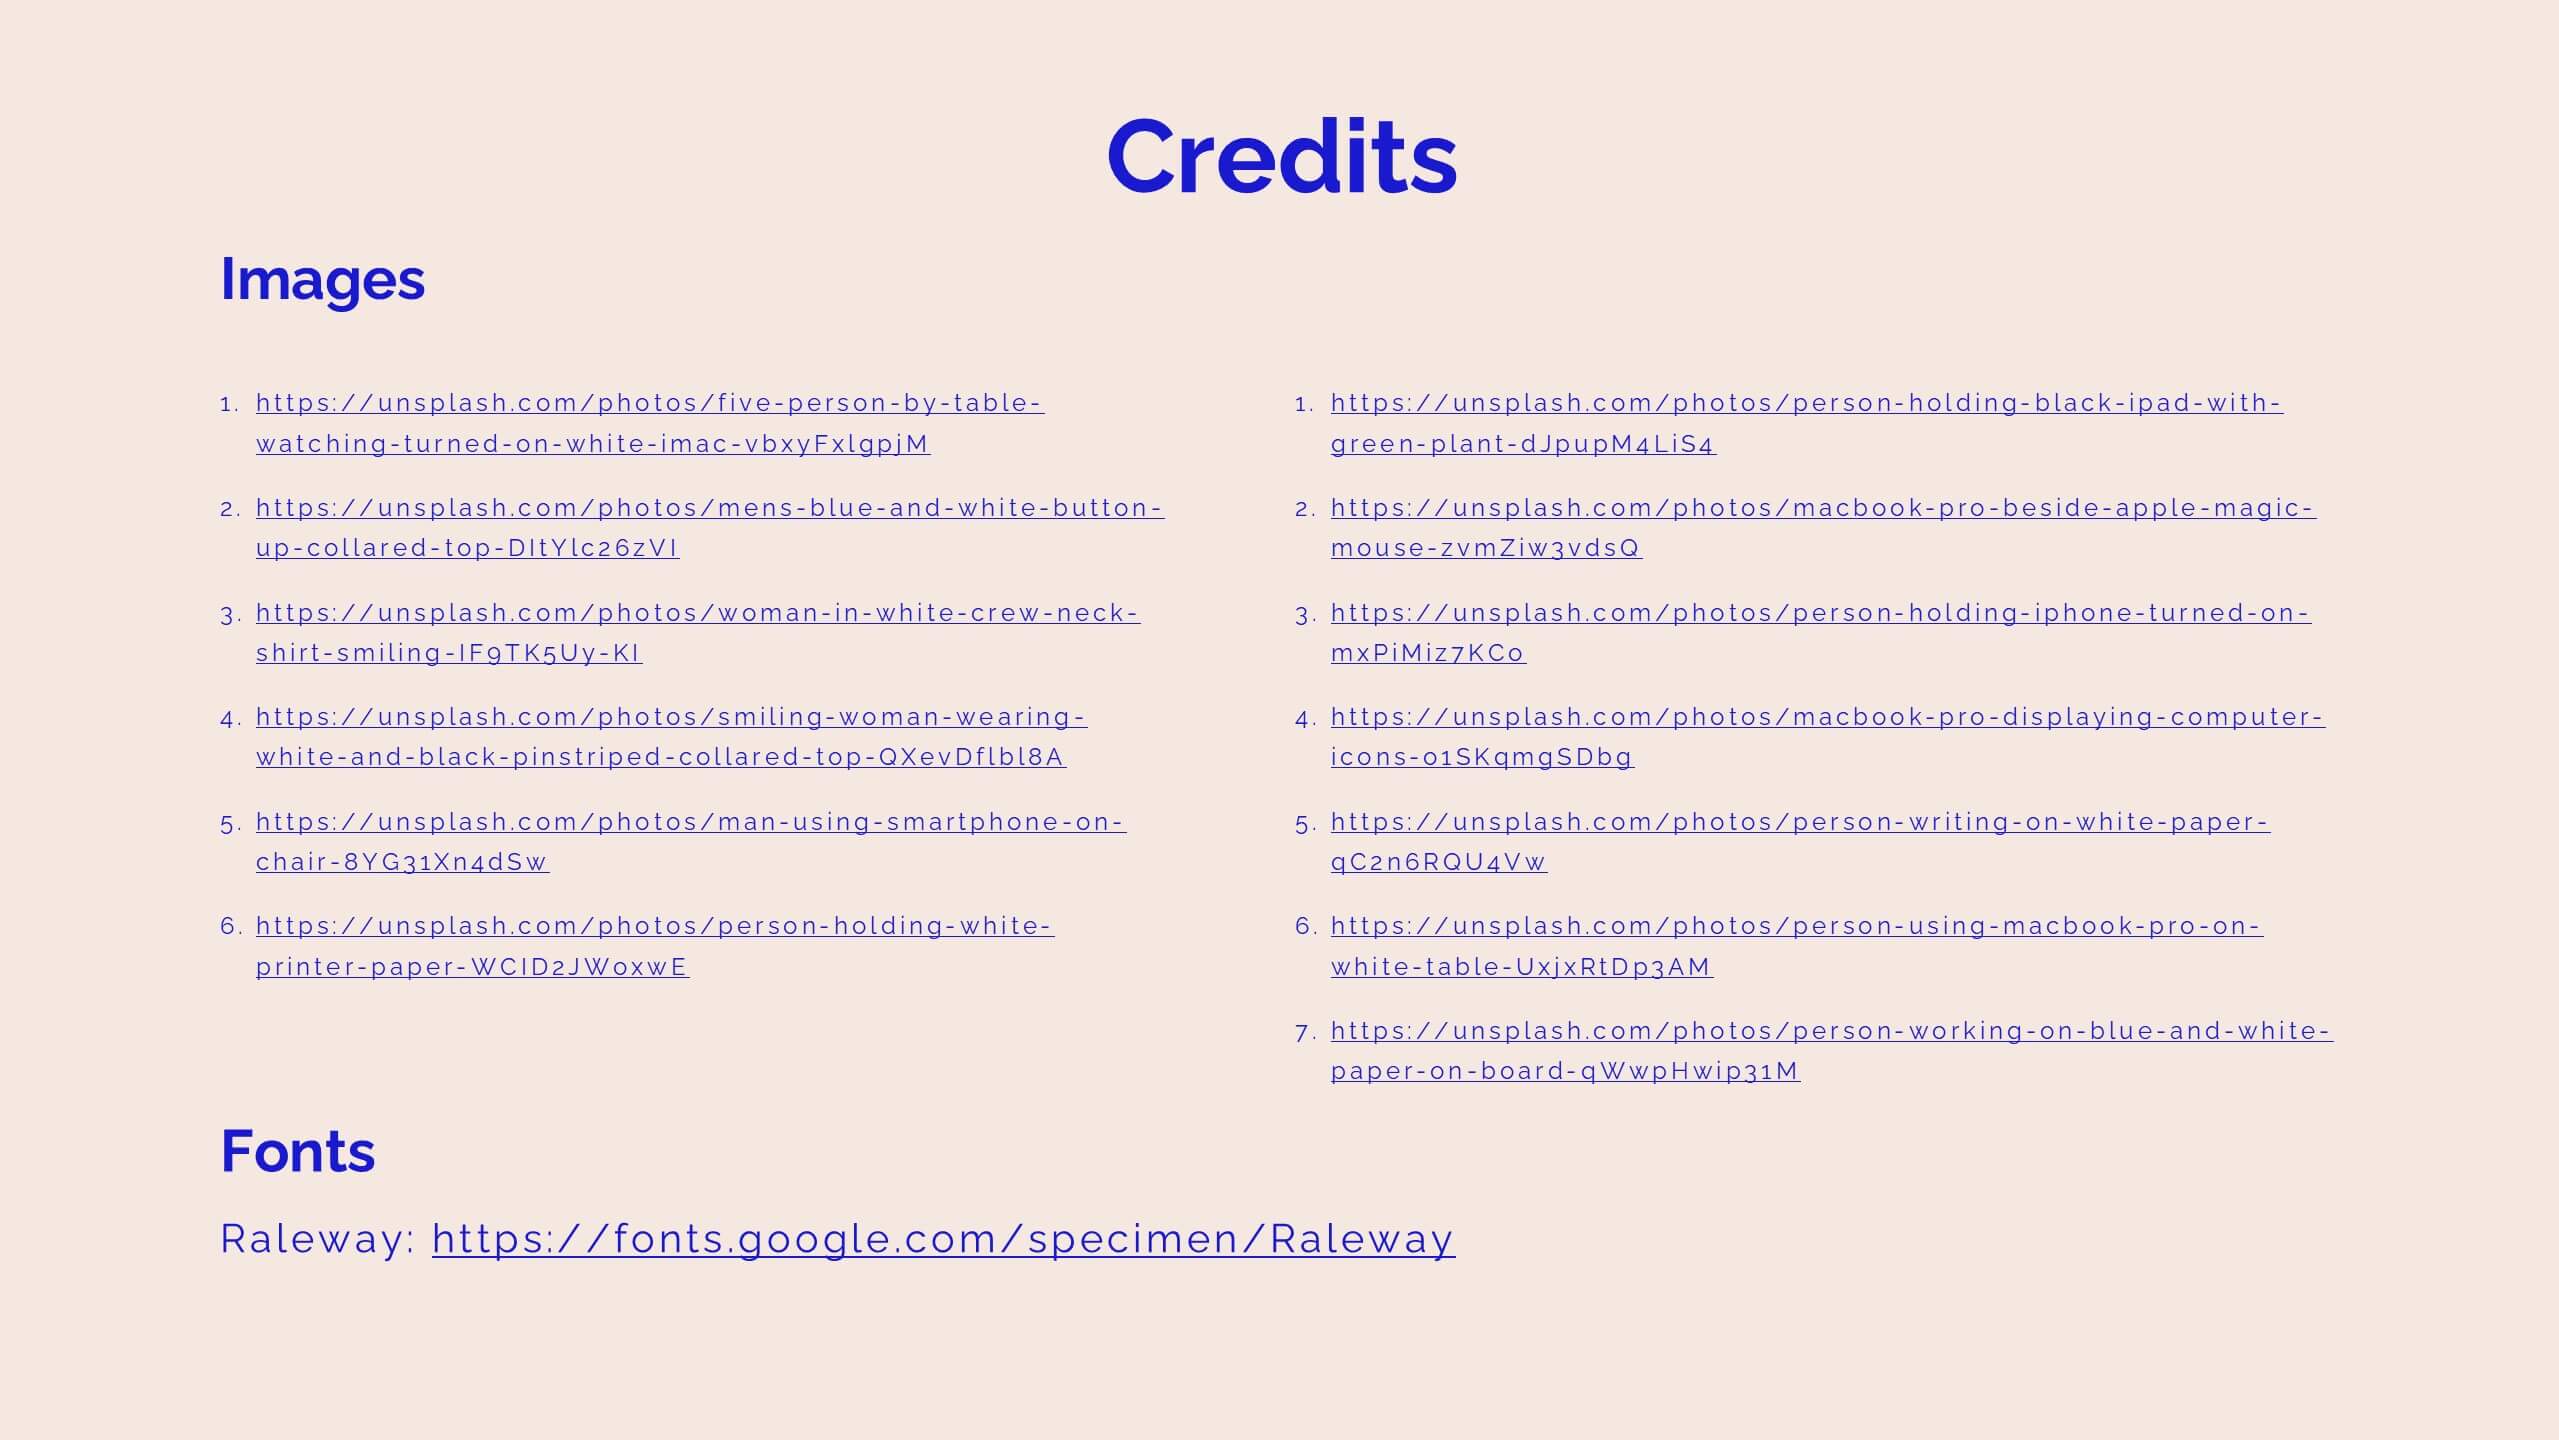
Niobium UX Research Report Presentation
Present your UX research findings with clarity and style using this vibrant UX research report template! It includes sections for user personas, wireframes, user testing, and design principles, making it ideal for sharing research insights. Fully customizable and compatible with PowerPoint, Keynote, and Google Slides, it's perfect for UX professionals and design teams.


10 diapositivas
Medical Anatomy Overview Presentation
Bring your audience into the world of medical insight with a slide that makes anatomy feel clear, modern, and easy to follow. This presentation highlights key organs and body systems in a clean visual layout, helping you explain health data with confidence. Fully compatible with PowerPoint, Keynote, and Google Slides.


5 diapositivas
Client Engagement Journey Touchpoints
Map out every stage of client interaction with the Client Engagement Journey Touchpoints Presentation. This visual slide template highlights four key customer touchpoints, with a central user icon to emphasize the client-centric approach. Ideal for showcasing brand awareness, first contact, engagement strategies, and conversion steps. Easily customizable in PowerPoint, Keynote, and Google Slides.


26 diapositivas
Fitness Company Profile Dark Presentation
Dive into the pulsating realm of fitness, where every sweat drop carves the path to chiseled abs. Imbued in shades of black with electrifying neon accents, our template captures the dark, motivating ambiance of late-night gym sessions. Featuring dynamic graphics, empowering icons, and inspiring image placeholders, it's a testament to determination and grit. Flawlessly curated for Powerpoint, Keynote, or Google Slides. The ultimate asset for fitness trainers, gym enthusiasts, health bloggers, or anyone aiming to inspire a journey towards physical excellence. Push your limits; let every rep ignite your passion.


4 diapositivas
30-60-90 Day Business Plan
Kickstart new roles, projects, or team onboarding with this bold 30-60-90 Day Business Plan template. Designed to outline goals, milestones, and deliverables over three critical phases, this layout is ideal for managers, job candidates, and team leaders. Fully editable in PowerPoint, Keynote, and Google Slides.


2 diapositivas
Elegant Thank You Slide Presentation
Leave a lasting impression with this elegant thank-you slide template! Perfect for closing presentations with professionalism, this design features a modern layout with space for contact details and branding. Ideal for business meetings, pitches, and corporate events. Fully customizable and compatible with PowerPoint, Keynote, and Google Slides for seamless editing.


6 diapositivas
Mental Health Infographics
The "Mental Health" infographic template, suitable for PowerPoint, Keynote, and Google Slides, is an essential resource for healthcare professionals, educators, and mental health advocates. This sensitive and informative template is designed to communicate important aspects of mental health in a compassionate and accessible manner. This template covers critical topics such as mental health awareness, coping strategies, and support resources. It is structured to facilitate discussions on mental well-being, making it an invaluable tool for educational presentations, awareness campaigns, and support group discussions. Featuring a calming and empathetic design, the template uses a soothing color scheme with pastel shades of light blue, green, and lavender. This creates a serene and understanding atmosphere that is supportive of mental health topics. Whether used in a clinical setting, classroom, or community workshop, this template ensures that information about mental health is presented in a sensitive, informative, and visually appealing way.


7 diapositivas
Real Estate Companies Infographic
Real estate companies are organizations that engage in various aspects of the real estate industry, which involves the buying, selling, managing, or investing in properties. Creating an infographic about real estate companies can be a great way to showcase key information, trends, and benefits of various real estate firms. Customize the content, design, and visuals to create an engaging and informative infographic that provides insights into the real estate industry and the leading companies within it. Real estate is a dynamic field, and your infographic can serve as a valuable resource for potential clients and investors.


7 diapositivas
Investment Management Infographic
Investment management, also known as asset management or fund management, involves the professional management of various securities and assets with the goal of achieving specific investment objectives for individuals, institutions, or entities. This infographic will encourage your audience to start or enhance their investment journey for financial prosperity. Customize the content, design, and visuals to craft an engaging and informative infographic that educates about investment management. This infographic should serve as a useful guide for both beginners and those looking to refine their investment strategies.


5 diapositivas
SMART Objectives Slide Presentation
Kick your planning into gear with a bold, structured layout that makes goal-setting feel energetic and achievable. This presentation helps you outline clear objectives, track progress, and communicate strategy with a clean, organized flow designed for teams and leaders. Fully compatible with PowerPoint, Keynote, and Google Slides.


6 diapositivas
Innovative Idea Pitching Guide Presentation
Present your ideas with clarity using the Innovative Idea Pitching Guide Presentation. This dynamic five-step circular flow design is perfect for showcasing pitch stages, idea development, or startup concepts. Each section includes icons and text blocks to clearly explain key points, keeping your message organized and impactful. Fully editable in Canva, PowerPoint, Keynote, and Google Slides.


14 diapositivas
Business Innovation and Idea Development Presentation
Drive Business Innovation and Idea Development with this dynamic and structured template, perfect for illustrating creative processes, strategic growth, and idea execution. Designed with a lightbulb-themed layout, this presentation helps break down complex concepts into clear, engaging sections. Fully customizable and compatible with PowerPoint, Keynote, and Google Slides, making it an essential tool for entrepreneurs, teams, and business leaders looking to present ideas with impact.


7 diapositivas
Marketing Funnel Infographic
Chart your customers' journey with our marketing funnel infographic. Set on a pristine white canvas, enriched with the zest of orange, the insight of purple, the trust of blue, and the growth of green, this template vividly illustrates the stages of a customer's progression towards a purchase. Adorned with clear infographics, emblematic icons, and tailored image placeholders, it offers a panoramic view of conversion pathways. Expertly devised for Powerpoint, Keynote, or Google Slides. A prized possession for marketing professionals, digital strategists, business consultants, or any brand striving for conversion optimization.


6 diapositivas
Create Challenge Infographic
Challenges are obstacles, difficulties, or problems that individuals, organizations, or societies face while trying to achieve their goals or navigate through various situations. This infographic template involves visually presenting a specific challenge, its context, and possible solutions in an informative way. Summarize the key takeaways from the infographic, emphasizing the importance of addressing the challenge and implementing the suggested solutions. An effective challenge infographic can be used for educational purposes, presentations, or as a reference guide to help individuals and teams overcome challenges in a structured and informed manner.


5 diapositivas
Bar, Line, and Pie Chart Combo Layout Presentation
Present multiple data points in one sleek slide with the Bar, Line, and Pie Chart Combo Layout Presentation. This template merges three essential chart types—bar, line, and pie—into a cohesive, easy-to-read format, ideal for reports, comparisons, or trends. Fully editable in PowerPoint, Keynote, Canva, or Google Slides.


10 diapositivas
Business KPI Metrics Dashboard
Maximize your business analysis with our "Business KPI Metrics Dashboard" template. This detailed infographic is designed to clearly present key performance indicators (KPIs) using a variety of charts, including bar graphs, line charts, and histograms. Each chart is color-coded to distinguish different metrics such as sales volume, revenue growth, and customer engagement, facilitating quick understanding and comparison. This layout is ideal for executives, analysts, and managers, supporting data-driven decisions in strategic reviews and planning sessions. Fully compatible with PowerPoint, Keynote, and Google Slides, this template is essential for any business looking to effectively communicate performance trends and insights.


7 diapositivas
Asia Map Economy Infographic
Delve into the economic landscape of Asia with our series of infographic slides designed to outline key economic indicators across the continent. These templates provide a comprehensive visual representation of various economic data, including GDP growth, trade volumes, and sector-specific performance, making them invaluable for analysts, educators, and business professionals. Each infographic features a detailed map of Asia, annotated with data points and statistics that highlight economic trends and disparities between nations. The use of contrasting colors and clear, legible fonts ensures that the information is accessible and engaging. Graphs and charts are integrated within the map, offering a dynamic overview of the economic health of the region. These templates are fully customizable, allowing you to tailor the content to specific presentations or reports. Whether used in academic environments, corporate settings, or public presentations, these slides help to communicate complex economic concepts in a visually appealing and straightforward manner.