


Características


¿Tienes alguna pregunta?
Recomendar


7 diapositivas
E-Learning Infographic Presentation Template
An E-learning Infographic is an informative design that shows all the different ways that e-learning can be used in your classroom, as well as the benefits associated with each one. This infographic illustrates the popularity of e-learning and gives tips for creating compelling learning materials. This template is equipped with all the resources needed to create your e-learning infographic. It comes fully customizable and ready-to-use. This Infographic template provides a bare-bone structure and design, leaving space for you to add your own content and create the best presentation!


7 diapositivas
Organizational Analysis McKinsey 7S Presentation
Explore the core of organizational alignment with our McKinsey 7S Model presentation template. Perfectly crafted for analyzing and optimizing business structures, this template guides you through the seven essential elements: Strategy, Structure, Systems, Shared Values, Skills, Staff, and Style. Its intuitive design ensures effective communication and clarity in your presentations. Optimized for PowerPoint, Keynote, and Google Slides, it's an invaluable tool for consultants and business strategists aiming to enhance internal coherence and performance.


5 diapositivas
South America Location Map Slide Presentation
Highlight your business reach or project data across South America with a clean, professional map layout. This design is perfect for showcasing key locations, regional metrics, or market insights in a visually engaging way. Fully compatible with PowerPoint, Keynote, and Google Slides for effortless customization and presentation.


6 diapositivas
Year-End Company Report Overview Presentation
Summarize your annual results with this modern year-end report slide. Designed to showcase KPIs, growth stats, and financial outcomes, it features clean icons and a clear six-section layout. Ideal for performance reviews or stakeholder updates. Fully editable and compatible with PowerPoint, Keynote, and Google Slides for quick customization.


19 diapositivas
Zenith Sales Proposal Presentation
Get ready to blow your clients away with this electrifying sales proposal template! Packed with sections on project scope, bold objectives, timelines, and jaw-dropping pricing, it’s designed to make a powerful impact. The sleek, cutting-edge design ensures you’ll leave a lasting impression. Fully compatible with PowerPoint, Keynote, and Google Slides!


4 diapositivas
Professional Team Profiles and Roles Presentation
Showcase your team with impact using the Professional Team Profiles and Roles Presentation. Ideal for company introductions, this slide highlights key members with photo, name, title, and a brief role description. Clean, modern layout makes it easy to customize in PowerPoint, Canva, or Google Slides to match your brand.


6 diapositivas
Six Sigma Process Improvement Presentation
Dive into efficiency with our Six Sigma Process Improvement template! This presentation guide maps out each step from Define to Control, ensuring your project targets are met with precision. Ideal for quality assurance and process optimization, it's compatible with PowerPoint, Keynote, and Google Slides. Perfect for professionals keen on streamlining operations and enhancing productivity.


28 diapositivas
Pitch Deck Entrepreneur's Canvas Presentation
Sharpen your business presentation with this Pitch Deck template. It covers essential areas such as market opportunity, business model, and competitive analysis, designed for startups and entrepreneurs. Fully customizable and compatible with PowerPoint, Keynote, and Google Slides, it's ideal for impressing investors and partners with your business vision.


20 diapositivas
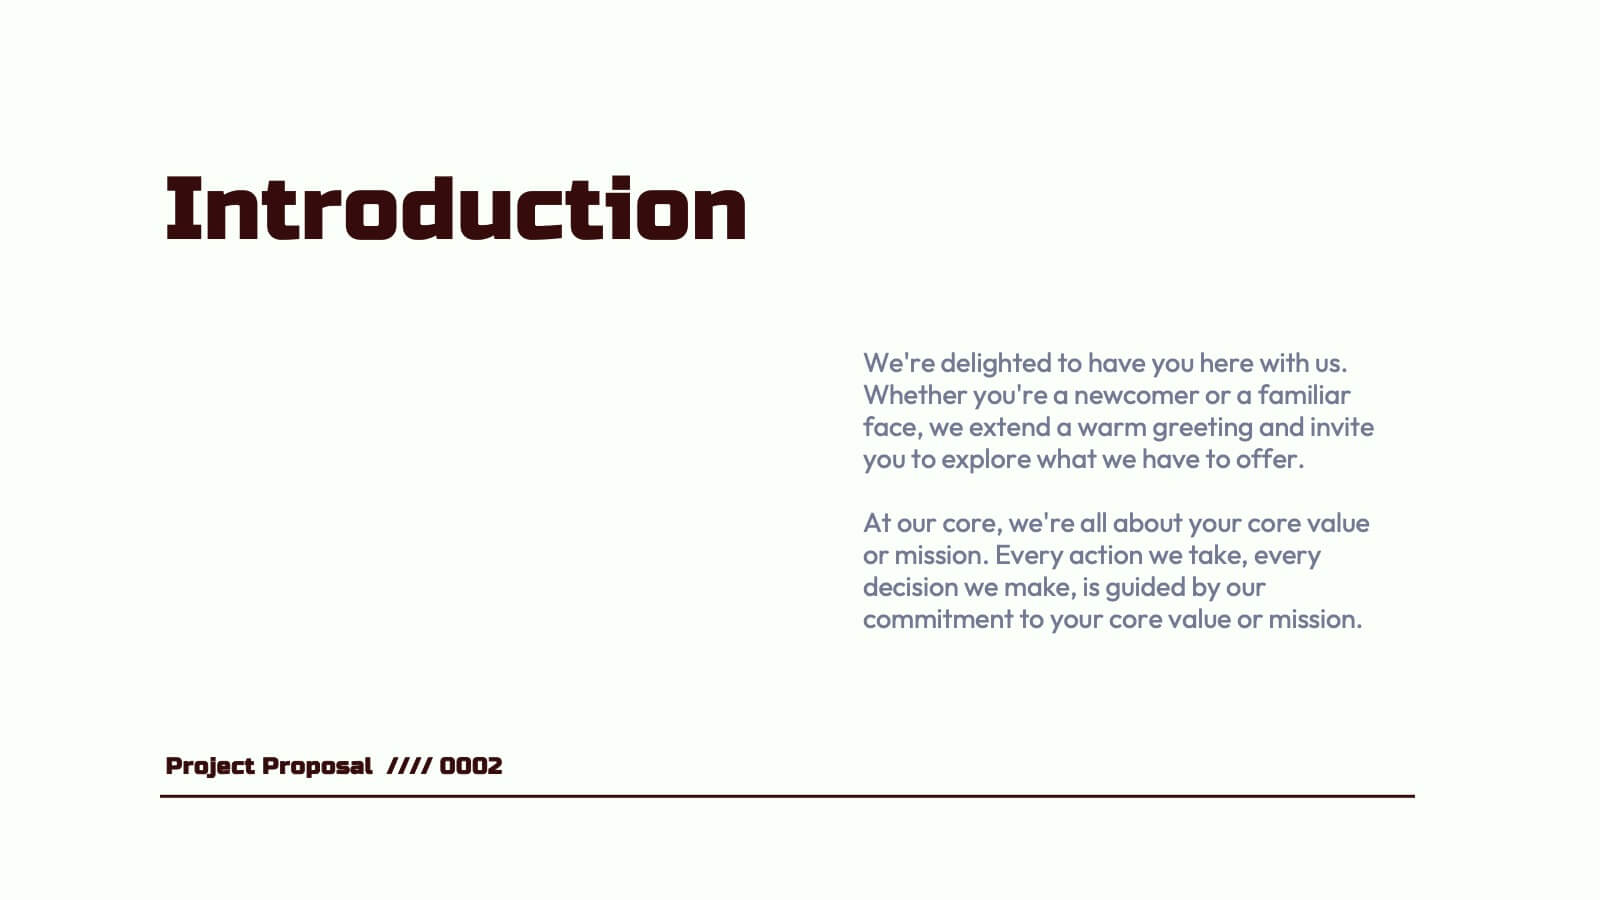
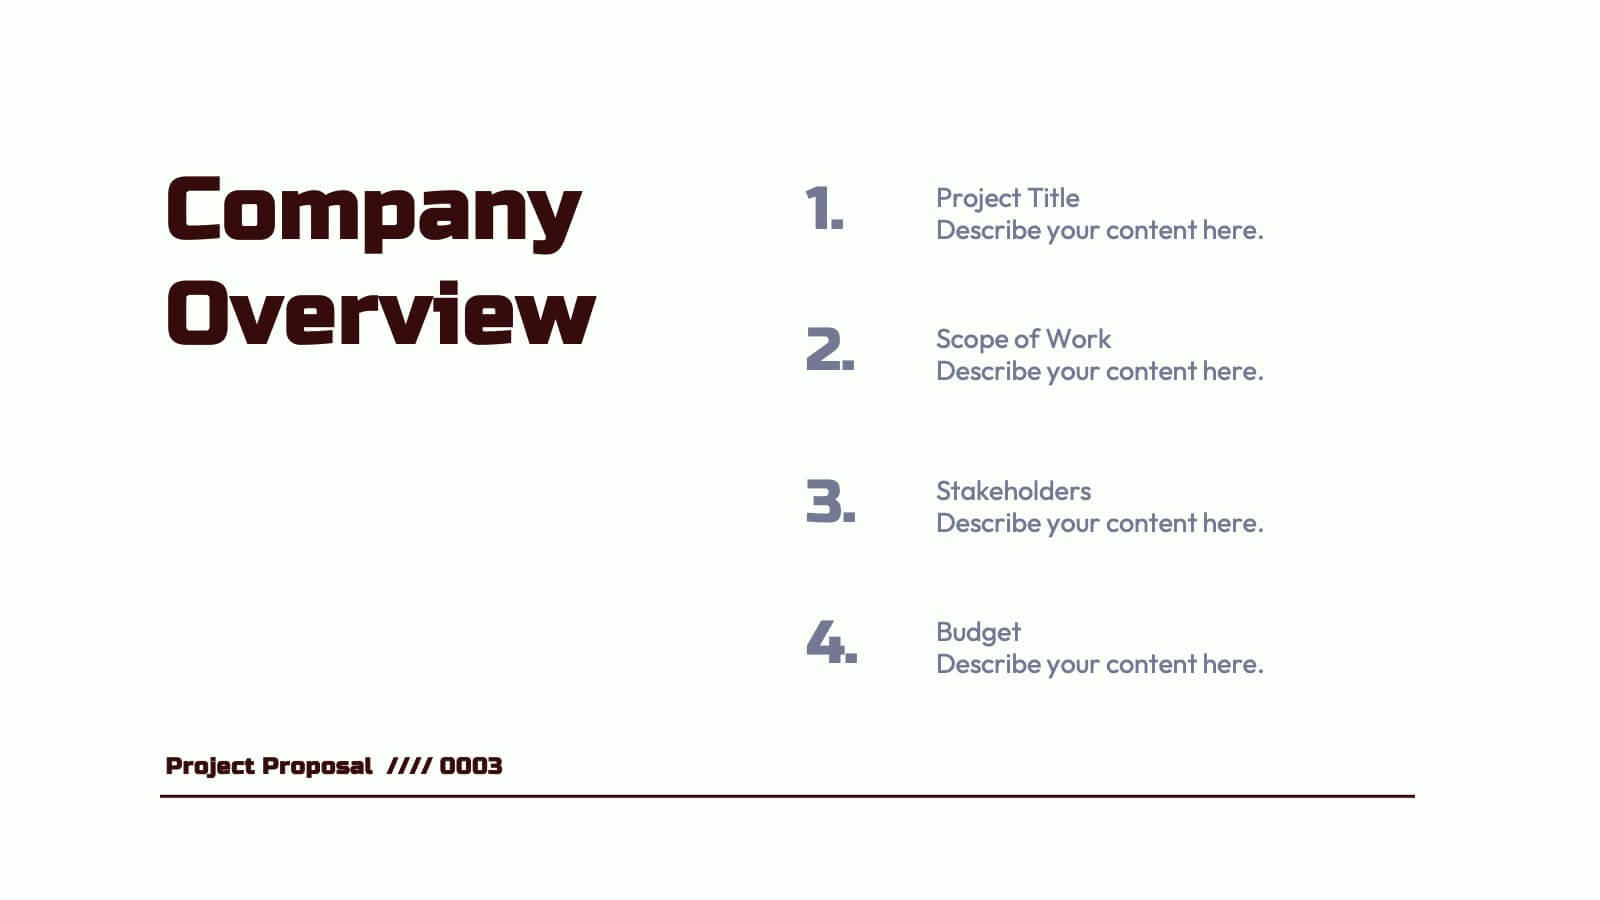
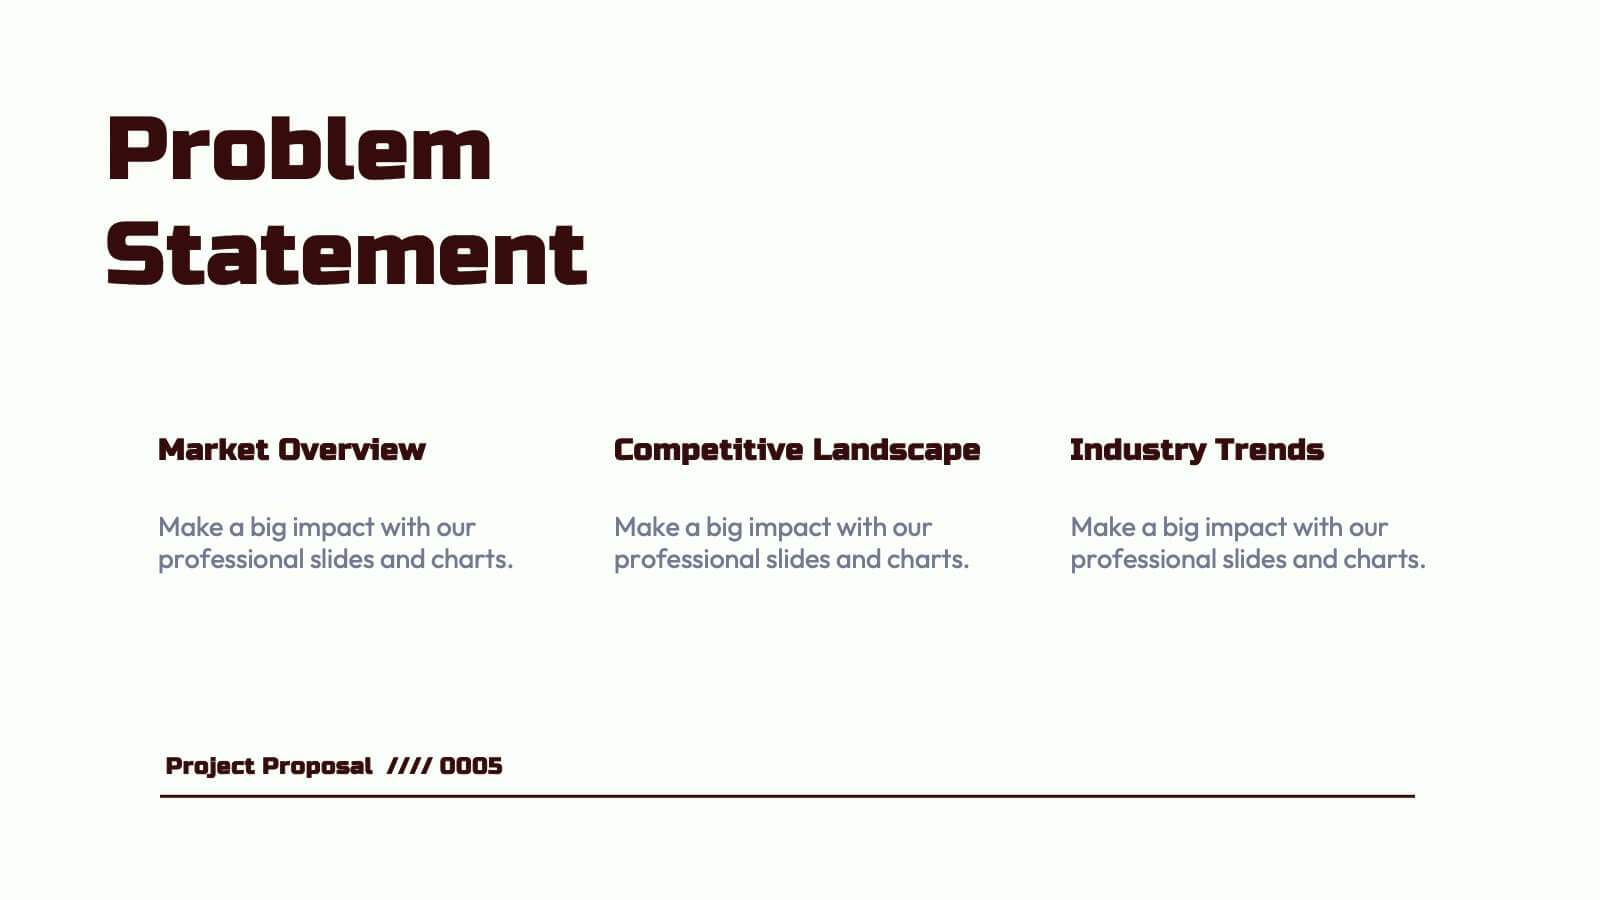
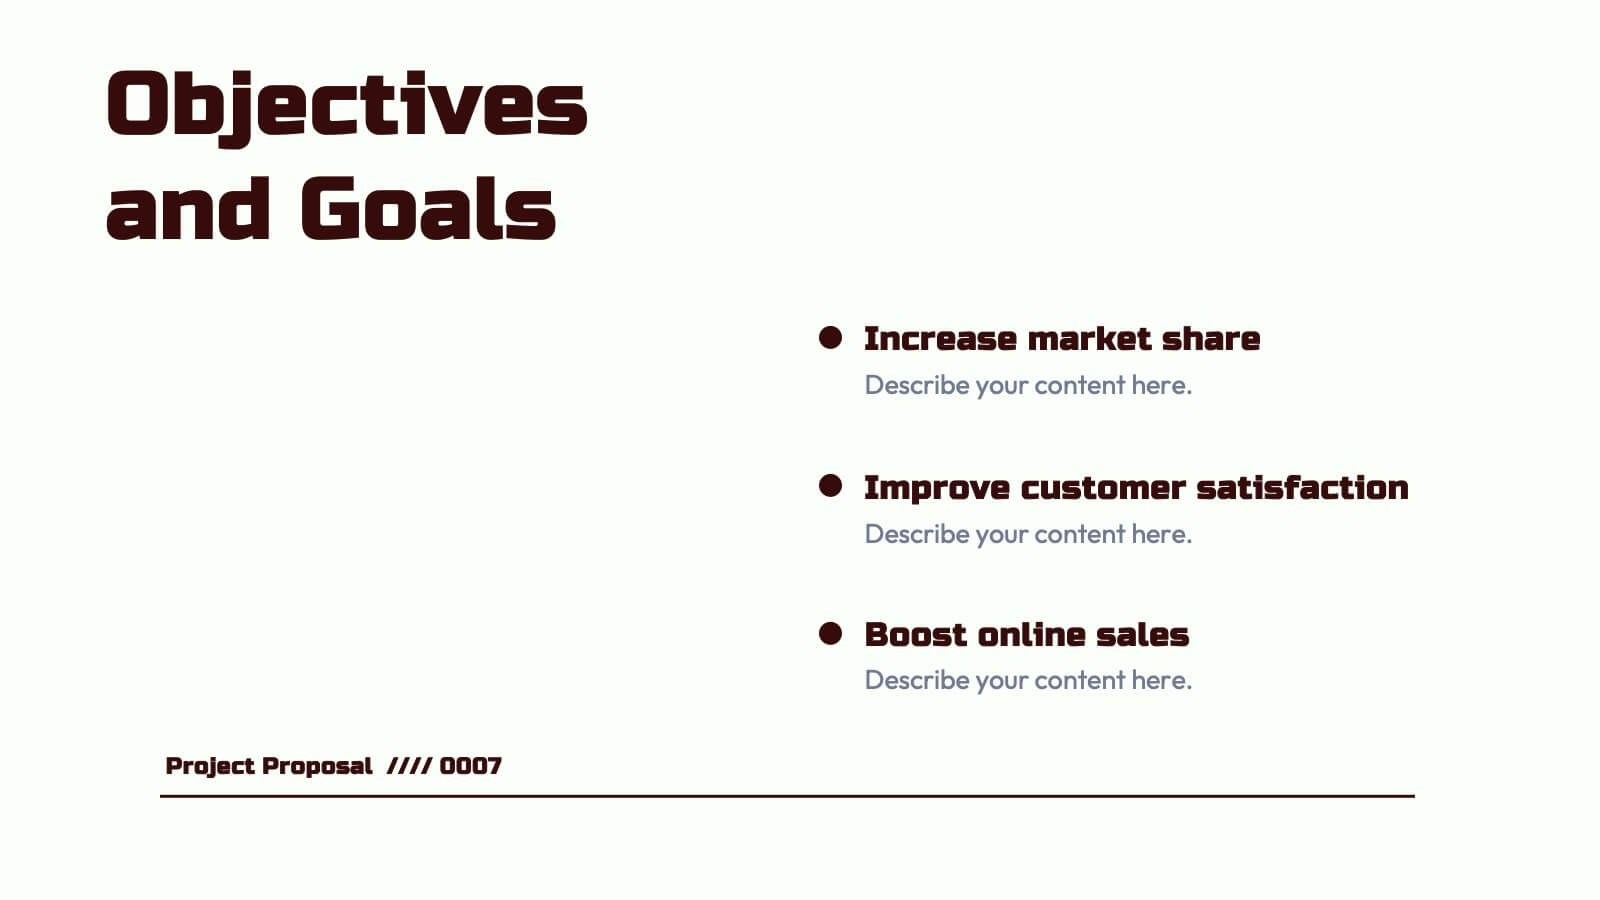
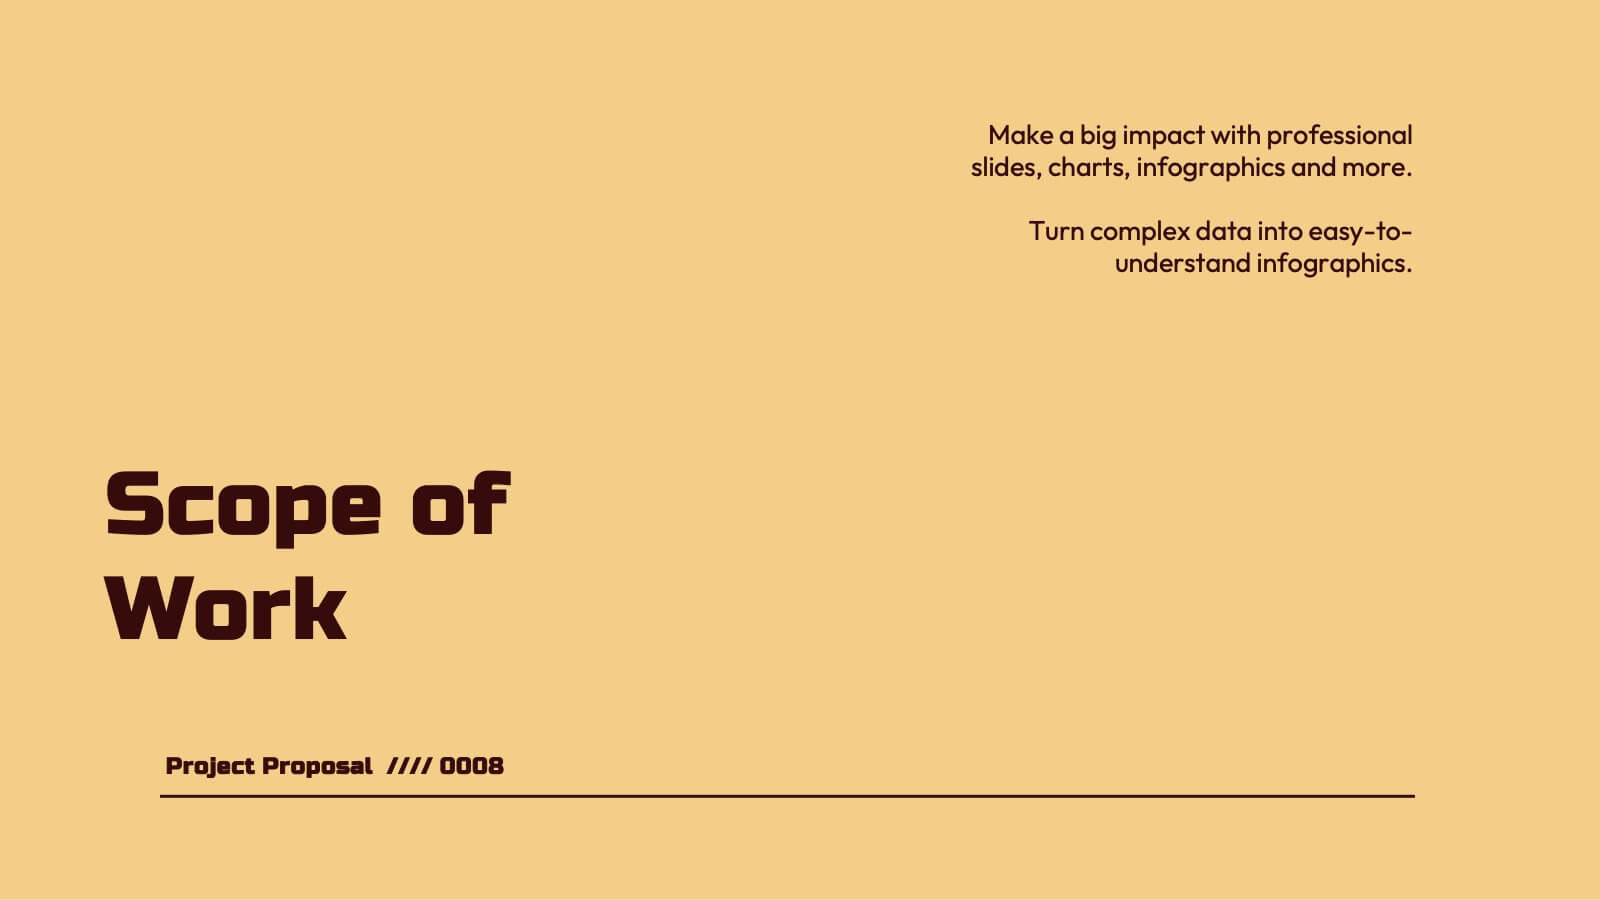
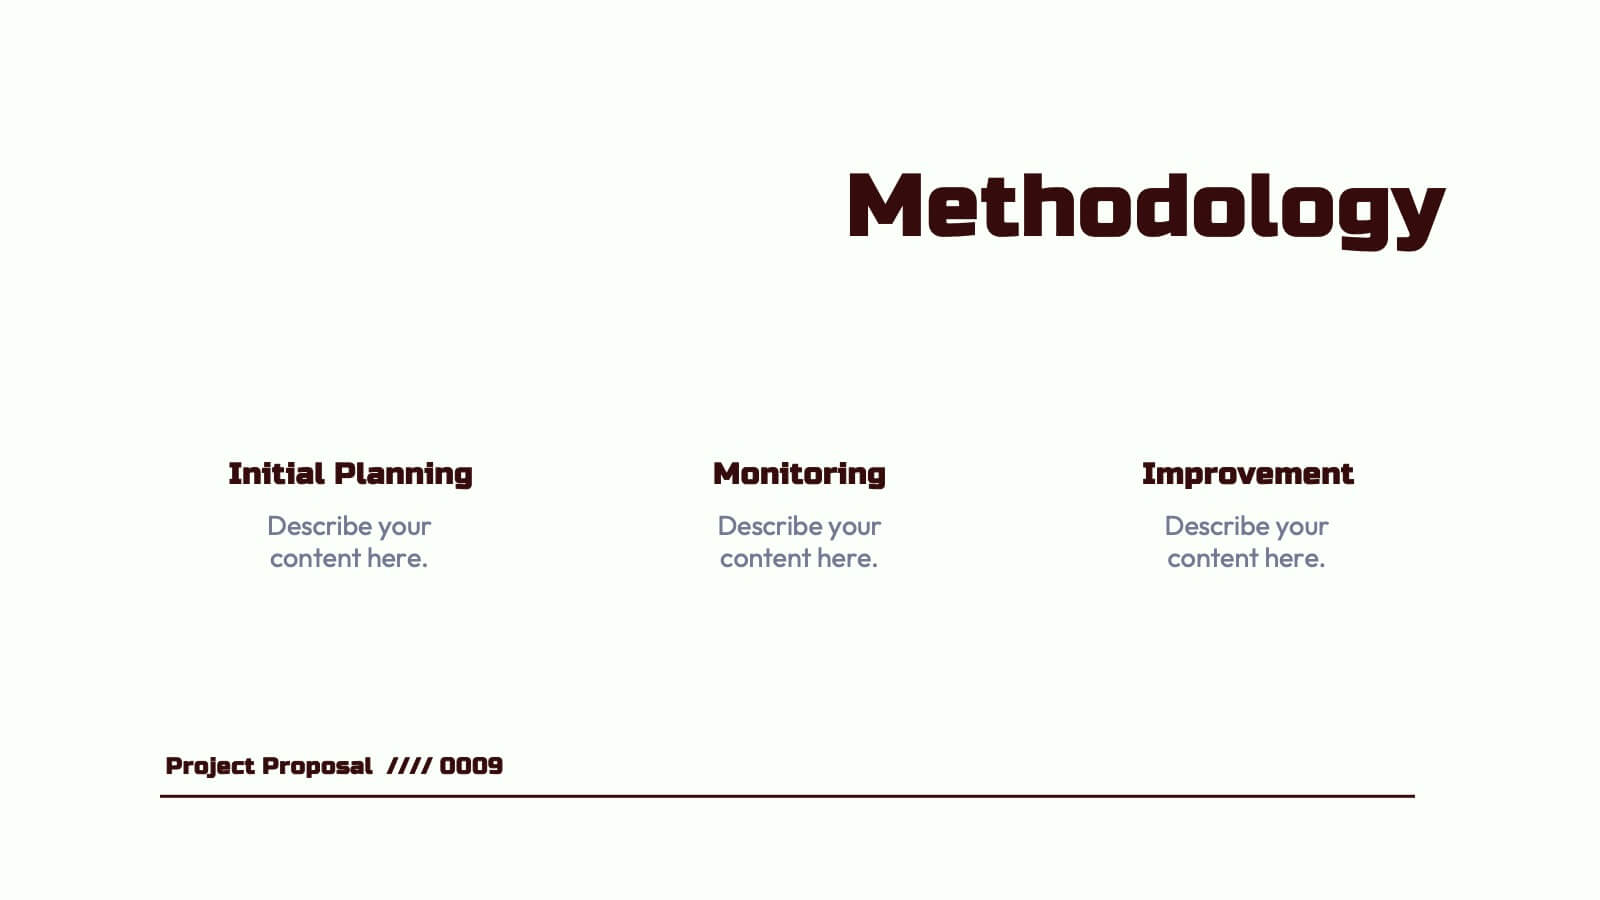
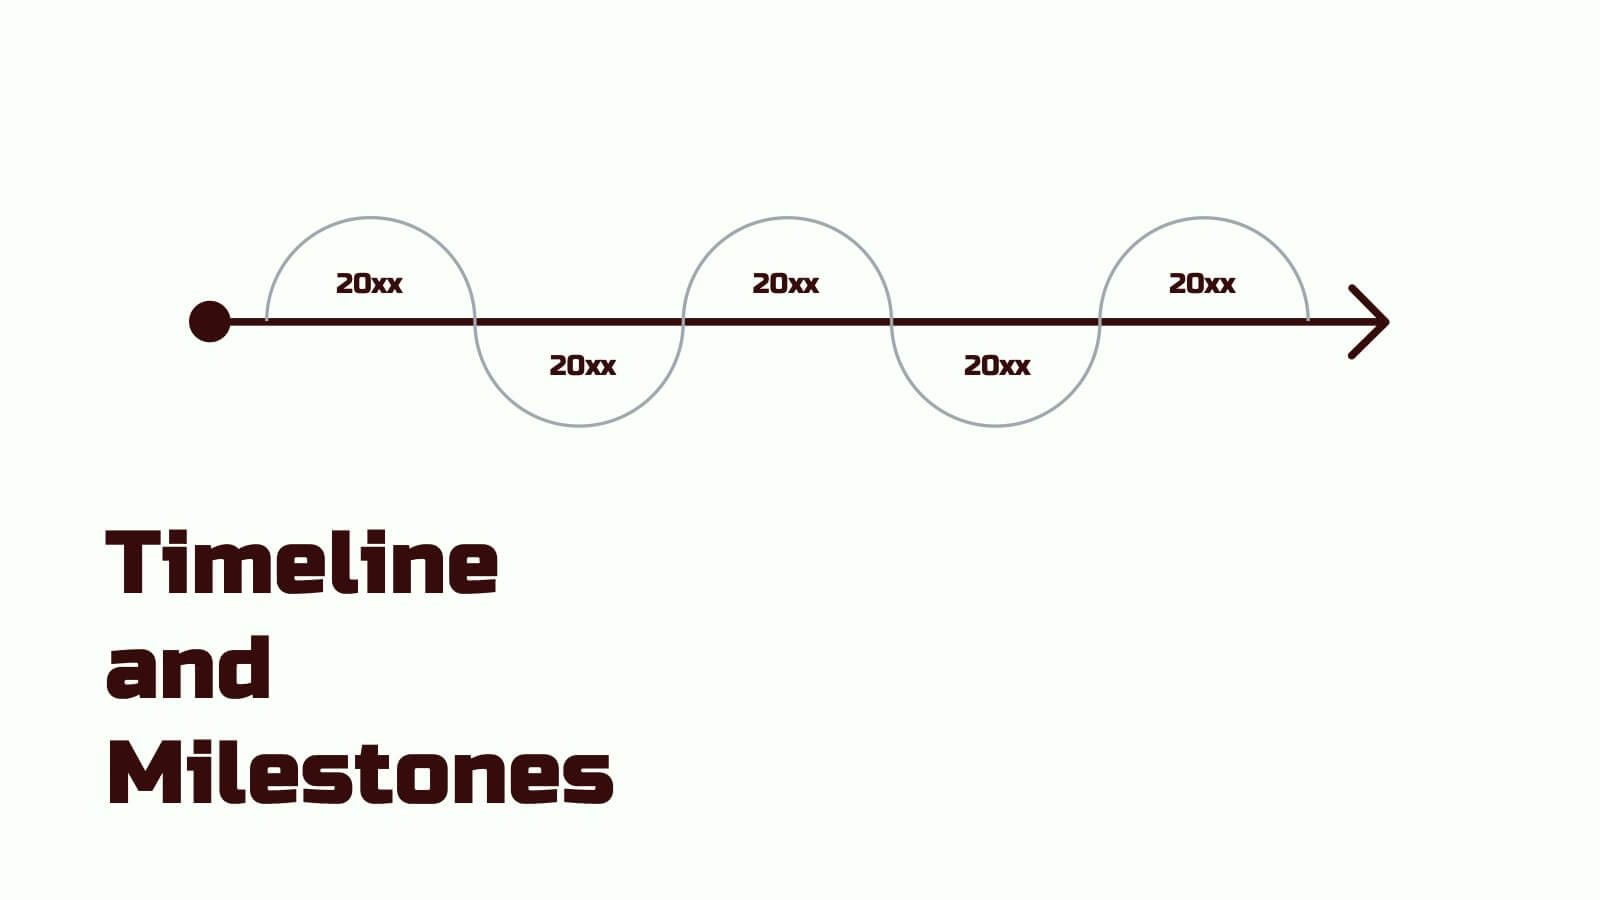
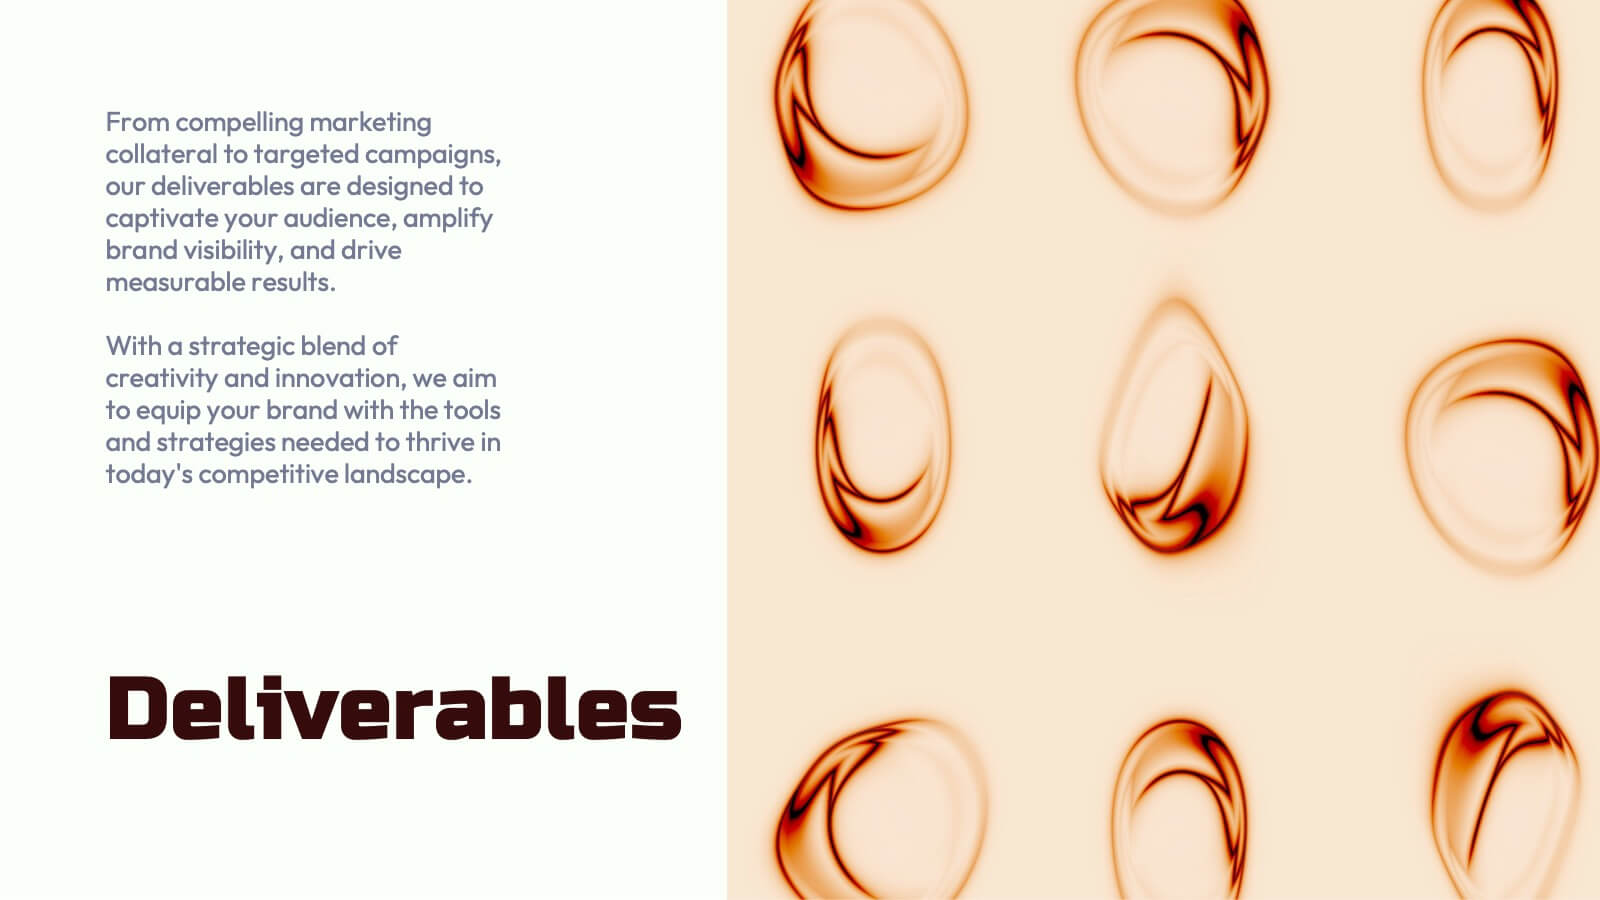
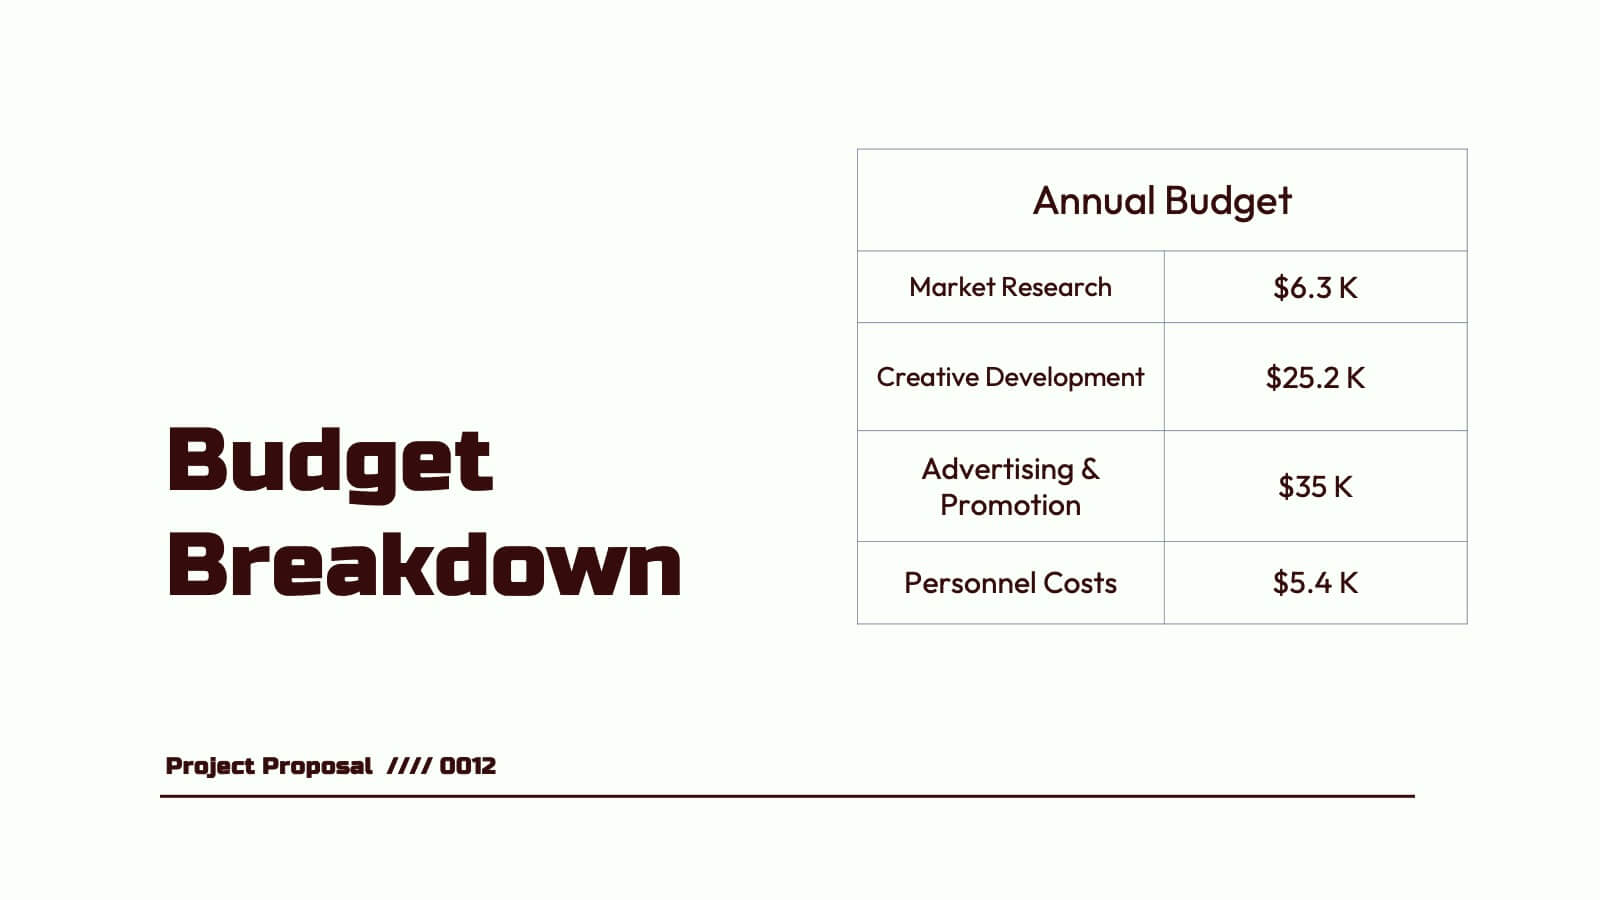
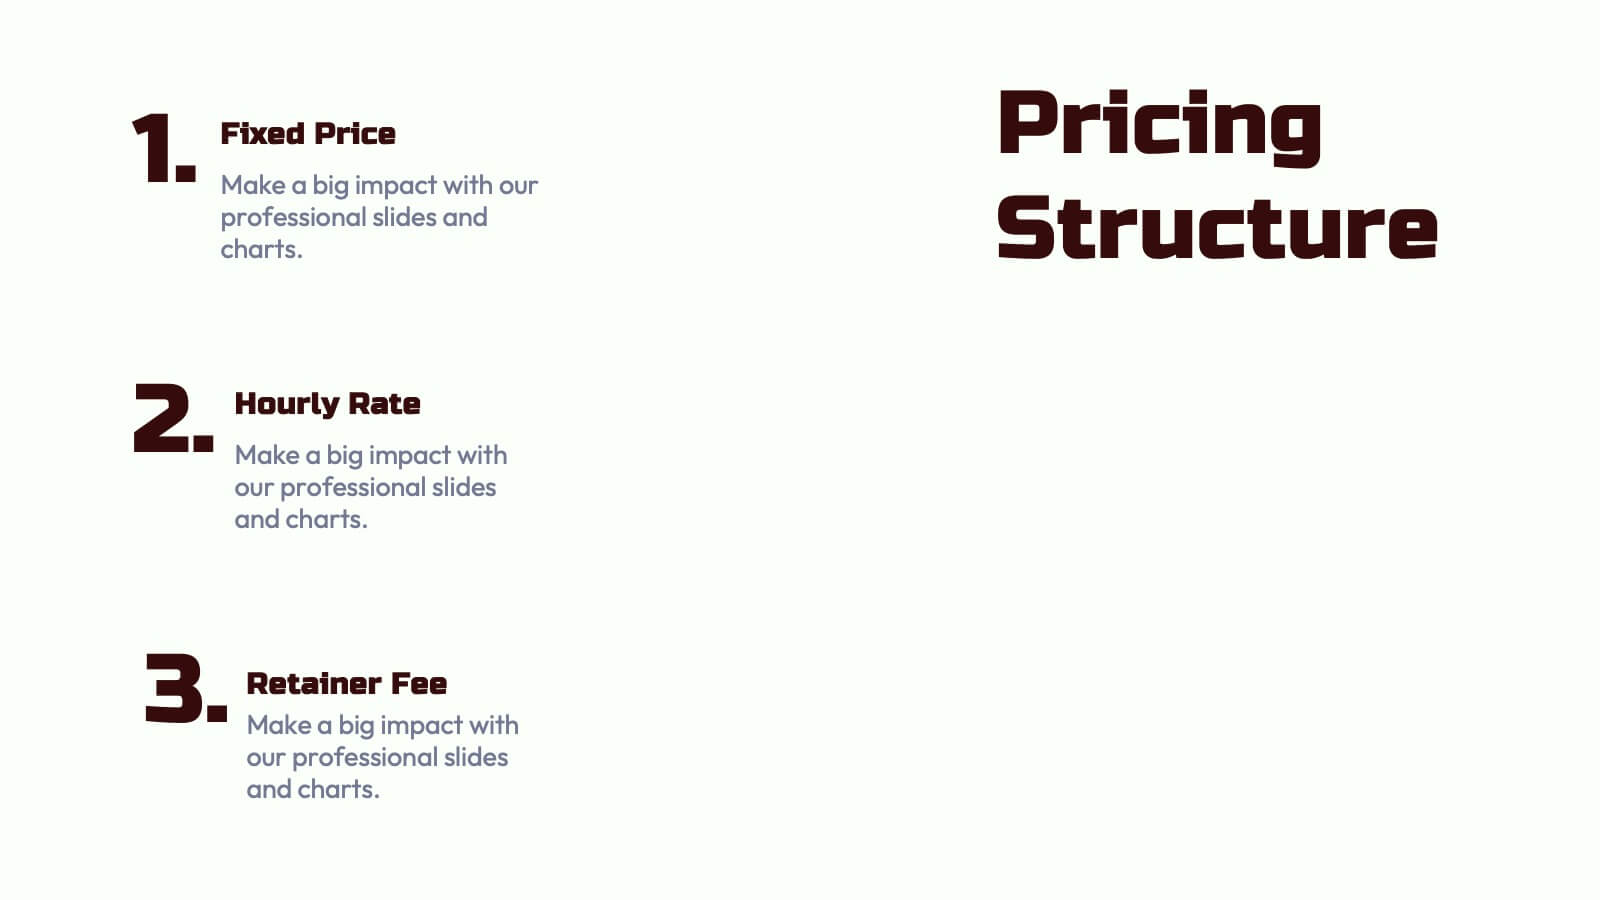
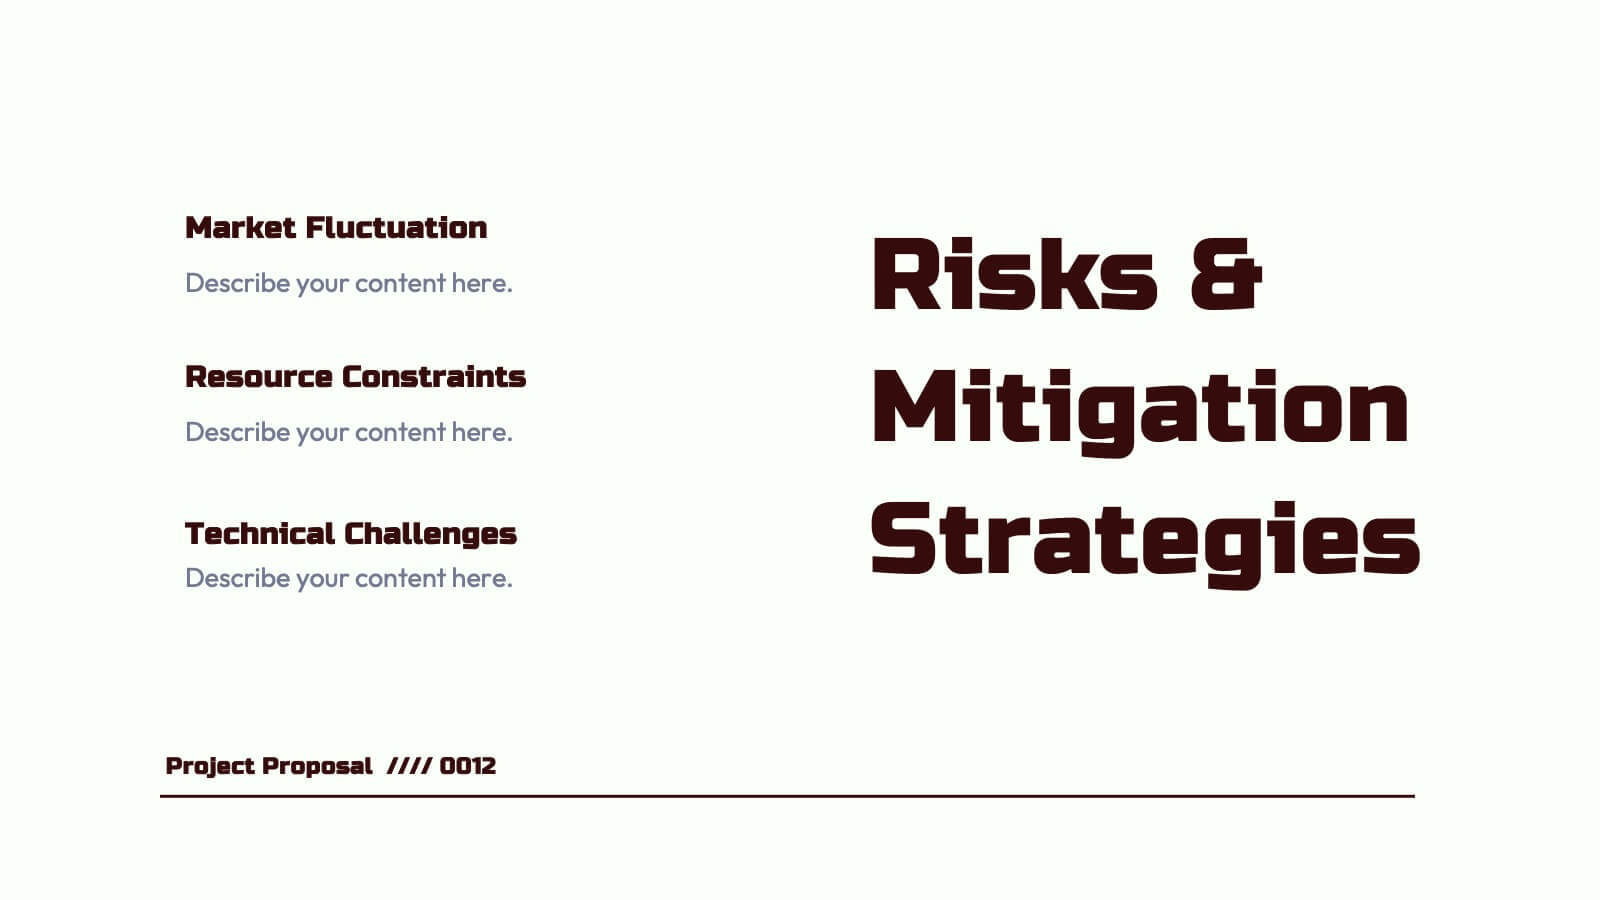
Nebula Project Proposal Presentation
Create a compelling project proposal with this structured, professional template! It includes sections for problem statements, proposed solutions, goals, timelines, and pricing. Perfect for organizing your ideas clearly and professionally, it's fully customizable and compatible with PowerPoint, Keynote, and Google Slides. This template makes it easy to present your proposals effectively and win clients.


5 diapositivas
Corporate Office Life Illustration Scene Presentation
Bring your workplace concepts to life with this modern office scene illustration. Featuring a top-down view of diverse team members in a meeting, this slide is perfect for showcasing collaboration, brainstorming, or teamwork insights. Fully customizable and compatible with PowerPoint, Keynote, and Google Slides for seamless editing.


20 diapositivas
Chordstream Professional Portfolio Showcase Presentation
The Portfolio Presentation Template offers a modern and creative design, perfect for showcasing your projects, philosophy, and services. With 20 customizable slides, it includes sections for project highlights, pricing, client testimonials, and contact information. Compatible with PowerPoint, Keynote, and Google Slides, this template ensures professional impact for creatives.


4 diapositivas
Side by Side Comparison Presentation
Enhance your presentations with our "Side by Side Comparison Presentation" template. Designed for clarity, this infographic facilitates effective comparison of key business insights across multiple categories using a side-by-side layout. Color-coded arrows distinctly mark each comparison point, ensuring easy navigation and comprehension. Ideal for strategic reviews, product comparisons, or competitive analyses, this template helps present complex data clearly and engagingly. Its structured format is perfect for professionals looking to articulate differences and similarities effectively. Fully compatible with PowerPoint, Keynote, and Google Slides, it's an indispensable tool for those needing to present comparative data succinctly and persuasively.


7 diapositivas
Risk Management Infographic Presentation Template
Risk management is a process used by businesses to identify, understand, and deal with potential risks. It is an important process that empowers a business. Risk management, as part of overall business strategy, helps to keep a company focused on its long-term goals. This template provides you with suggested risk management strategies that can help you in bolstering your business. This template is a great way to introduce and practice risk management skills It is packed with all the necessary information. This template is designed to help you identify, assess and control risks in your project.


4 diapositivas
Performance Metrics Dashboard Visual
Track performance at a glance with the Performance Metrics Dashboard Visual Presentation. This clean and professional slide layout features a combination of line charts and circular progress visuals to help showcase trends, percentages, and progress toward goals. Ideal for business updates, KPI reviews, and operational reports. Fully editable in PowerPoint, Keynote, and Google Slides for seamless customization.


7 diapositivas
5G Benefits Infographic
Step into the ultra-fast world of 5G with our vibrant 5G benefits infographic. Set against a lively pink backdrop with bursts of other vivid colors, this infographic captures the essence of dynamism and speed. Sleek icons paired with concise descriptions highlight the myriad advantages of 5G, from lightning-fast downloads to broader bandwidth. This modern, innovative infographic is ideal for telecom companies, tech enthusiasts, businesses leveraging 5G, and educators discussing modern communication technologies. Designed for adaptability, it's compatible with PowerPoint, Keynote, and Google Slides.


6 diapositivas
Annual Corporation Report Infographics
Our Annual Corporation Report infographic is an optimal visual enhancement for presentations in Powerpoint, Keynote, and Google Slides, tailored for corporate executives, financial analysts, and stakeholders. This infographic is meticulously designed to present annual financial and operational data in a structured and easily interpretable manner. The infographic provides a visual summary of an organization's yearly performance, including financial figures, growth metrics, and key performance indicators (KPIs). Its layout is engineered to present complex data in a digestible format, facilitating quick comprehension and analysis of the company's annual achievements and areas for improvement. Incorporating this infographic into your annual report presentations will not only streamline the communication of your corporation's yearly outcomes but also enable your audience to better grasp the strategic insights derived from this data. Whether you're reviewing revenue streams, expenditure, or performance benchmarks, this infographic will serve as a powerful tool to convey your message with clarity and precision.


7 diapositivas
Union Venn Diagram Infographic
Venn Diagrams are a great way to display your data in an organized, aesthetically pleasing way. This infographic template is perfect for any presentation that requires a Venn Diagram. This template is designed to visually demonstrate the impact of your company's efforts. Use this to show how different teams work to achieve goals, or how different departments work together to create something new. Compatible with Powerpoint, Keynote, and Google Slides. This infographic uses a cool, bold color scheme and fun imagery to show the relationship between two or more sets of data in a way that will help you easily explain it to your target audience.