


Características


¿Tienes alguna pregunta?
Recomendar


5 diapositivas
Organizational Tree Model
Present team structures or company hierarchies with ease using this Organizational Tree Model slide. With five clearly defined roles branching from a central trunk, it’s perfect for visualizing leadership flow, reporting lines, or role responsibilities. Fully editable in PowerPoint, Keynote, and Google Slides.


6 diapositivas
Simple Horizontal Timeline Design Presentation
Bring your story to life with a smooth, step-by-step visual that guides viewers through key events with clarity and ease. This presentation helps you outline timelines, processes, or project stages in a clean horizontal flow that’s simple to follow and easy to customize. Fully compatible with PowerPoint, Keynote, and Google Slides.


26 diapositivas
Cutting-Edge AI Breakthroughs Presentation
Step into the future with this exciting presentation on cutting-edge AI breakthroughs. Covering advancements in machine learning, automation, ethical AI, and real-world applications, this template helps you present complex innovations with clarity and impact. Fully customizable and compatible with PowerPoint, Keynote, and Google Slides for a seamless and engaging presentation experience.


8 diapositivas
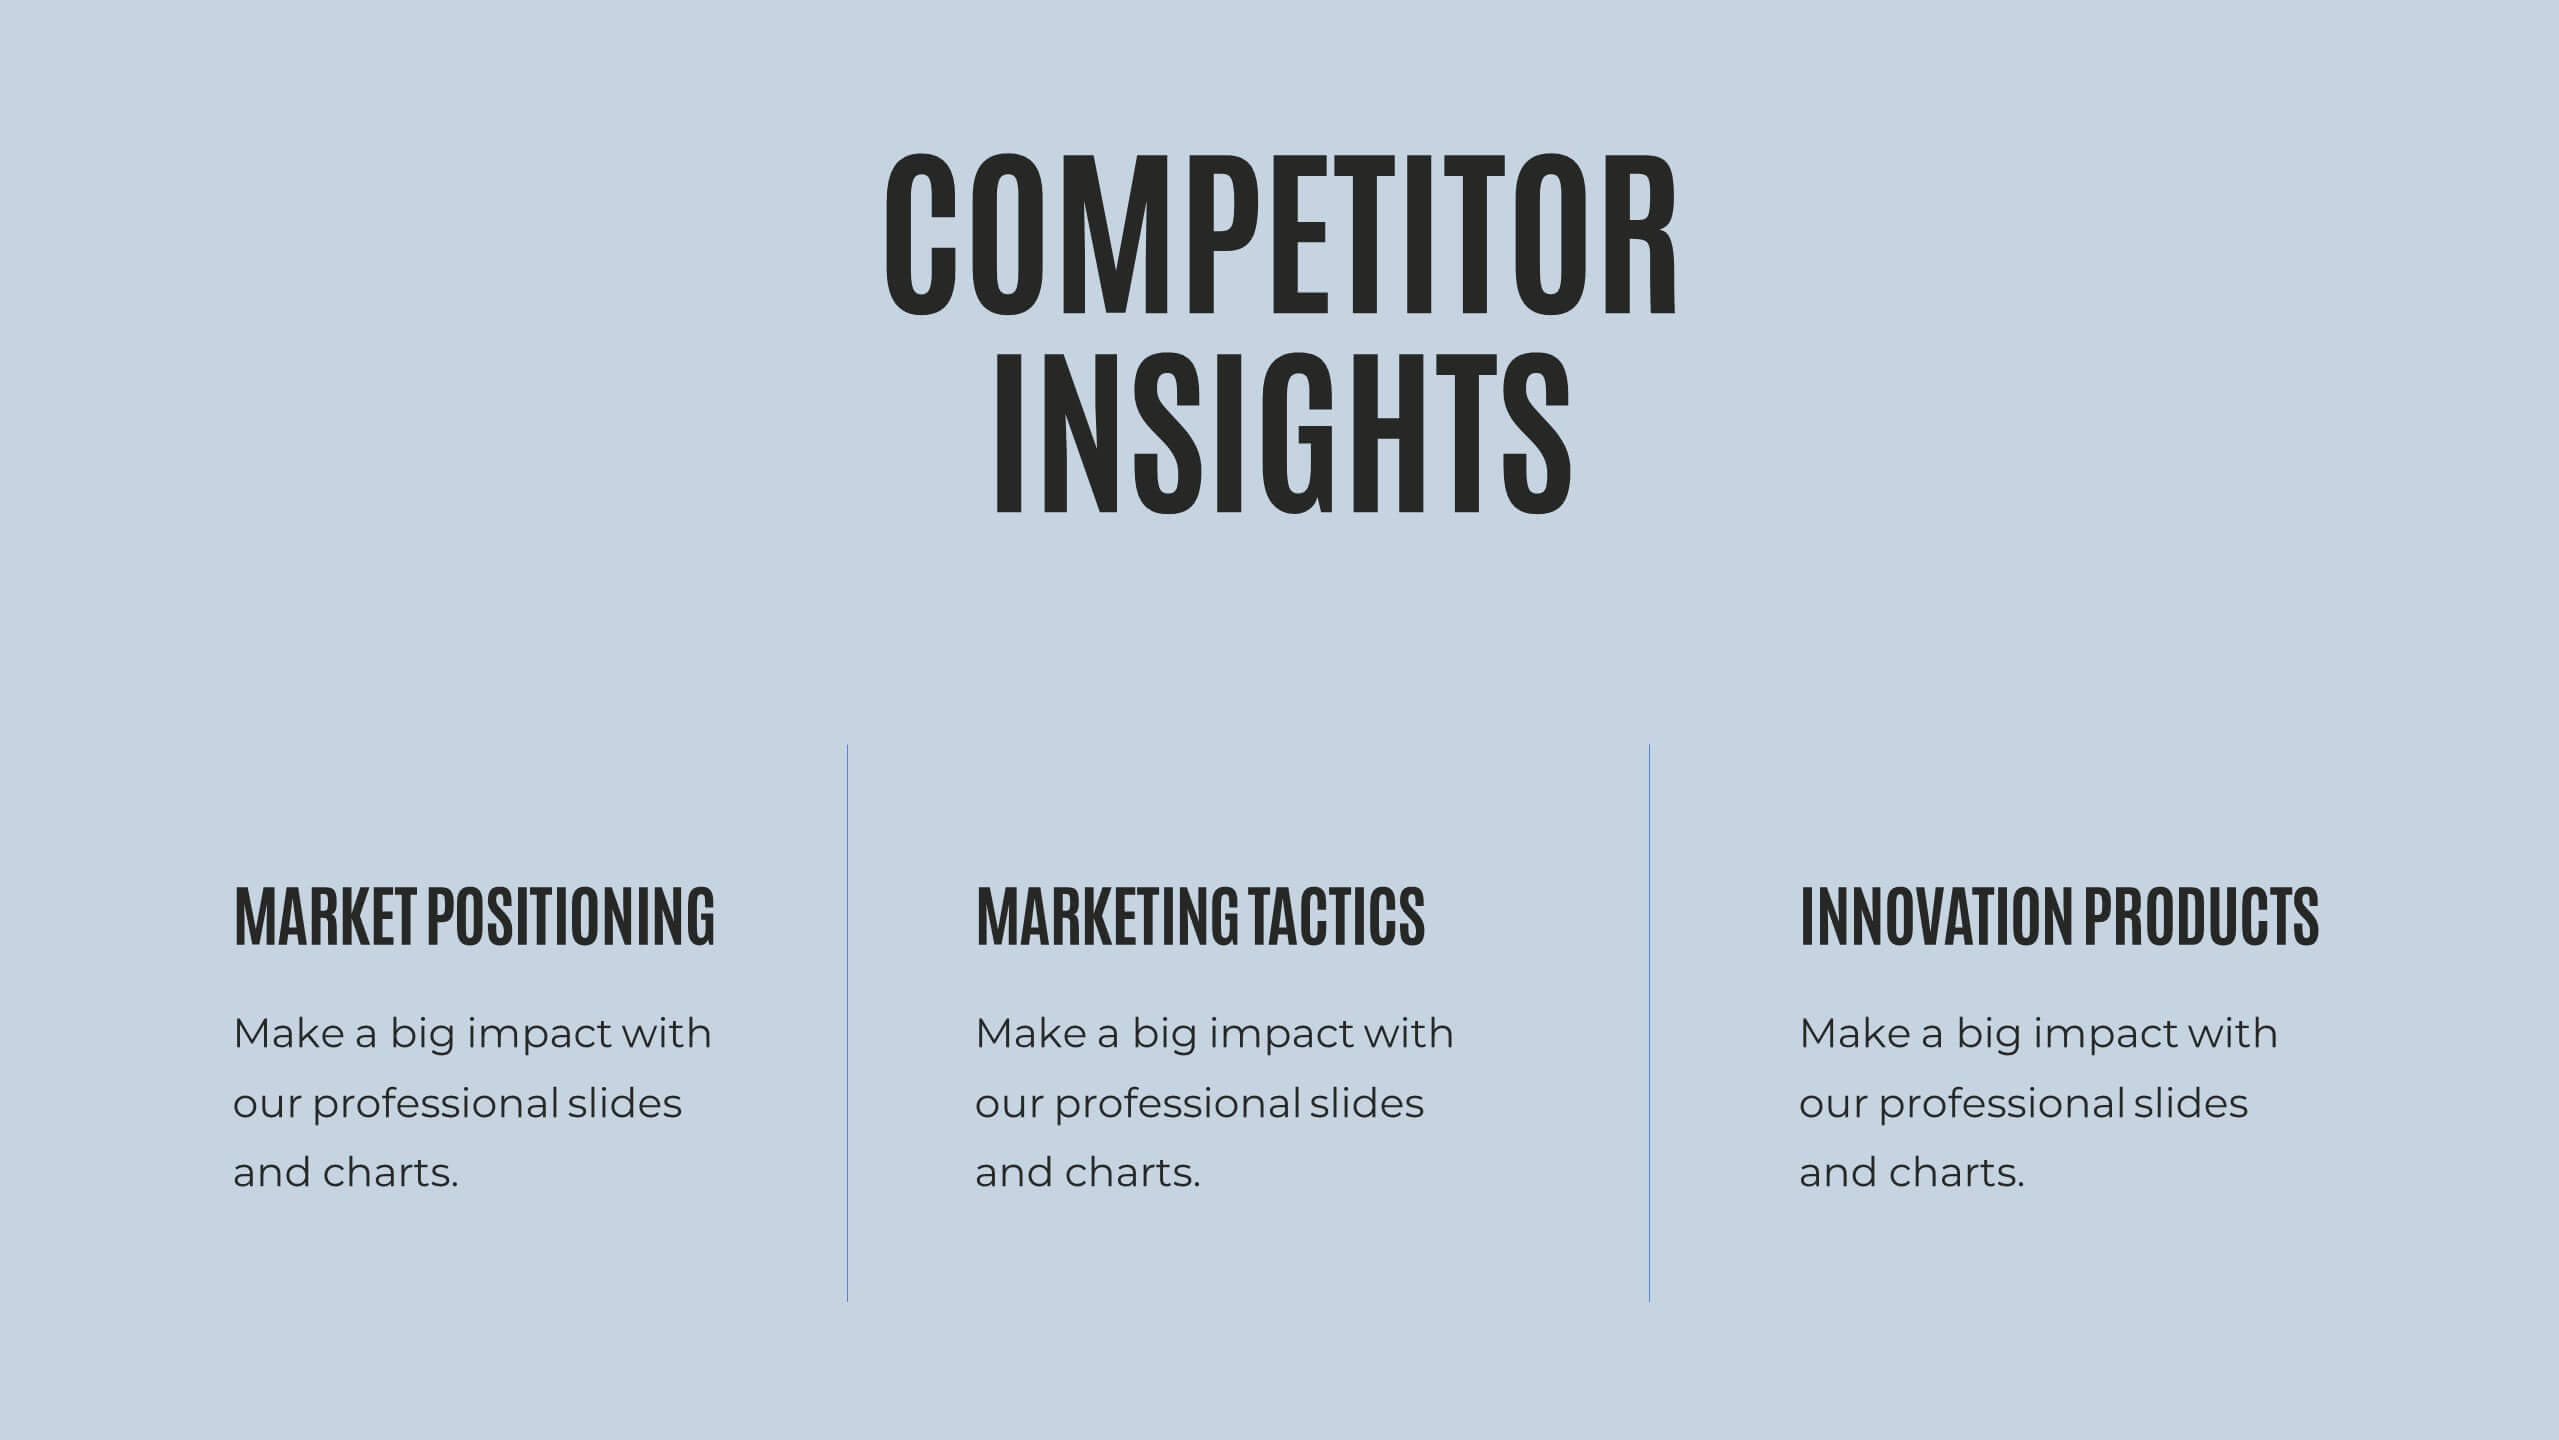
Business Competitive Analysis
Break down your market strategy into clear, actionable steps with this streamlined analysis slide. Featuring an 8-step horizontal layout with bold icons and color-coded segments, it helps visualize competitive research and planning at a glance. Easily customizable in PowerPoint, Keynote, and Google Slides.


6 diapositivas
Detailed Info Table with Metrics
Present complex insights with clarity using the Detailed Info Table with Metrics Presentation. Designed to showcase up to five key items or categories, this layout includes structured rows and multiple columns—perfect for comparing metrics, milestones, or KPIs across several dimensions. With bold numbering and clean typography, this editable slide works in PowerPoint, Keynote, and Google Slides.


5 diapositivas
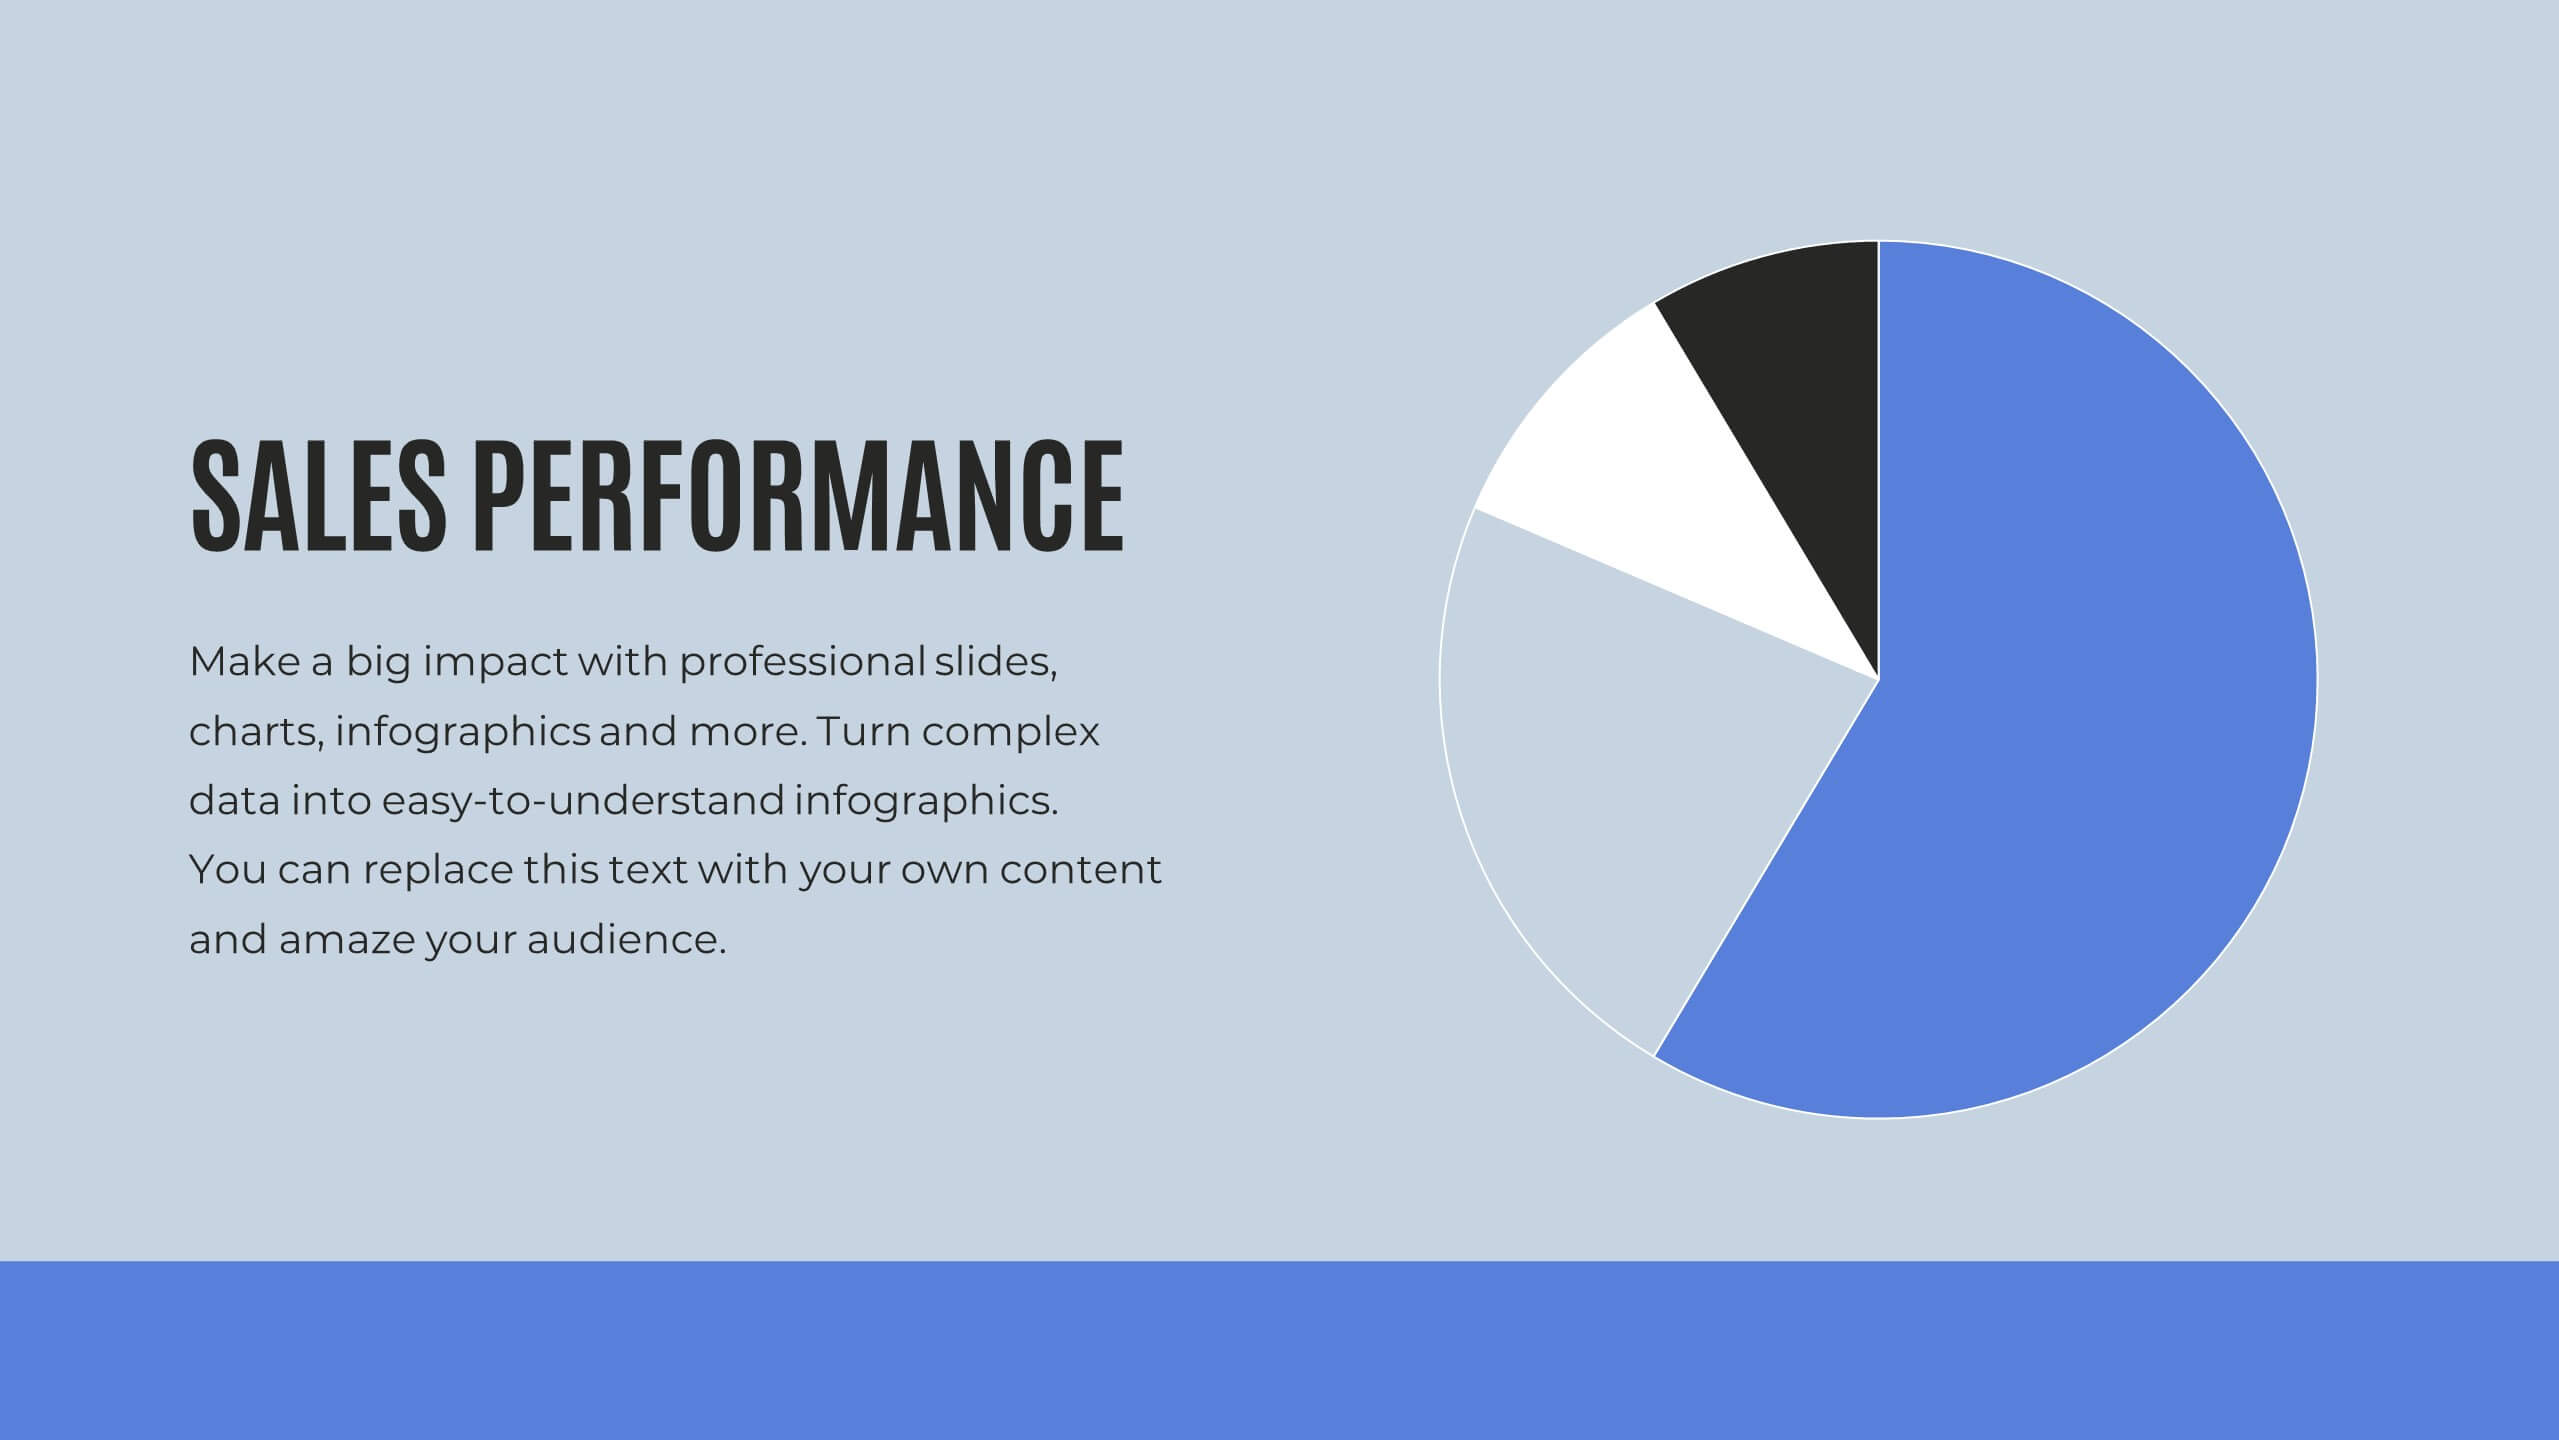
Big Data Analytics Slide Presentation
Bring your insights to life with a clean, modern slide that transforms complex information into a simple visual journey. This layout helps you explain key data points, trends, and analytical steps with clarity and ease, making your message instantly understandable. Compatible with PowerPoint, Keynote, and Google Slides.


8 diapositivas
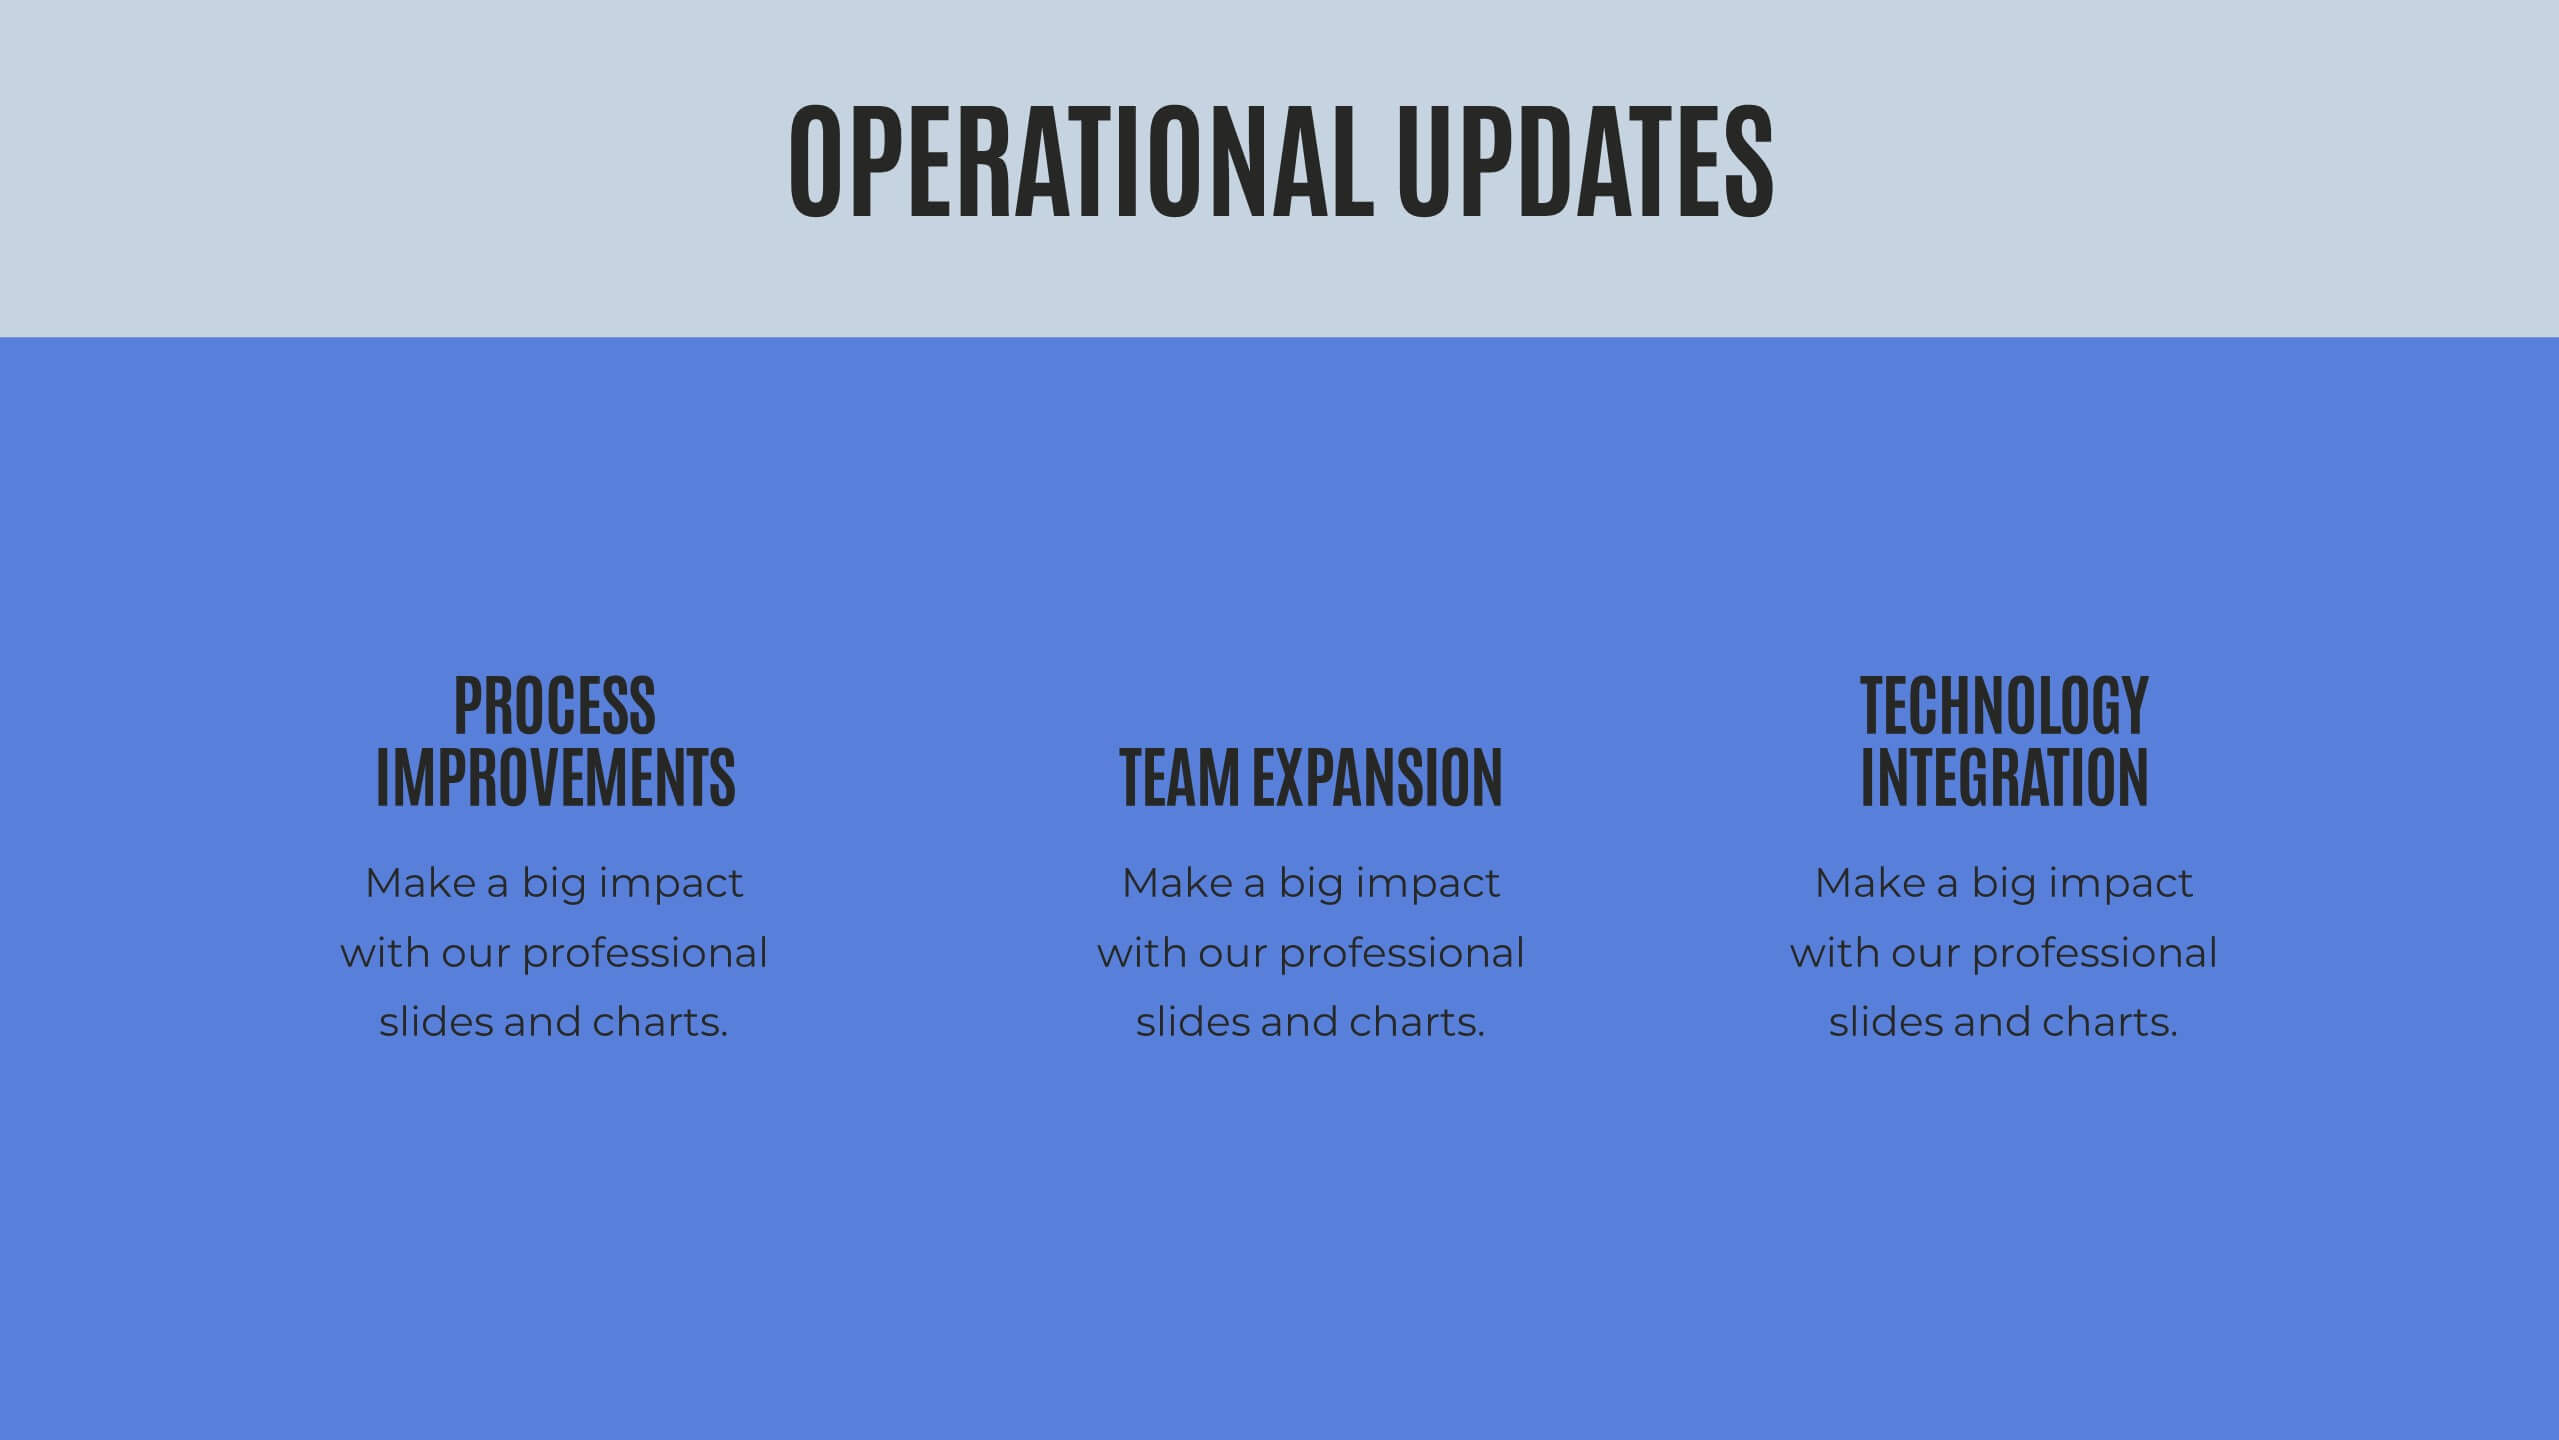
Executive Summary Business
Present key insights clearly with this modern Executive Summary slide. Designed for impact, it highlights core data points alongside four strategic pillars—perfect for quarterly updates, board meetings, or business reviews. Fully editable in PowerPoint, Keynote, and Google Slides. Clean layout, customizable icons, and sleek visuals ensure a professional finish.


6 diapositivas
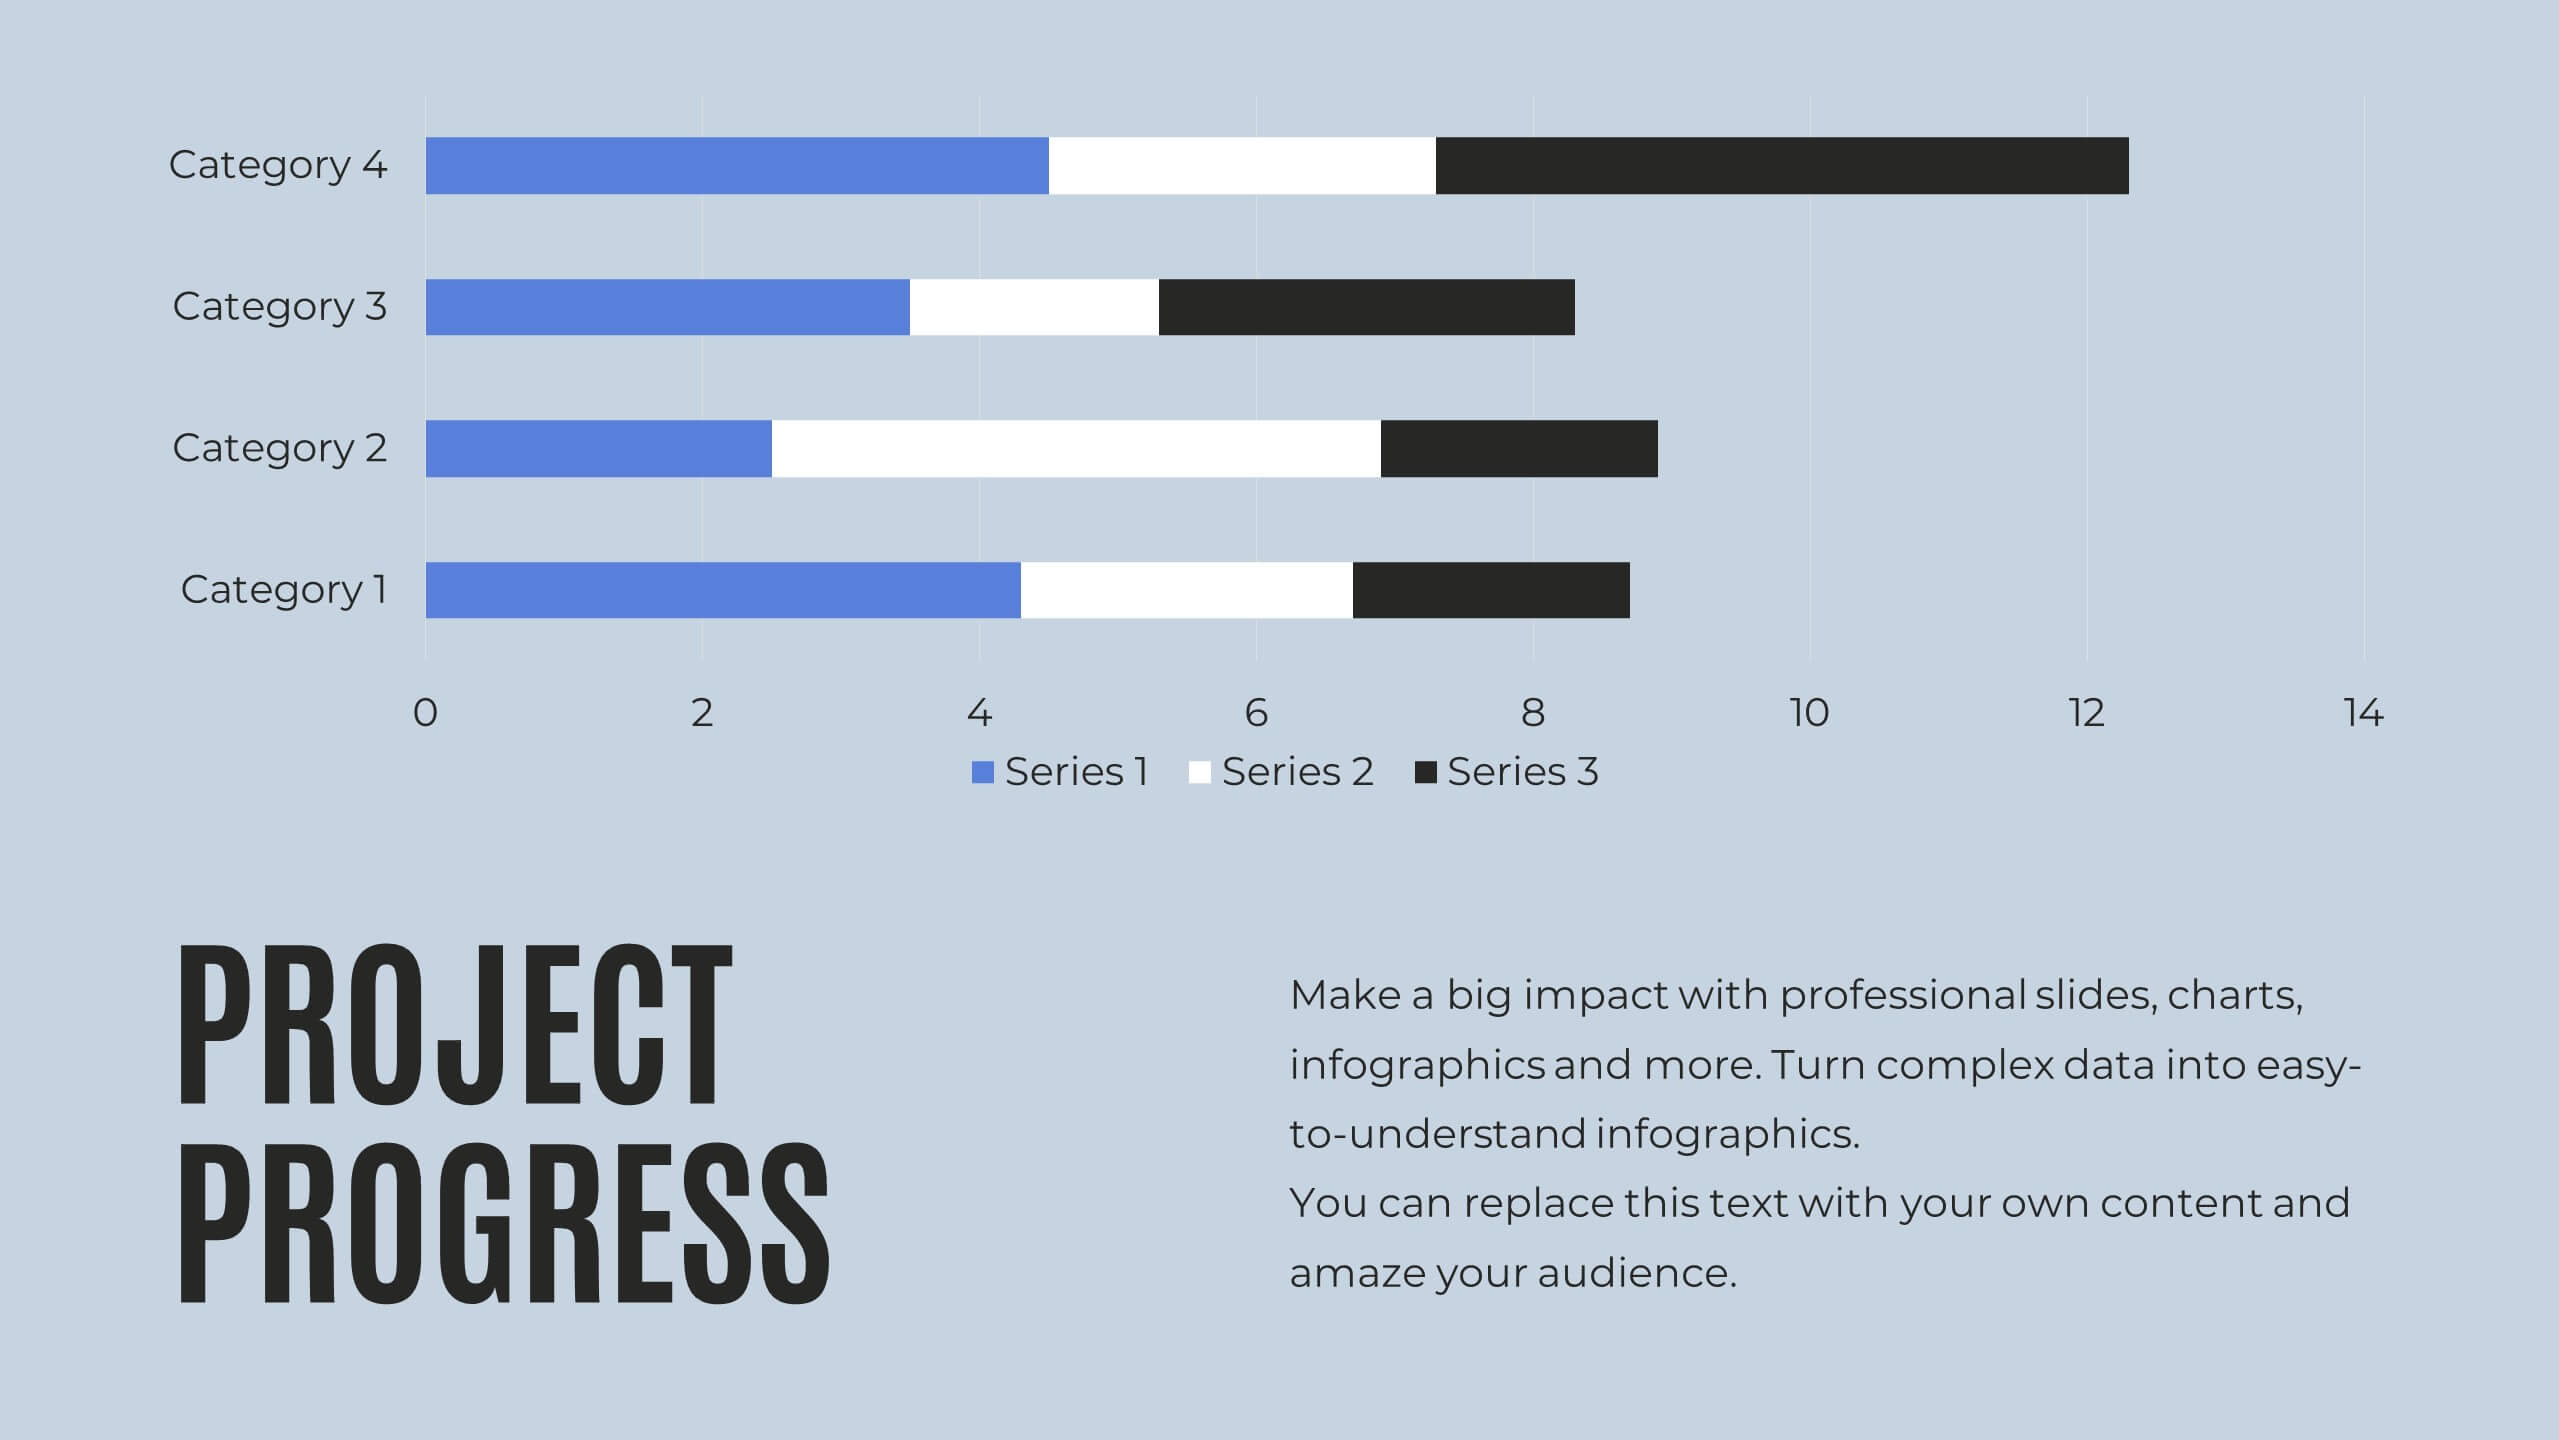
Employee Feedback Survey Results Presentation
Showcase Employee Feedback Survey Results with a data-driven and professional layout designed for clear visualization and analysis. This PowerPoint, Keynote, and Google Slides-compatible template features stacked bar charts for easy trend comparison, helping you present workplace insights effectively. Fully customizable with editable text, colors, and labels, this template ensures a seamless and engaging presentation of employee feedback metrics.


21 diapositivas
Stonelight Qualitative Research Findings Presentation
Present your research findings with clarity and impact using this sleek and modern presentation template. Designed for professionals and researchers, it guides you through all key aspects of your project, from introduction and background to detailed literature reviews, methodology, and data collection processes. Showcase your insights with sections for data analysis, key findings, and results interpretation, ensuring your audience stays engaged. This template also includes areas for recommendations, implications, and future research opportunities, making it ideal for academic, business, or industry presentations. Fully customizable and compatible with PowerPoint, Google Slides, and Keynote, it adapts seamlessly to your branding and content needs. Communicate your findings effectively and make a lasting impression with this professional and polished design.


7 diapositivas
Customer Relationship Management
Strengthen client loyalty and drive growth with this organized CRM infographic. Perfect for presenting customer touchpoints, service strategies, and loyalty-building initiatives. Fully customizable in PowerPoint, Keynote, and Google Slides, this design ensures your CRM workflows are communicated with clarity and visual impact.


7 diapositivas
Feedback Management Infographic
Boost your presentation's impact with our Feedback Management infographic, optimized for Powerpoint, Keynote, and Google Slides. This infographic is an essential asset for professionals looking to present feedback data compellingly and concisely. Designed to convey customer satisfaction metrics and responses effectively, it's perfect for market researchers, customer service managers, and business analysts. The Feedback Management infographic is constructed to visually communicate the importance of customer insights and how they drive business improvements. It transforms complex data into an easy-to-understand format, which is crucial for making informed decisions based on customer feedback. The infographic's structured design assists audiences in comprehending the collected feedback at a glance, highlighting key figures and trends. Whether you're reporting on survey results or showcasing customer reviews, this infographic ensures your data is presented clearly. Compatible with leading presentation software, it allows for smooth integration into your slides, ensuring your feedback analysis stands out. Incorporate this infographic into your presentations to effectively display feedback management data and make a lasting impression.


21 diapositivas
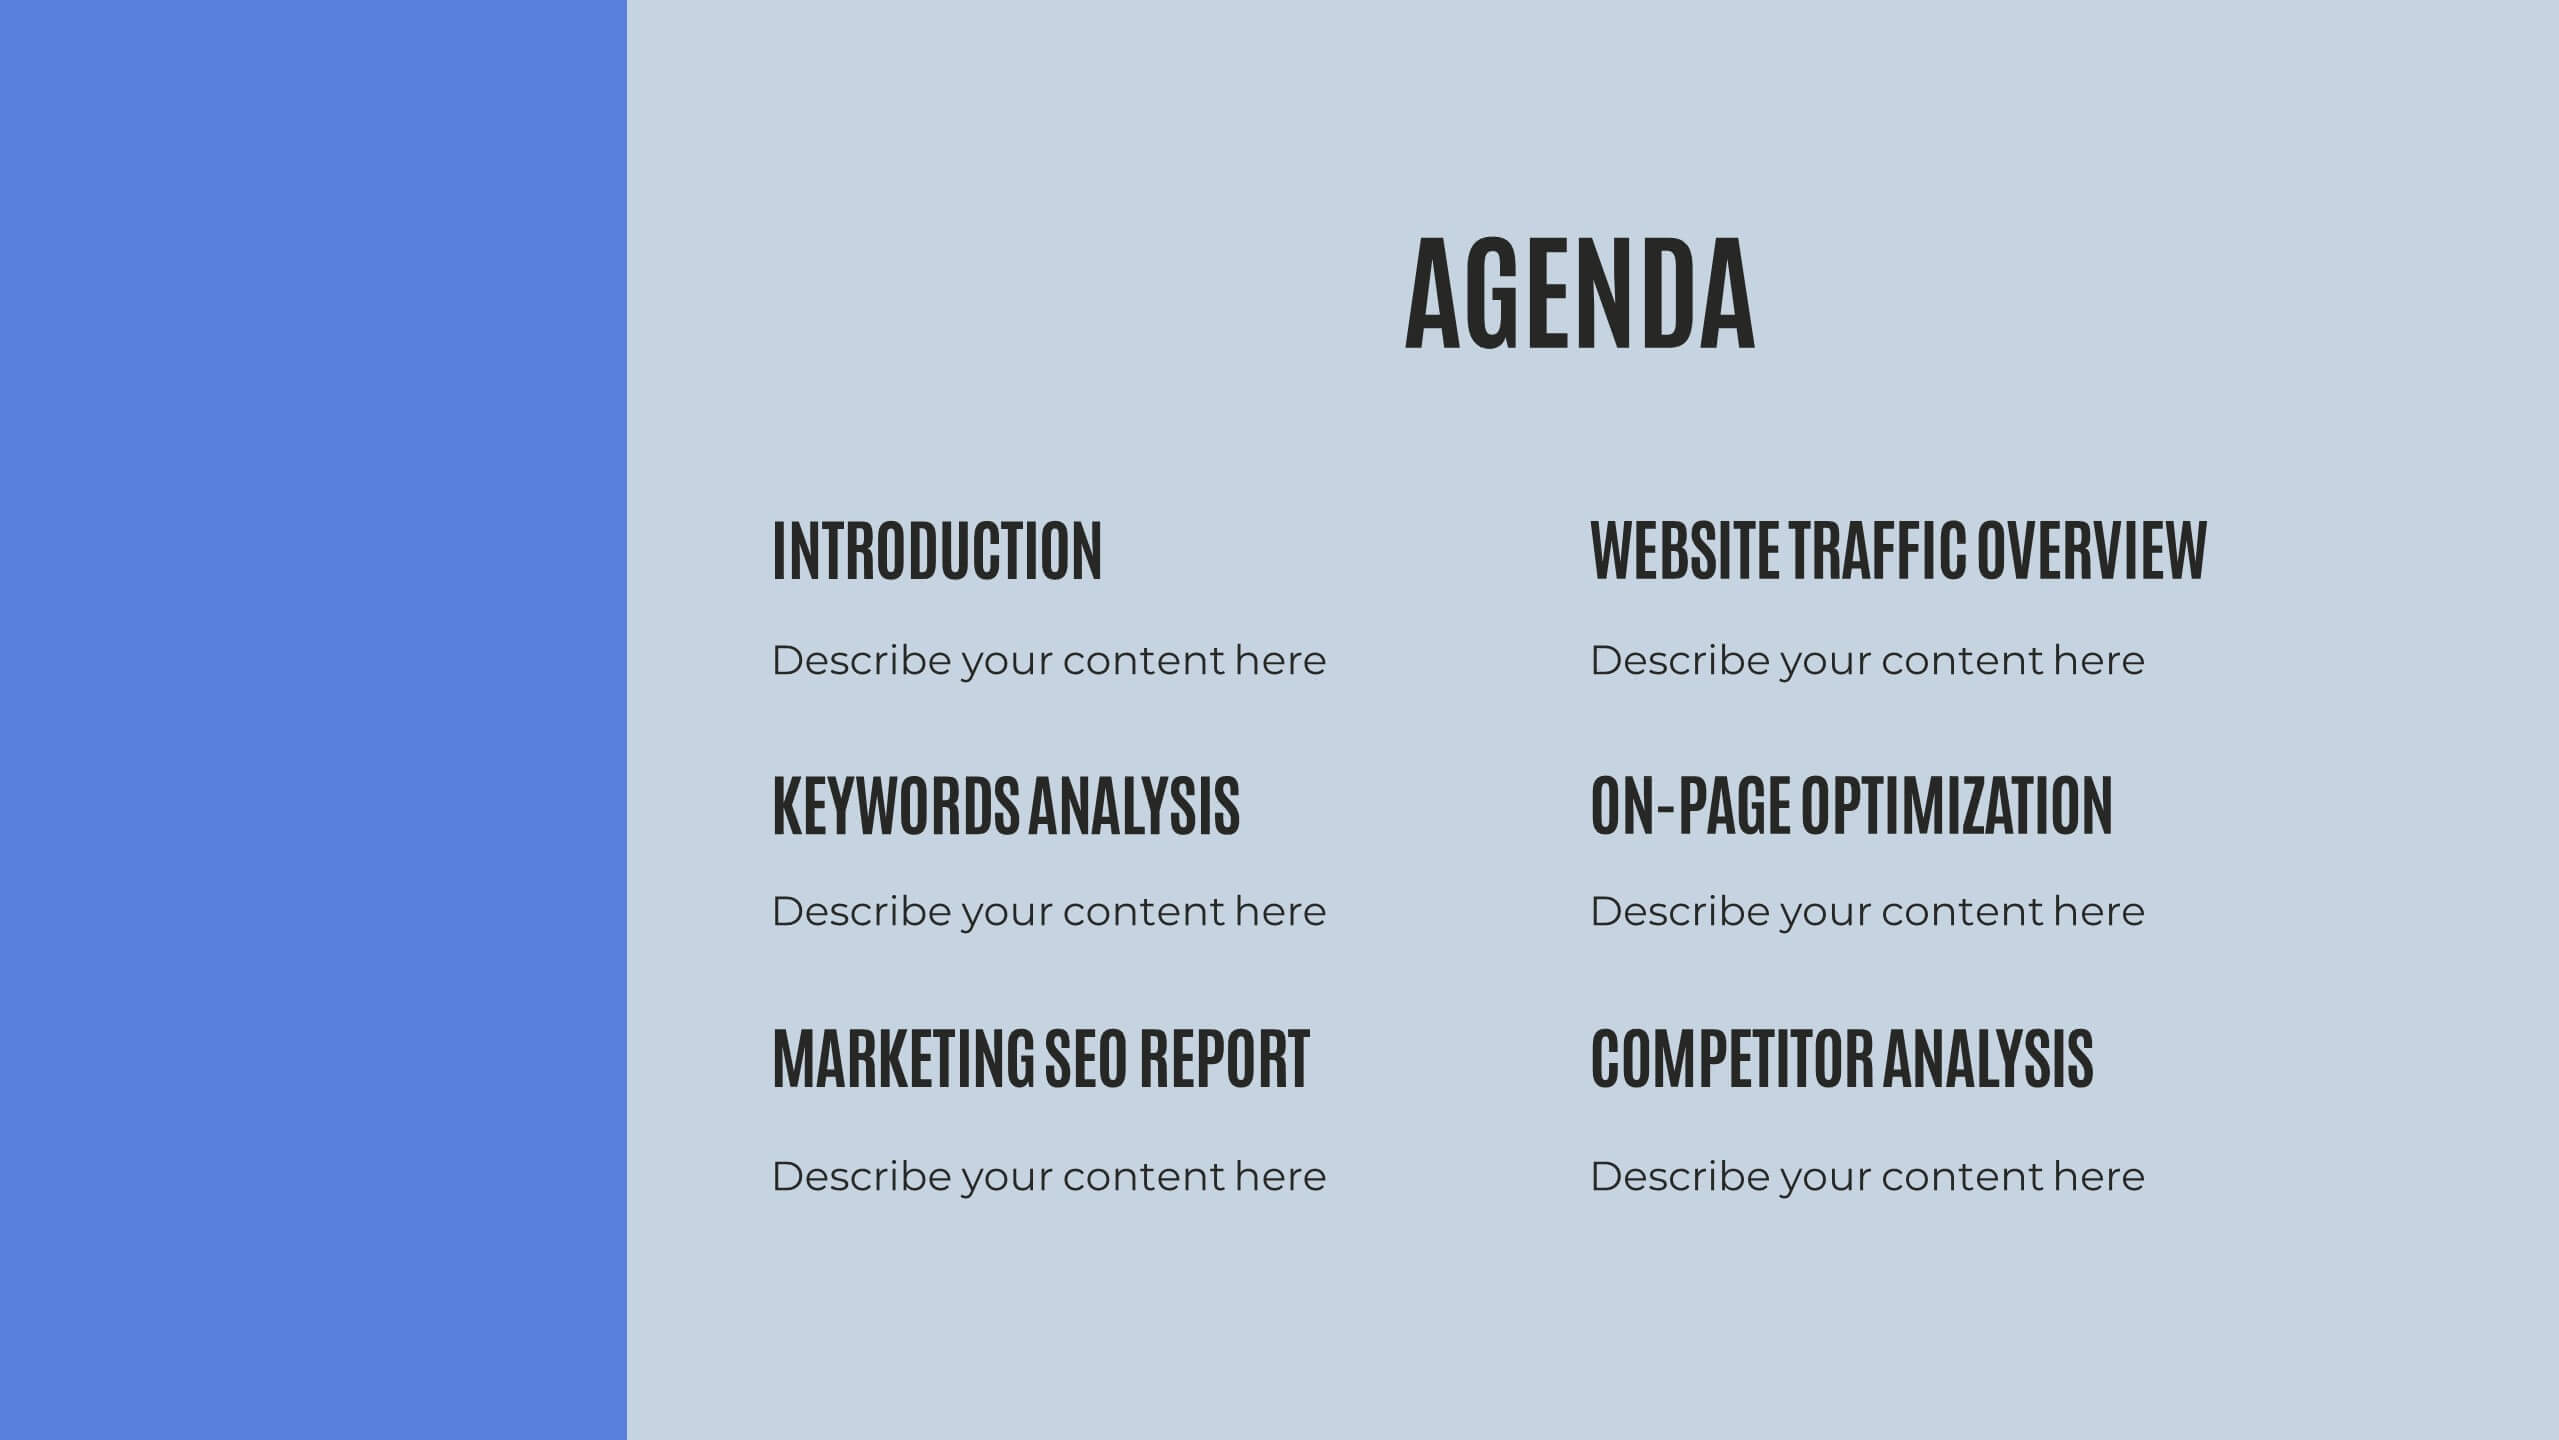
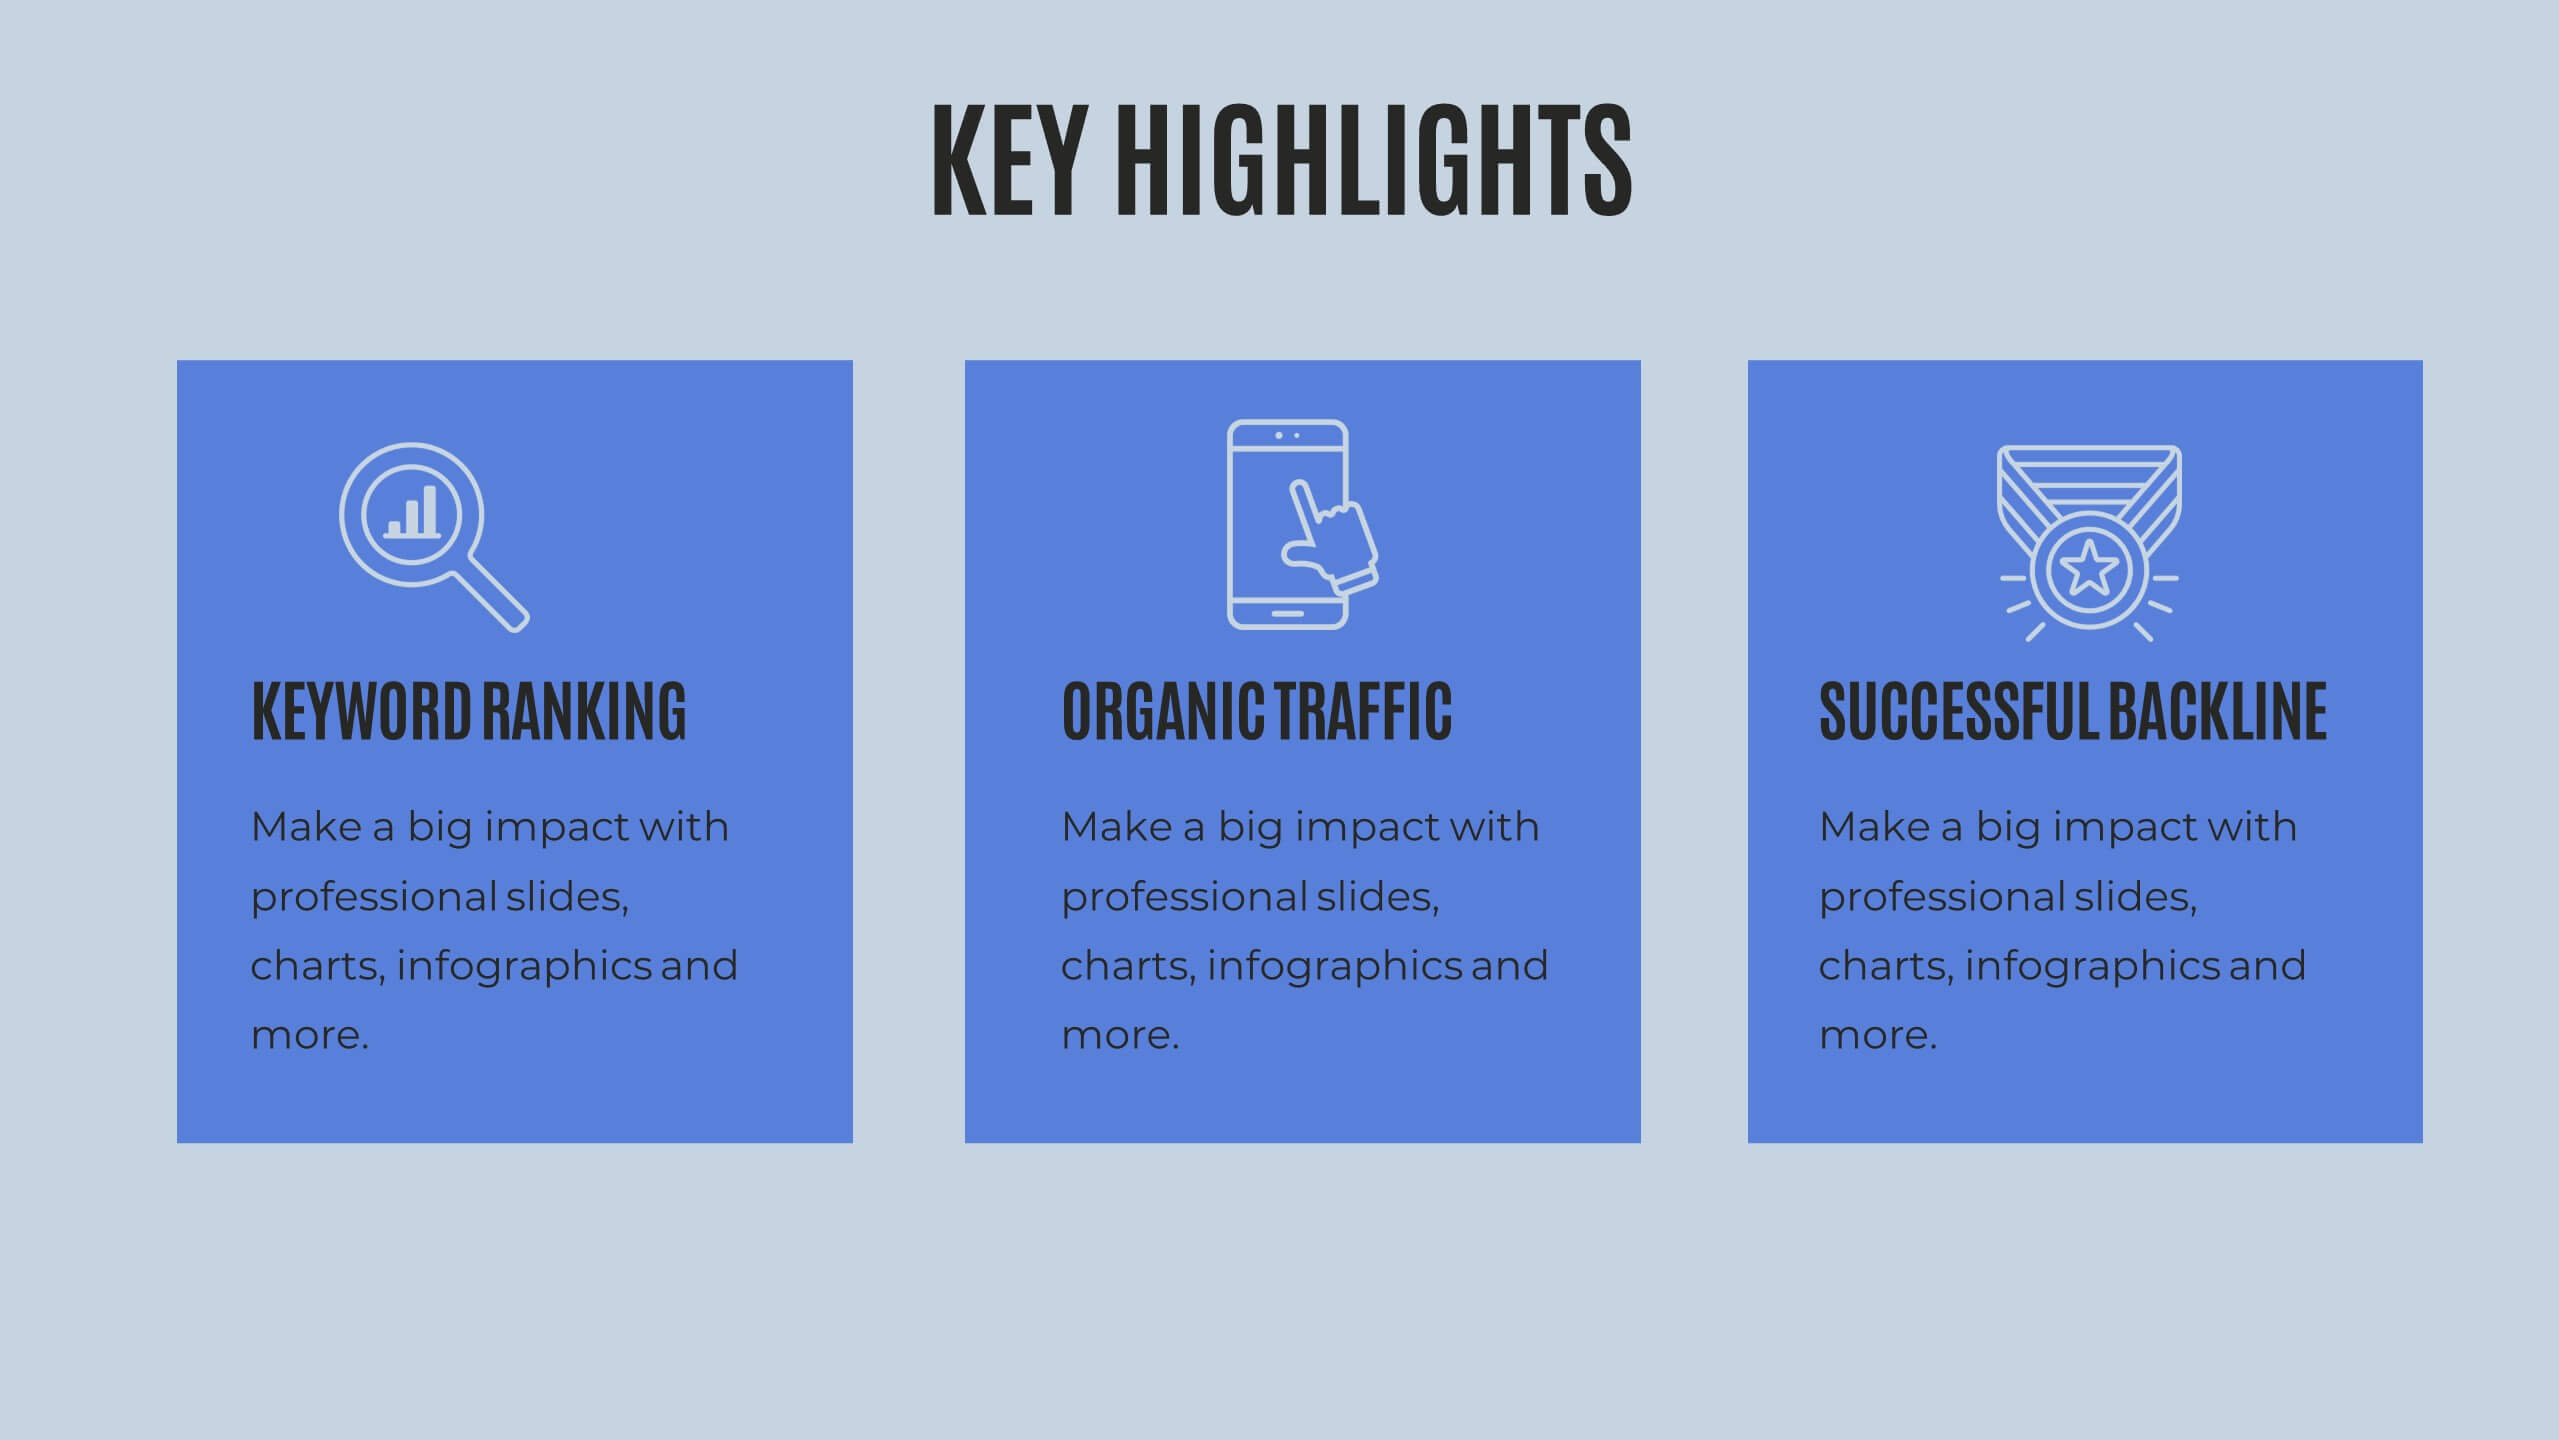
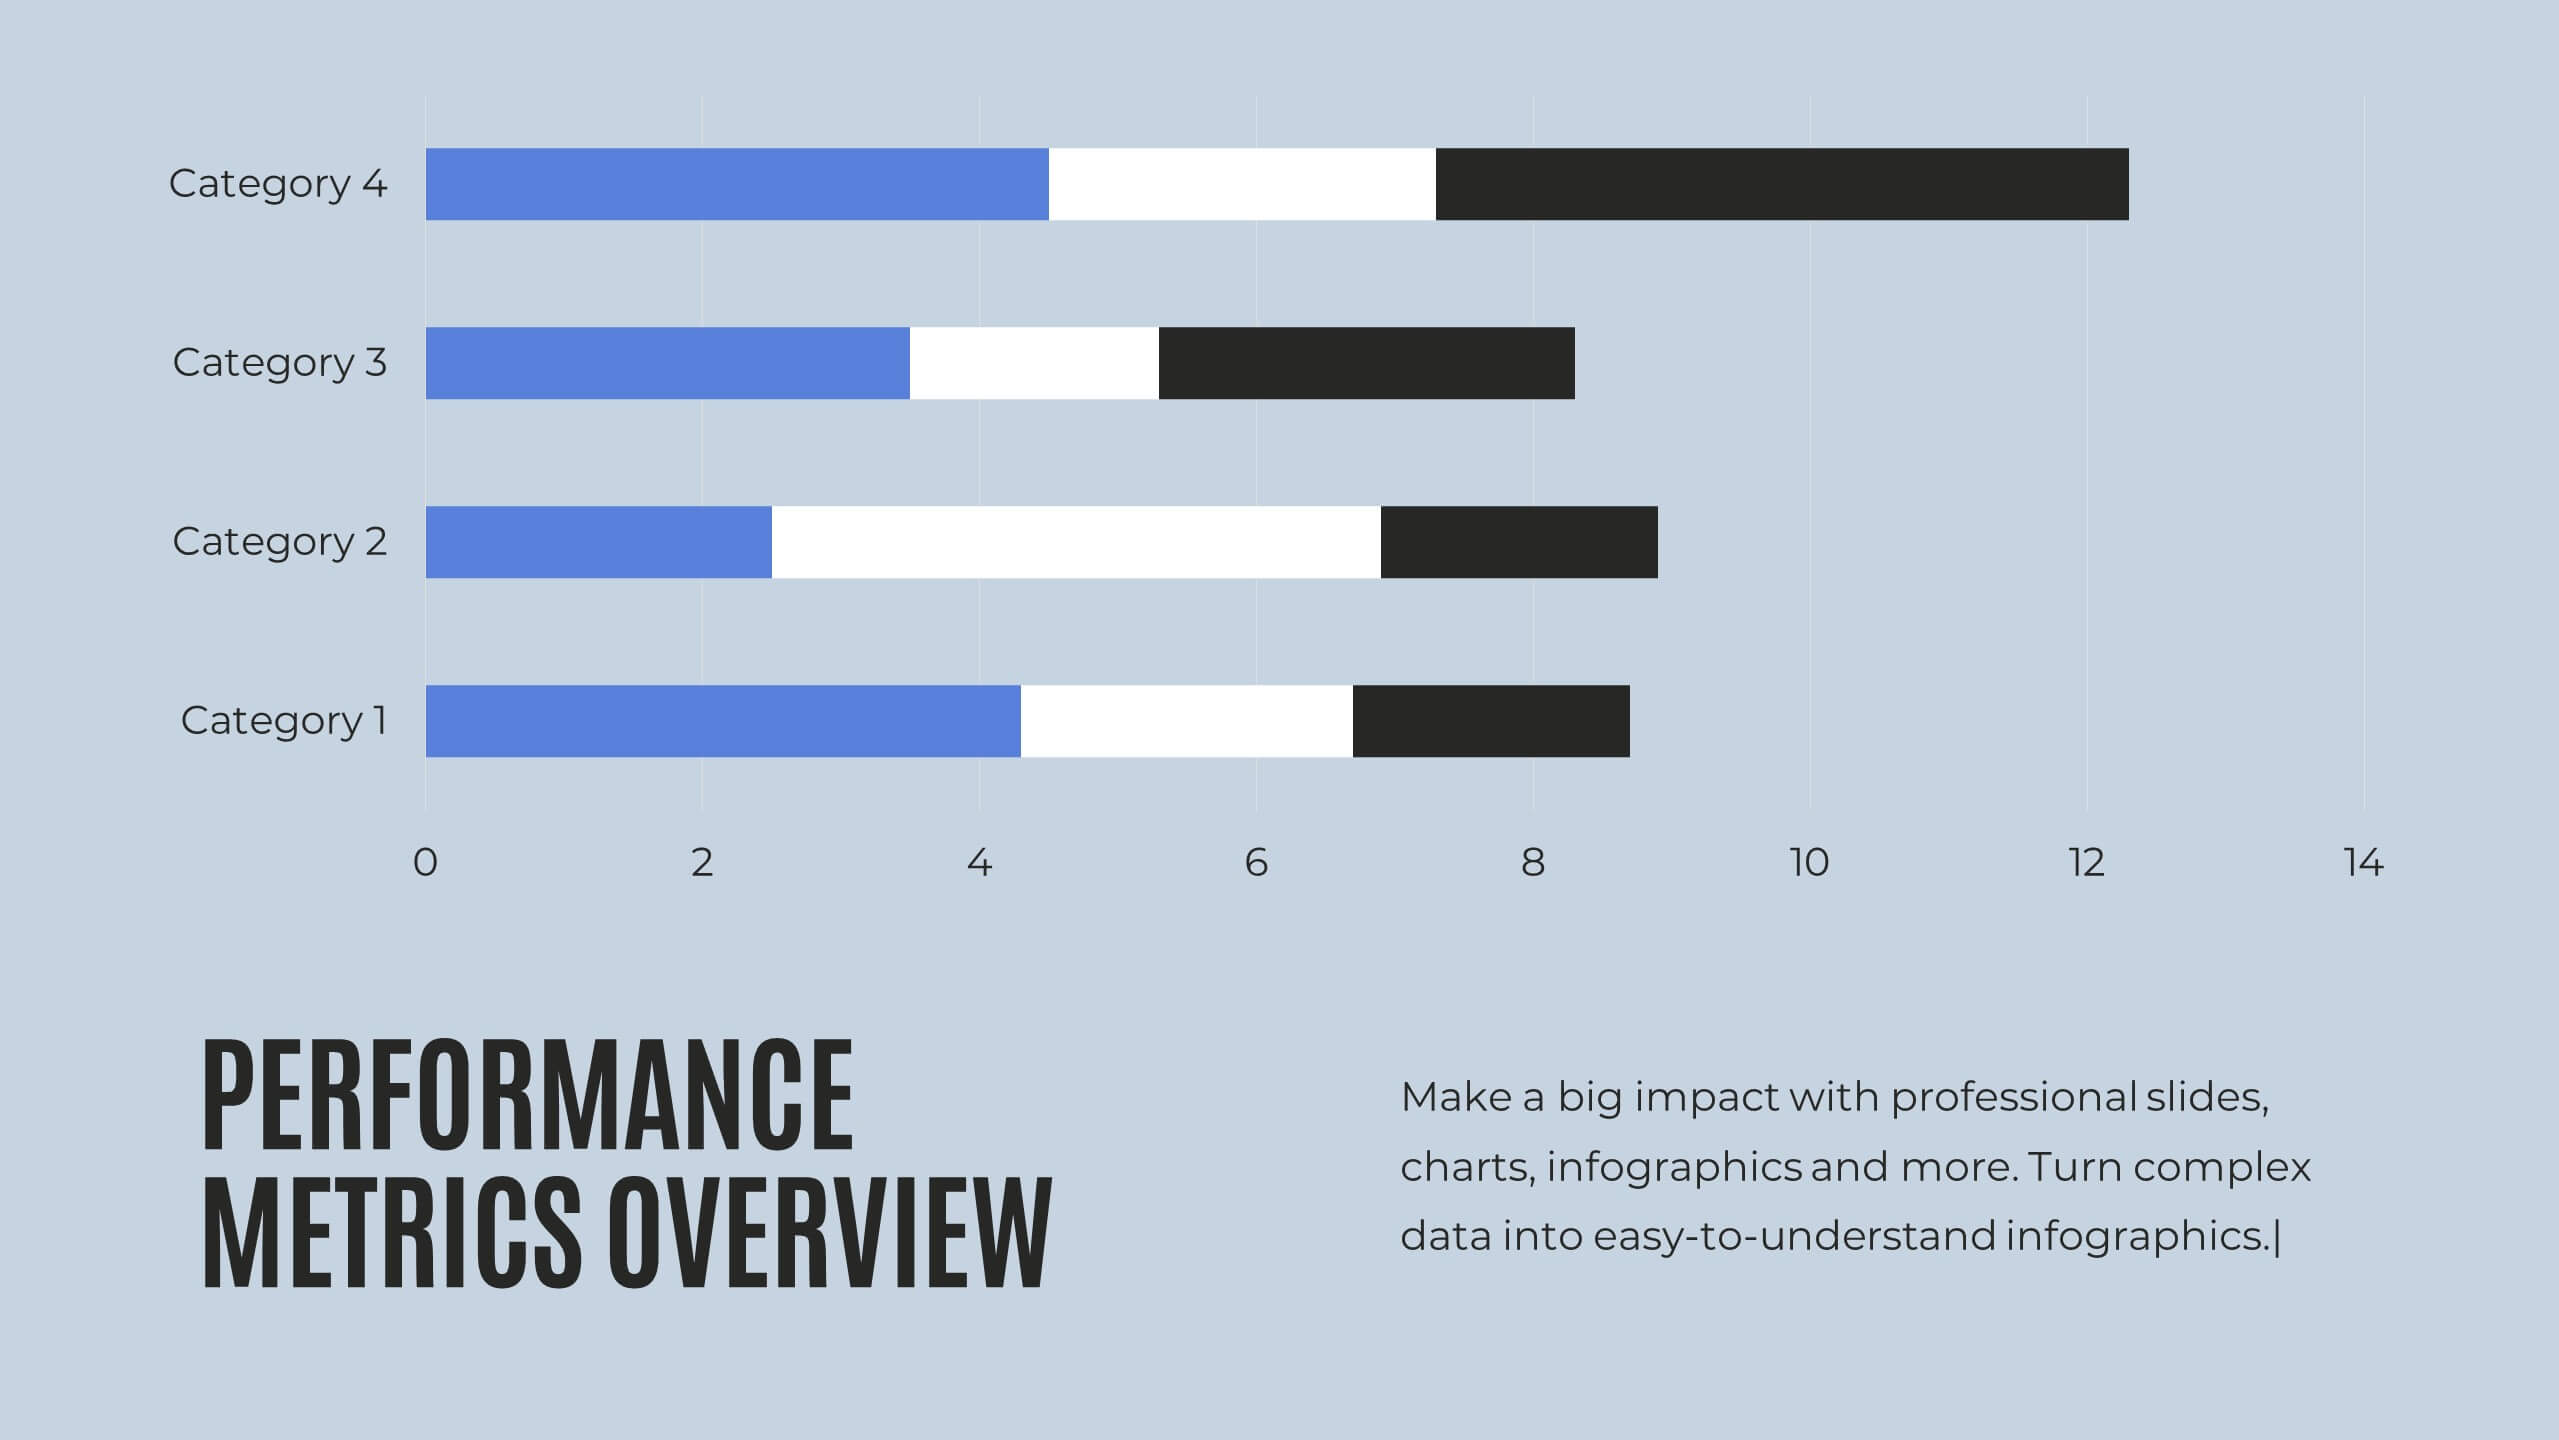
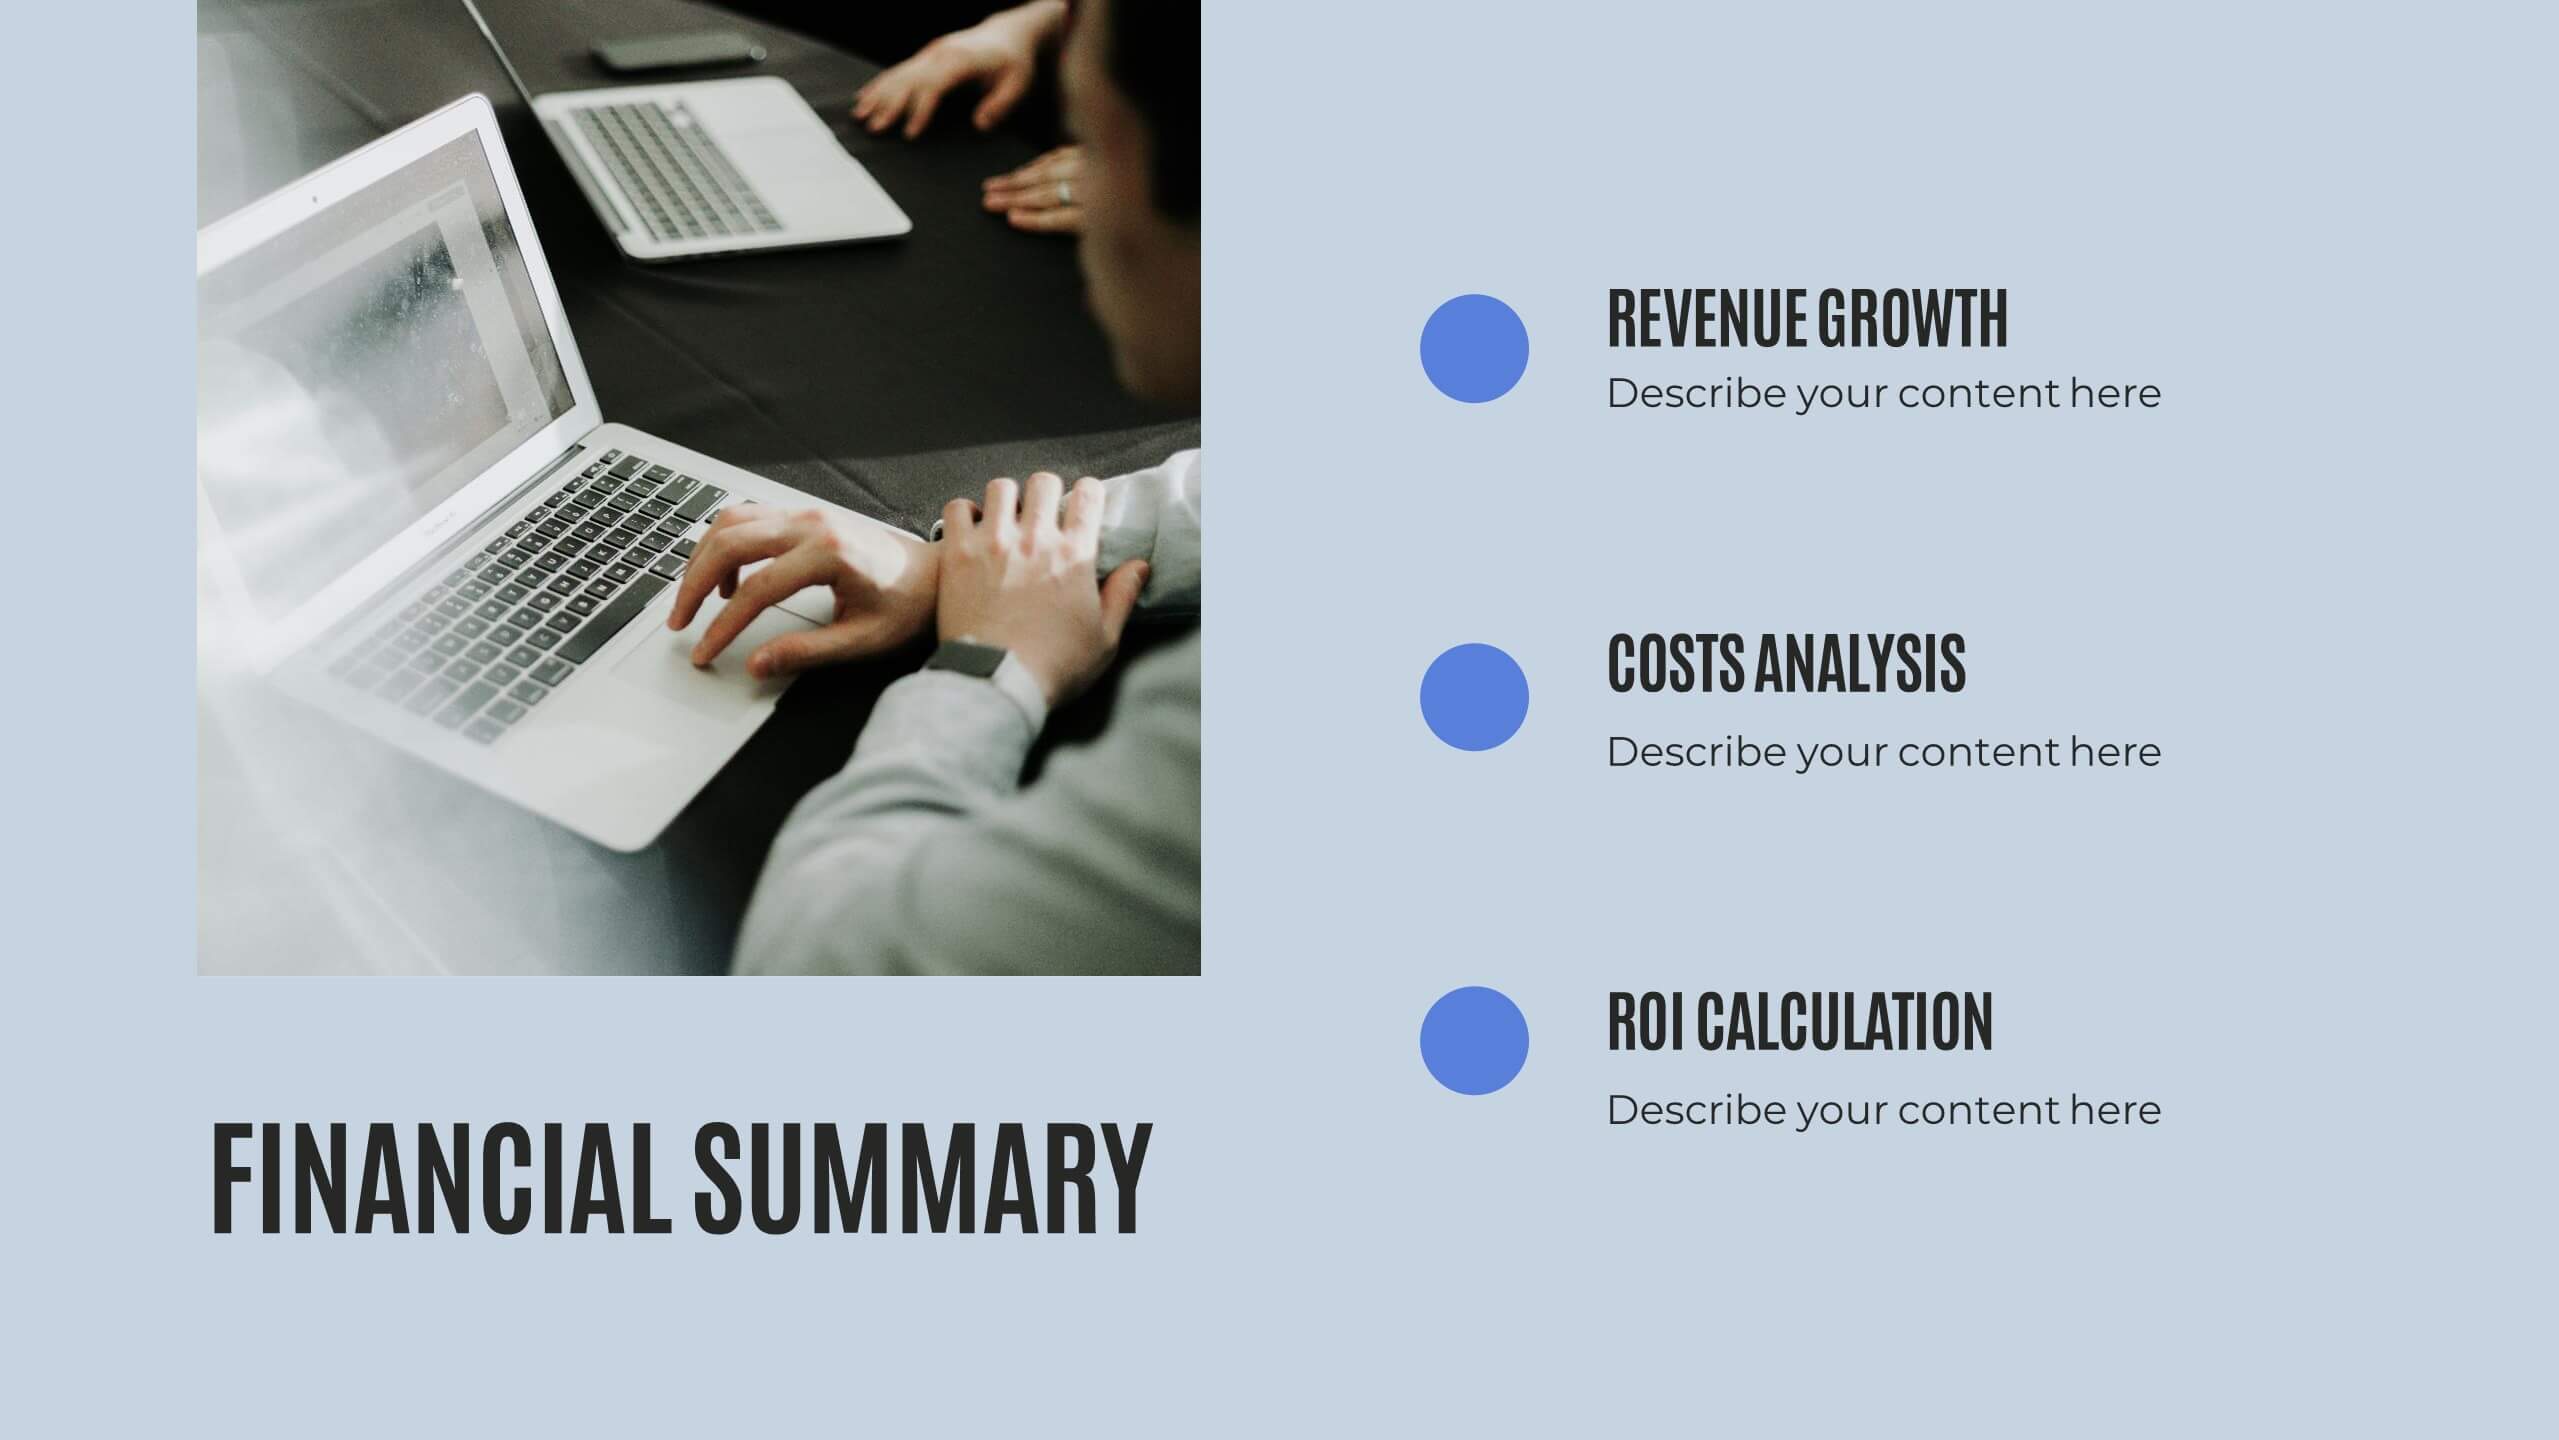
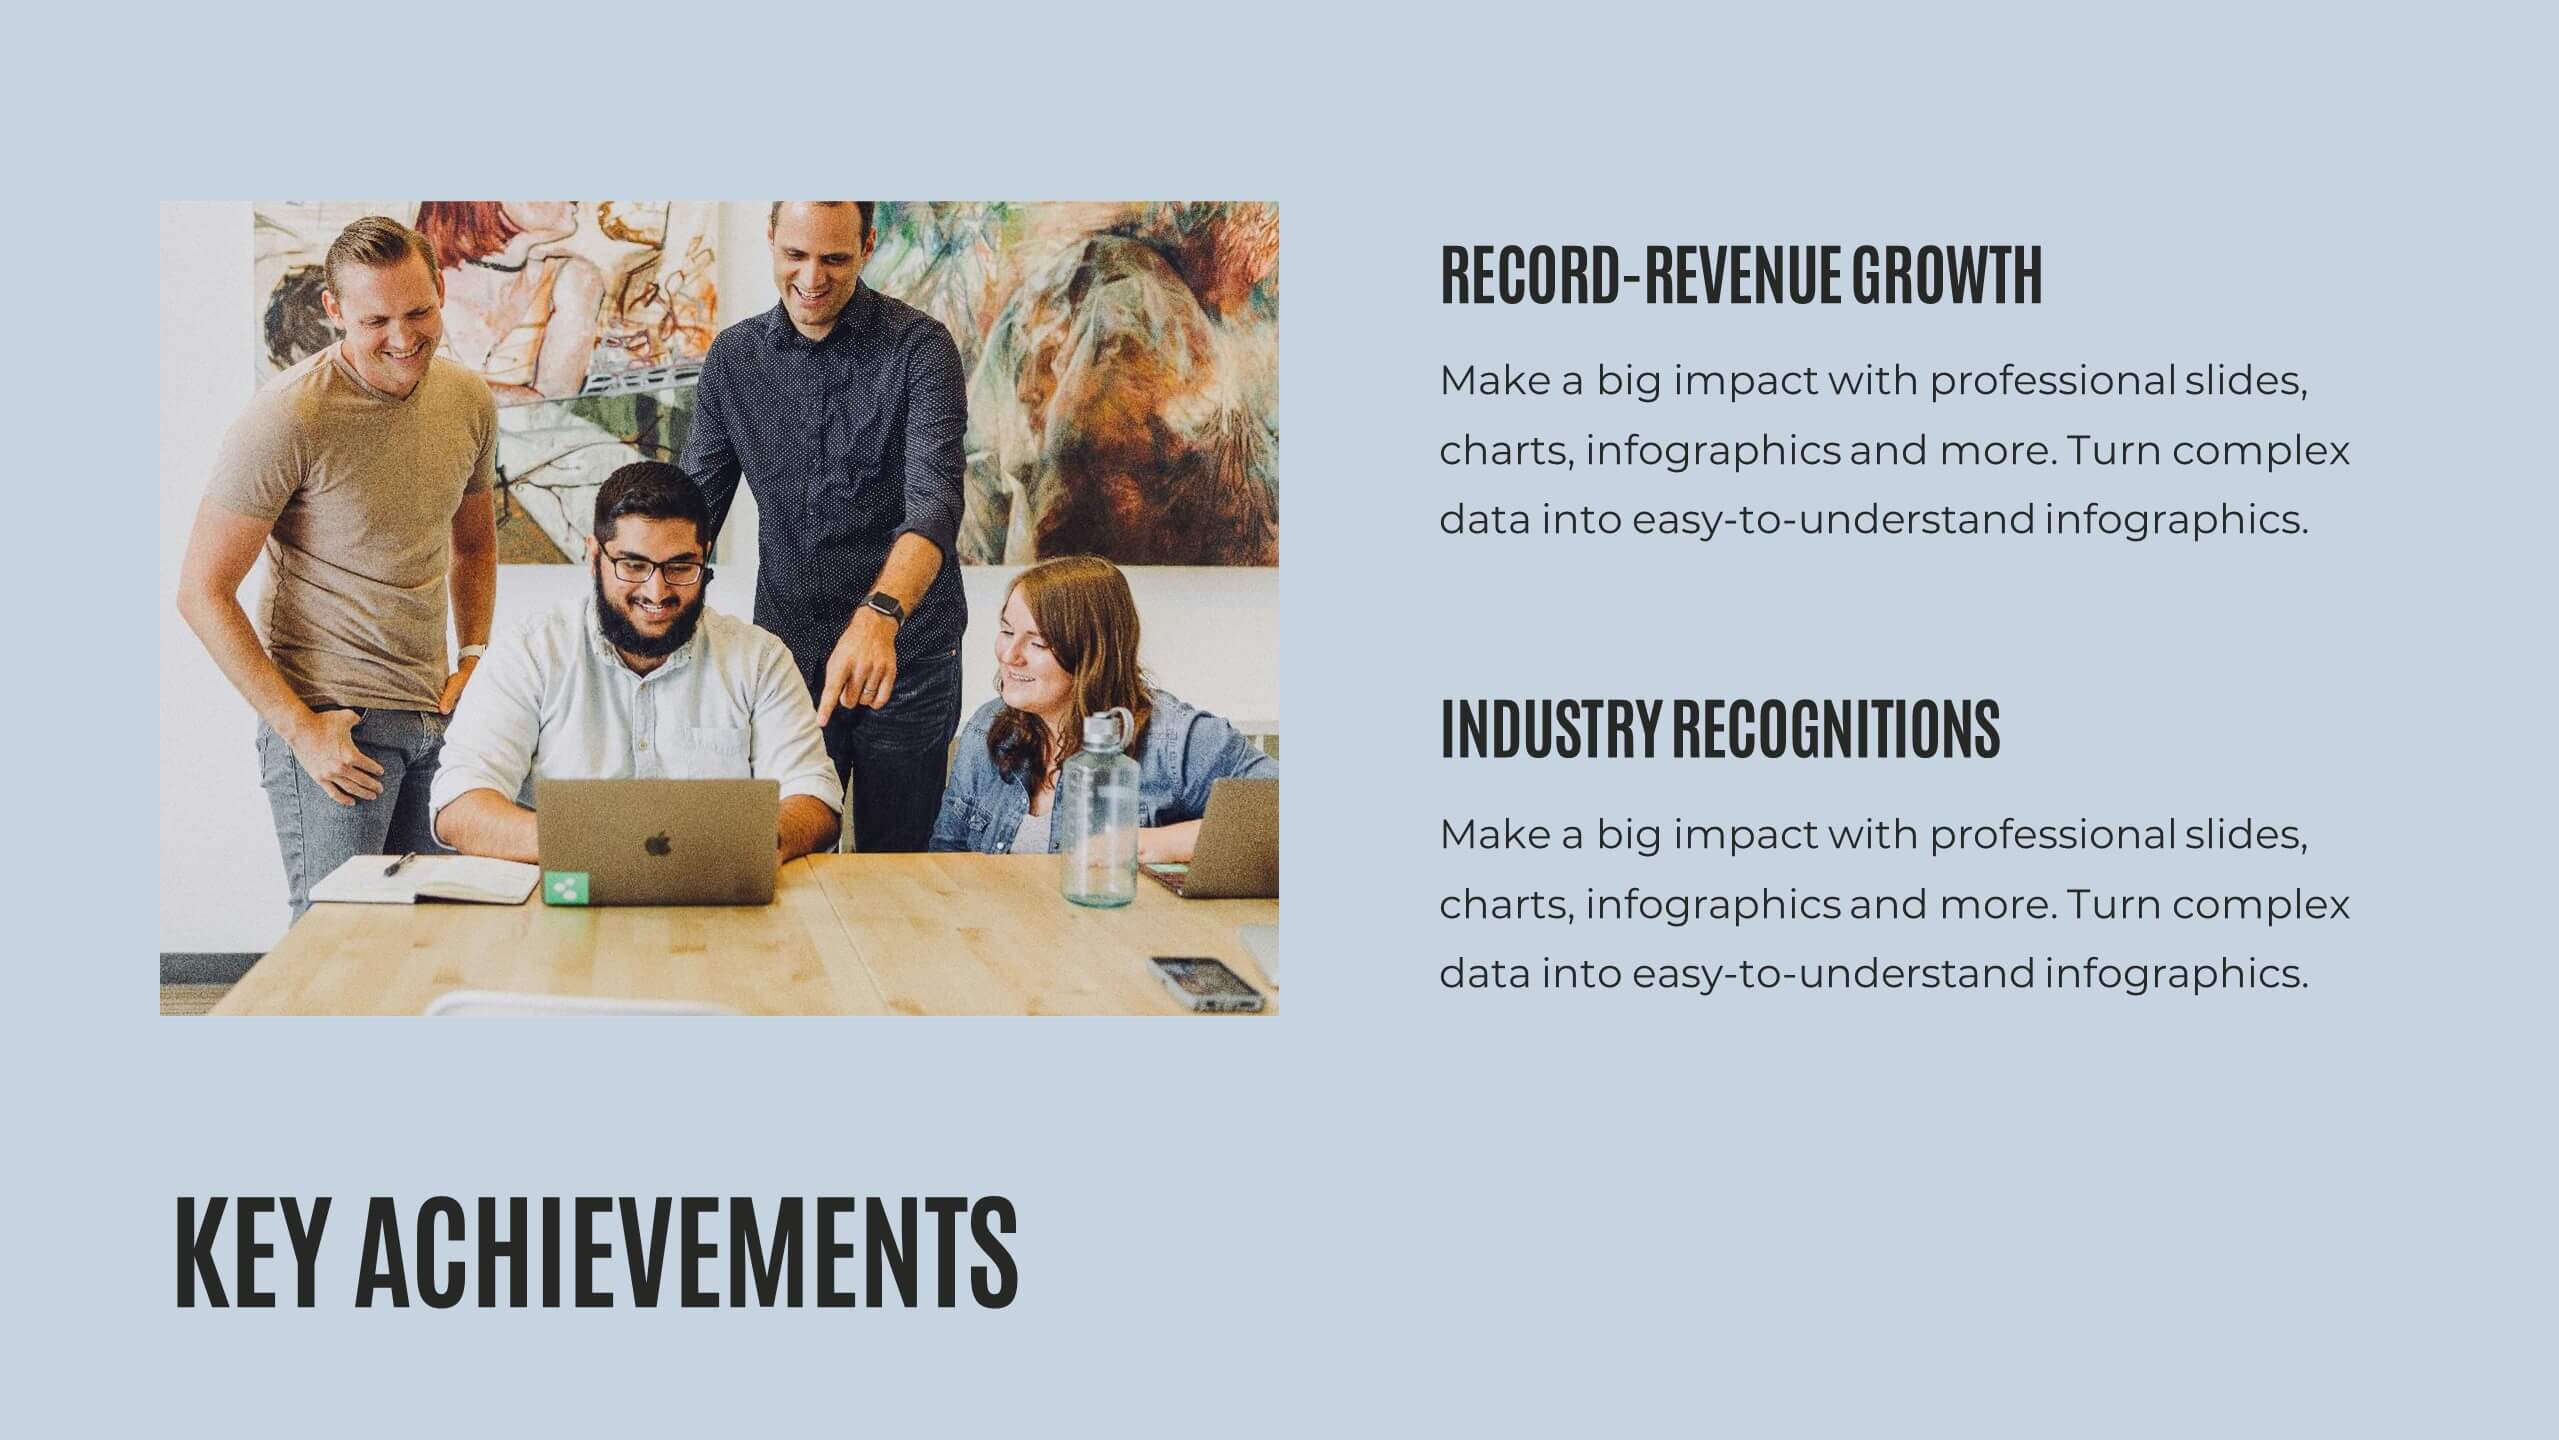
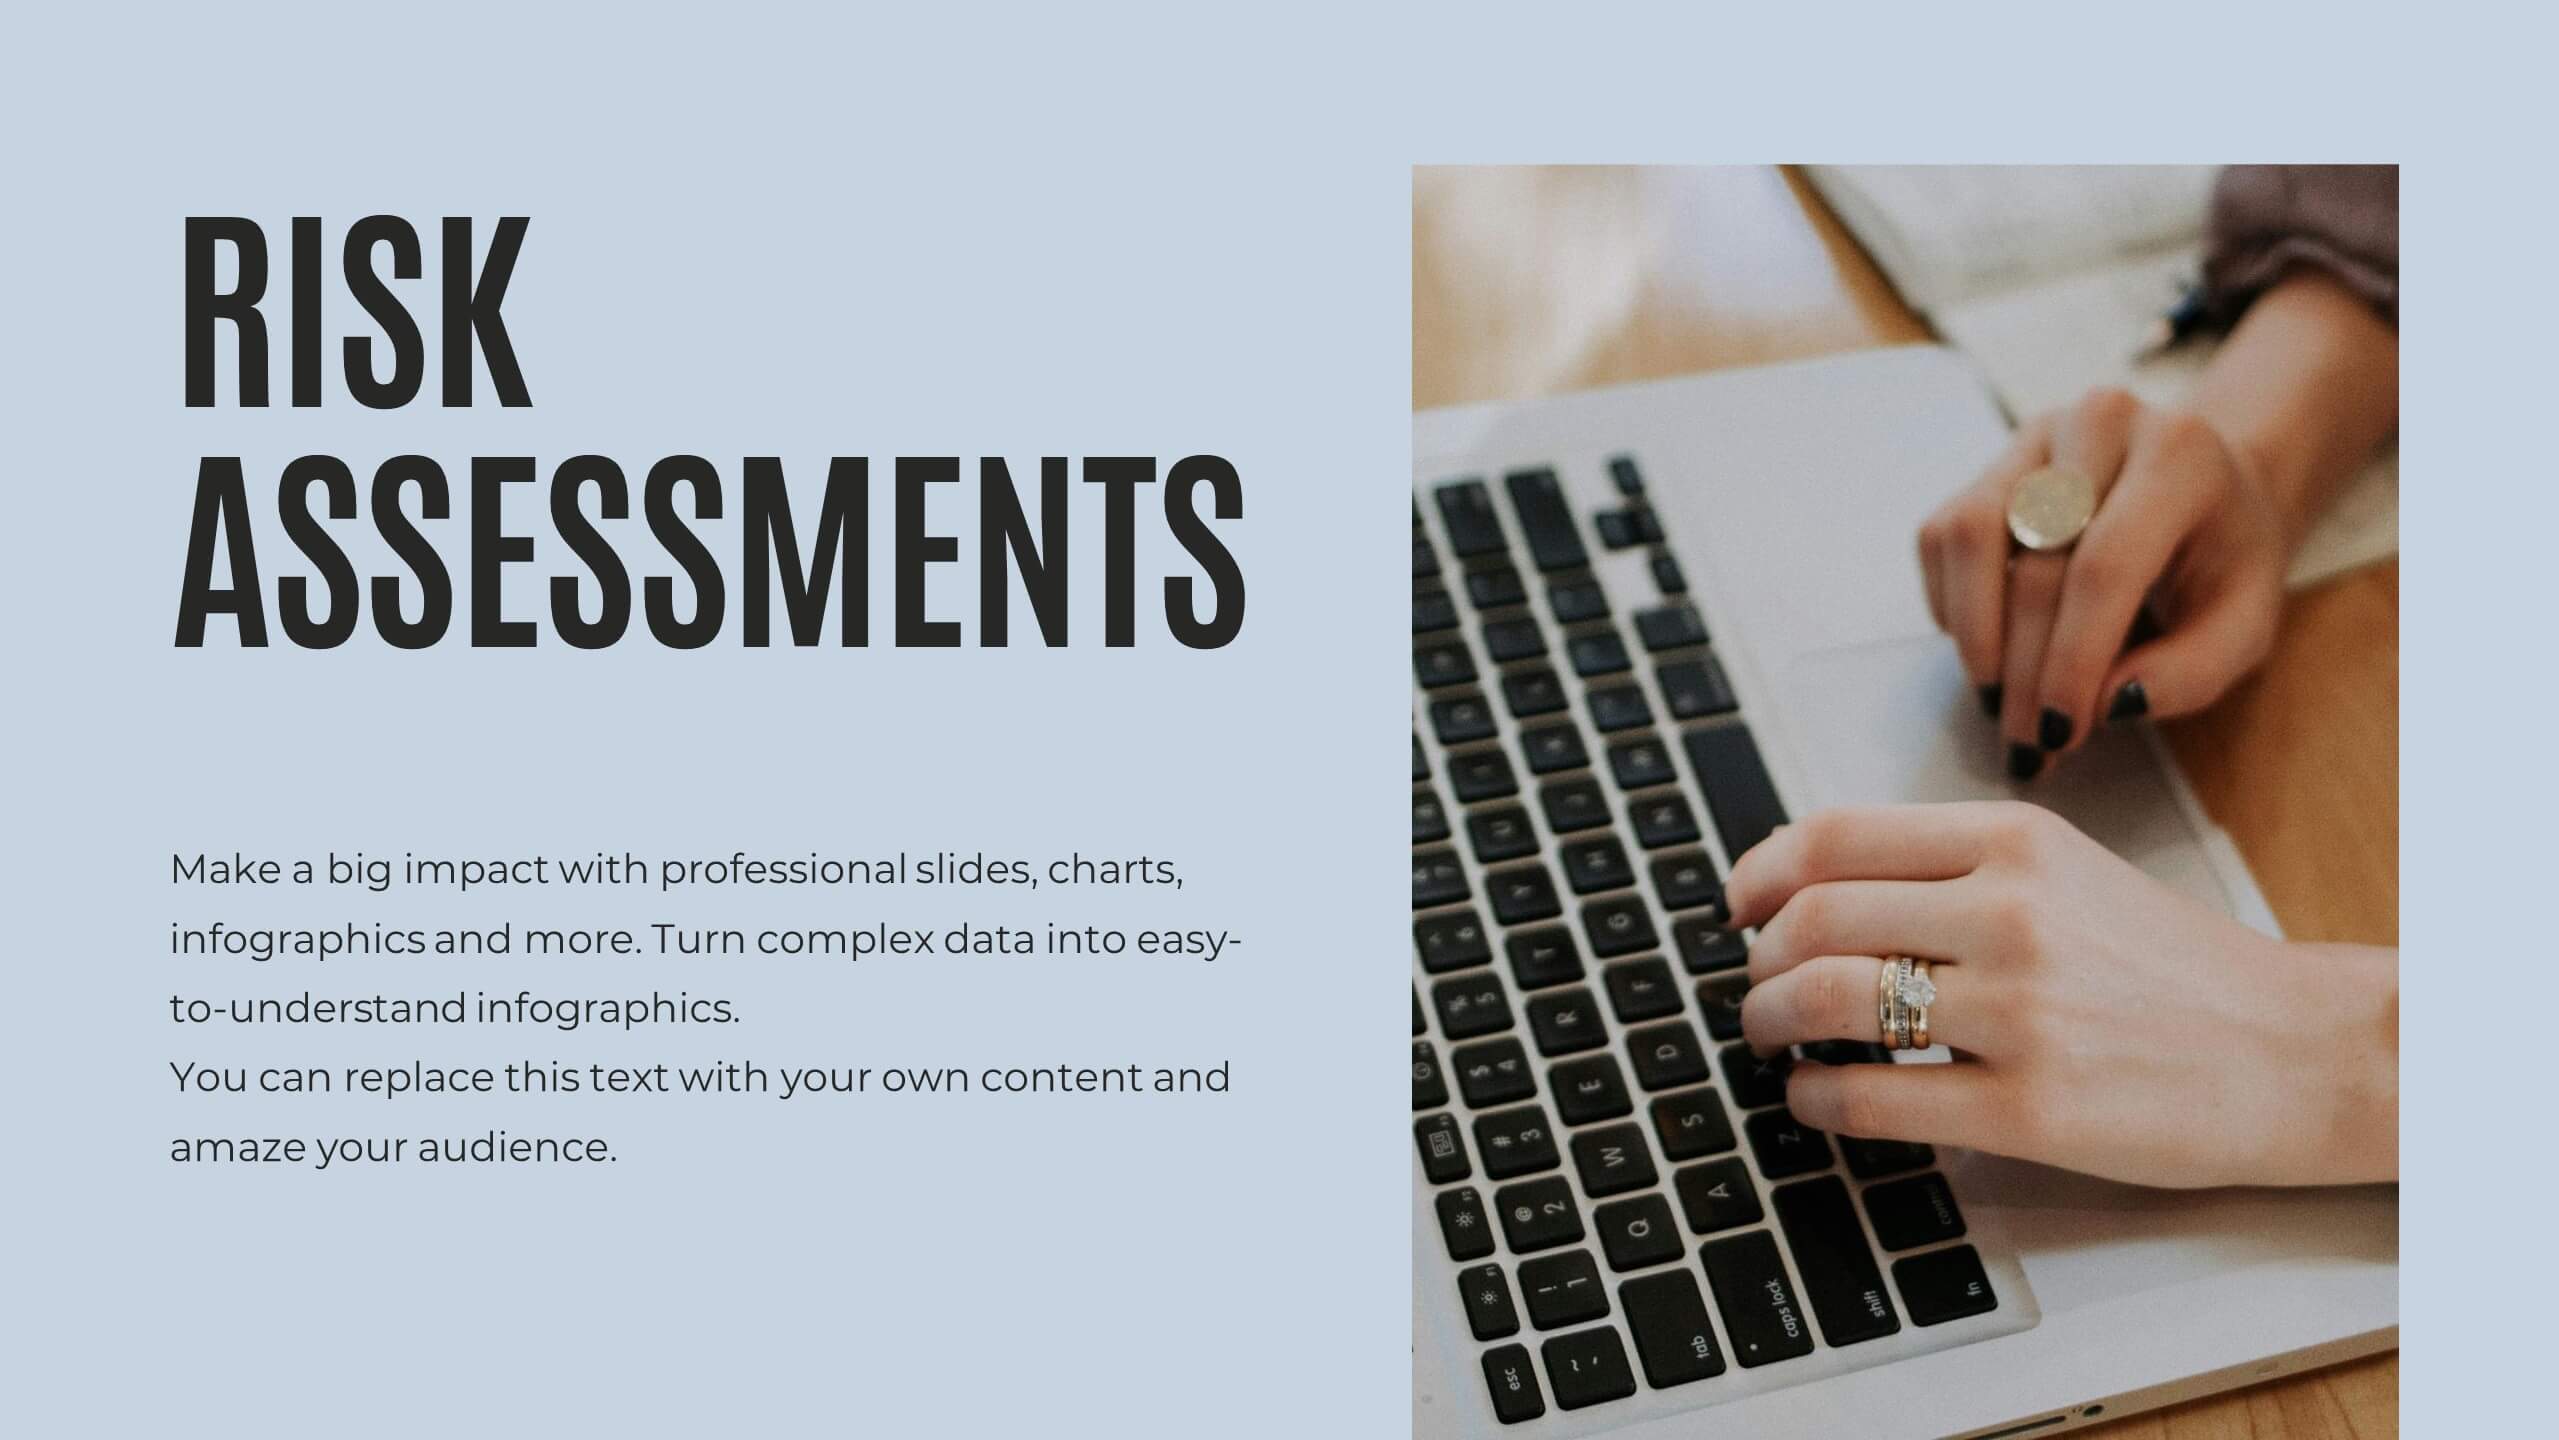
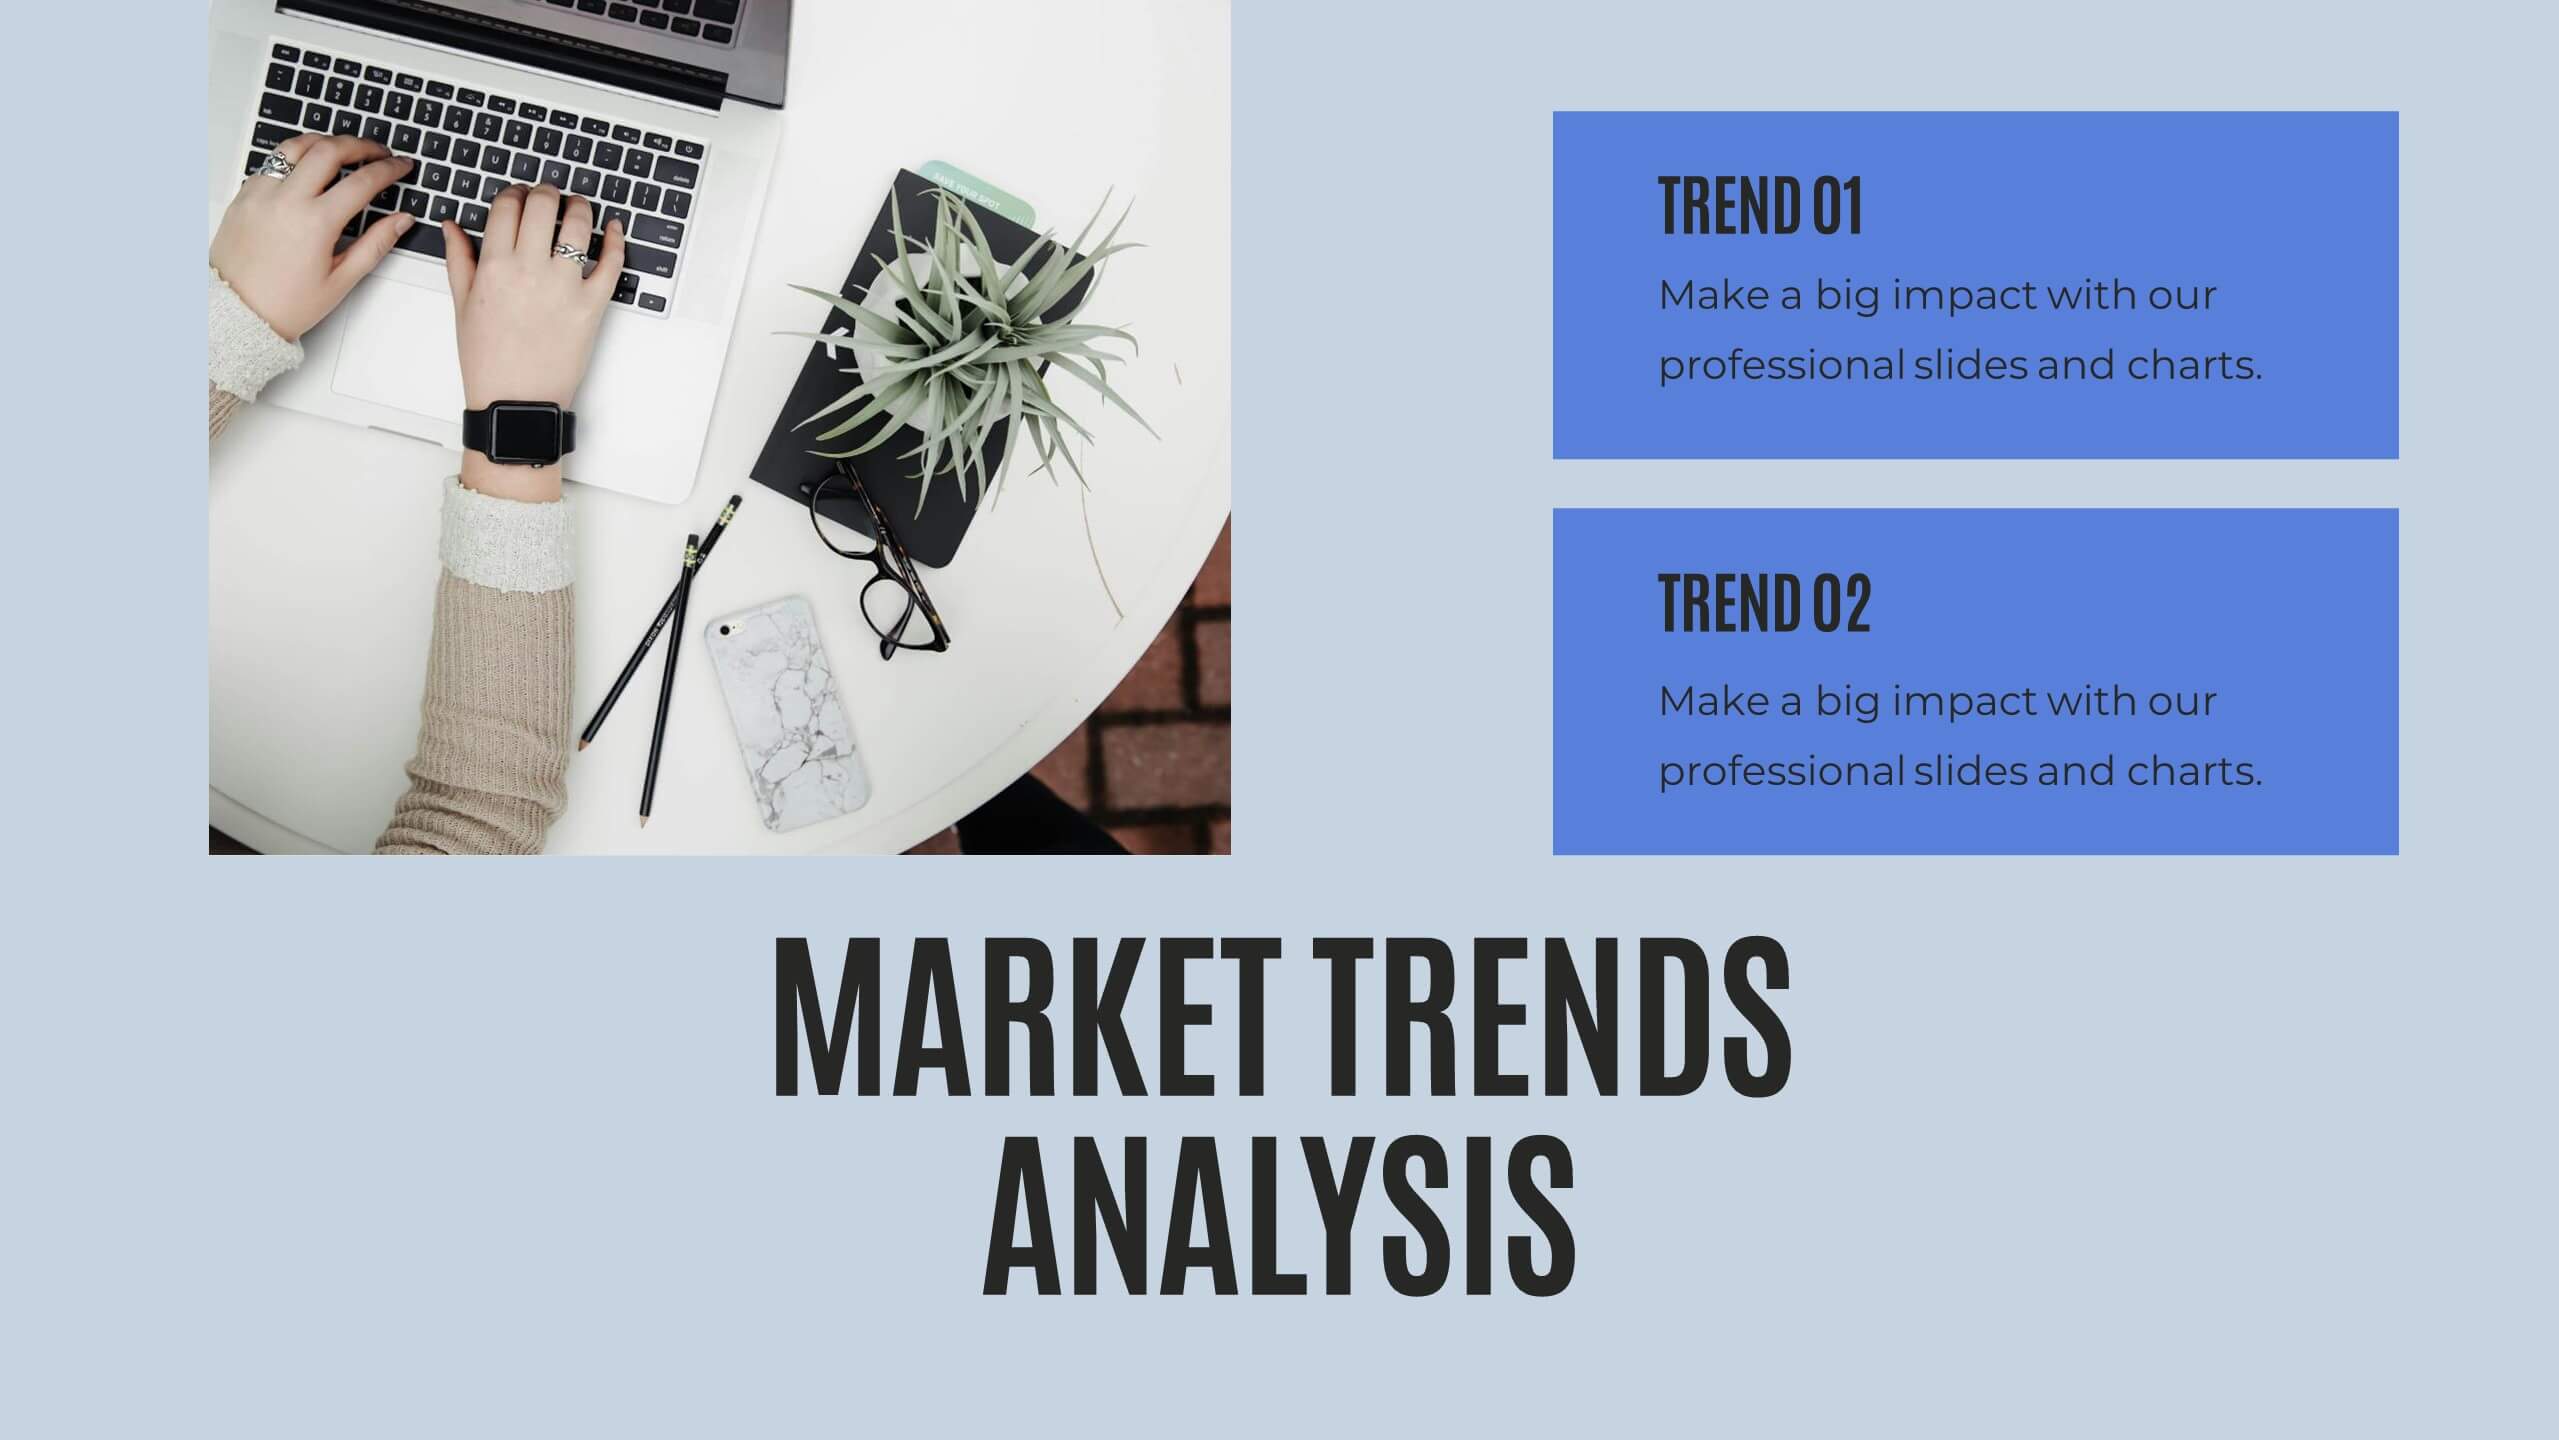
Quill Research Findings Report Presentation
Illuminate your findings with this comprehensive research report template! Perfect for presenting key highlights, performance metrics, and financial summaries, it features professional slides for project progress, risk assessments, and market trends analysis. Engage your audience with clear visuals and detailed content. Compatible with PowerPoint, Keynote, and Google Slides for seamless presentations on any platform.


6 diapositivas
Real Estate Housing Solutions Presentation
Present property features and real estate plans with this creative multi-level housing diagram. Designed for agents, developers, or housing consultants, this layout clearly segments space usage or service offerings. Fully customizable in PowerPoint, Keynote, and Google Slides—perfect for showcasing floor plans, room functions, or housing solutions with vibrant clarity.


5 diapositivas
Solution Building with Puzzle Framework Presentation
Present integrated strategies with the Solution Building with Puzzle Framework Presentation. This visually compelling layout uses a four-piece puzzle cross to represent interconnected ideas or components—perfect for mapping out project phases, strategic solutions, or department contributions. Fully customizable in Canva, PowerPoint, or Google Slides for easy content editing.


4 diapositivas
Funding and Investment Project Proposal Presentation
Unlock the potential of your next big venture with this vibrant and organized infographic presentation template! Perfect for outlining key stages from research to returns, this template makes complex investment strategies accessible and engaging. Tailor each segment to fit your project's unique needs. Compatible with PowerPoint, Keynote, and Google Slides, it's ideal for professionals looking to impress stakeholders and secure funding.


6 diapositivas
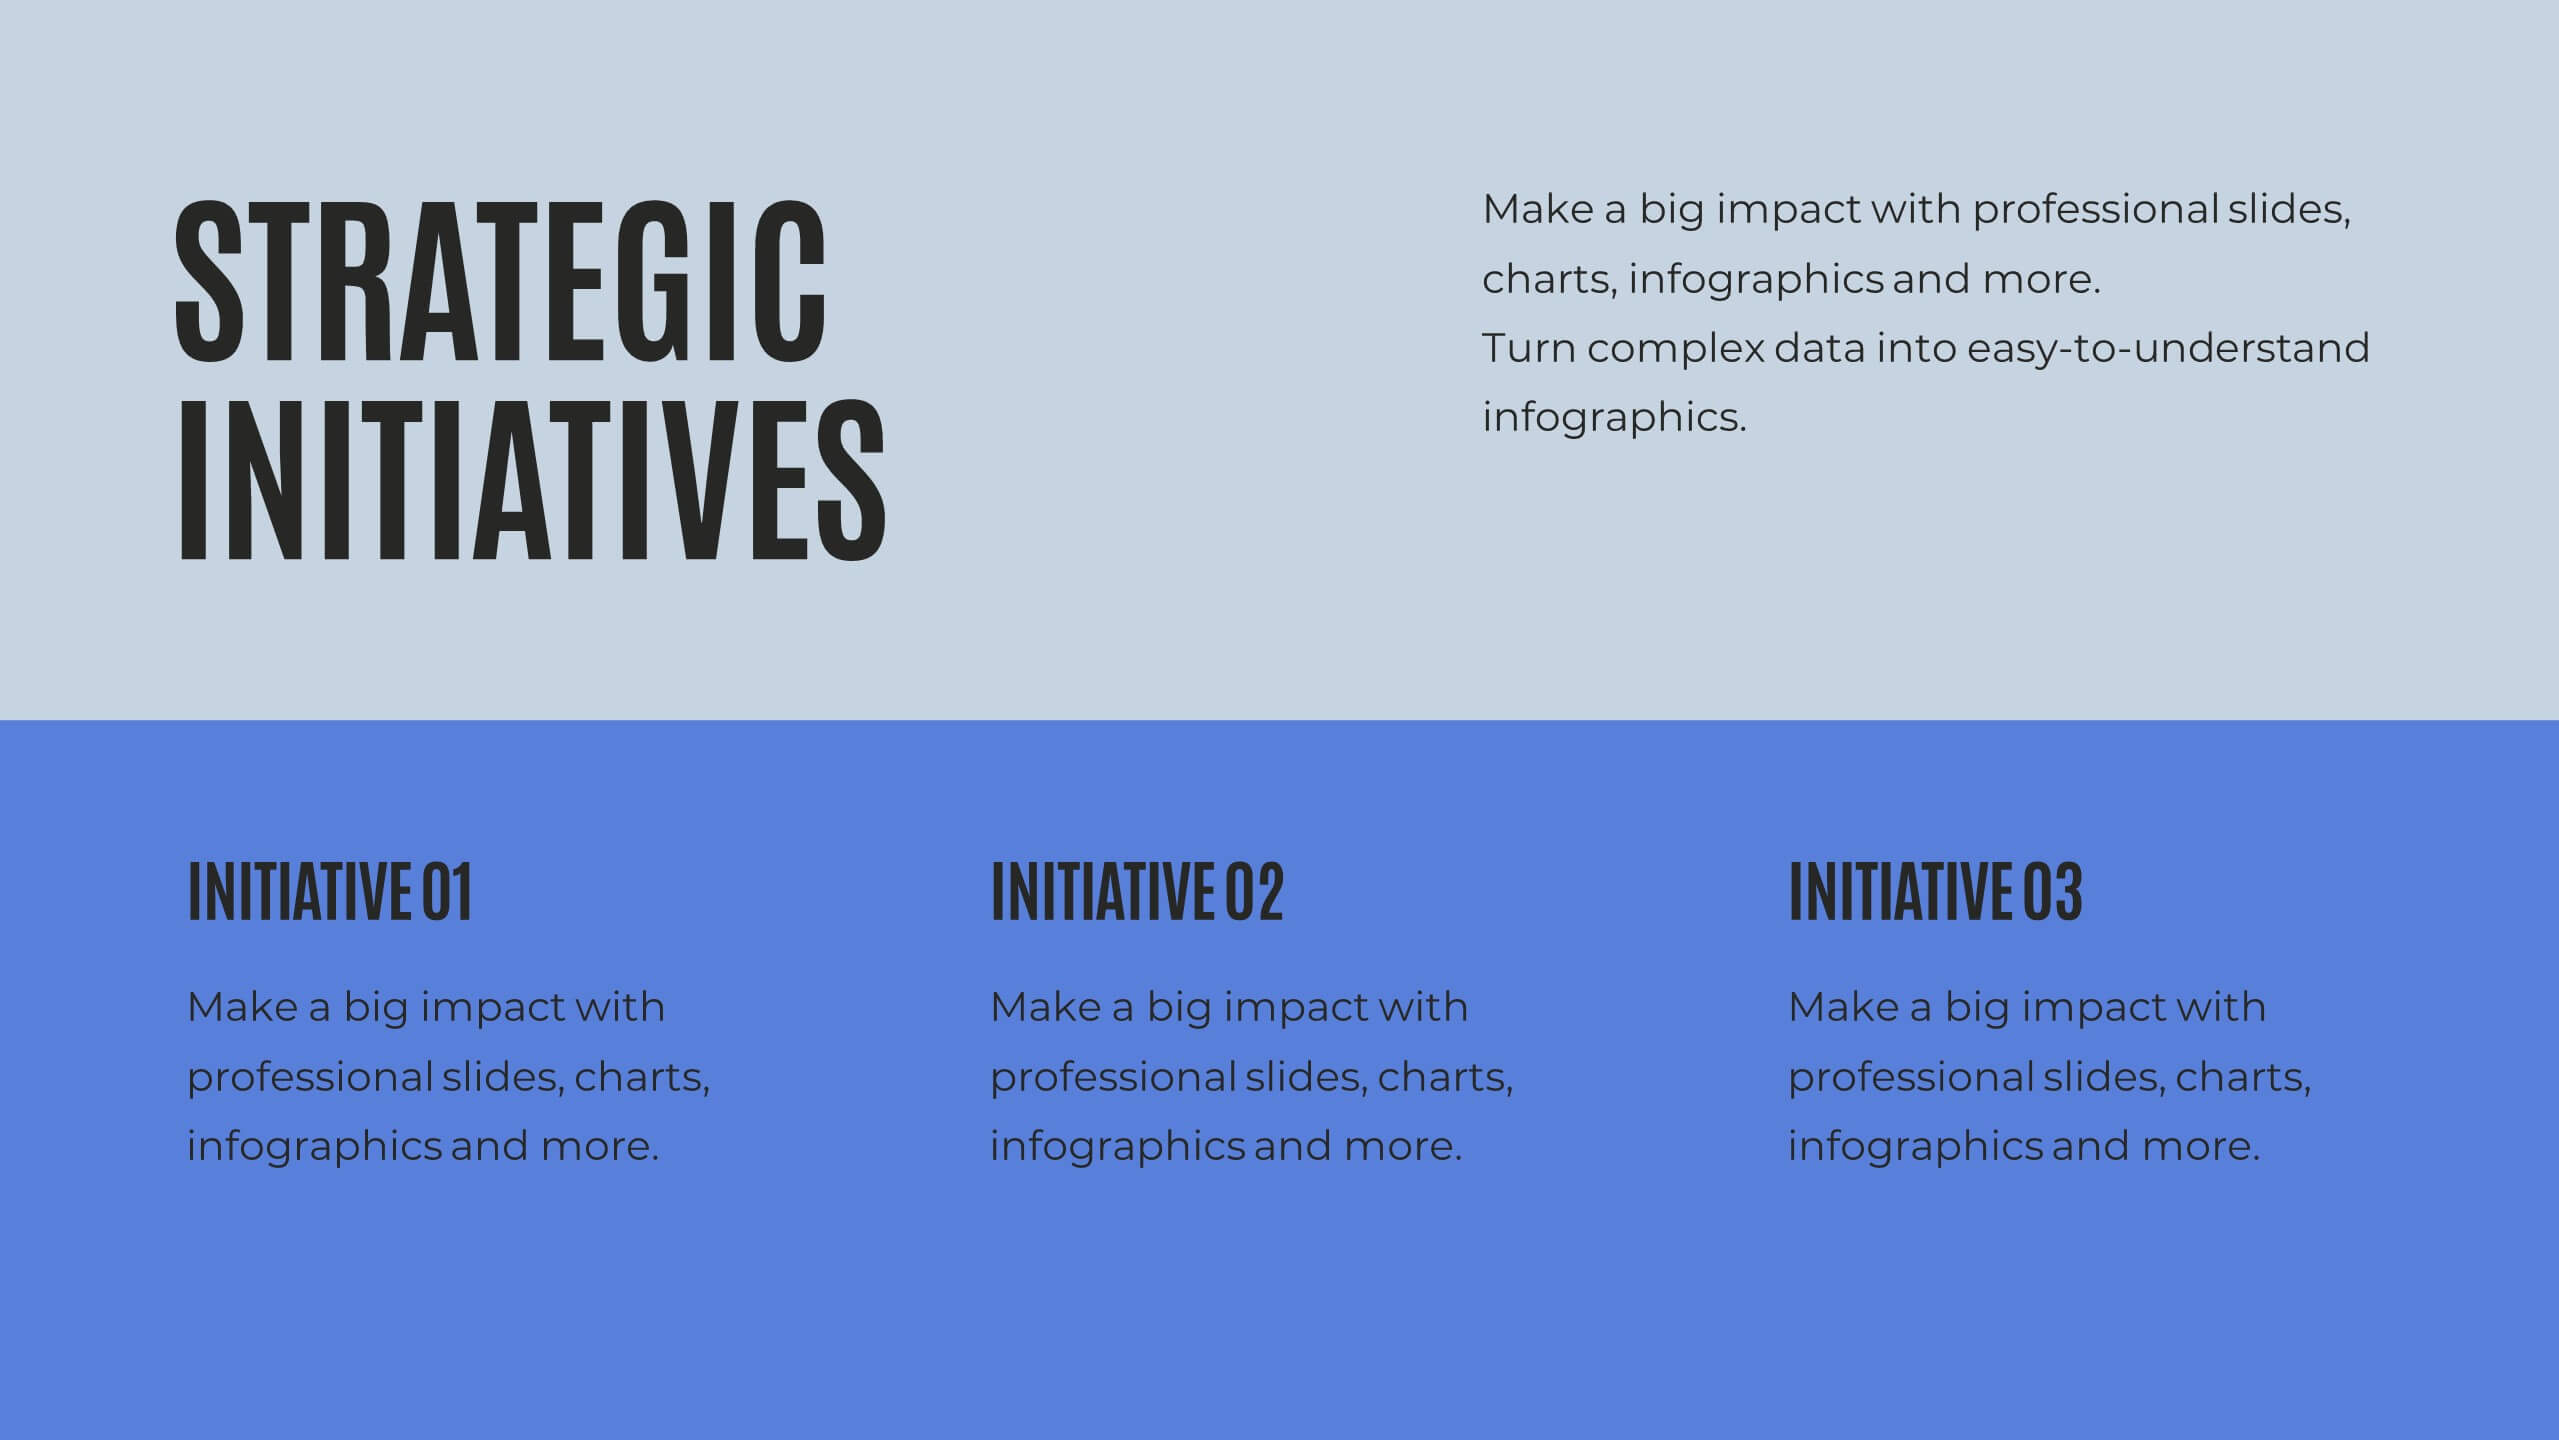
Business Decision Flow Model Presentation
Make smarter choices with this Business Decision Flow Model presentation. Clearly map out key decisions, steps, and potential outcomes using a structured, color-coded flow. Perfect for strategy reviews, team meetings, and executive briefings. Fully editable in Canva, PowerPoint, and Google Slides for seamless customization.


3 diapositivas
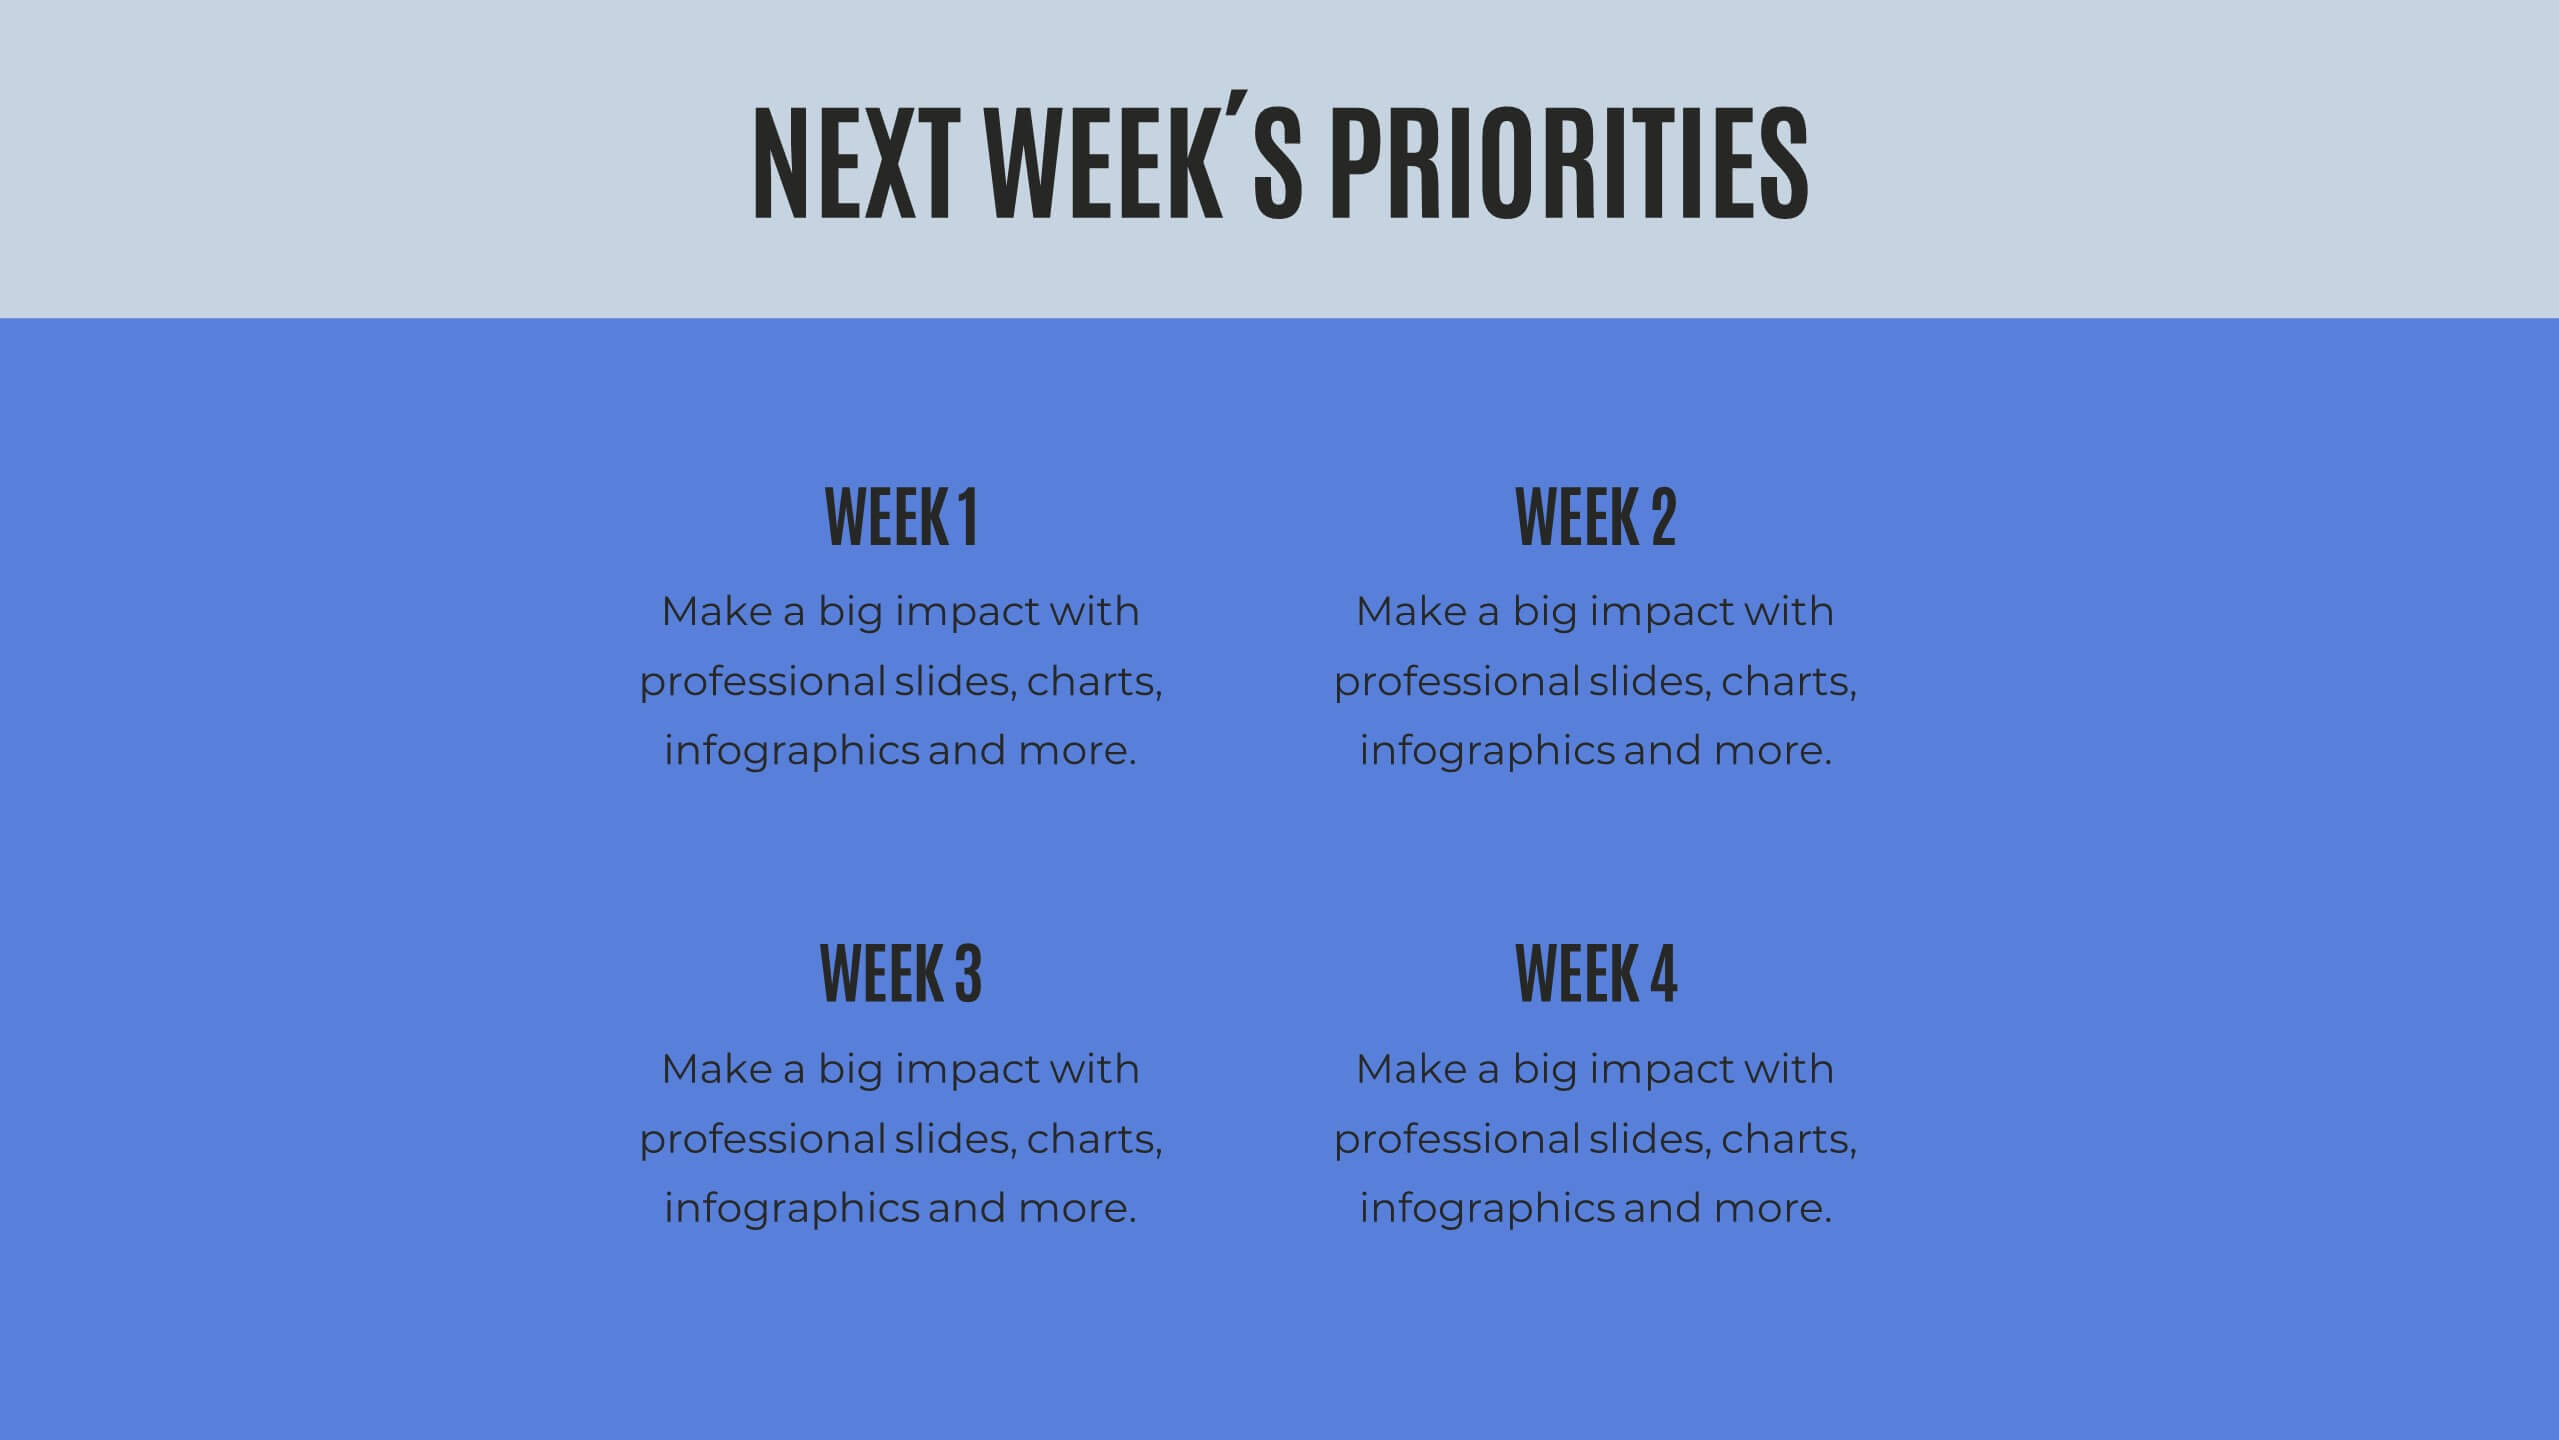
Company Vision Roadmap Presentation
Bring your future story to life with a clear, inspiring layout that guides viewers through your long-term direction and strategic milestones. This presentation helps teams communicate purpose, goals, and planned progress in a simple, structured format that’s easy to follow. Compatible with PowerPoint, Keynote, and Google Slides.