


Características


¿Tienes alguna pregunta?
Recomendar

21 diapositivas
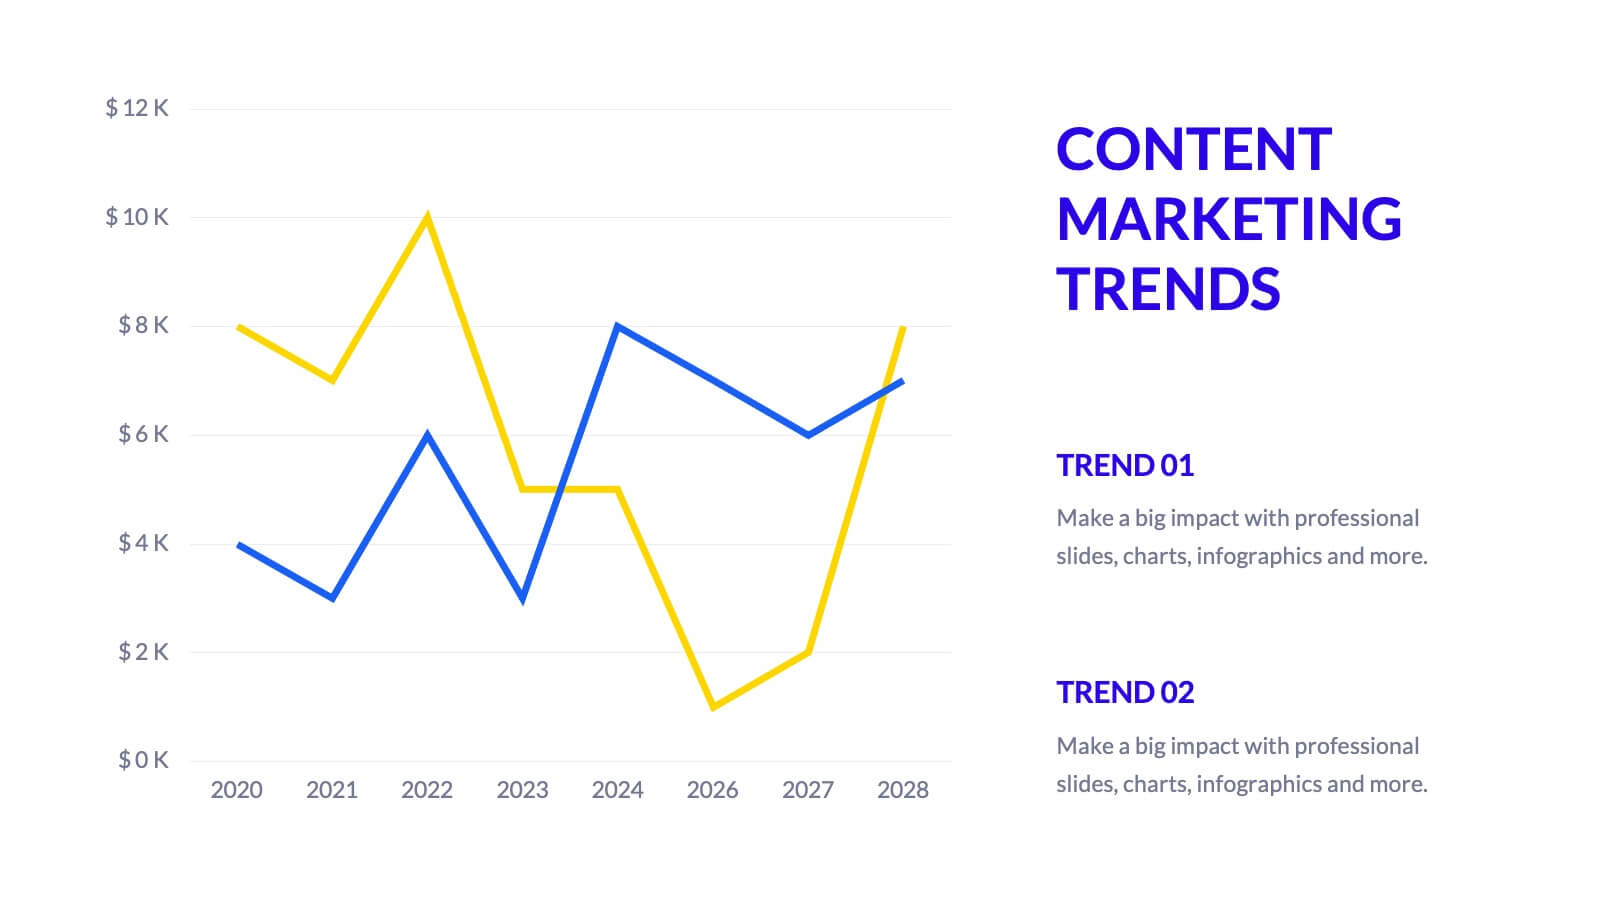
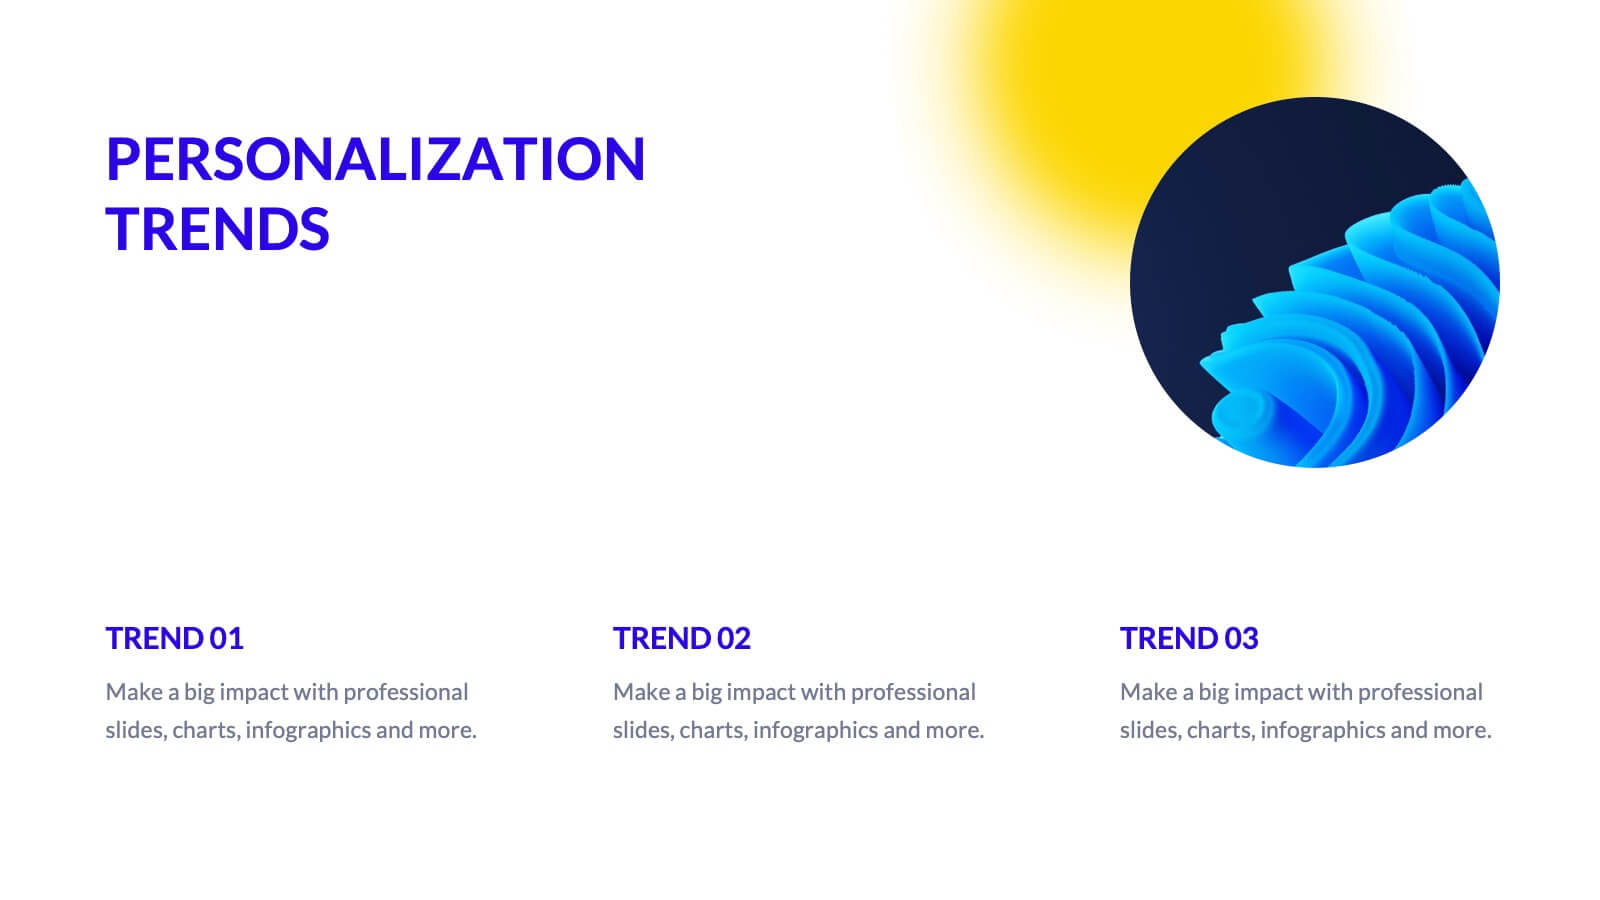
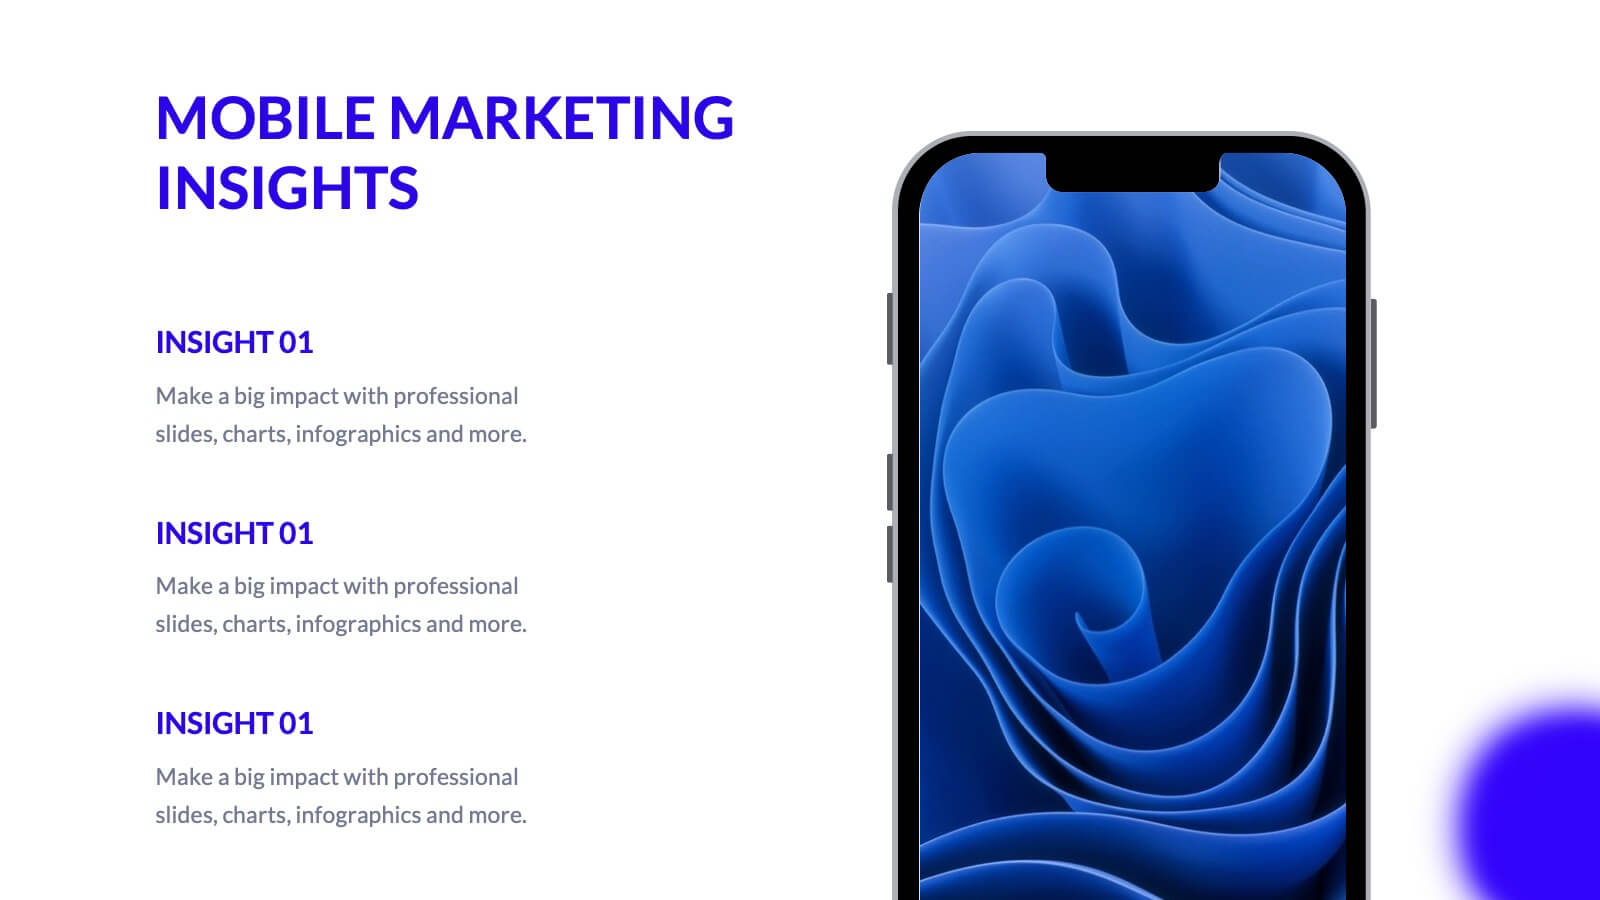
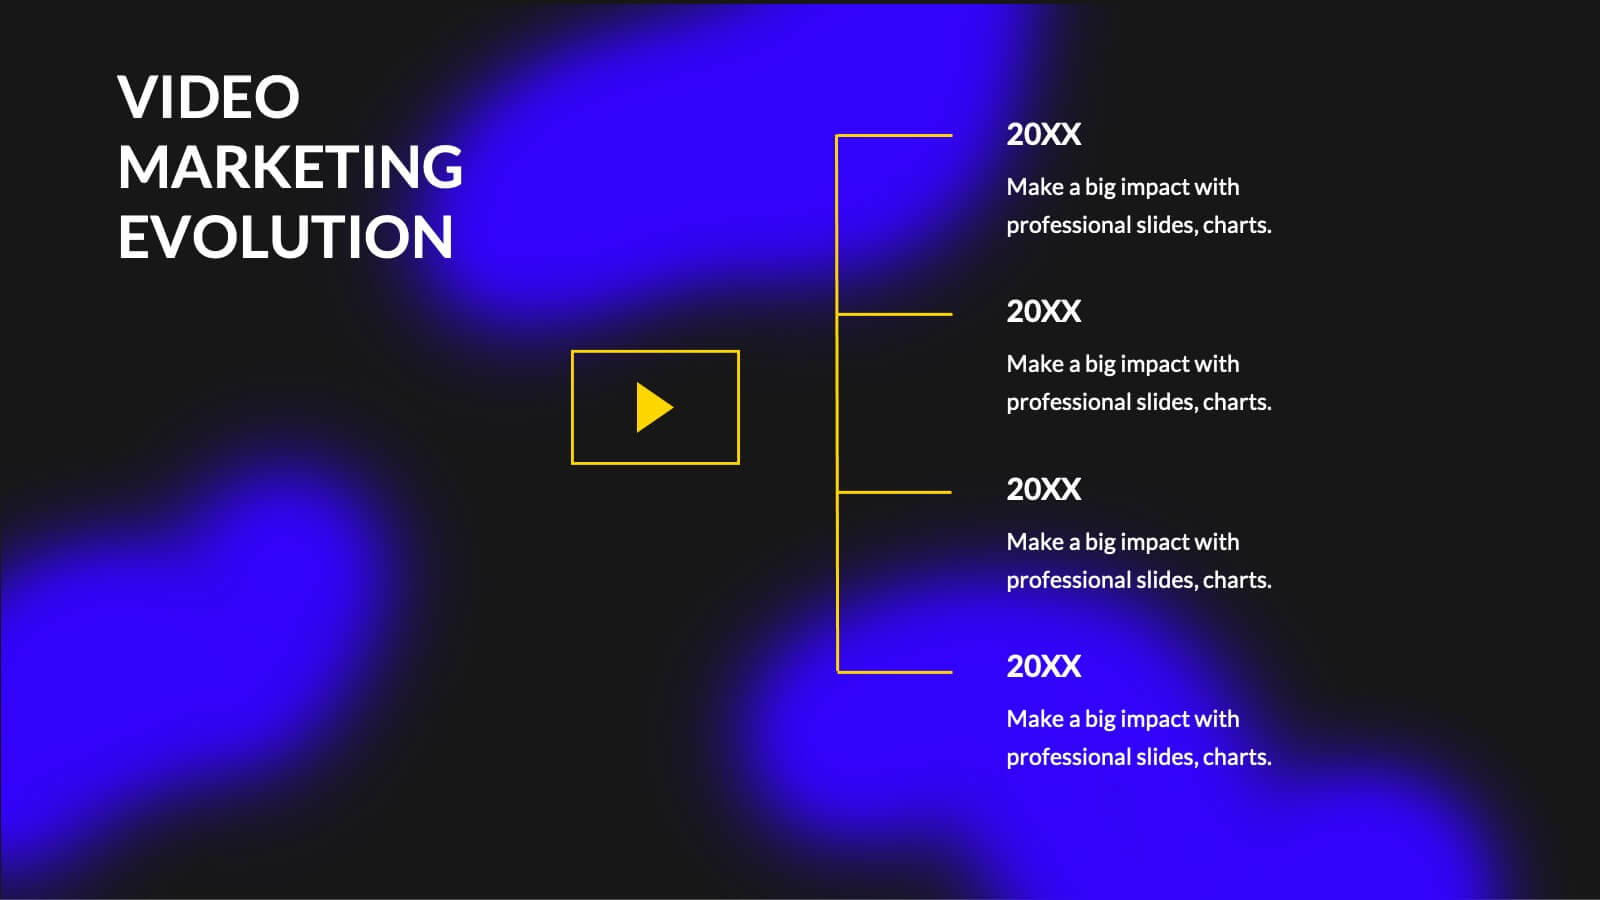
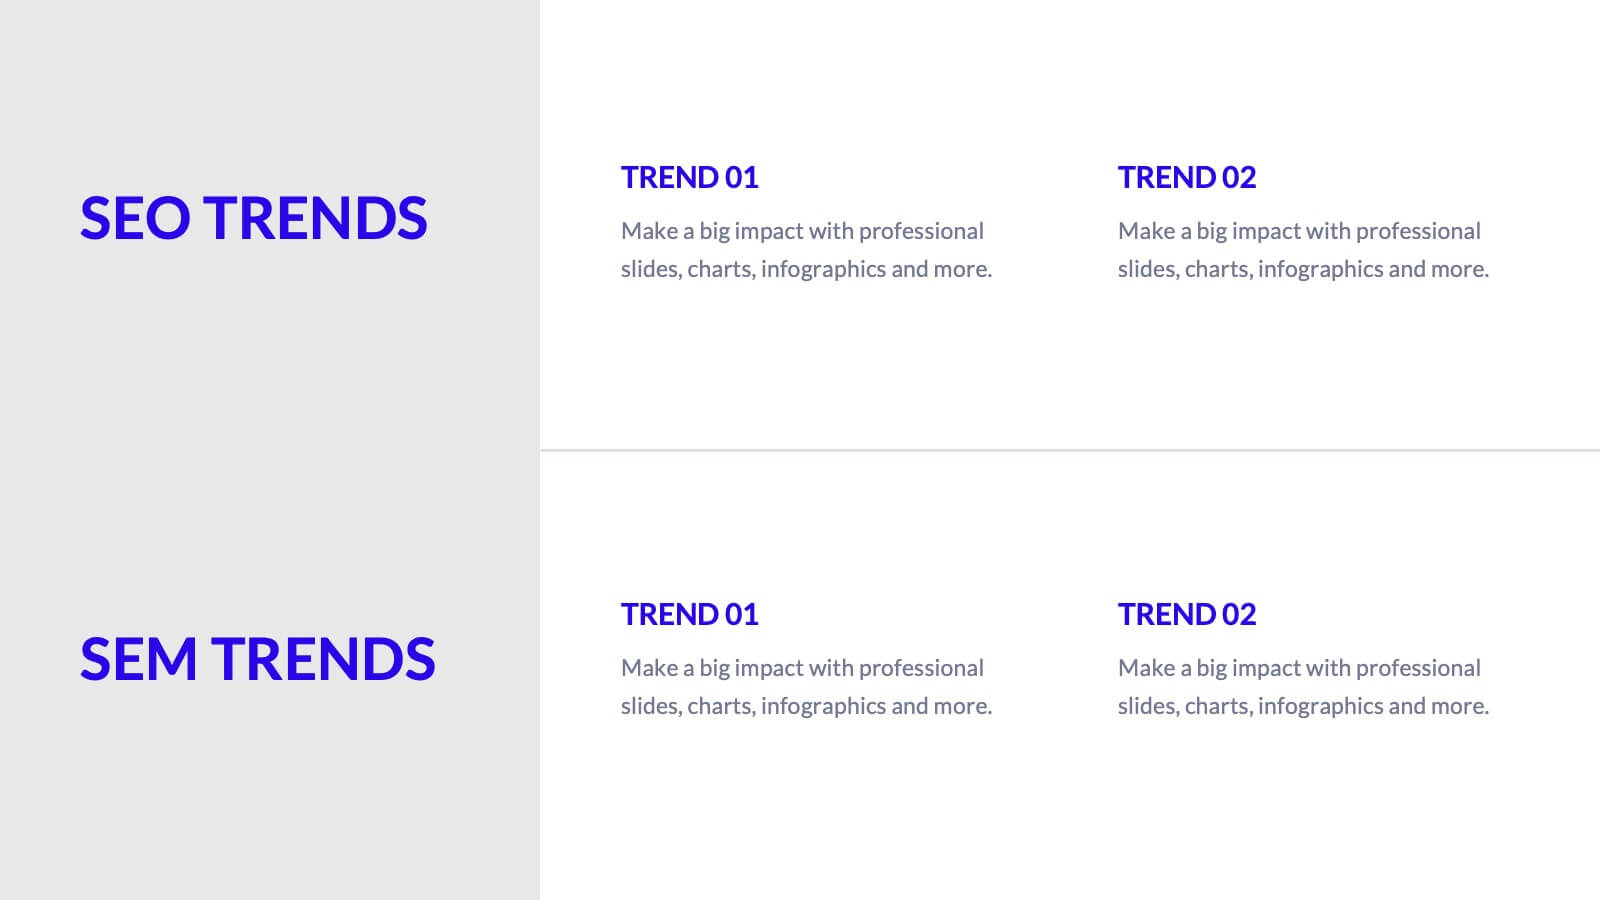
Catalyst Digital Marketing Strategy Plan Presentation
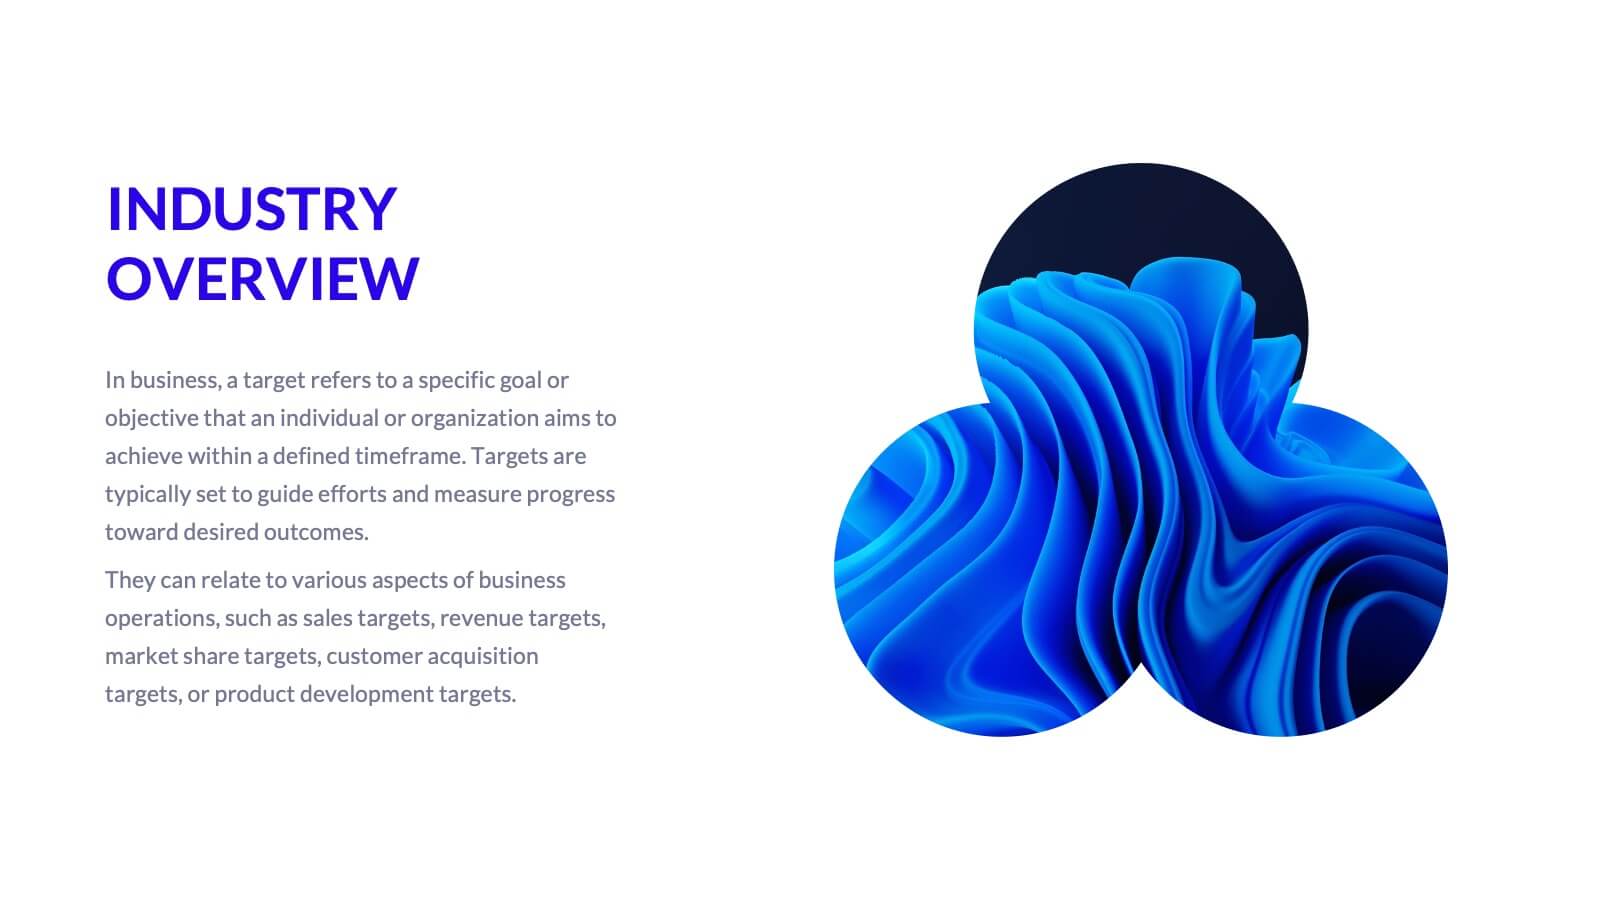
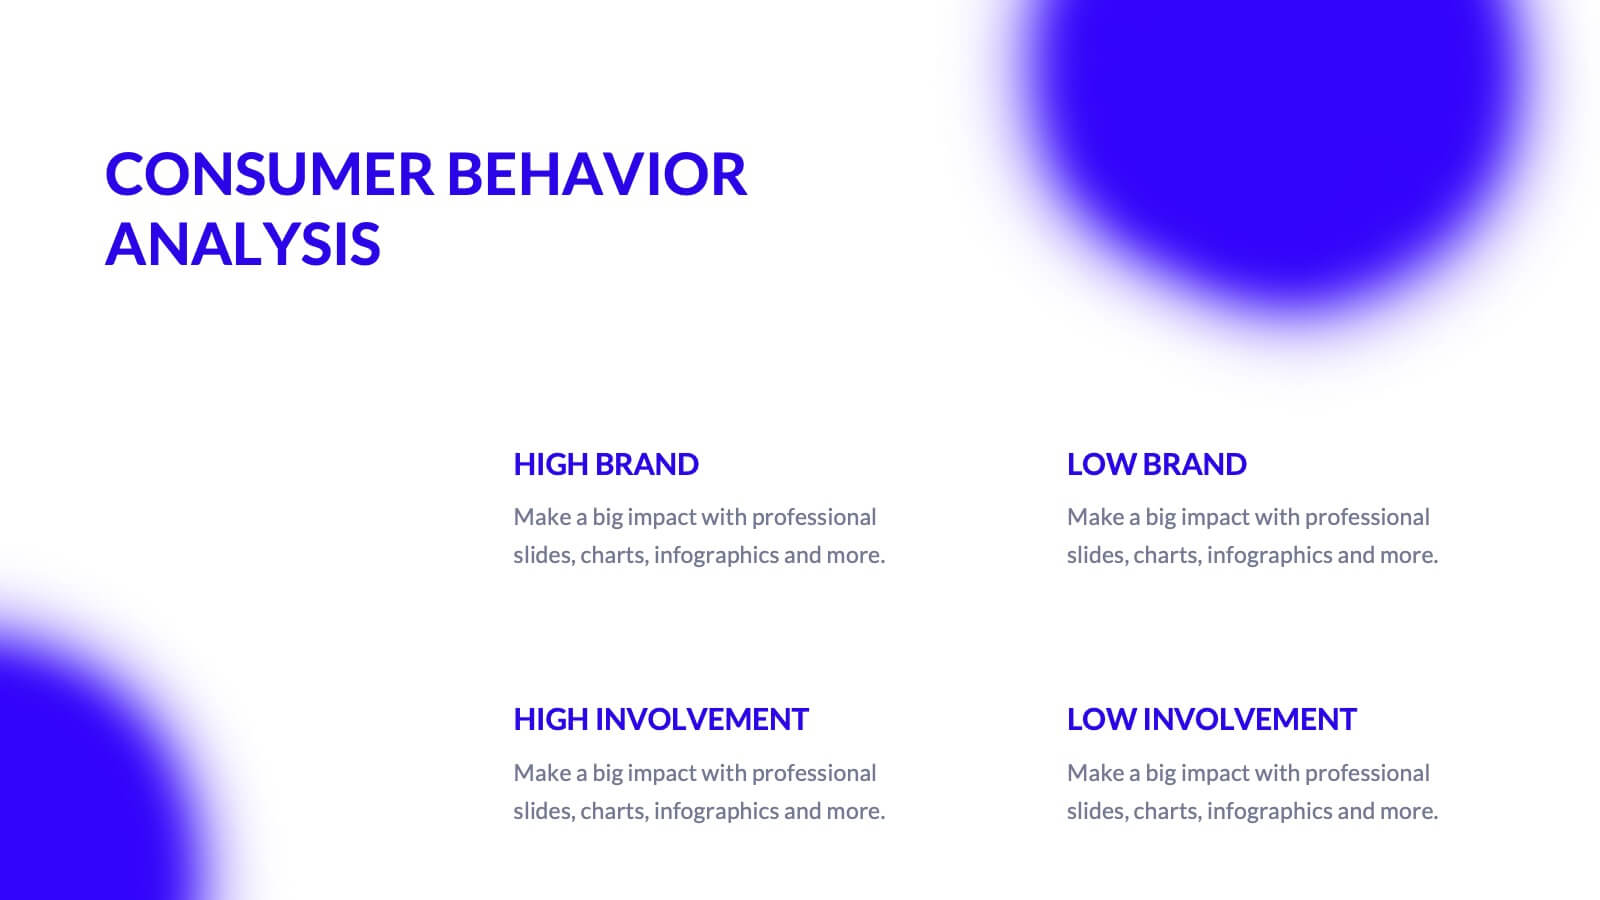
Supercharge your digital marketing strategy with this vibrant, modern presentation template. Perfect for detailing industry overviews, consumer behavior analysis, and social media strategies, it features a dynamic design that captures attention. Highlight key trends like SEO, influencer marketing, and e-commerce to engage your audience. Compatible with PowerPoint, Keynote, and Google Slides, it ensures seamless presentations on any platform.


7 diapositivas
Money Infographic Presentation Template
Our Money Infographic is a great way to make an infographic that is visually appealing using shapes, objects and more. Create your own template style with this tool that you can use for presenting data on financial aspects in an interesting way. This template is a great tool to present your company's statics and figures. It features a clean and professional design that will stand out. With our Infographic template, you can create a professional presentation with all the information you need. This design is completely customizable so that you can add text and images, change colors, and more!


7 diapositivas
Business Timeline Infographics
A business timeline is a graphical or chronological representation that illustrates significant events, milestones, or activities within a business or project over a specific period. Embark on a visual voyage through your business's evolution with our business timeline infographic template. Fully customizable and compatible with Powerpoint, Keynote, and Google Slides. This vibrant and informative template is your canvas to fully narrate compellingly. Our timeline infographic is more than a timeline; it's a visual testament to your business's resilience, growth, and future potential!


10 diapositivas
Financial Growth Planning
Visualize your path to financial success with this puzzle-themed Financial Growth Planning template. Each step connects seamlessly to outline investment goals, budgeting strategies, or revenue milestones. Designed for clarity and impact, it's fully editable in PowerPoint, Keynote, and Google Slides for effortless customization.


6 diapositivas
TAM SAM SOM Market Analysis
Take your market insights to the next level with a visual that simplifies complex data in seconds. This layered template helps you clearly communicate TAM, SAM, and SOM breakdowns—perfect for startups, product pitches, or strategic planning. Easily editable in PowerPoint, Keynote, and Google Slides for fast, polished presentations.


2 diapositivas
Website UI Mockup Device Display Presentation
Showcase your website's interface with the Website UI Mockup Device Display slide. This professional and modern layout features a desktop screen to elegantly present your web design, user interface, or digital product. Perfect for designers, developers, and marketing presentations. Fully editable and compatible with PowerPoint, Keynote, and Google Slides.


5 diapositivas
Leadership and Team Dynamics Strategy Presentation
Highlight team hierarchy and leadership flow with the Leadership and Team Dynamics Strategy Presentation. This visual layout is ideal for mapping roles, responsibilities, or reporting lines. Use it to clarify leadership structures or showcase team development plans. Fully customizable in PowerPoint, Keynote, and Google Slides for seamless strategic communication.


4 diapositivas
Crypto Investment Strategies Presentation
Dive into the dynamic world of cryptocurrency with our "Crypto Investment Strategies" presentation templates. These templates provide a structured approach to exploring various investment strategies, perfect for financial advisors and crypto enthusiasts. Easily editable and visually engaging, they're designed to help you present complex information in a clear manner. Compatible with PowerPoint, Keynote, and Google Slides, they offer flexibility across different platforms, ensuring your presentation looks great no matter where you show it.


26 diapositivas
Fintech Presentation
Venture into the dynamic world of financial technology with this electrifying presentation template, designed to captivate and inform. The contrast of bold colors against a dark backdrop represents the innovative spirit of fintech, inviting a journey into the digital transformation of finance. Each slide, adorned with vibrant splashes and futuristic motifs, serves as a beacon guiding the audience through the complex landscape of mobile payments, blockchain, and peer-to-peer lending. Intended for entrepreneurs, investors, and educators, this template bridges the gap between complex financial concepts and accessible understanding. Infographics illuminate trends and statistics, while vivid images capture the essence of modern finance — all in a format that's as engaging as it is educational. Perfect for seminars, webinars, or classroom settings, this template offers a visual narrative of fintech's rise, its impact on economies, and the boundless potential of this booming industry. Embrace the fintech revolution and lead the charge towards a tech-savvy financial future.


5 diapositivas
Decision-Making Options
Visualize your strategic paths with this step-by-step decision-making infographic. Designed to showcase up to five sequential options or phases, this template uses bold icons and numbering to guide viewers through the process. Ideal for business strategies, project planning, or process evaluations. Fully editable in PowerPoint, Keynote, and Google Slides.


6 diapositivas
Corporation Schedule Infographics
Elevate your corporate presentations with our Corporation Schedule infographic, expertly designed for compatibility with Powerpoint, Keynote, and Google Slides. This practical and polished infographic is an exceptional resource for managers, team leads, and event coordinators planning and presenting schedules, timelines, and agendas. The infographic is structured to visually organize and communicate a corporation's schedule, making it an invaluable tool for outlining project timelines, meeting agendas, or corporate event itineraries. Its clear, concise format is specifically tailored to the business environment, where readability and quick comprehension are paramount. Integrating this infographic into your presentation will not only enhance its professional appearance but also facilitate effective time management and ensure alignment across teams. Whether you’re detailing a week-long conference schedule or outlining a project’s phases, this infographic provides a streamlined approach to sharing that information with your audience. It’s a strategic way to keep everyone informed and focused on the company's key timeframes and objectives.


6 diapositivas
Business Plan Next Steps
Guide your team through the upcoming phases of your business plan with this sleek, arrow-style step diagram. Perfect for showcasing 3 sequential actions, each block includes space for icons, step numbers, and supporting text. Ideal for strategy rollouts, roadmap discussions, or project planning. Fully editable in PowerPoint, Keynote, and Google Slides.


6 diapositivas
Butterfly Chart Data Visualization
Present complex comparisons with visual elegance using the Butterfly Chart Data Visualization Presentation. This eye-catching format displays six key data points split symmetrically across two wings—perfect for showcasing contrasts like pros vs. cons, before vs. after, or product comparisons. Each section is color-coded and paired with editable text areas for clarity. Ideal for reports, strategy meetings, and decision-making decks. Fully compatible with PowerPoint, Keynote, and Google Slides for effortless customization.


5 diapositivas
Risk and Return Investment Presentation
Navigate the high seas of finance with our captivating infographic presentation template, designed to visually break down the complex relationship between risk and return in investments. This template simplifies presenting key data points, making it ideal for financiers and investors looking to make informed decisions. Each slide is meticulously crafted to ensure clarity and impact, highlighting the balance of potential rewards against possible risks. Perfect for use in PowerPoint, Keynote, and Google Slides, this template is a must-have tool for anyone in the financial sector aiming to convey their strategy with precision and flair.


4 diapositivas
Event Planning and Calendar Timeline Presentation
Plan smarter, not harder! This sleek timeline infographic is perfect for keeping your event plans organized and on track. Whether you're managing a multi-day conference or a team schedule, this visual template makes deadlines and tasks crystal clear. Fully compatible with PowerPoint, Keynote, and Google Slides for seamless editing and presentation.


10 diapositivas
5 Step Business Growth Presentation
The "5 Step Business Growth Presentation" template is designed to clearly depict progressive strategies in business development. Featuring a visually engaging staircase-style layout, this infographic effectively guides viewers through sequential stages, making it perfect for presentations that outline growth phases or strategic processes. Each step is color-coded and provides sufficient space to elaborate on key points, ensuring clarity and emphasis on important data. Ideal for use in business strategy meetings or any setting requiring a structured presentation of development stages, this template is versatile and compatible with various presentation platforms, enhancing the visual appeal and comprehension of your message.


5 diapositivas
Product Roadmap Presentation
The "Product Roadmap Infographic" template is ideal for presenting the strategic vision and progressive steps for product development. This template outlines the roadmap through a creative and visually engaging route-style layout, designed to highlight key milestones and stages in the product lifecycle, from conception to launch. Each point on the roadmap is clearly marked for specific goals or achievements, encouraging clarity and understanding among stakeholders about the direction and progress of the product. This layout is perfect for product managers and teams to communicate timelines, prioritize tasks, and align goals during presentations in corporate settings.