


Características


¿Tienes alguna pregunta?
Recomendar


5 diapositivas
Customer Satisfaction Survey Ratings Presentation
Present customer insights with clarity using this Customer Satisfaction Survey Ratings slide. Designed with a vertical timeline beside a thumbs-up icon, it’s perfect for showcasing key survey data, feedback percentages, or sentiment trends. Each rating step includes editable text and color-coded markers for easy comparison. Compatible with PowerPoint, Canva, and Google Slides.
5 diapositivas
Tracking Milestones and SMART Goals Presentation
Visualize your SMART goals with clarity using this arrow-based infographic template. Each step—Specific, Measurable, Achievable, Relevant, and Time-bound—is clearly segmented to track progress and prioritize objectives. Fully editable in Canva, PowerPoint, and Google Slides, it’s perfect for planners, project managers, and strategists seeking to streamline goal achievement.


7 diapositivas
Female Anatomy Infographic
Anatomy is the branch of biology that focuses on the structure and organization of living things. Step into a world of discovery with our infographic template, this is an enlightening visual guide that celebrates the intricate beauty and functionality of the female body. This infographic is designed to educate and empower, offering a clear and artistic representation of the anatomy that defines women. This template will take your audience through an educational journey through the various systems that make up a woman's body. This is fully customizable and compatible with Powerpoint, Keynote, and Google Slides.

23 diapositivas
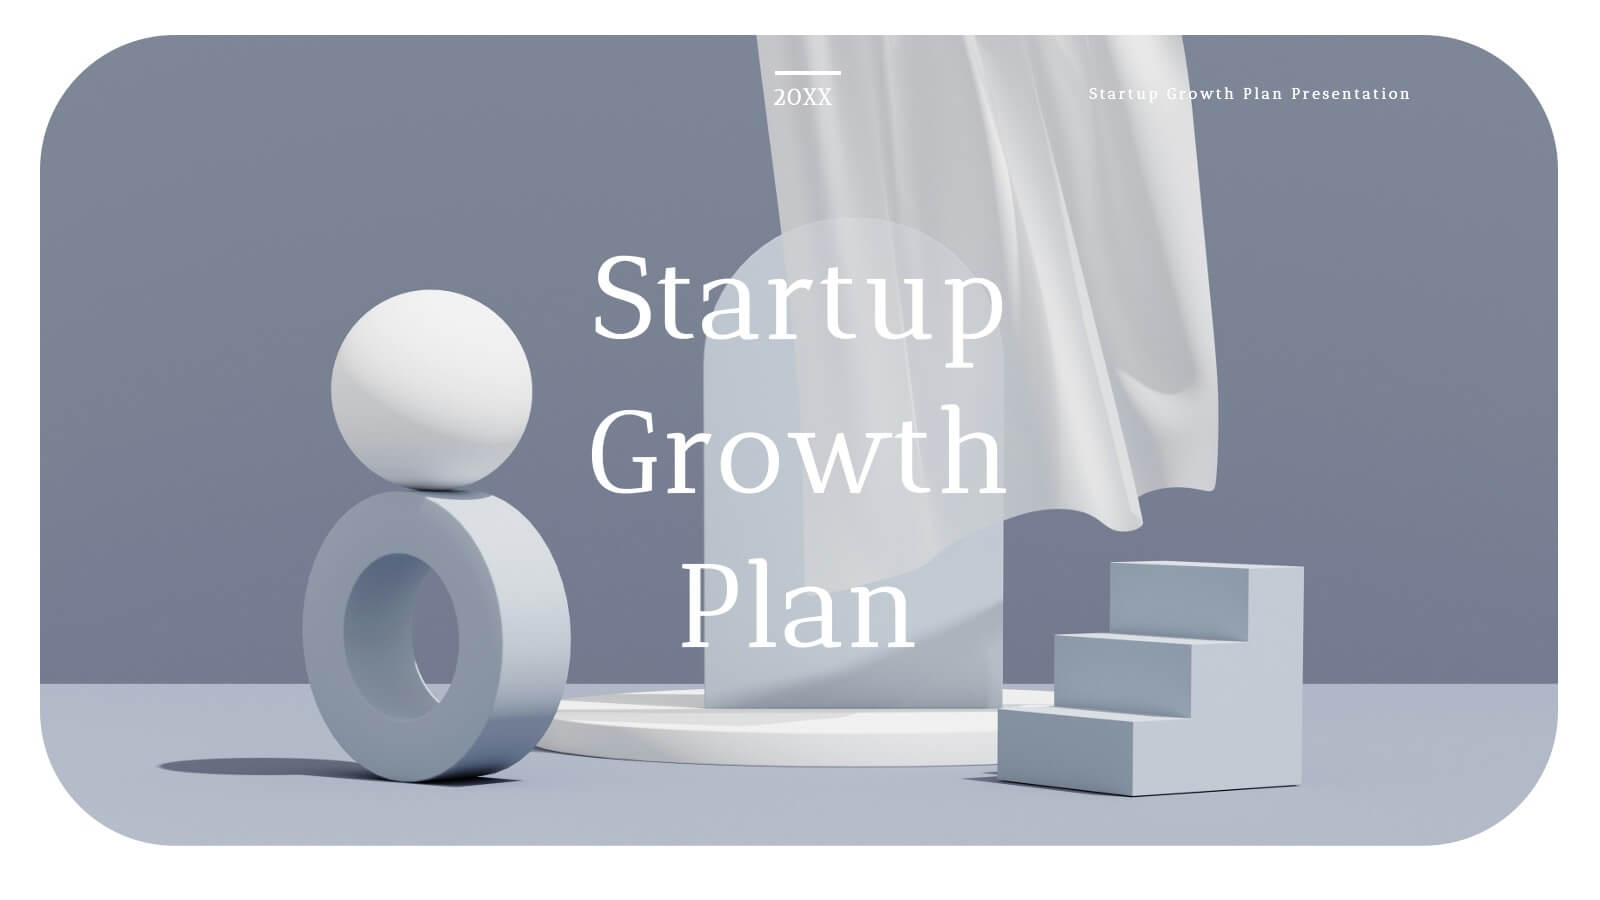
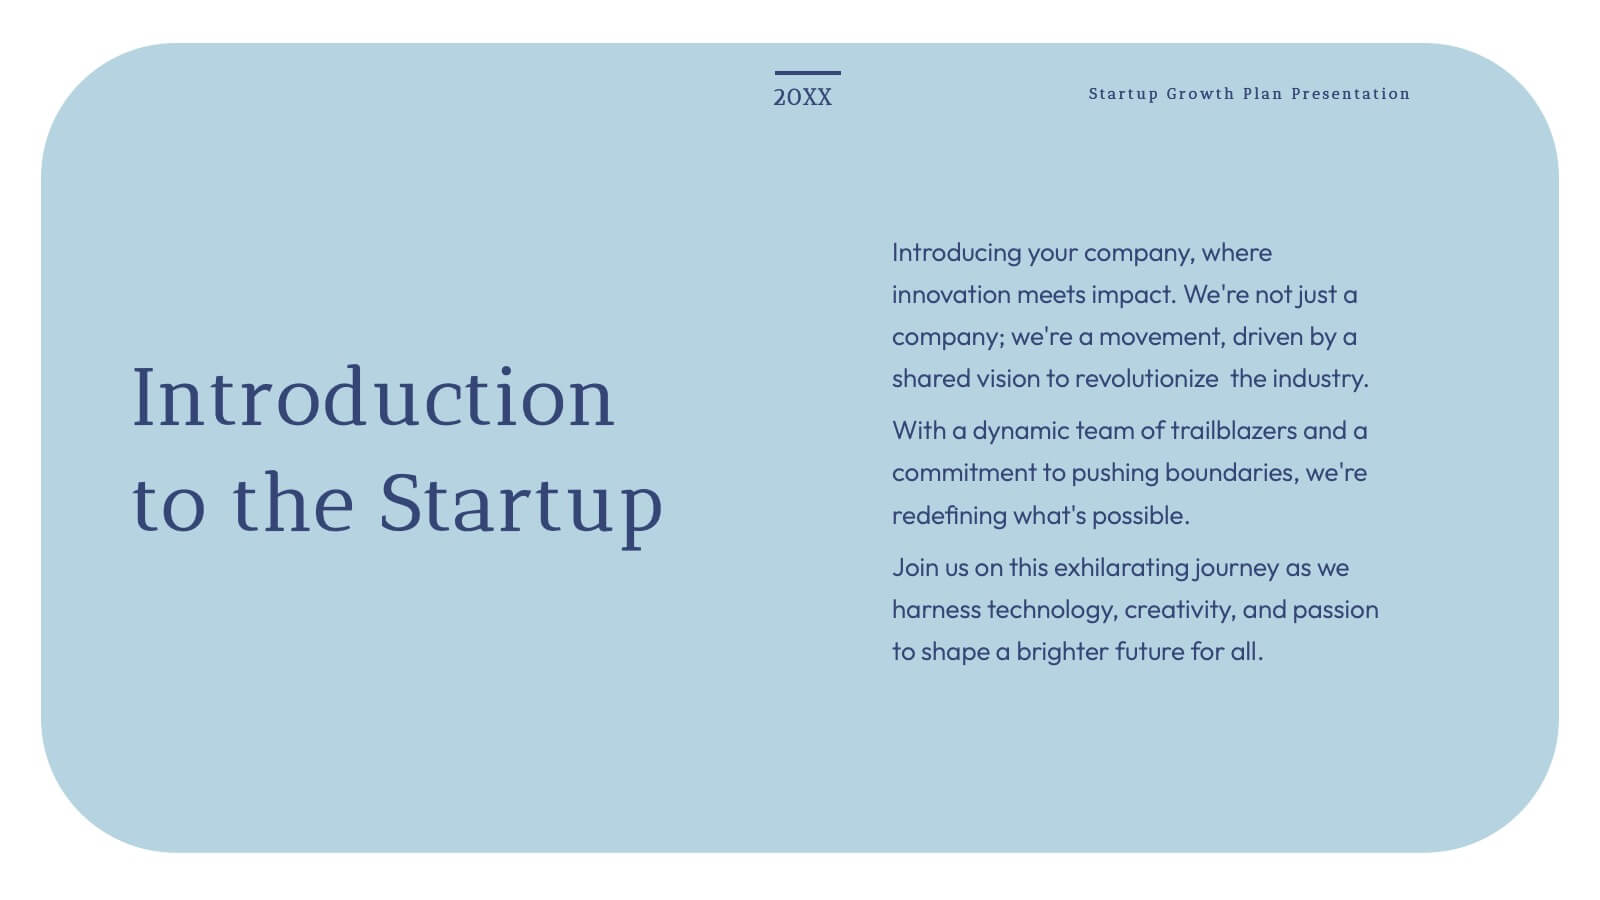
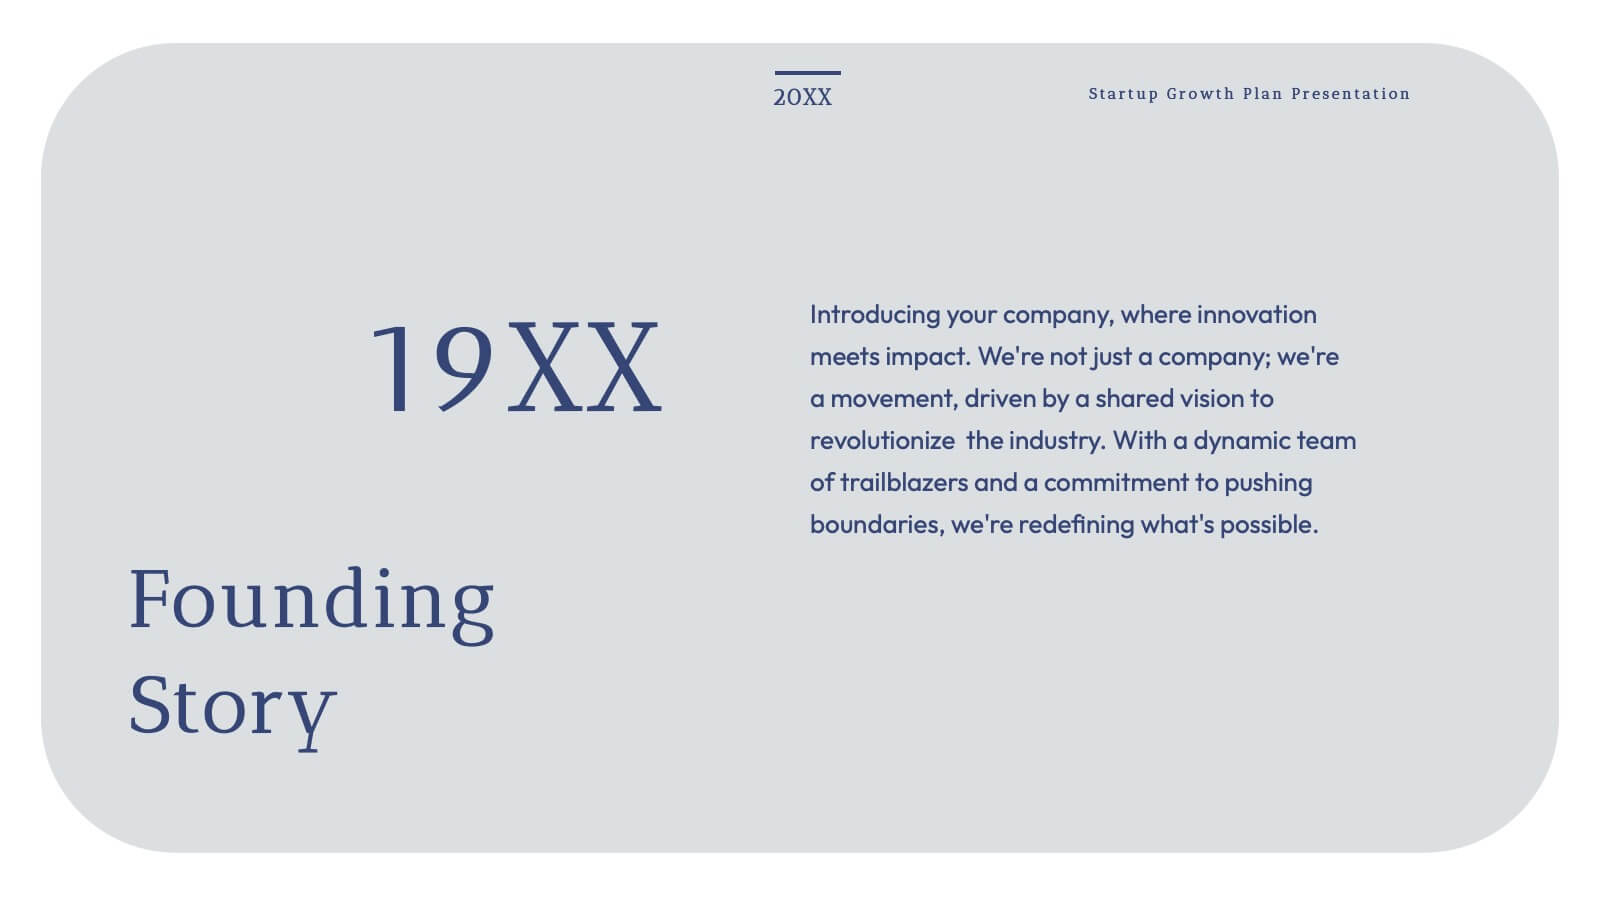
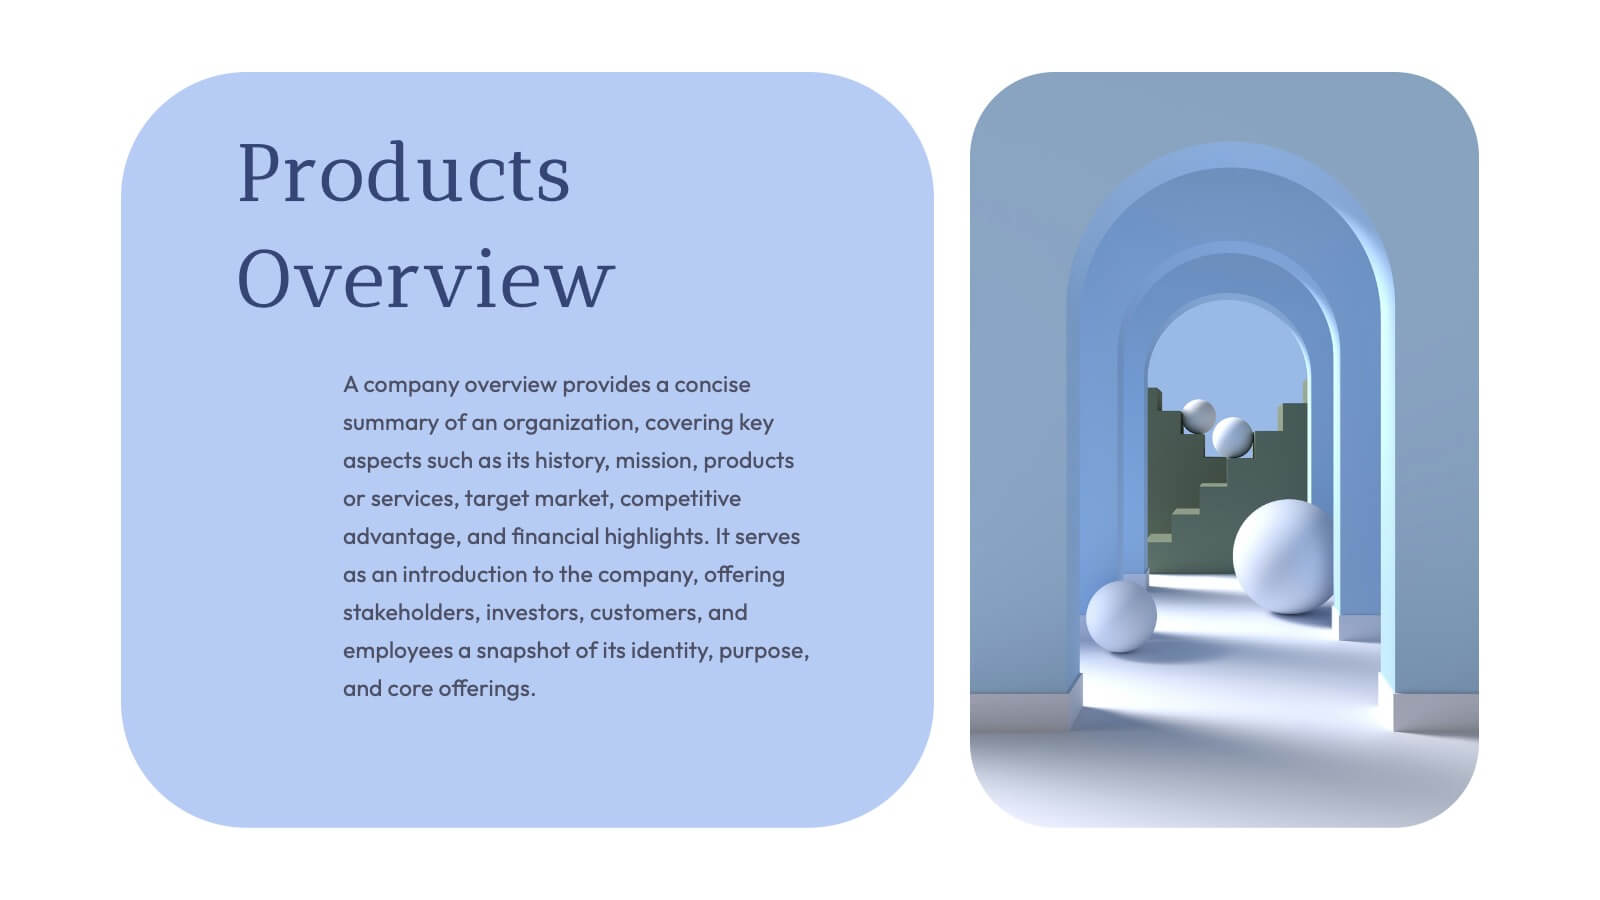
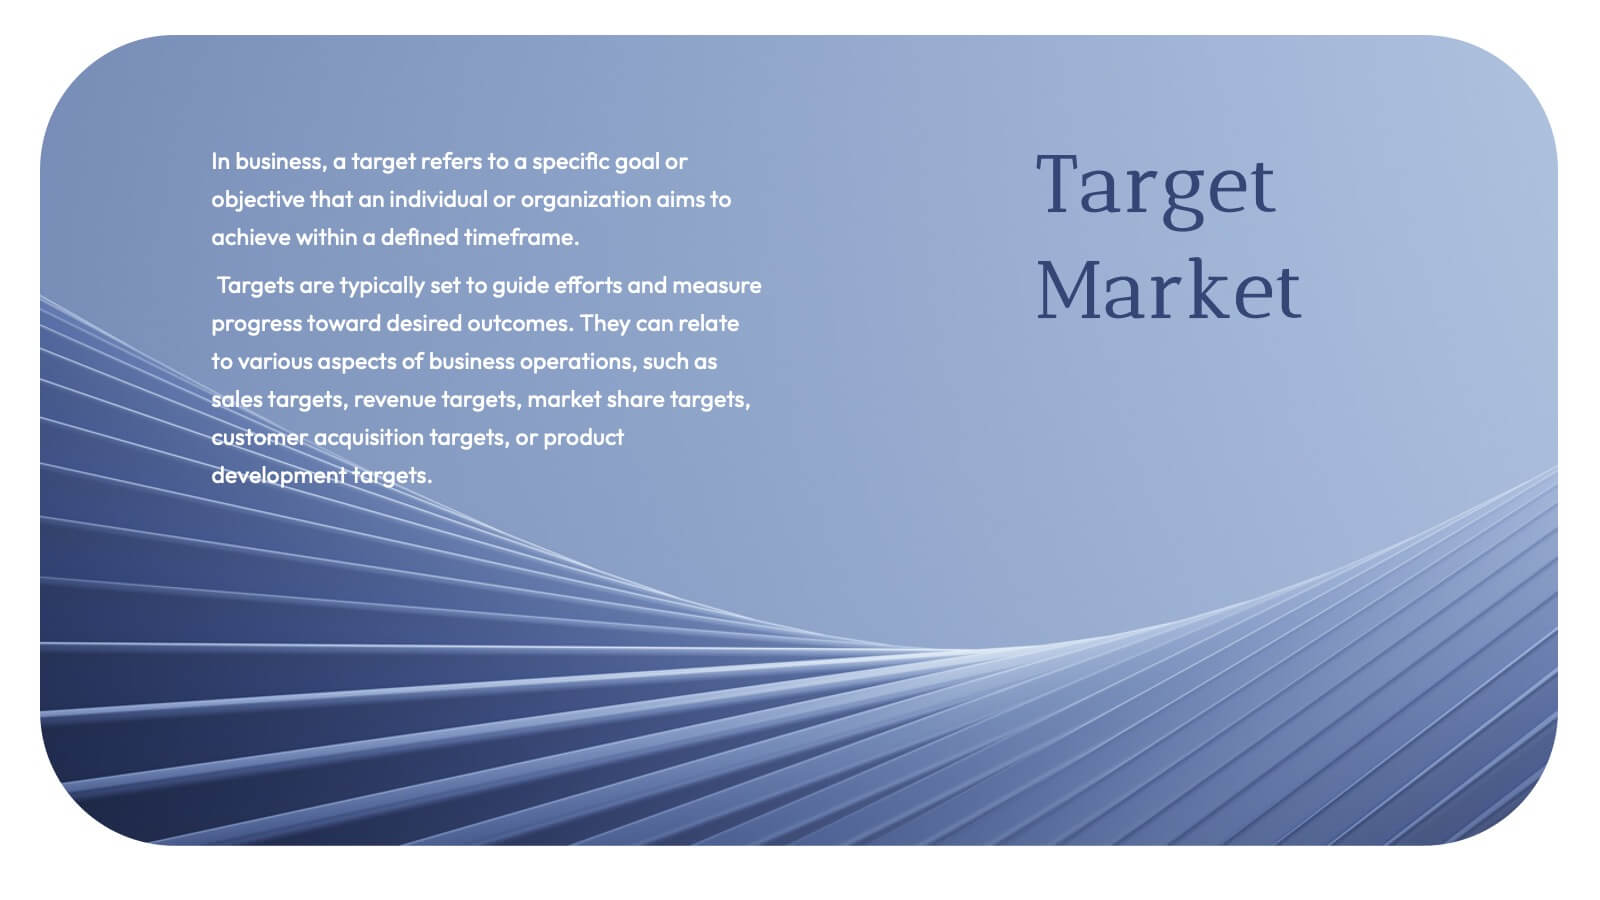
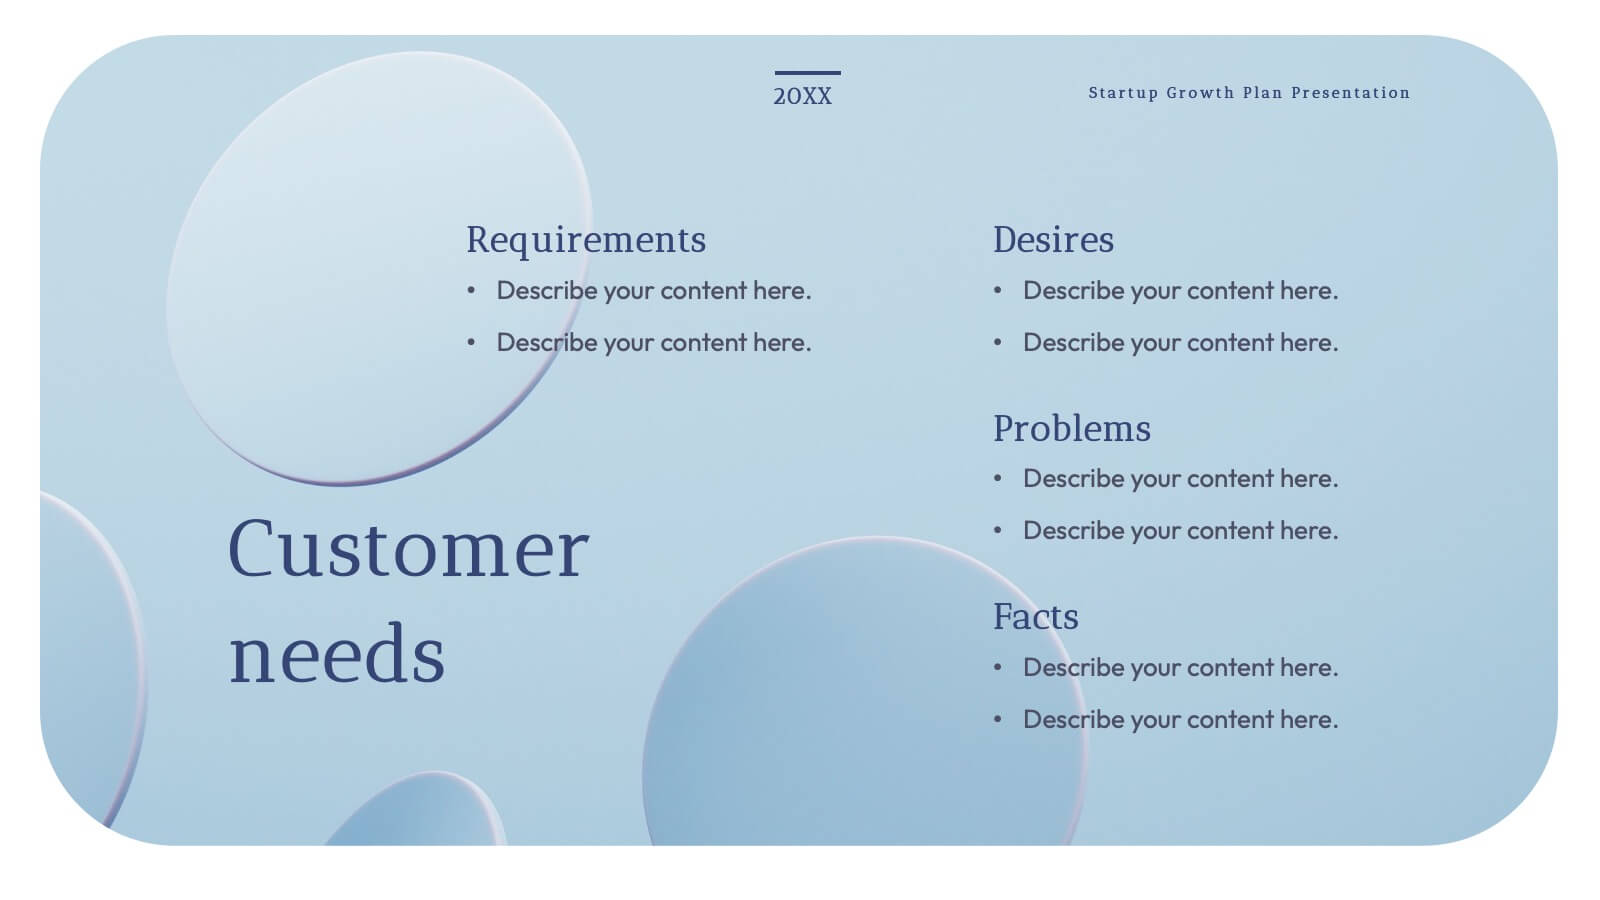
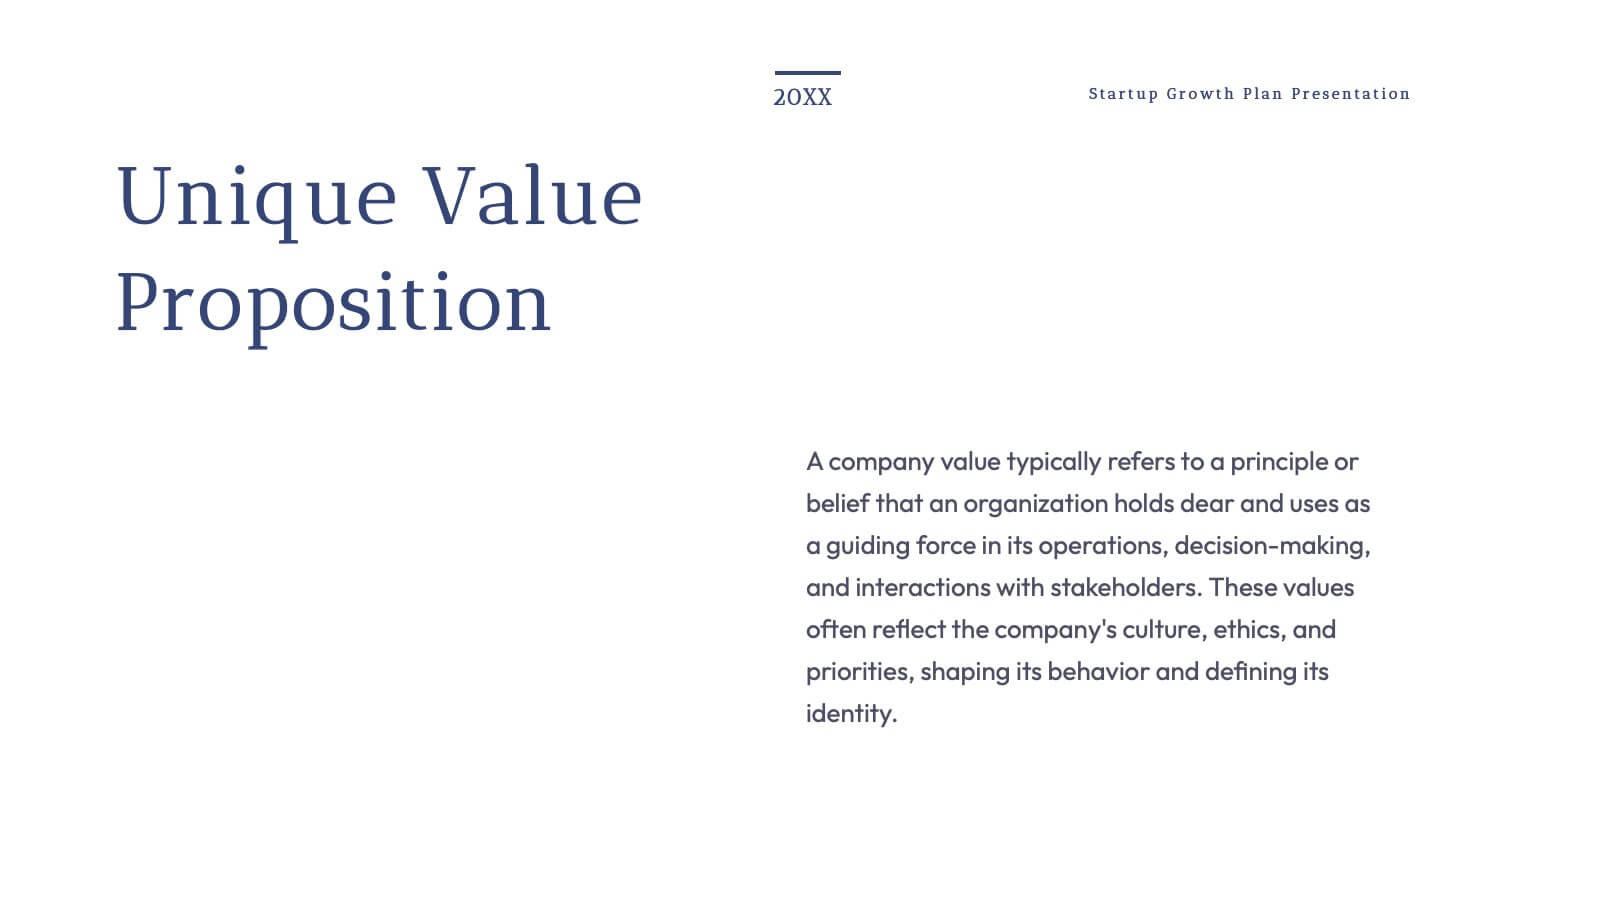
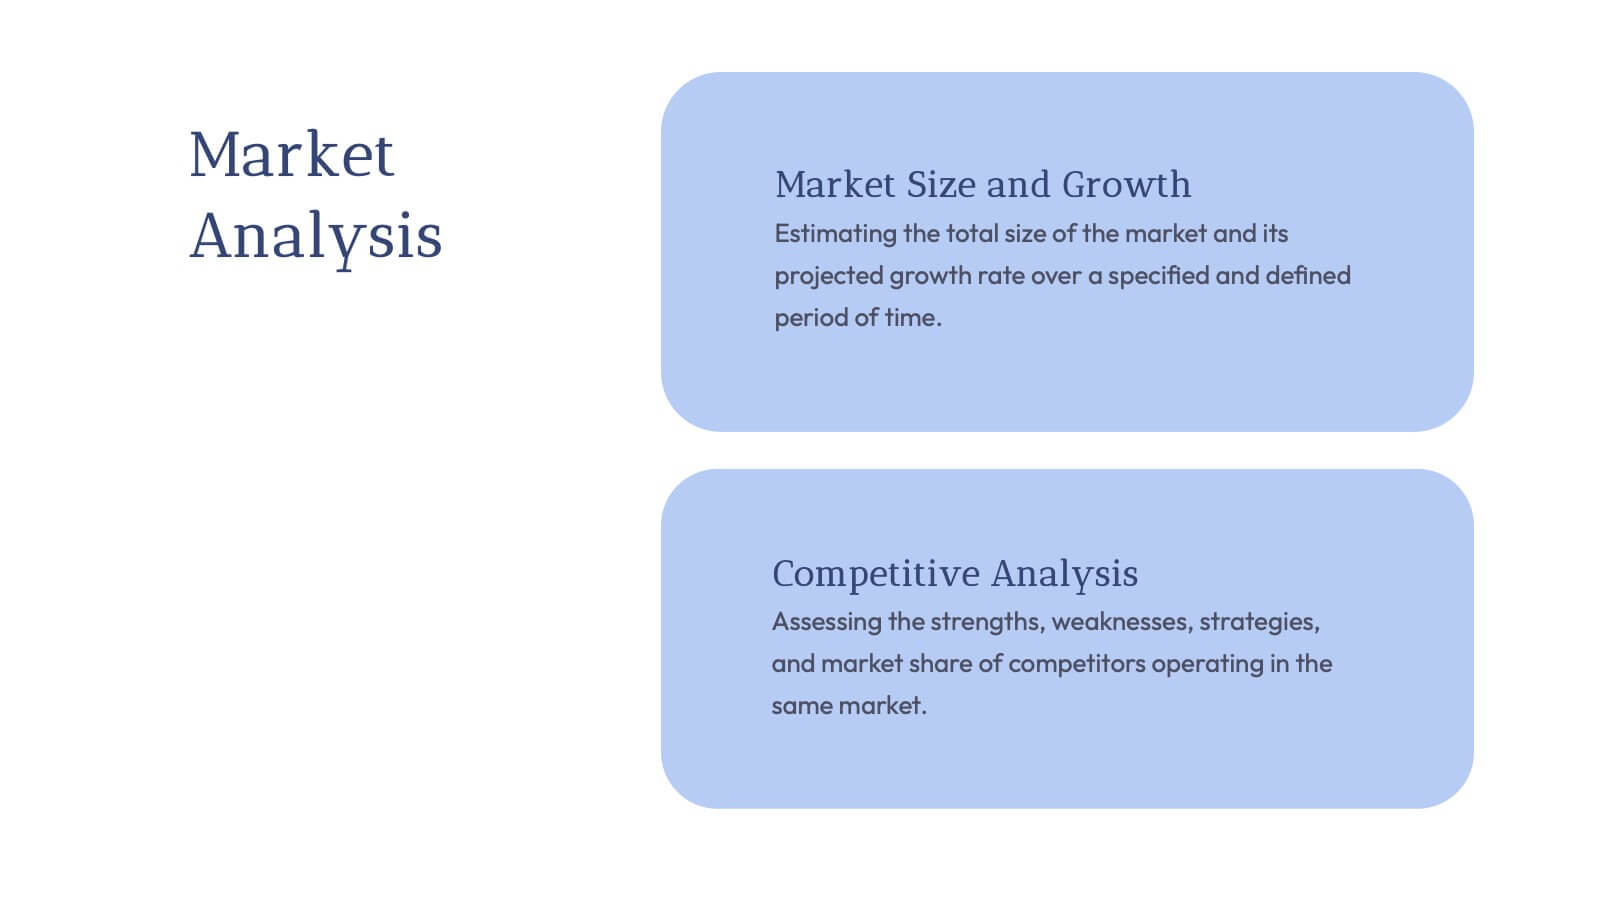
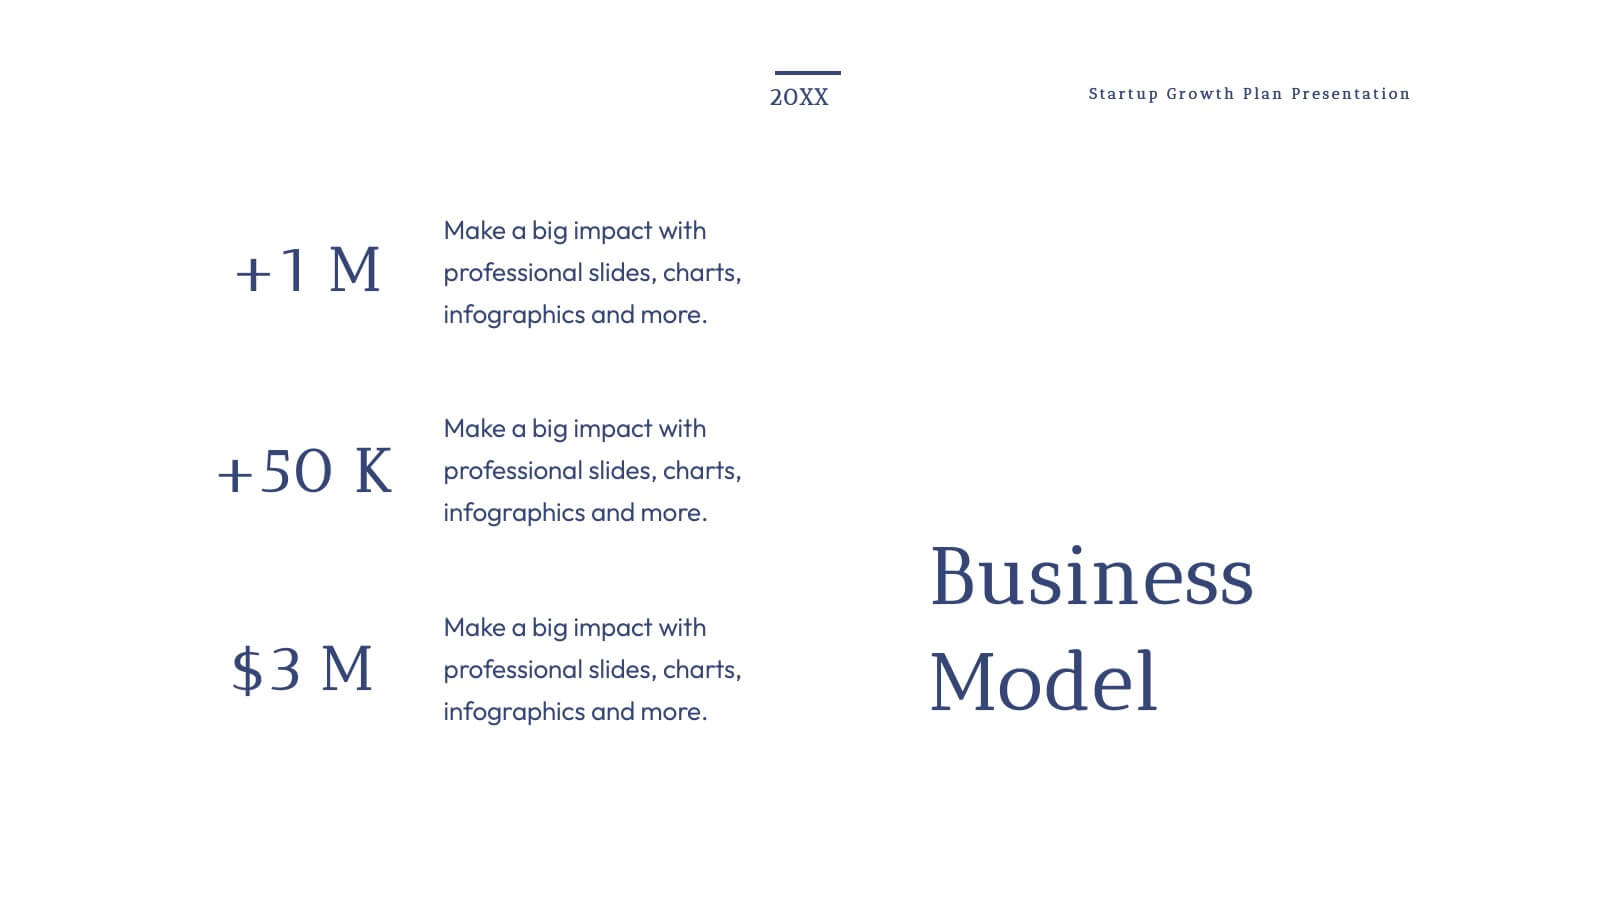
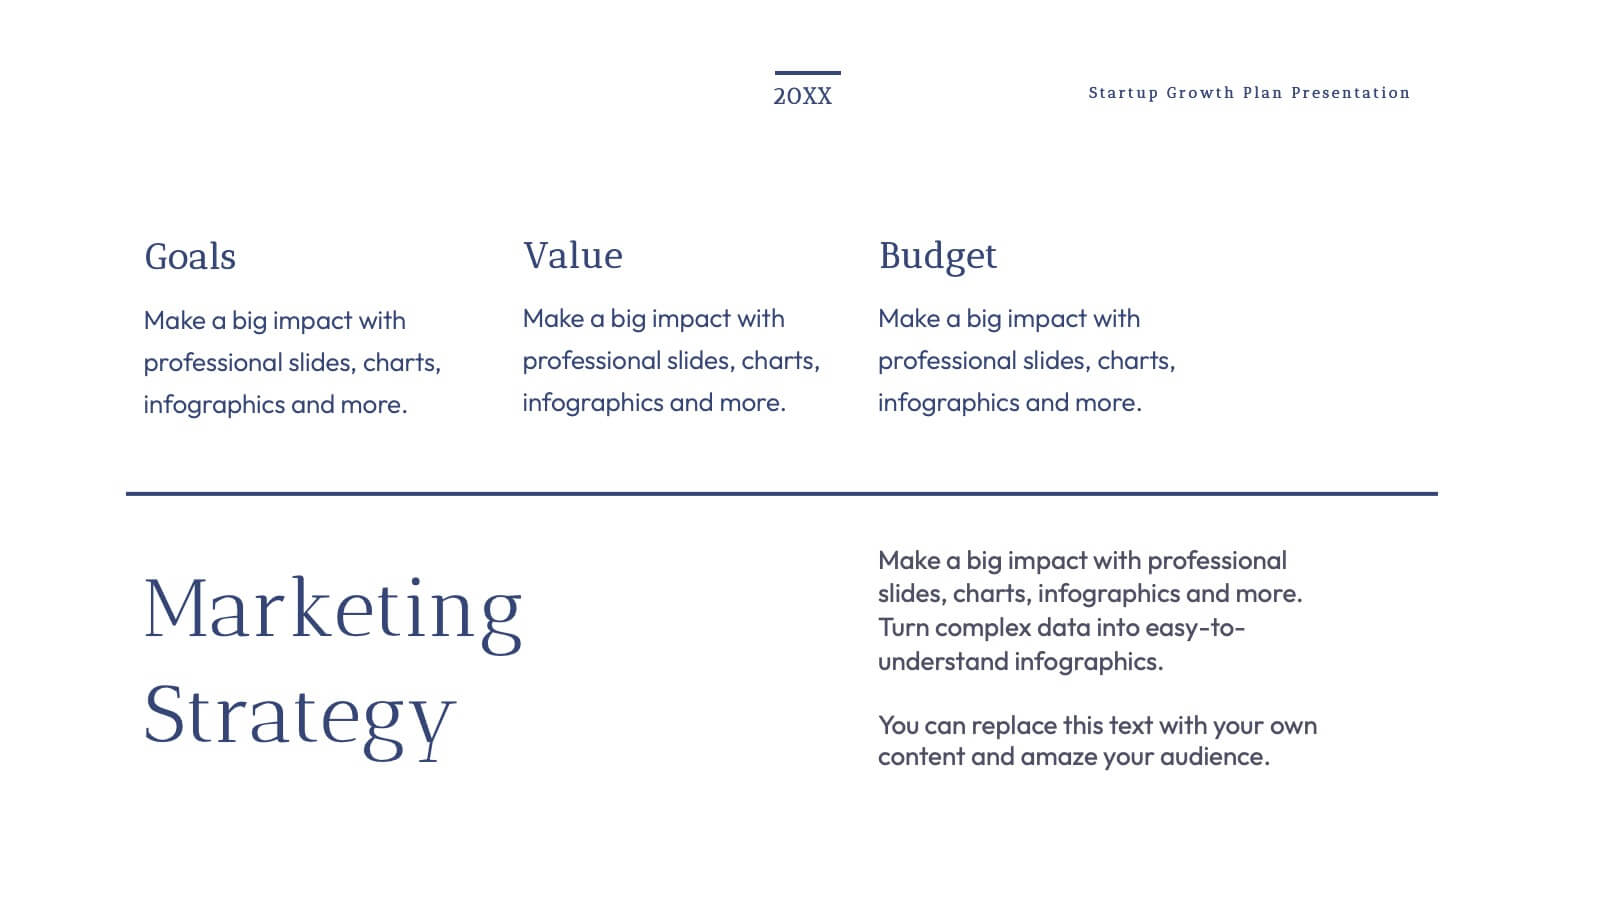
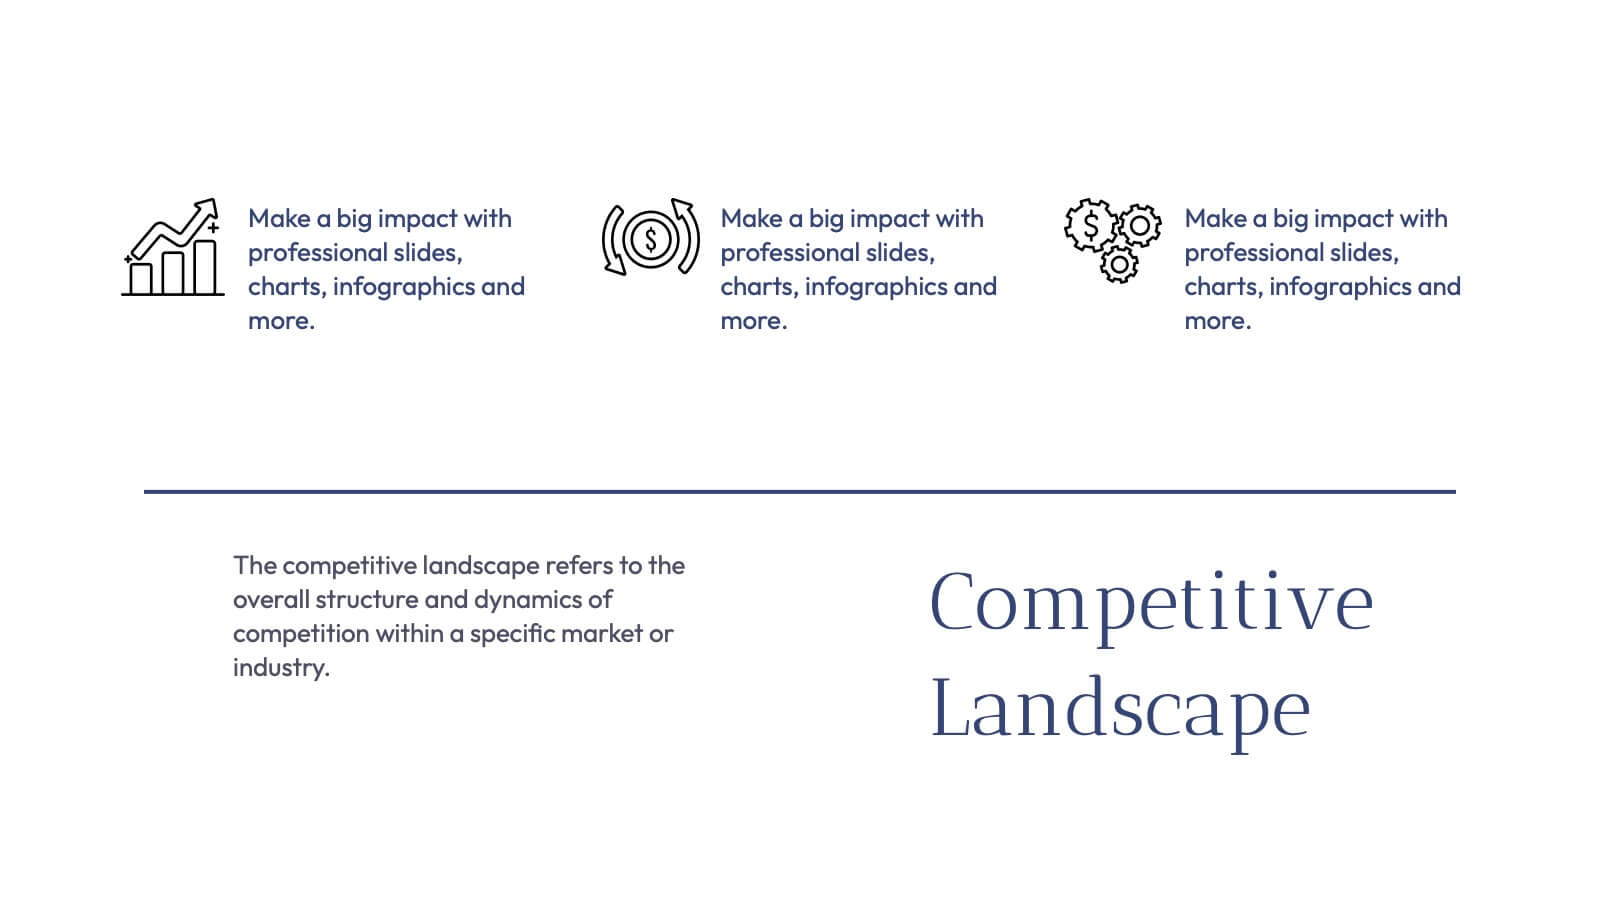
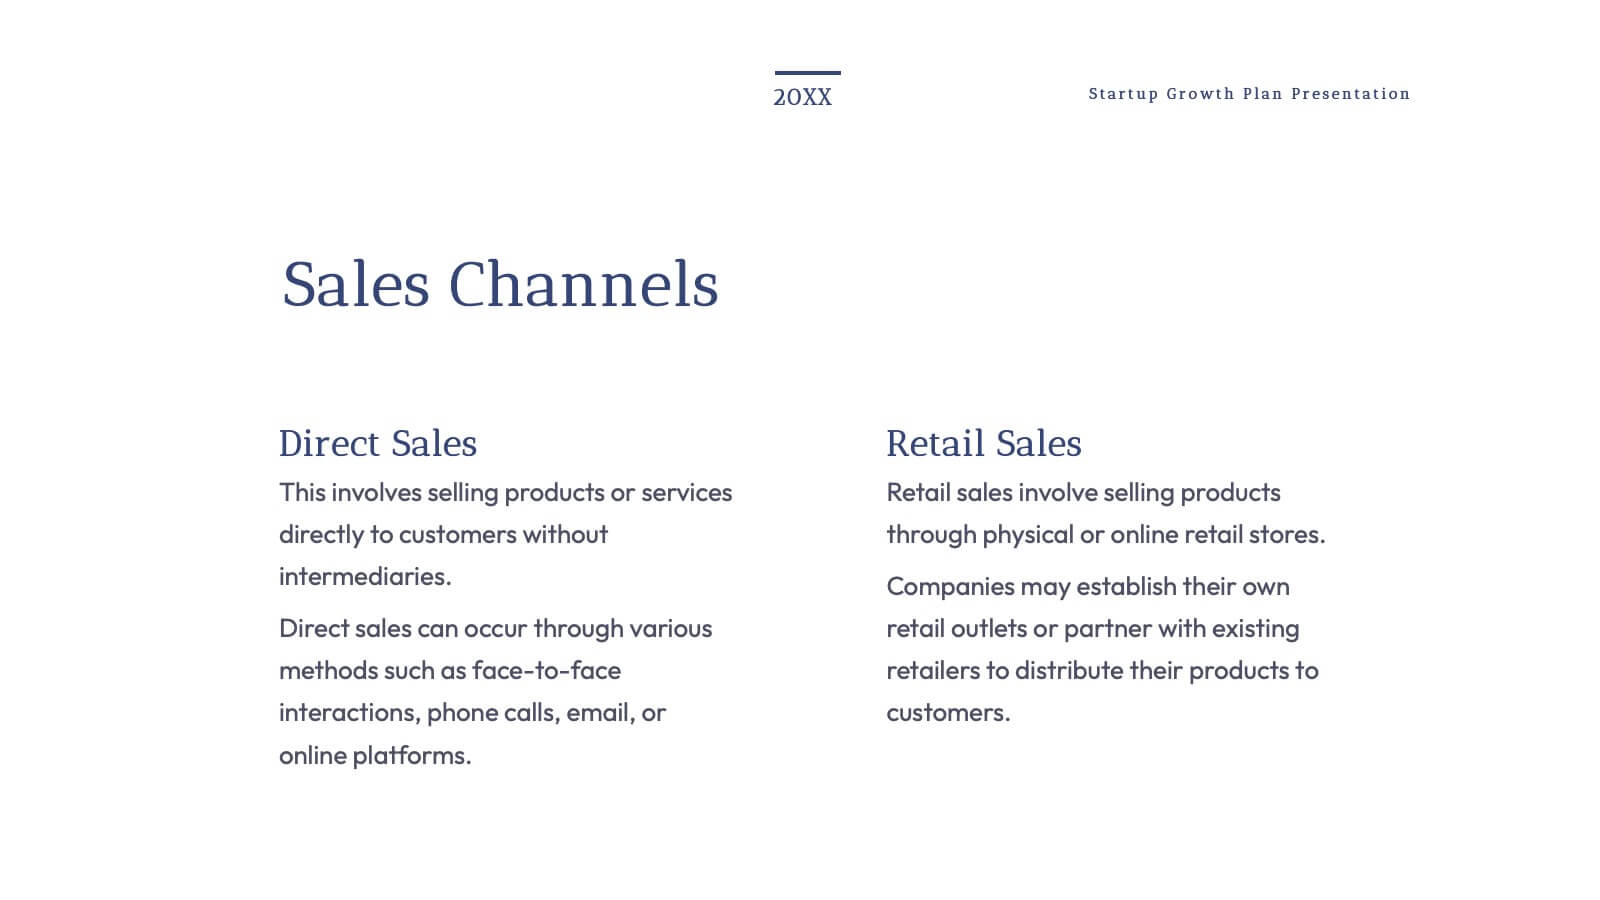
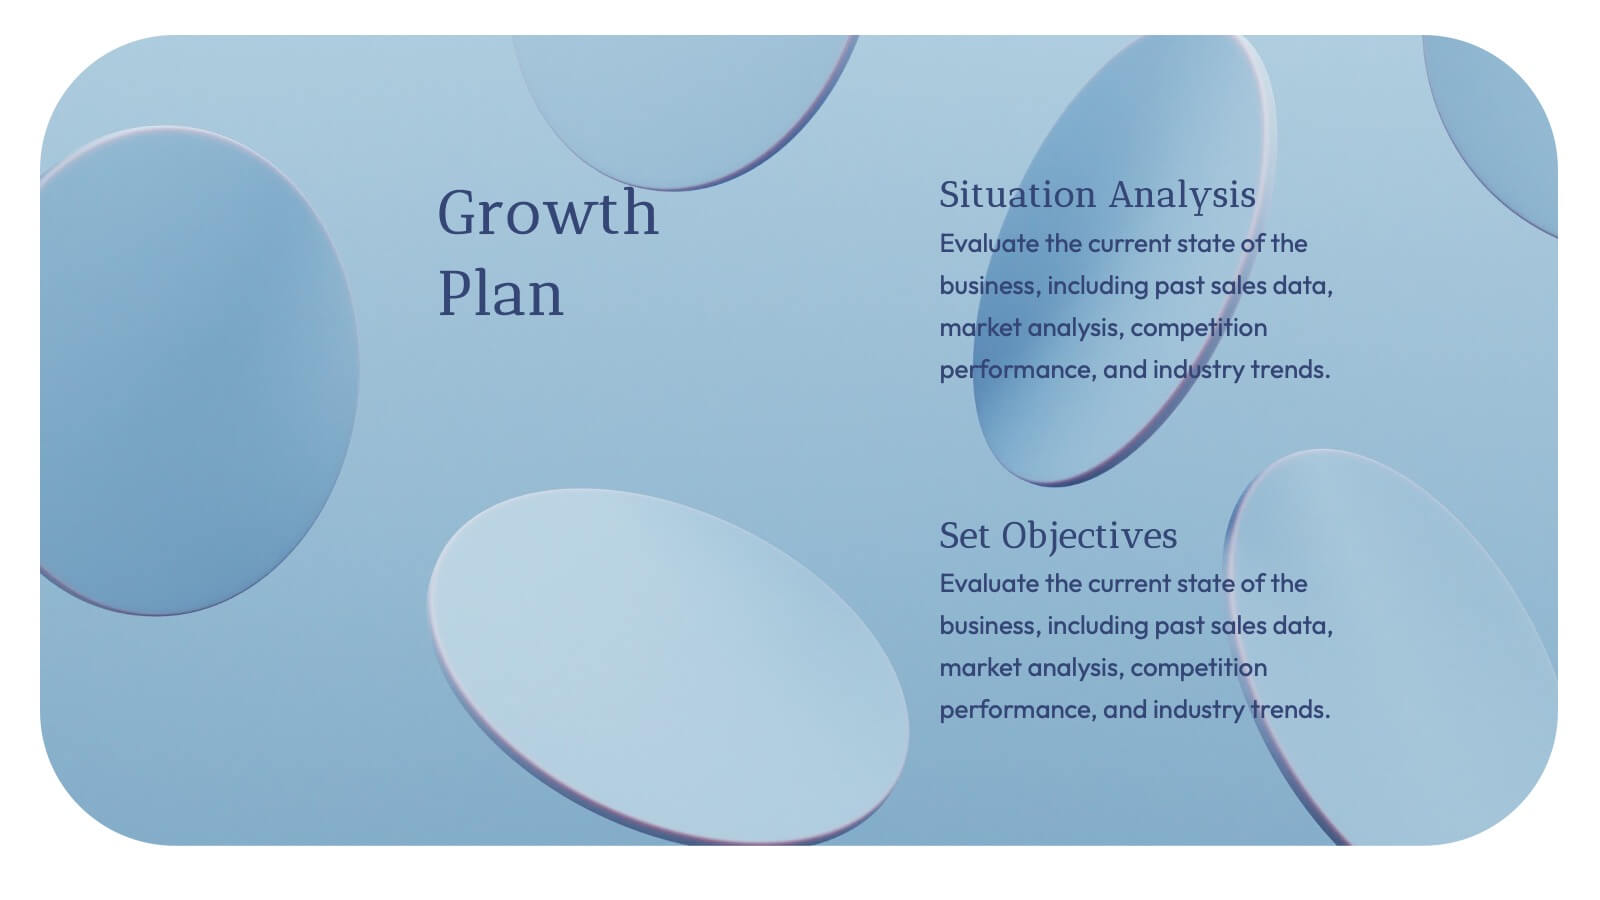
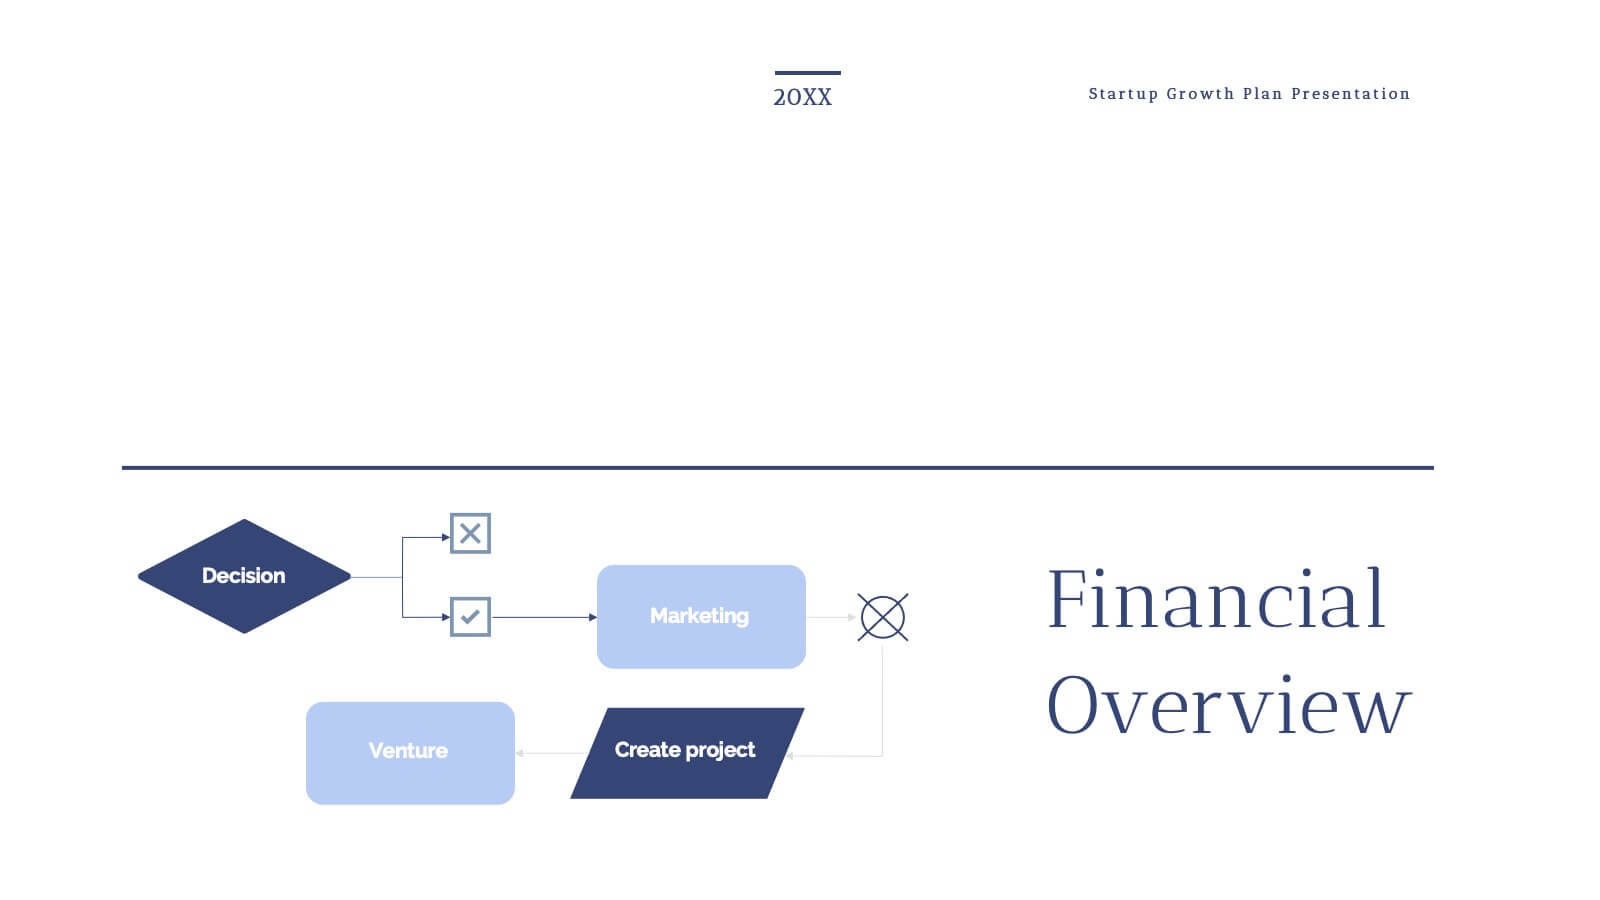
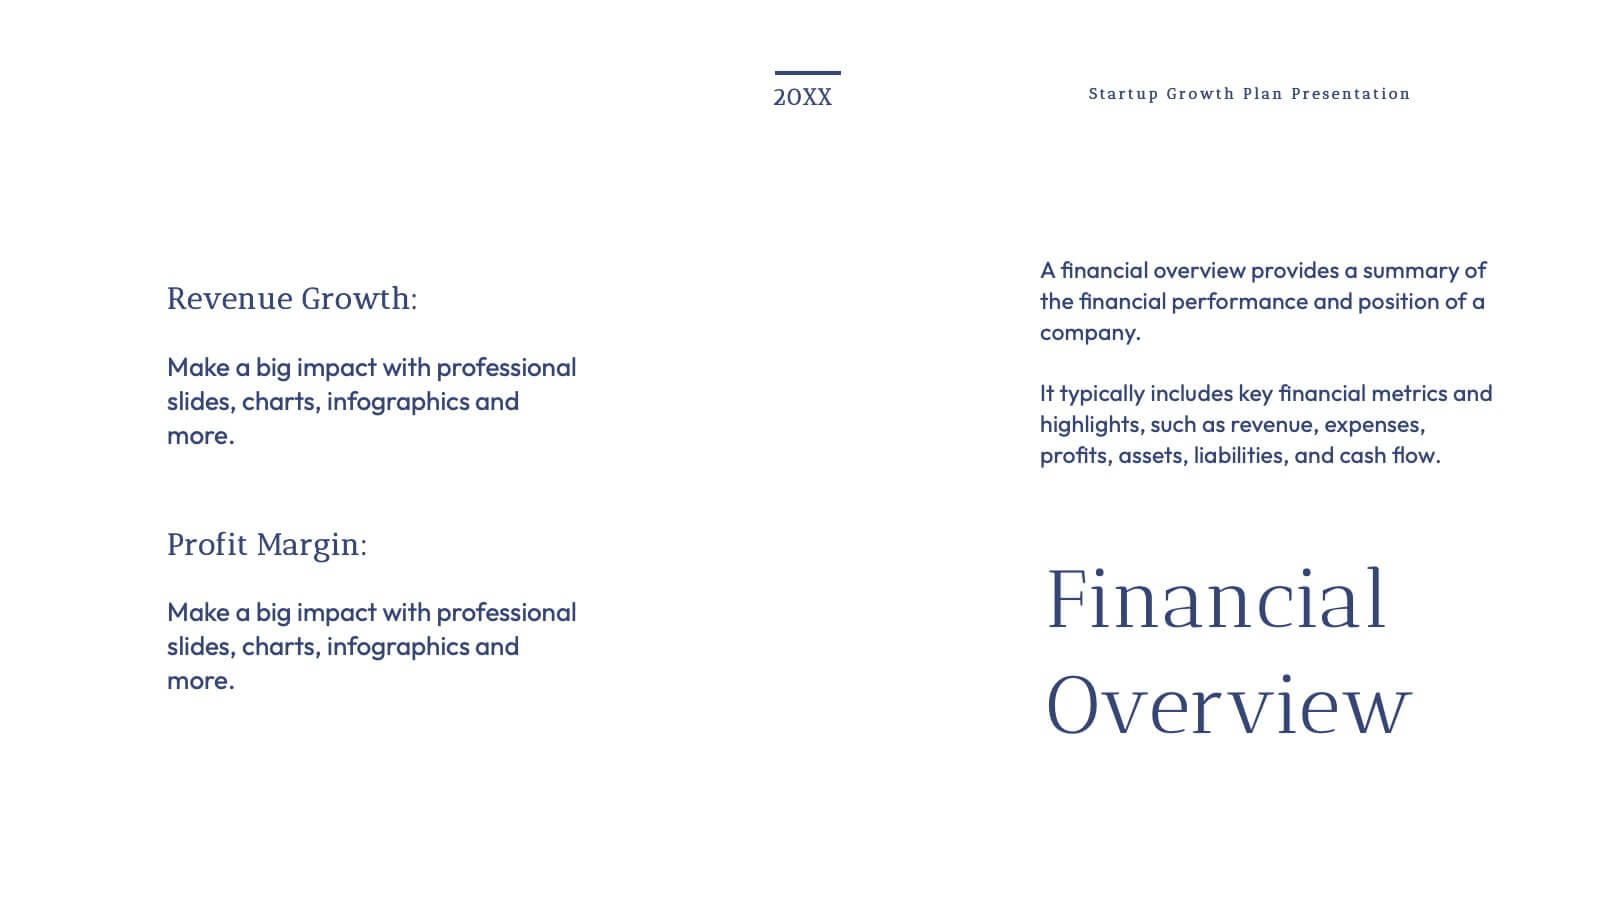
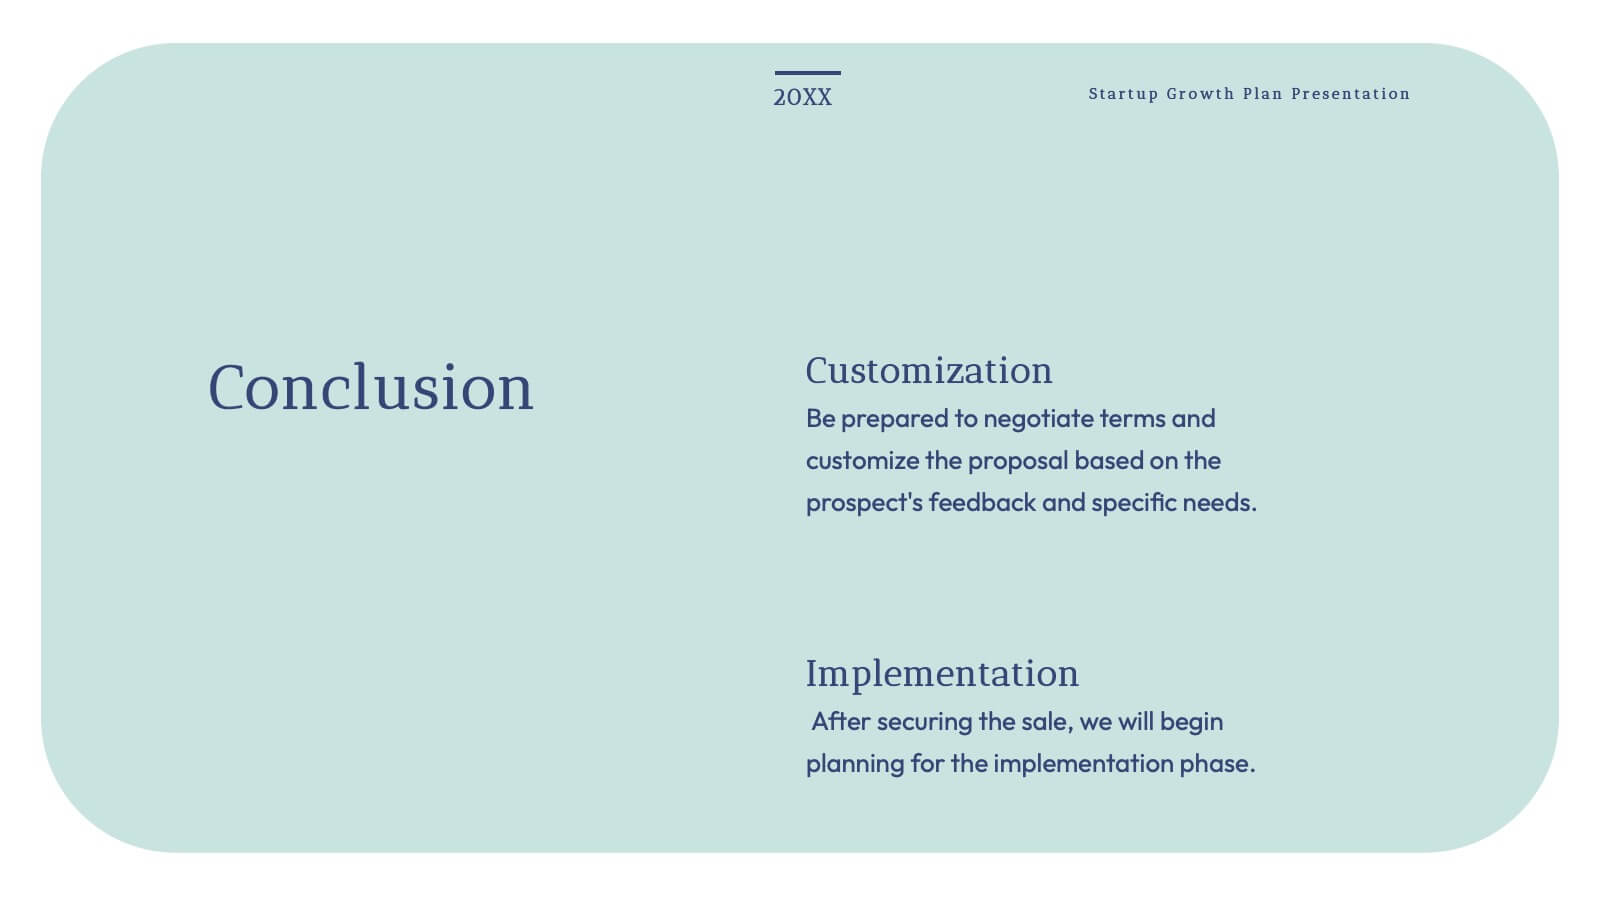
Grecian Startup Growth Plan Presentation
Elevate your pitch with this stunning Grecian-inspired presentation template, perfect for outlining your startup's growth plan! Showcase your business strategy, revenue projections, and scaling opportunities with a clean, elegant design that grabs attention. Impress investors and stakeholders with every slide. Compatible with PowerPoint, Keynote, and Google Slides for seamless customization.


26 diapositivas
Ethical Business Practices Presentation
Promote integrity with our Ethical Business Practices presentation template, suitable for PowerPoint, Keynote, and Google Slides. This essential tool is crafted for business leaders, compliance officers, and educators who aim to reinforce the importance of ethics in the corporate environment. Our template facilitates a clear understanding of ethical standards in business operations. It includes slides on ethical decision-making, corporate governance, social responsibility, and the long-term benefits of maintaining high ethical standards. With customizable layouts, you can present real-world scenarios, ethical frameworks, and company policies that illustrate your commitment to ethical conduct. This SEO-optimized template is key for reaching audiences interested in building trust and credibility through responsible business practices. Use this template to lead discussions on ethics, influence corporate culture positively, and showcase how ethical behavior is not just right but also beneficial for business success.


6 diapositivas
Funnel Stages Infographic
In marketing and sales, the term "funnel stages" refers to the different stages or steps that a potential customer goes through in their journey from initial awareness of a product or service to making a purchase decision. These infographics visualize and help you understand the customer's progression through these stages. They aim to help businesses and professionals understand the customer journey and optimize their strategies for each stage of the funnel. Whether used in sales presentations, marketing workshops, or educational materials, this template helps businesses build successful sale funnels and maximize their revenue potential.


7 diapositivas
Construction Gantt Chart Infographic
A Gantt chart is a project management tool that shows the timeline and dependencies of your tasks. This infographic is a visual representation of the Gantt chart, and it will help you understand this important project management tool. This template is designed to help you plan and manage your tasks in a fun and engaging way. It's a great way to get the entire team on board with the project, and it's also a great way to make sure everyone is on track and hitting their goals. The chart is a great way to see at a glance what tasks need to happen, when they need to happen, and how long each task will take.


5 diapositivas
Human-Centered Design Thinking Strategy
Showcase empathy-driven innovation with the Human-Centered Design Thinking Strategy Presentation. This slide visually emphasizes user-focused thinking by combining a head silhouette with colorful puzzle icons representing each strategic step. Ideal for UX strategy meetings, product development pitches, and innovation workshops, it includes five editable segments labeled A to E, each with matching text fields to explain your core insights or process stages. Compatible with PowerPoint, Keynote, and Google Slides for seamless editing and presentation.


6 diapositivas
Search Engine Optimization Campaign Overview Presentation
Kick off your digital strategy with a clean, modern layout that makes every key insight feel connected and actionable. This presentation helps you explain campaign goals, highlight SEO priorities, and break down essential tasks in a structured, visual flow. Fully compatible with PowerPoint, Keynote, and Google Slides.


6 diapositivas
World Market Presence and Expansion Map Presentation
Showcase your company’s global footprint with this World Market Presence and Expansion Map. Visually highlight key regions, market activity, or strategic territories. Perfect for investor decks, global overviews, or international growth strategies. Fully editable in PowerPoint, Keynote, and Google Slides for seamless integration into your professional presentation workflow.


11 diapositivas
Moodboard Presentation
This Moodboard template is a vibrant tool for designers and creatives looking to showcase the aesthetic direction of their project. It starts with a dynamic cover slide, drawing you into the visual theme. As you progress through the slides, you are greeted with rich textures and a spectrum of colors carefully selected to inspire and evoke emotion. The slides dedicated to 'Textures' and 'Colors' serve not only as a palette but also as a canvas to communicate the essence of your creative vision. Questions like "Have you chosen your colors yet?" engage the audience, encouraging interaction and reflection on their choices. The 'Concept' and 'Keys' slides further detail the creative process and the core elements that will define the final design. The comprehensive Moodboard culminates in a credits slide, attributing all the inspirational sources that fueled the visual journey.


20 diapositivas
Ascent Design Strategy Proposal Presentation
A minimalist and sleek template ideal for presenting design strategy and development. Includes sections for design brief, audience insights, concept development, design elements, prototyping, and feedback. Suitable for design professionals to showcase visual direction and project timelines. Fully customizable in PowerPoint, Keynote, and Google Slides for versatile presentations.


7 diapositivas
Security Jobs Infographic
Security jobs refer to roles and positions within various industries that primarily focus on safeguarding individuals, properties, data, and assets from potential threats, risks, or unauthorized access. This infographic template is designed to shed light on the diverse and dynamic world of security professions. Fully customizable and compatible with Powerpoint, Keynote, and Google Slides. This infographic is your gateway to understanding the vital roles that contribute to a safer world. Discover your path, protect communities, and embark on a fulfilling career journey in security.


6 diapositivas
Business Strategy Wheel Presentation
Bring your ideas full circle with this dynamic and colorful presentation design. Perfect for illustrating key strategies, continuous improvement cycles, or interconnected business concepts, it transforms complex processes into simple, engaging visuals. Fully customizable and compatible with PowerPoint, Keynote, and Google Slides for effortless editing and professional presentation.


5 diapositivas
Enterprise Risk Management Framework Presentation
Visualize your organization’s risk strategy with the Enterprise Risk Management Framework Presentation. This slide outlines four core steps—Set Objective, Identify Risks, Assess Risks, and Risk Response—using a clear, directional design. Perfect for risk assessments, board updates, or audit reviews. Fully editable in PowerPoint, Google Slides, and Canva.


21 diapositivas
Utopia Marketing Proposal Template Presentation
Unleash your marketing potential with this vibrant, modern presentation template. Perfect for presenting marketing proposals, industry overviews, and consumer behavior analysis, it features a colorful design that captures attention. Highlight key strategies like social media, influencer marketing, and SEO trends to engage your audience. Compatible with PowerPoint, Keynote, and Google Slides, it ensures seamless presentations on any platform.


2 diapositivas
Final Gratitude Page in Deck Presentation
The Final Gratitude Page in Deck Presentation is a bold and engaging closing slide, ideal for ending your presentation with personality and professionalism. With its bright orange theme, modern photo frame, and "THANK YOU!" message in clear typography, it leaves a lasting impression on your audience. Perfect for webinars, educational talks, or business presentations. Fully customizable in PowerPoint, Keynote, and Google Slides.