


Características


¿Tienes alguna pregunta?
Recomendar


5 diapositivas
Climate Change Response Strategy Deck Presentation
Communicate your climate action roadmap clearly with this Climate Change Response Strategy Deck Presentation. Featuring a directional arrow flow design, this layout helps visualize progressive steps in sustainability, adaptation, or policy initiatives. Ideal for ESG reporting, environmental briefings, or nonprofit strategy sessions. Works seamlessly with PowerPoint, Keynote, and Google Slides.


5 diapositivas
Easy 4-Stage Development Process Presentation
Simplify complex processes with this clean, 4-step development diagram. Ideal for product lifecycles, workflows, or phased planning, this slide uses connected blocks and clear numbering to illustrate each stage. Fully editable in PowerPoint, Keynote, and Google Slides—perfect for project managers, engineers, and teams needing to communicate clear development strategies.


5 diapositivas
Business Cycle and Wheel Diagram
Illustrate key stages, continuous workflows, or strategic frameworks with this circular business diagram. Ideal for visualizing four connected steps in a clean, modern style. Easily editable in PowerPoint, Keynote, and Google Slides for full customization.


26 diapositivas
Company Profile and Accomplishments Presentation
A company profile is a document that provides an overview of a business entity. This template serves as a company introduction, presenting essential information about company history, products or services, achievements, goals, and other relevant details. This template showcases the milestones and capabilities of a company. This presentation is perfect for businesses, startups, or organizations looking to highlight their success, growth, and overall expertise in their industry. The clean layout, engaging visuals, and comprehensive information, will help your presentation leave a lasting impression on your audience and enhance your company's reputation.


4 diapositivas
Blue Ocean Strategic Differentiation Presentation
Visually compare red and blue ocean strategies with this side-by-side layout. Perfect for showcasing competitive advantages, innovation, and market positioning. Each column highlights key differentiators in a clean, structured format. Ideal for marketing, strategy, or executive presentations. Fully customizable in PowerPoint, Keynote, and Google Slides to match your branding.


2 diapositivas
Opening Company Profile Introduction Presentation
Make a bold first impression with the Opening Company Profile Introduction Presentation — a sleek, modern design perfect for business overviews, team intros, or brand missions. Featuring clean typography and a purple accent shape that adds personality without distraction, this layout is ideal for concise, professional messaging. Fully editable and compatible with Canva, PowerPoint, Google Slides, and Keynote.


8 diapositivas
Startups Pitch Deck Presentation
Bring your idea to life with a bold, energetic layout designed to showcase vision, traction, and future potential. This presentation helps you communicate your business model, strategy, and key insights with clarity and confidence. Clean visuals and structured sections keep your message strong and compelling. Fully compatible with PowerPoint, Keynote, and Google Slides.


30 diapositivas
Quintara Rebranding Project Plan Presentation
Revamp your brand with confidence using this dynamic rebranding project plan presentation. Covering key aspects like brand positioning, market analysis, visual identity, and unique selling propositions, this template helps you craft a compelling brand strategy. Fully customizable and compatible with PowerPoint, Keynote, and Google Slides for a seamless, professional presentation experience.


6 diapositivas
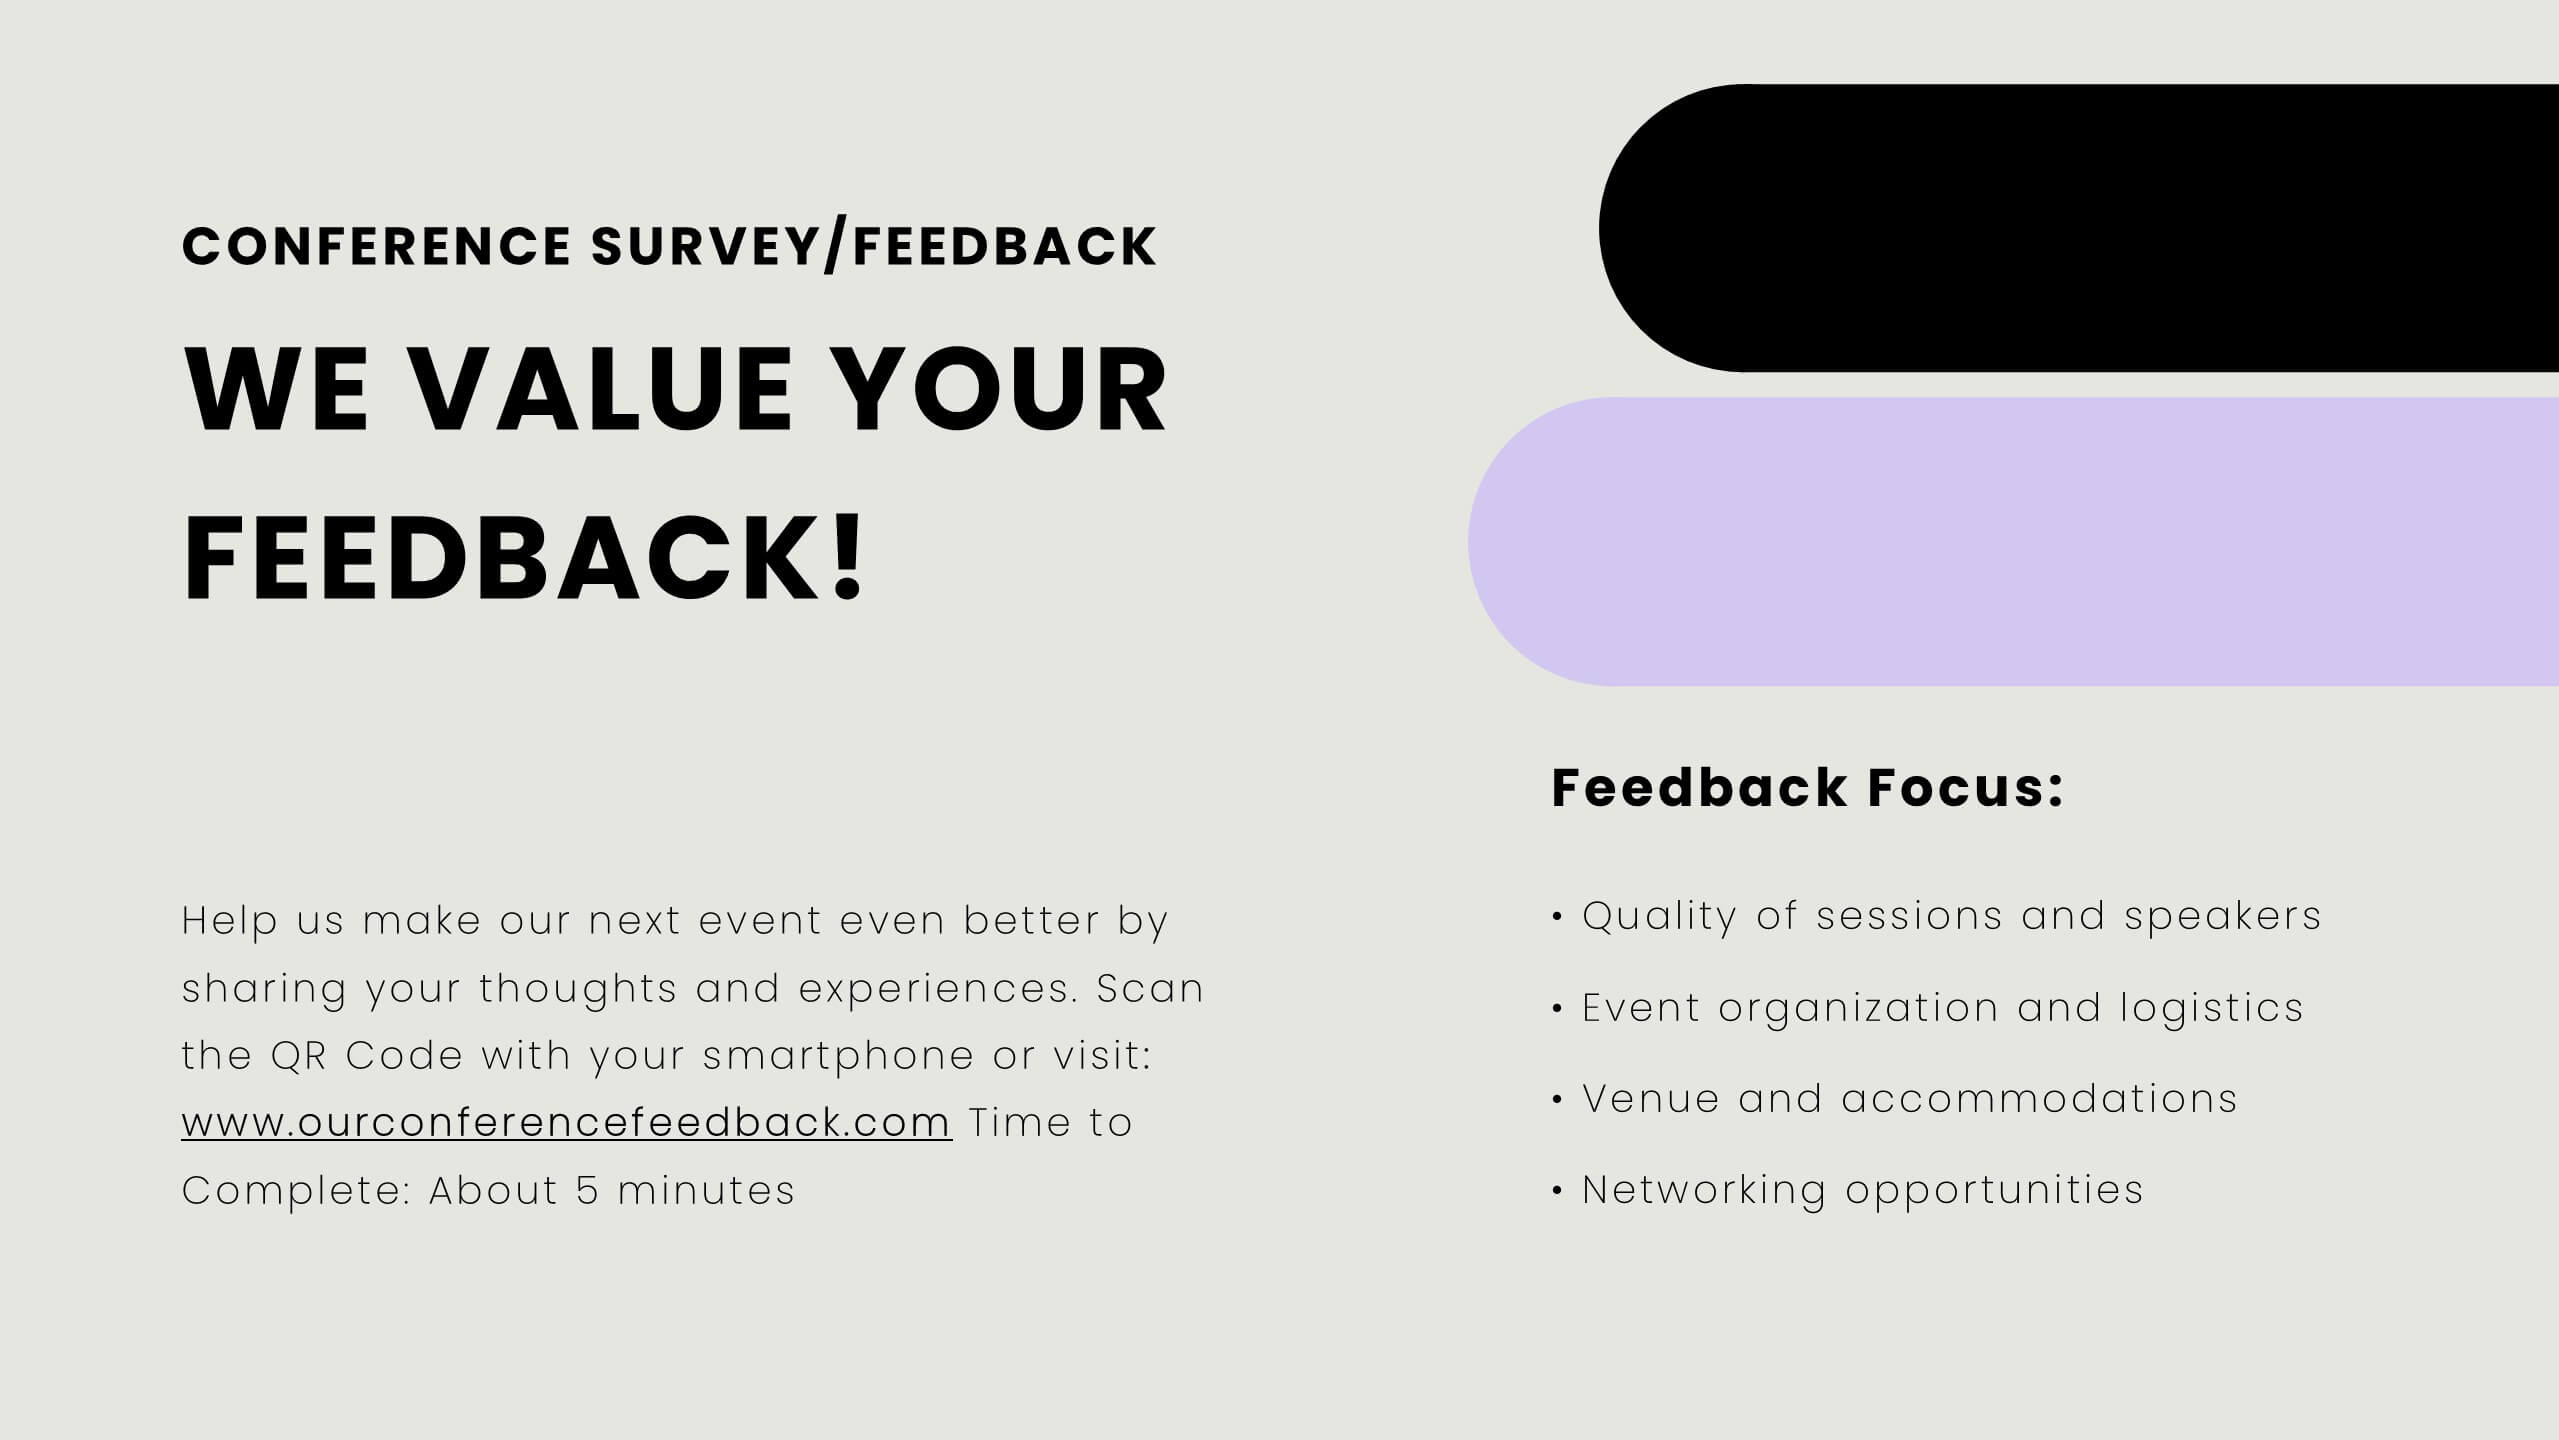
Key Points Overview Presentation
Bring your message to life with a slide that makes every key point feel clear, organized, and easy to follow. This presentation helps you highlight essential ideas, compare insights, and simplify complex information for any audience. Perfect for meetings, reports, or strategy updates. Fully compatible with PowerPoint, Keynote, and Google Slides.


8 diapositivas
Cycle of Continuous Improvement Deck Presentation
Highlight iterative progress and strategic refinement with the Cycle of Continuous Improvement Deck. This template is ideal for quality management, agile planning, or operational excellence sessions. Fully editable and visually dynamic, it presents circular workflows in clean layouts. Compatible with PowerPoint, Keynote, and Google Slides—great for teams and consultants.


5 diapositivas
Financial Market Trends and Forecast Presentation
Visualize economic shifts and data insights with this upward growth line infographic. Ideal for presenting financial forecasts, investment strategies, and market milestones, this layout features a stylized arrow path with icons, letter markers, and space for detailed annotations. Fully editable and compatible with PowerPoint, Keynote, and Google Slides.


21 diapositivas
Dreameon Agency Portfolio Presentation
Showcase your agency's expertise with this sleek and modern portfolio presentation template. Designed to highlight your achievements, creative processes, and client success stories, this template offers a comprehensive layout that communicates professionalism and innovation. From introducing your team and services to detailing case studies and market analysis, each slide is meticulously crafted to leave a lasting impression. Display your strategy development, social media impact, and measurement analytics effectively, ensuring a cohesive narrative that resonates with your audience. Easily customizable and compatible with PowerPoint, Google Slides, and Keynote, this template is perfect for agencies looking to pitch their capabilities, attract new clients, or present project achievements with confidence.


4 diapositivas
Highlighting Key Business Benefits Presentation
Unlock your brand's value with the Highlighting Key Business Benefits Presentation. This modern slide layout uses a visual key concept to emphasize four essential advantages, helping your audience quickly grasp your core offerings. Ideal for sales pitches, service overviews, or value proposition discussions. Fully editable and compatible with PowerPoint, Keynote, and Google Slides.


26 diapositivas
Cutting-Edge AI Breakthroughs Presentation
Step into the future with this exciting presentation on cutting-edge AI breakthroughs. Covering advancements in machine learning, automation, ethical AI, and real-world applications, this template helps you present complex innovations with clarity and impact. Fully customizable and compatible with PowerPoint, Keynote, and Google Slides for a seamless and engaging presentation experience.


8 diapositivas
Mission Objectives and Long-Term Goals Presentation
Clearly define your roadmap with this Mission Objectives and Long-Term Goals presentation. This clean, step-by-step layout is ideal for showcasing strategic milestones, vision pillars, or future goals. Each point is visually aligned for logical progression, making it perfect for planning sessions. Fully editable in Canva, PowerPoint, or Google Slides.


22 diapositivas
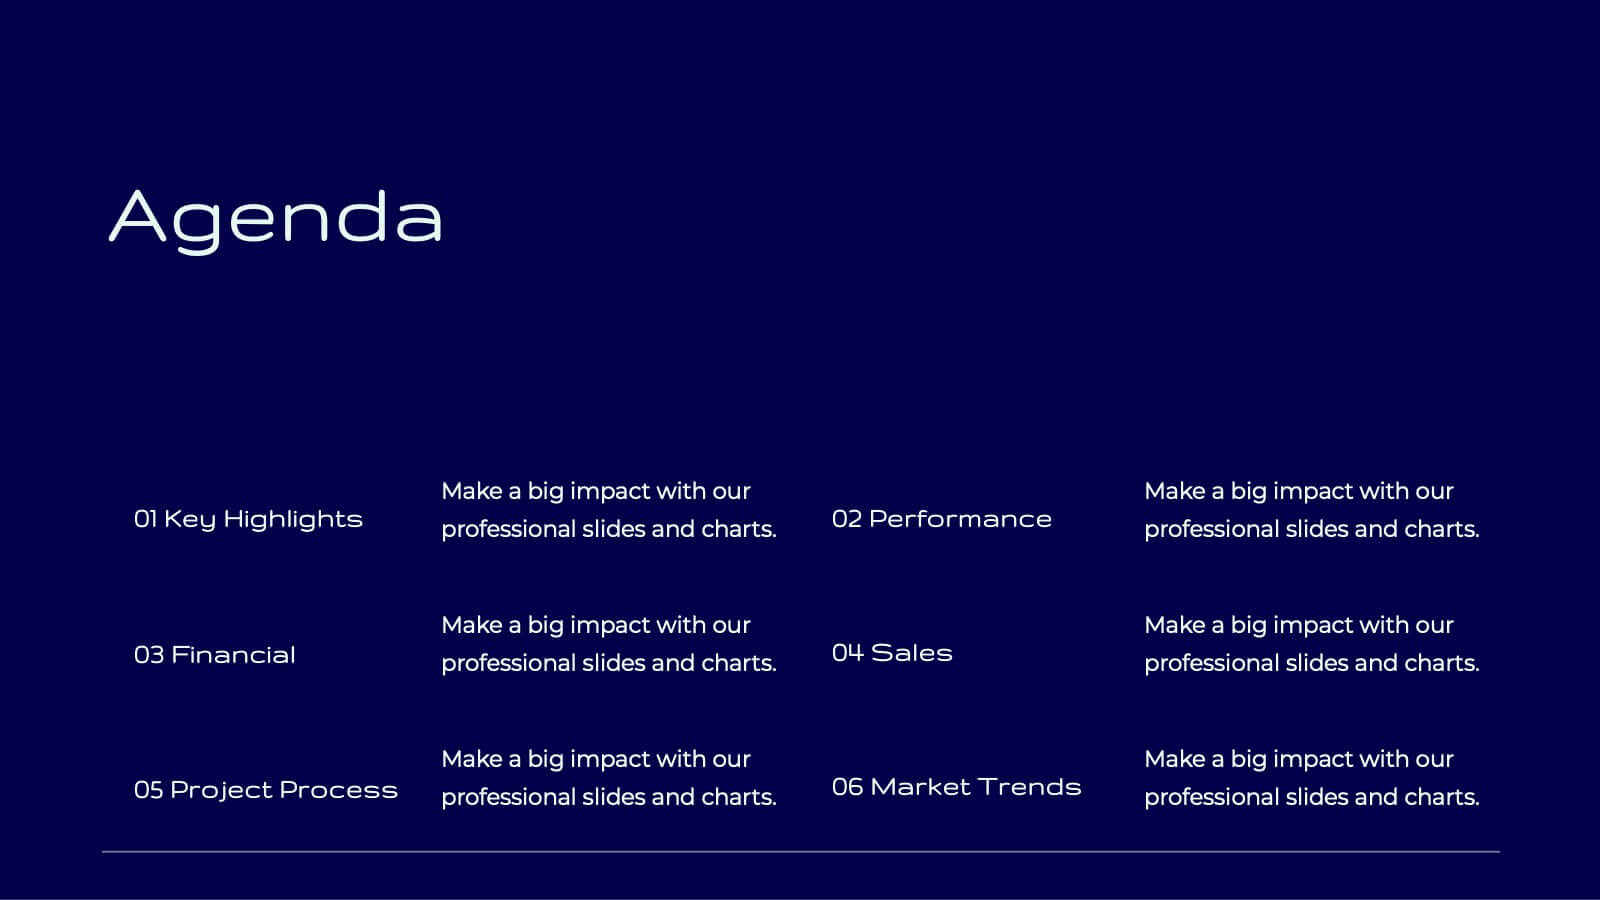
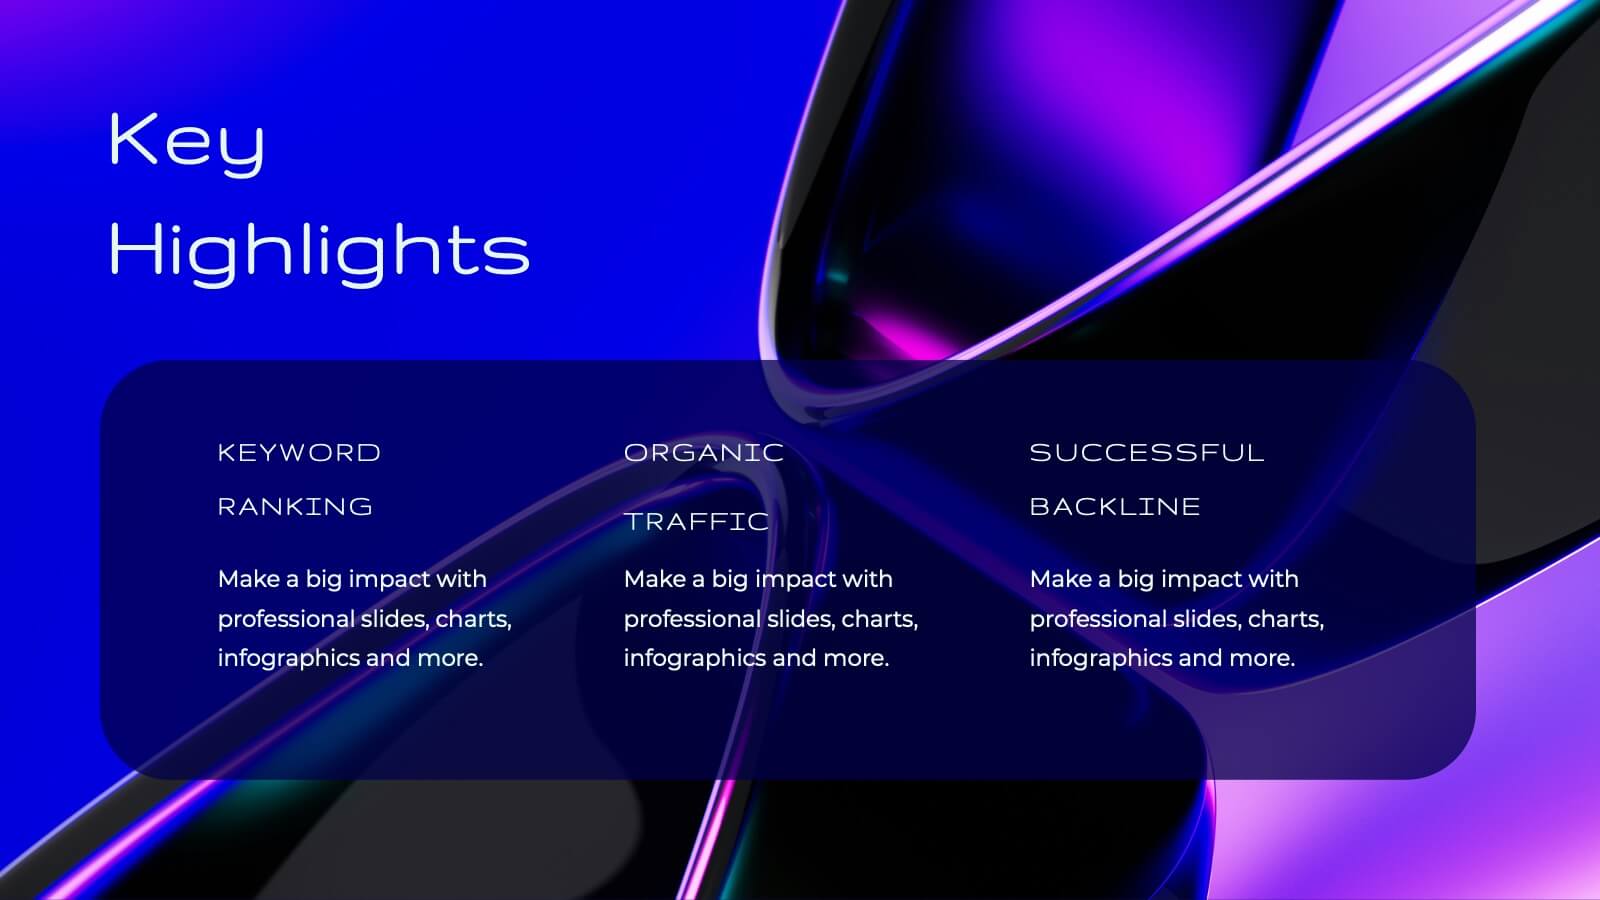
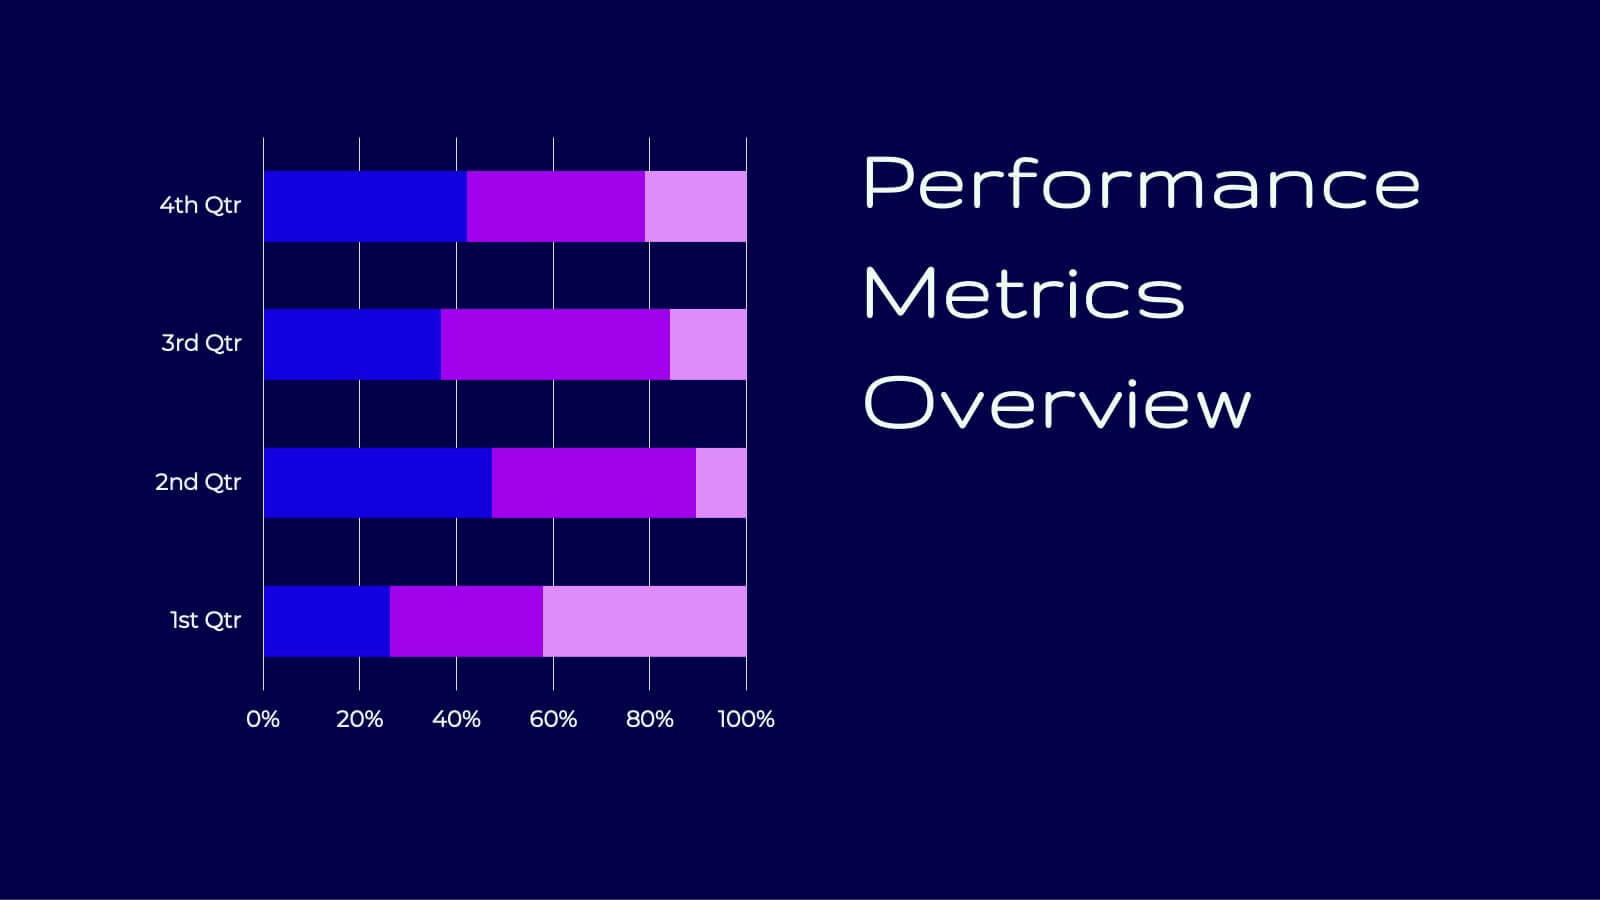
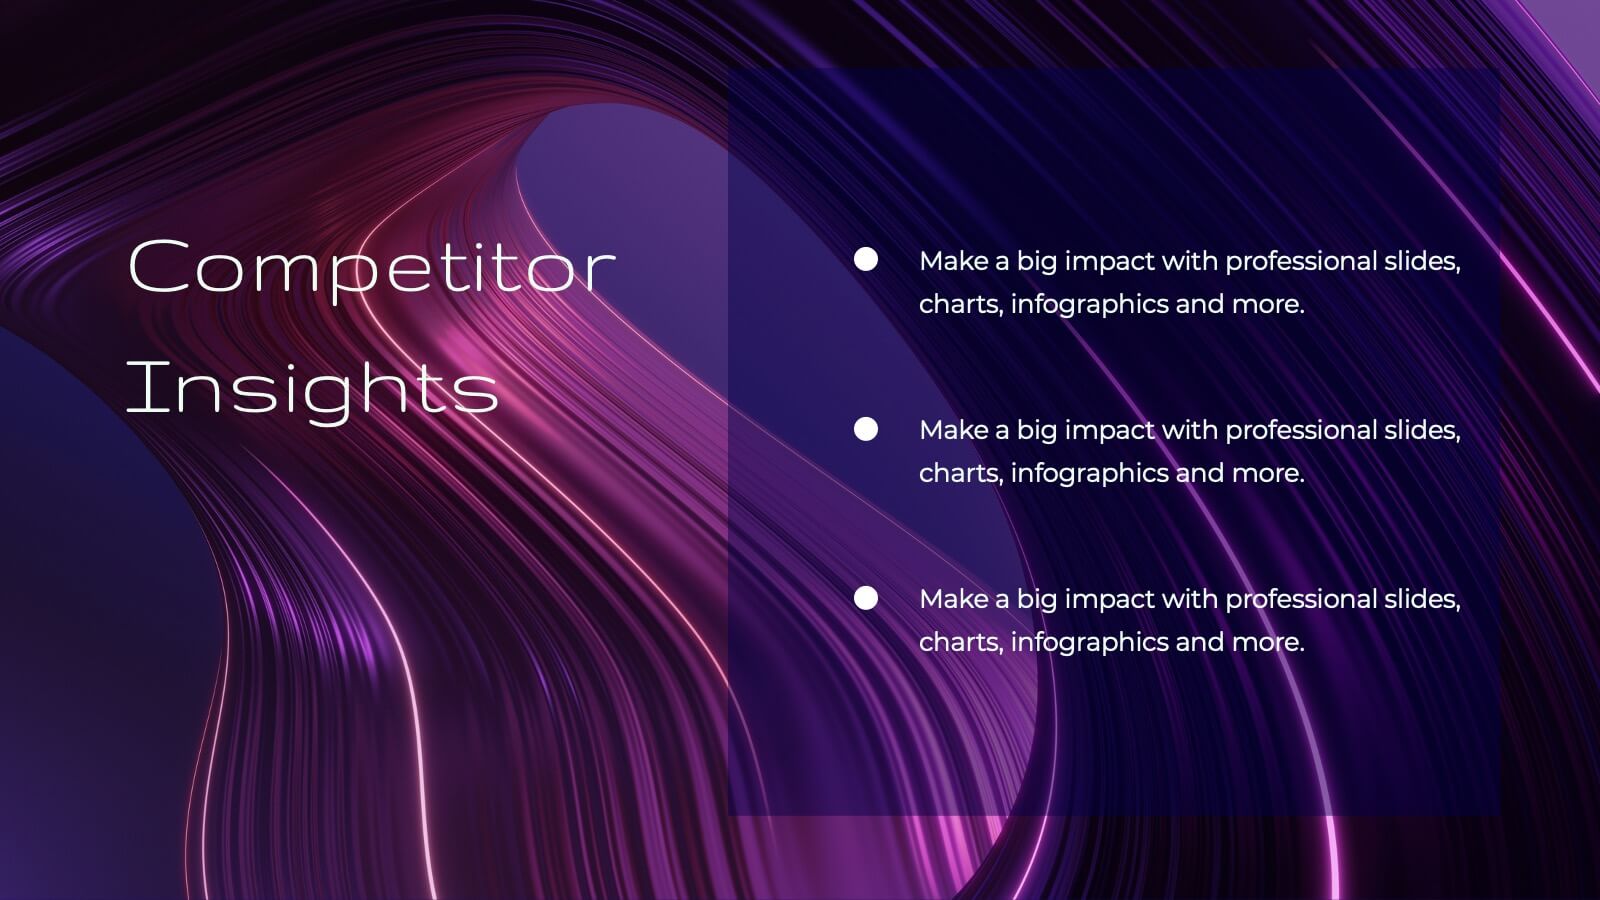
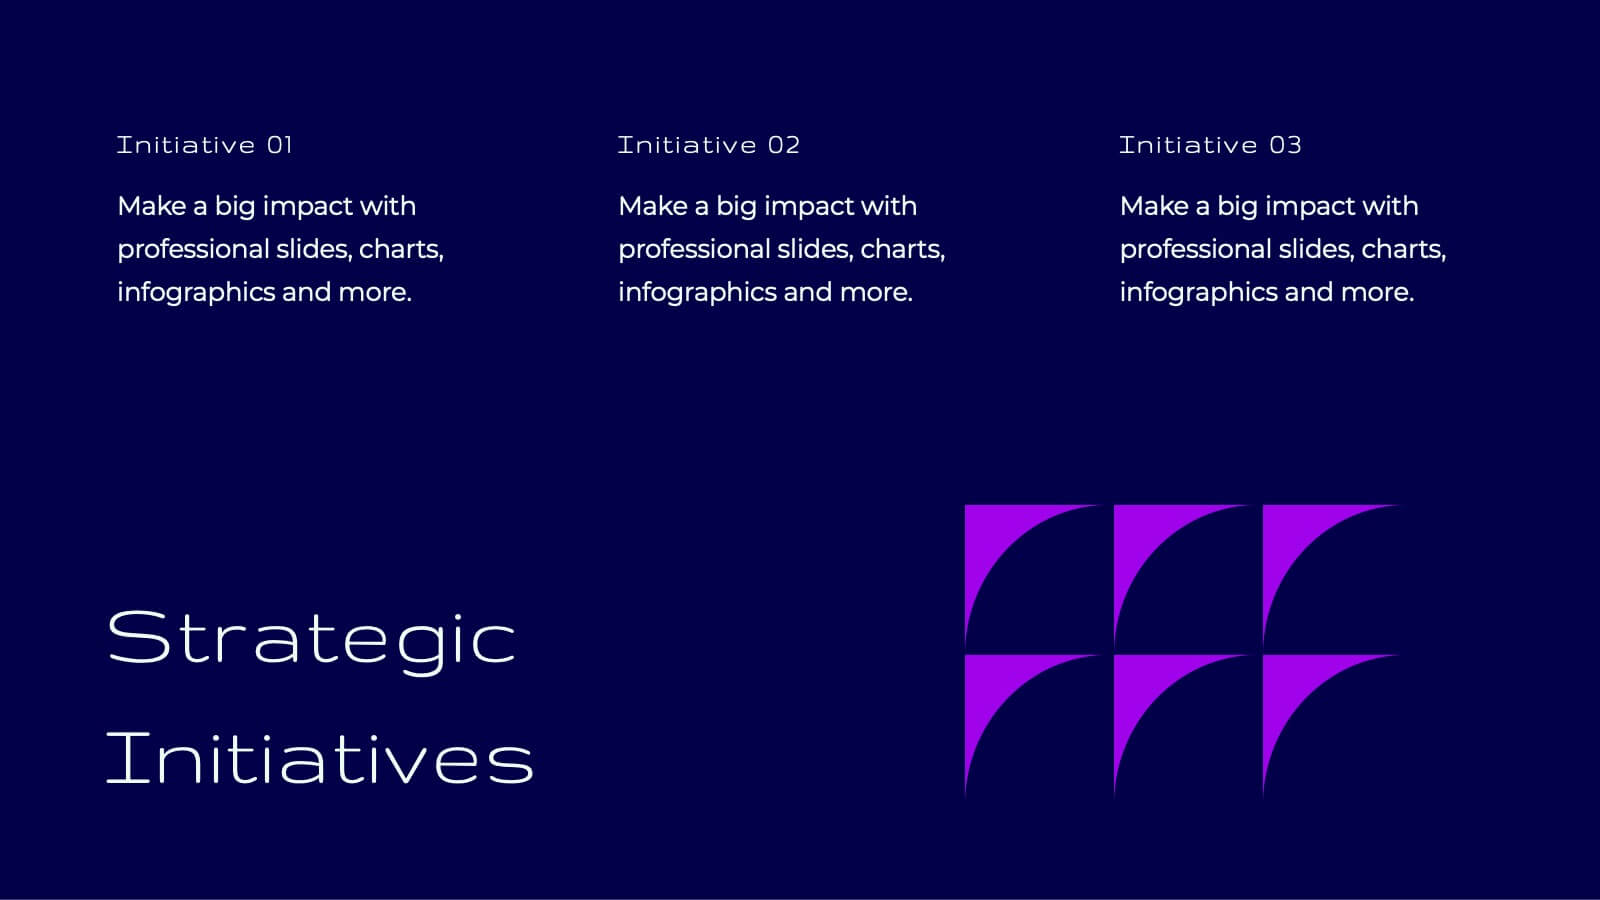
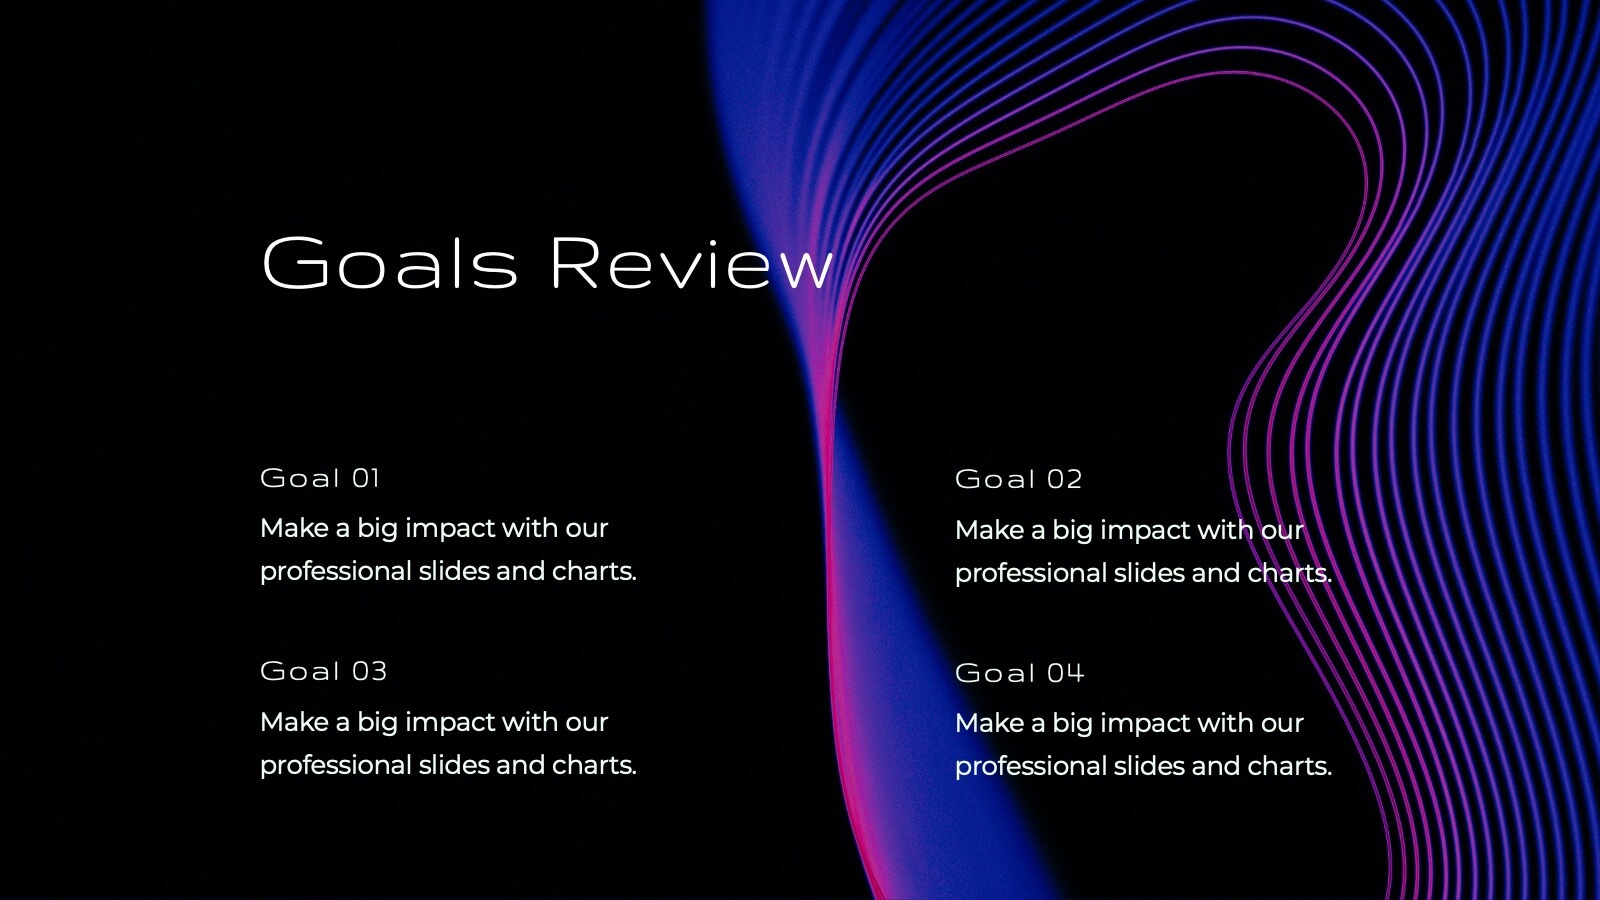
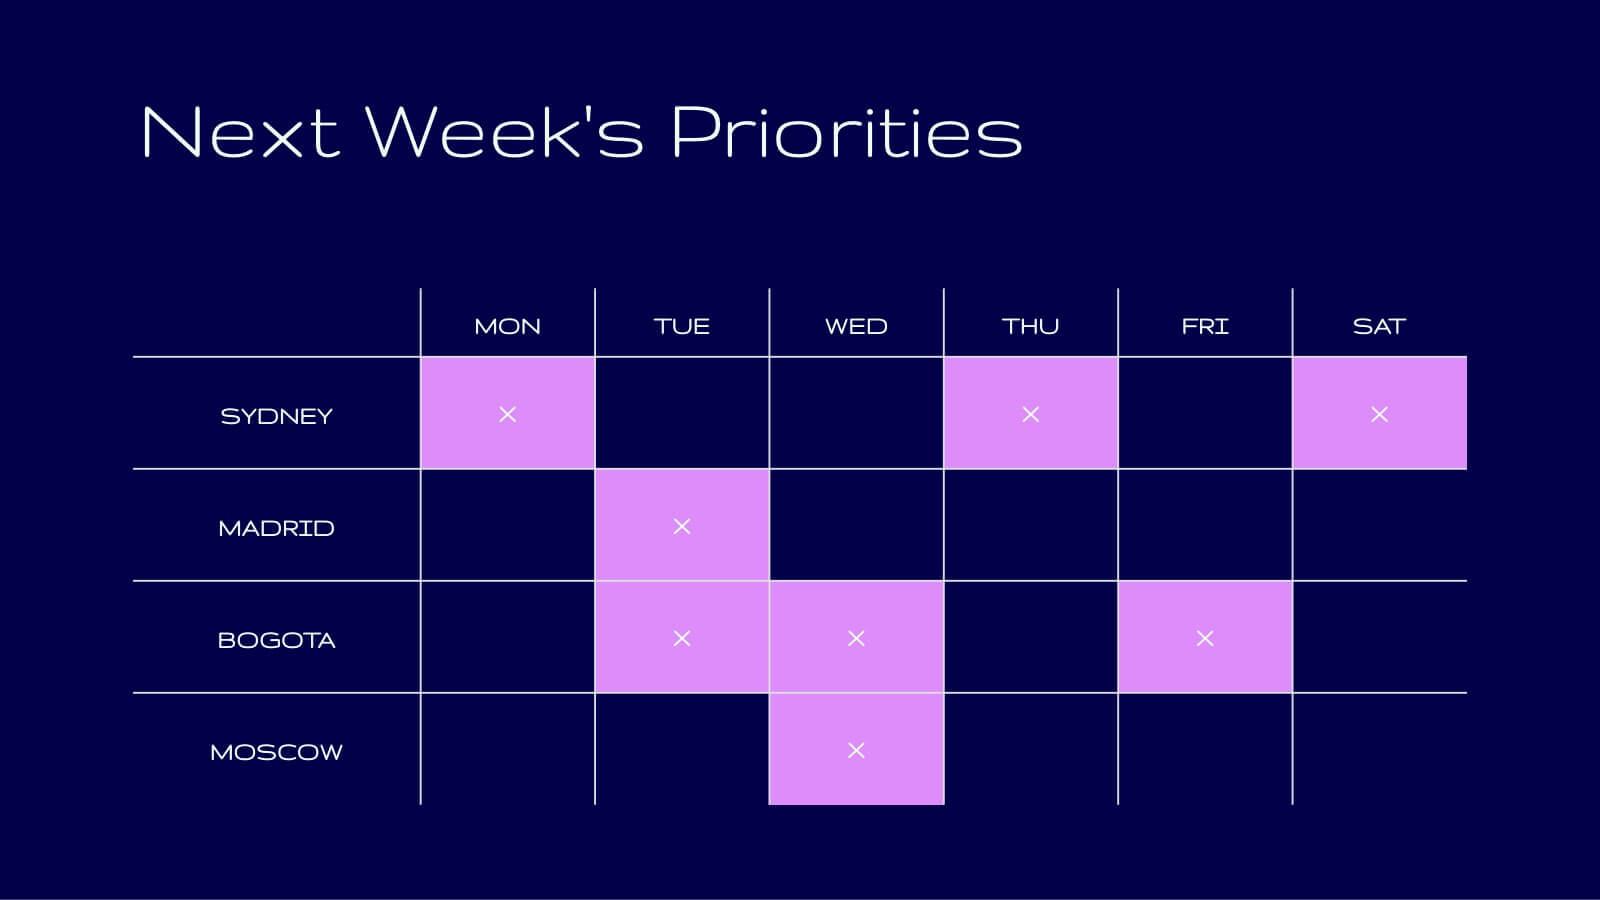
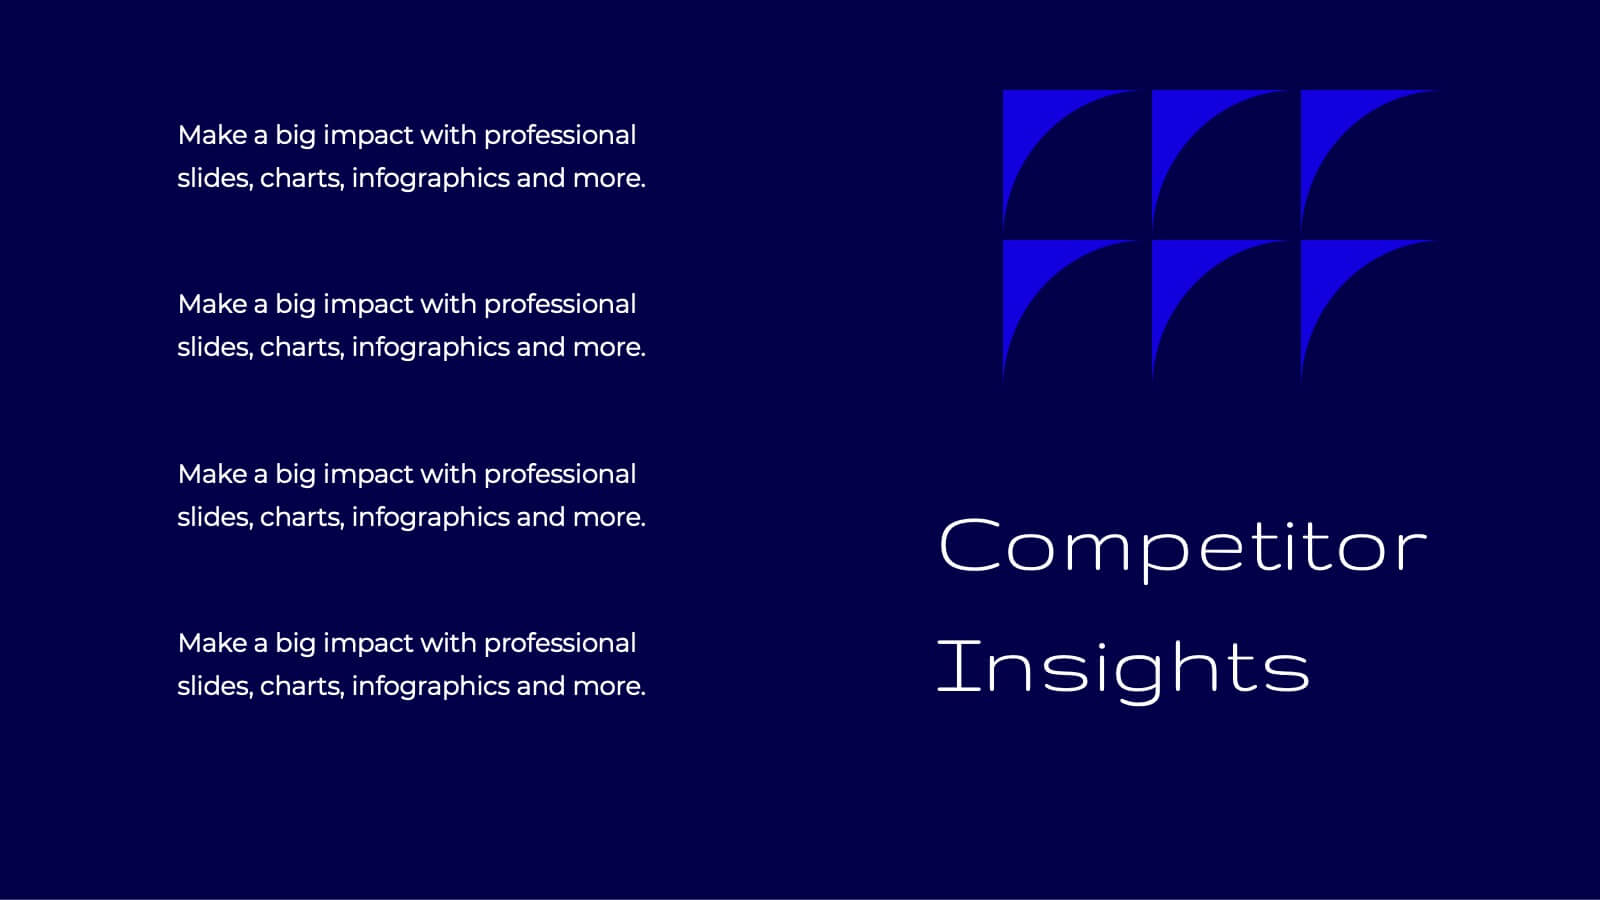
Tidal Research Findings Report Presentation
Deliver your research findings with impact using this sleek and modern report template! It covers key highlights, performance metrics, project progress, and competitor insights, making it ideal for clear, professional presentations. Perfect for summarizing challenges, solutions, and strategic initiatives. Compatible with PowerPoint, Keynote, and Google Slides for seamless reporting.


26 diapositivas
Cryptocurrency Technology Presentation
The foundation of cryptocurrency technology is the blockchain, cryptocurrency has the potential to transform the way we think about money and financial transactions, and it continues to evolve. With this template present the latest information on cryptocurrency and the emerging blockchain technologies. This features a variety of high-quality slides in many formats. Whether you want them to be edited on Keynote, PowerPoint, or google sheets this template has everything you need to make the most out of your presentation. Get creative and add your own style with this presentation template!