


Características


¿Tienes alguna pregunta?
Recomendar


6 diapositivas
Project Timeline Infographic
A project timeline is a visual representation of the planned schedule and key milestones of a project. This infographic is designed to outline the sequence of activities, tasks, and events that need to be completed within a specific timeframe to achieve your project goals. This allows you to showcase the timeline of a project, from its inception to completion. It provides a clear and concise overview of the project's major milestones, tasks, and deadlines, enabling viewers to understand the project's progress at a glance. Compatible with Powerpoint, Keynote, and Google Slides.


7 diapositivas
Artificial Intelligence Education Infographic Presentation
Artificial Intelligence is an important field of study and development that has the potential to revolutionize many aspects of modern life. A great way to display your ideas in a visual manner, this AI Infographic Template can be used by businesses and corporations who want to communicate their team vision in a clear and dynamic way. This template is completely editable, allowing you to customize it with your own information and photos. It includes icons and graphs to illustrate your points, as well as text boxes and slide titles. It is compatible with Powerpoint, Keynote and Google Slides.


2 diapositivas
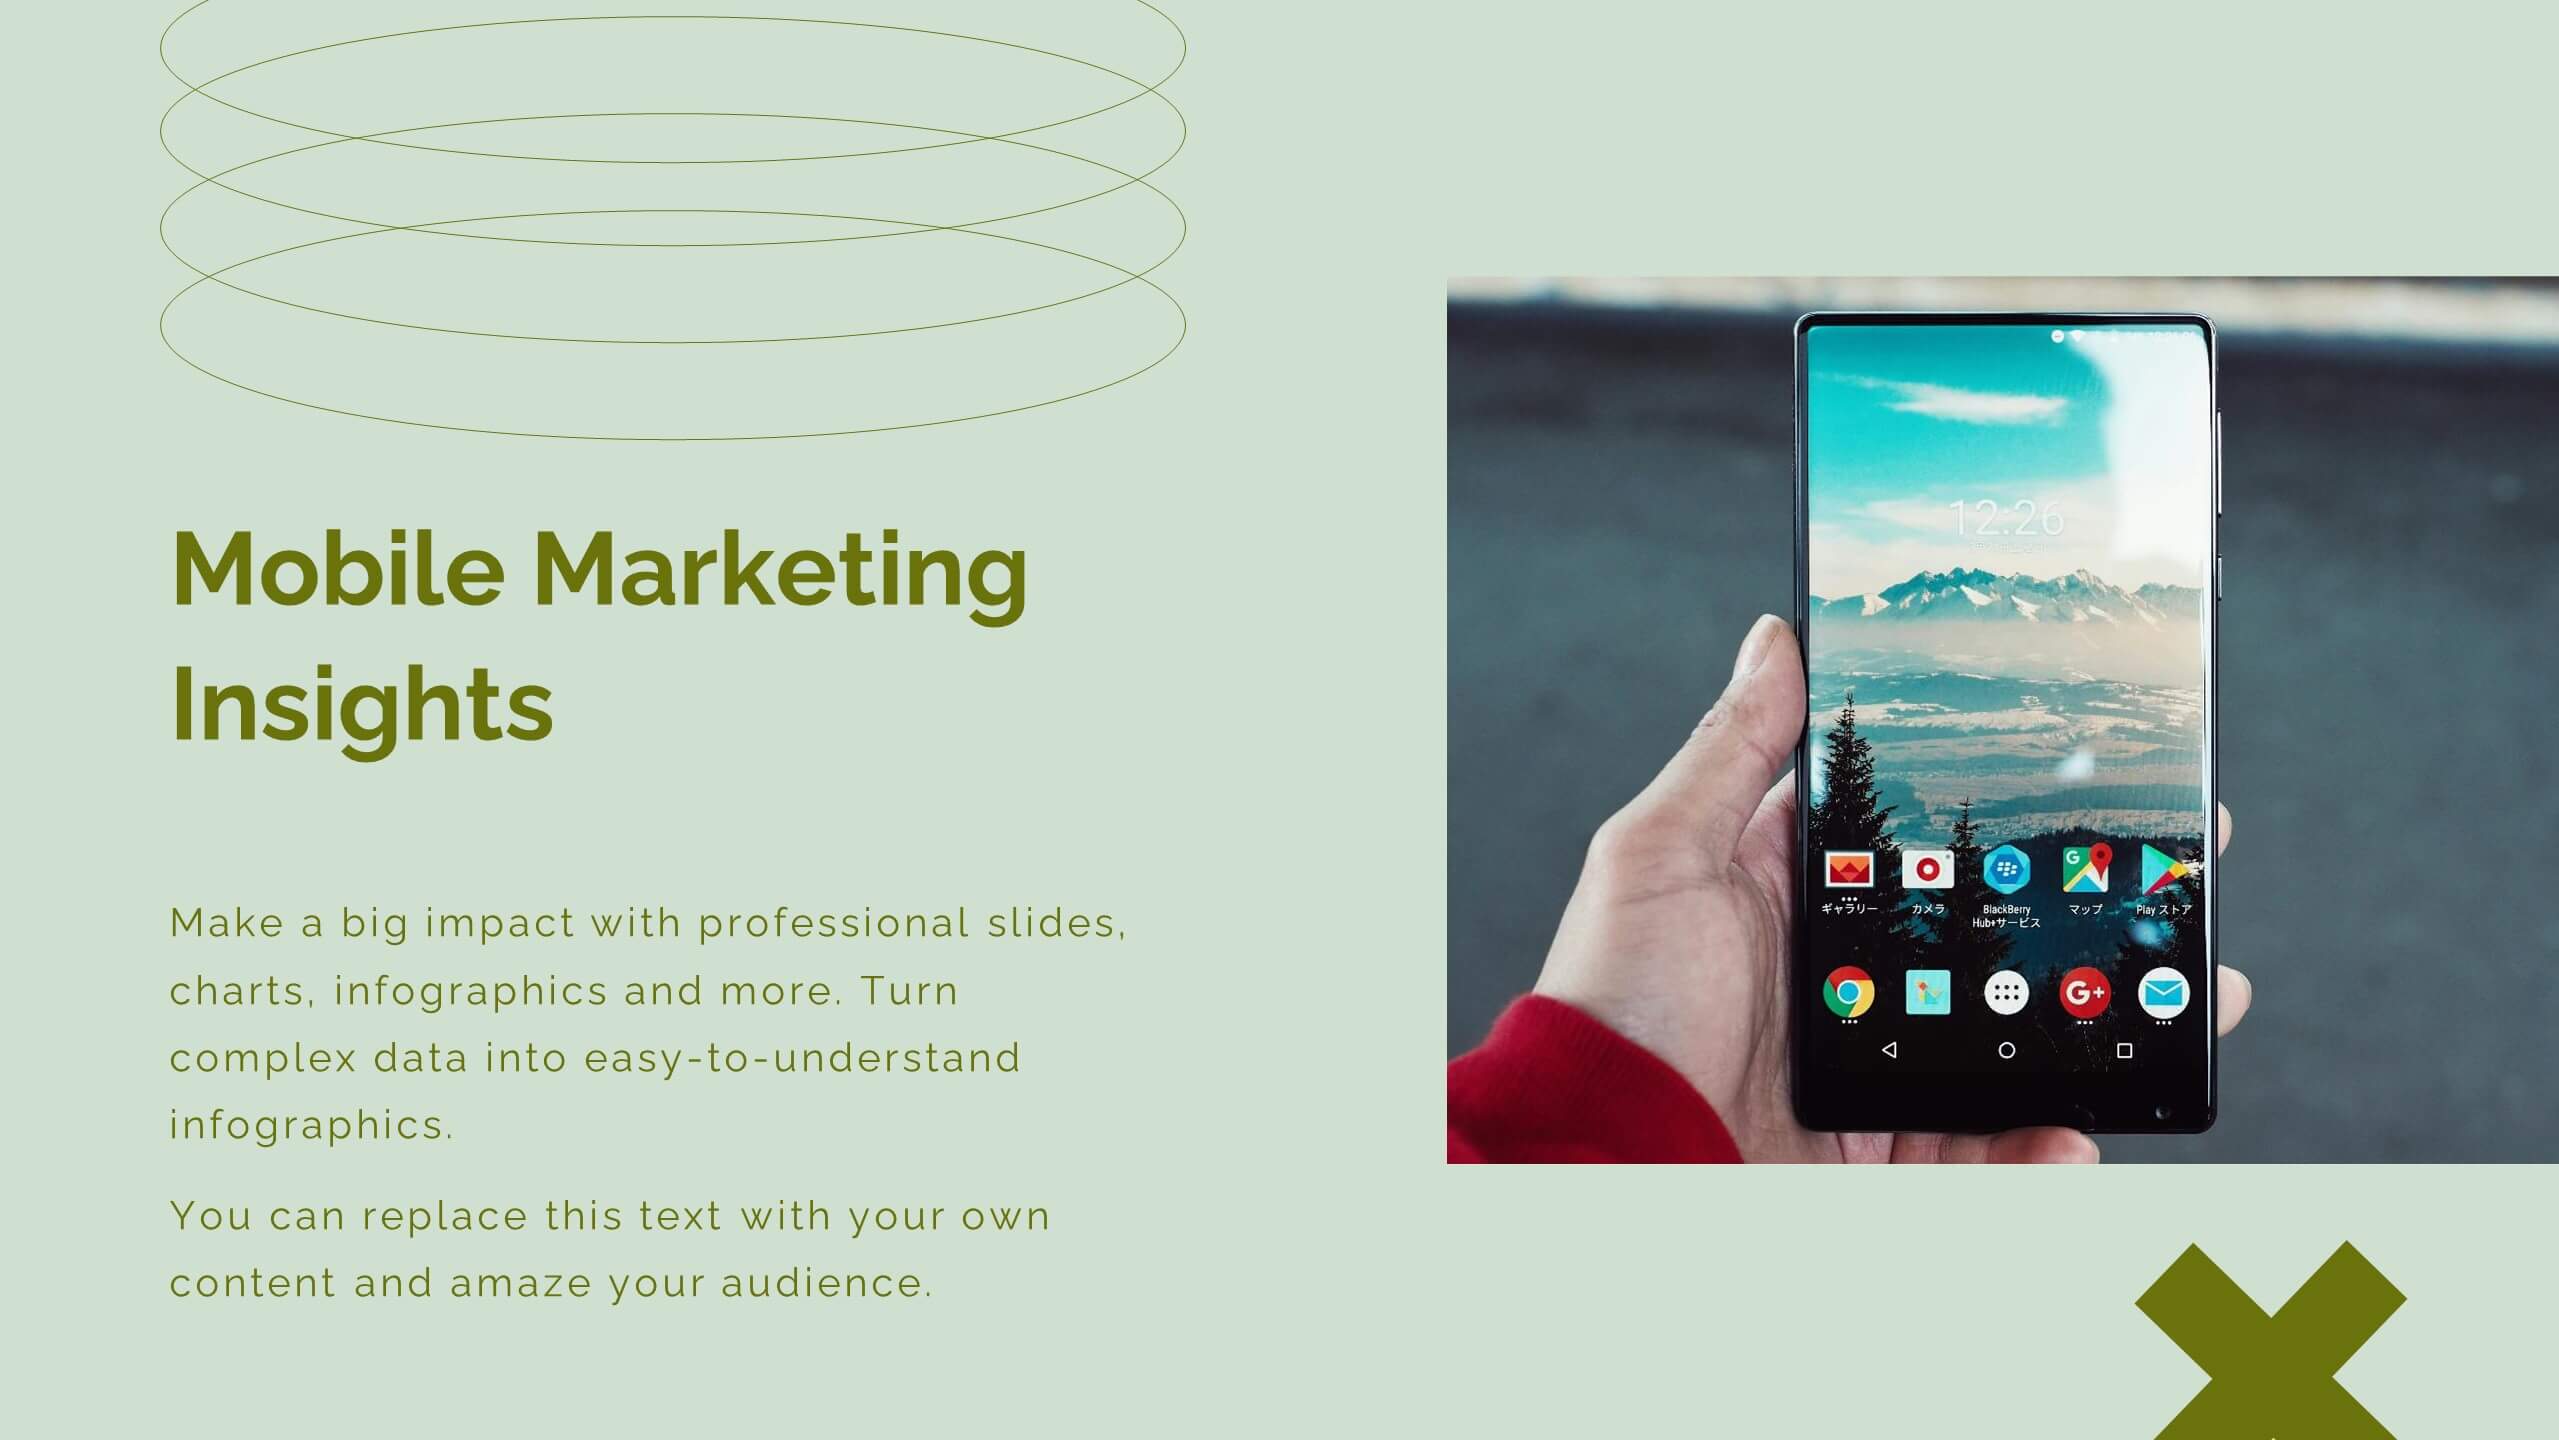
Mobile and Laptop Mockup Devices Presentation
Showcase your designs with the Mobile and Laptop Mockup Devices presentation template. Featuring clean and modern device frames, this slide helps you present responsive web designs, app interfaces, or digital content seamlessly. Ideal for designers, marketers, and tech presentations. Fully editable and compatible with PowerPoint, Keynote, and Google Slides.


7 diapositivas
Science Research Infographic
Science research, is a systematic and organized inquiry that aims to generate new knowledge, validate existing knowledge, or solve specific problems using scientific methods and principles. This infographic template aims to present your science research initiatives, achievements, and vision to the audience in an engaging and informative way. This is essential to convey complex scientific data and discoveries in a visually appealing manner. Fully customizable and compatible with Powerpoint, Keynote, and Google Slides. Adapt and personalize the content to align with your specific research center's focus and mission.


26 diapositivas
Flowers Bold Company Profile Presentation
Step into the enchanting garden of happy flowers, where petals dance and colors sing. Our template, awash in sunlit shades of pink, yellow, orange, and blue, encapsulates the very essence of floral joy. Bursting with vibrant graphics, whimsical icons, and cheerful image placeholders, it's a bouquet of design brilliance. Crafted to perfection for Powerpoint, Keynote, or Google Slides. A delightful pick for florists, garden enthusiasts, event planners, or anyone looking to infuse their presentation with a touch of nature's merriment. Blossom your ideas; let your presentations bloom with happiness.

20 diapositivas
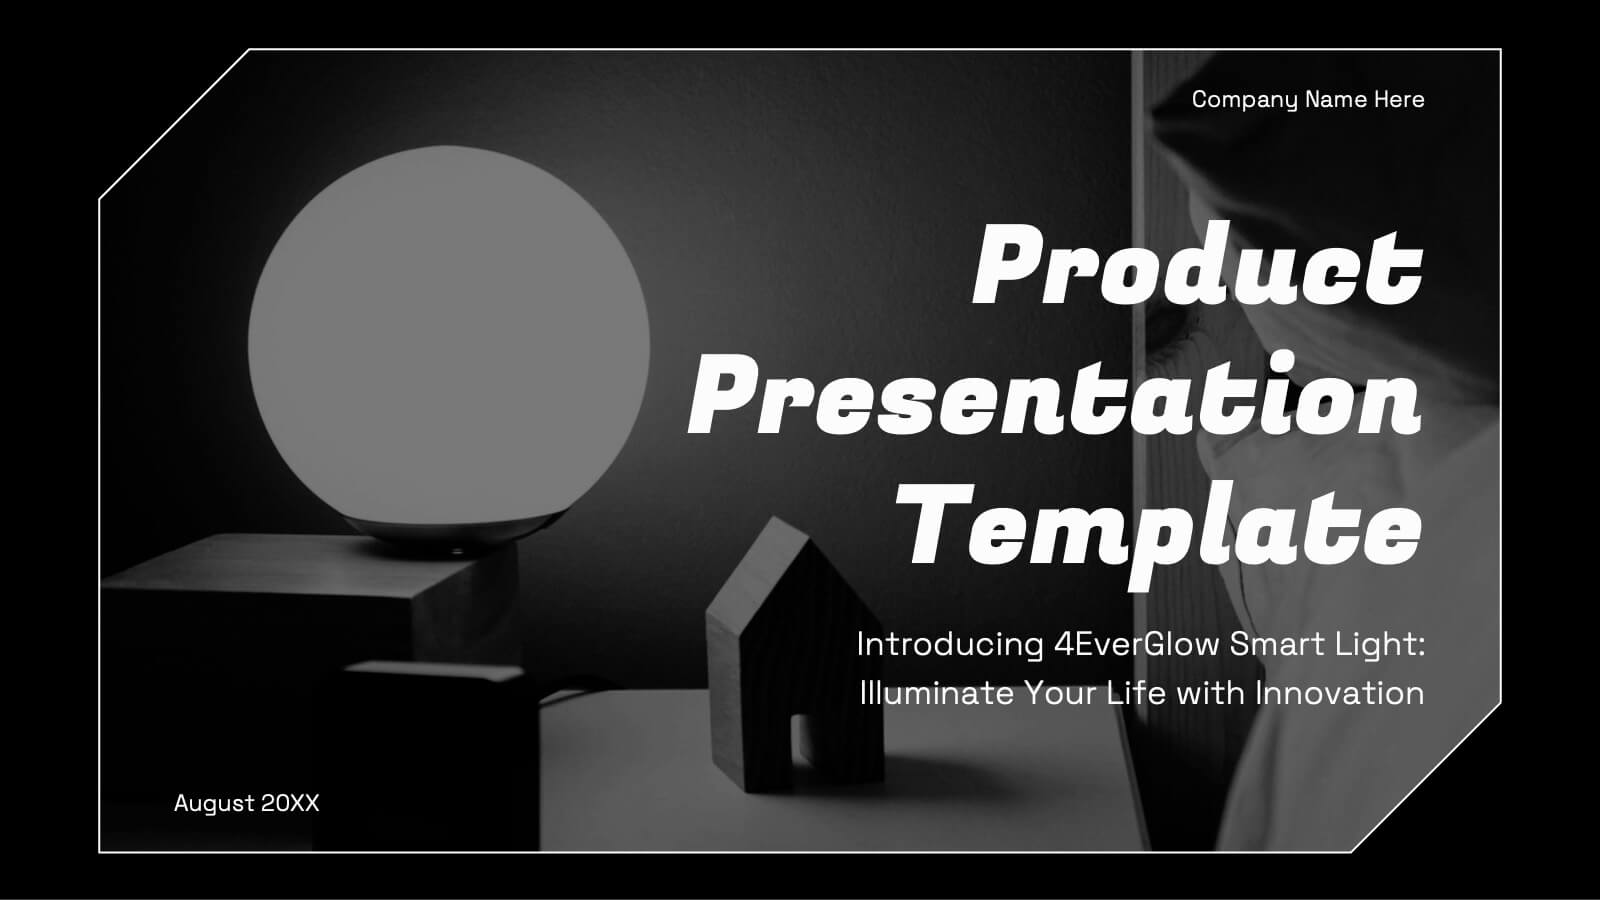
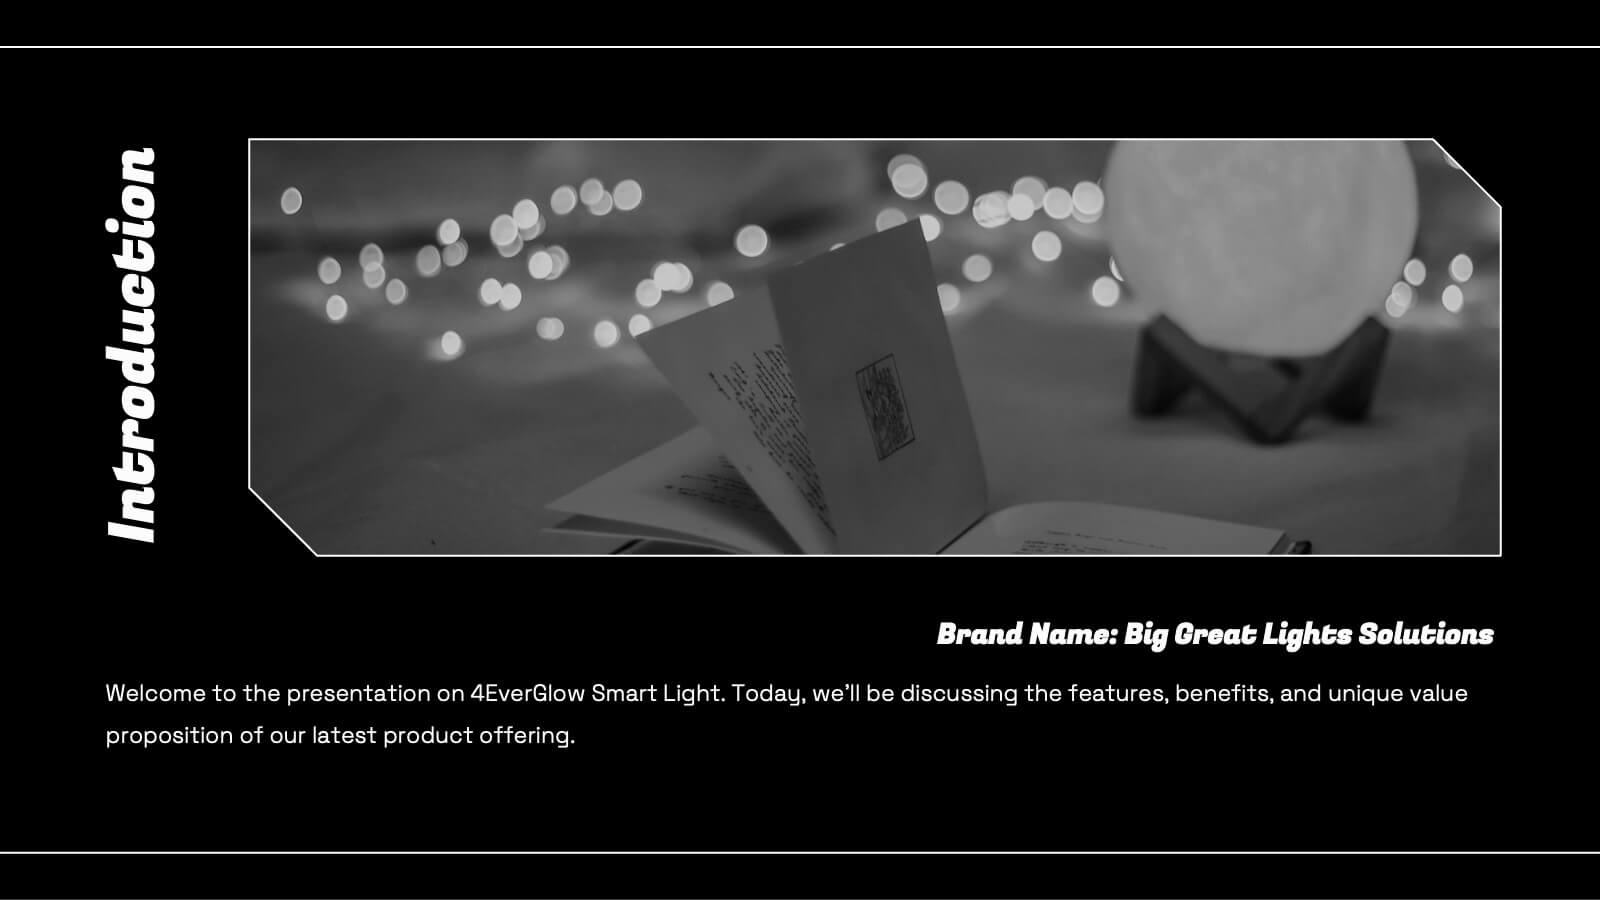
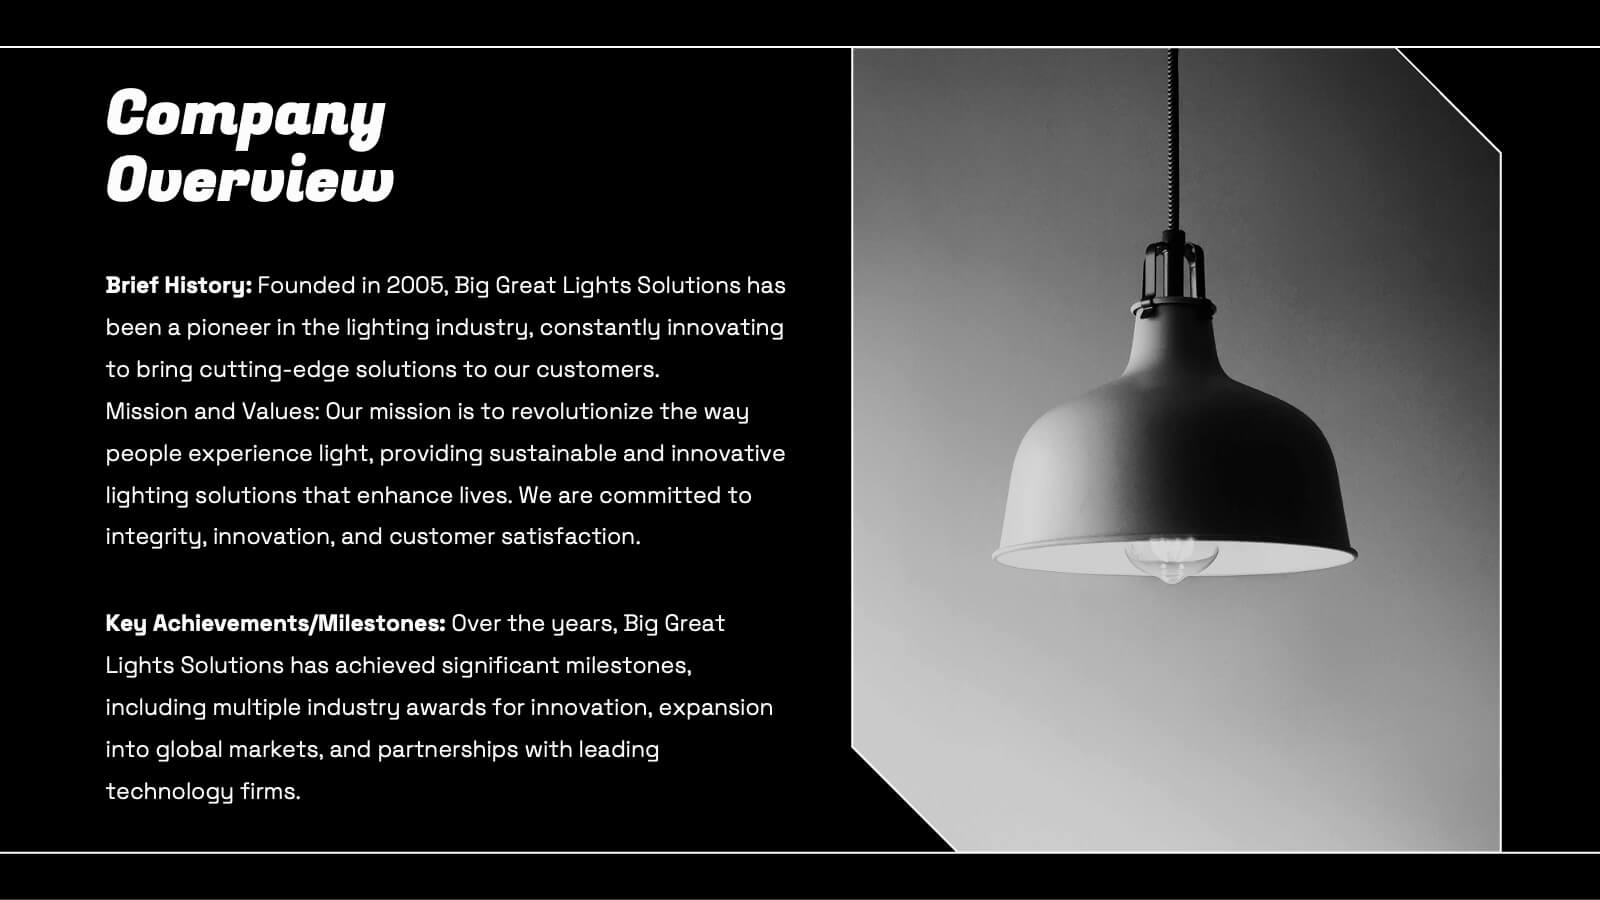
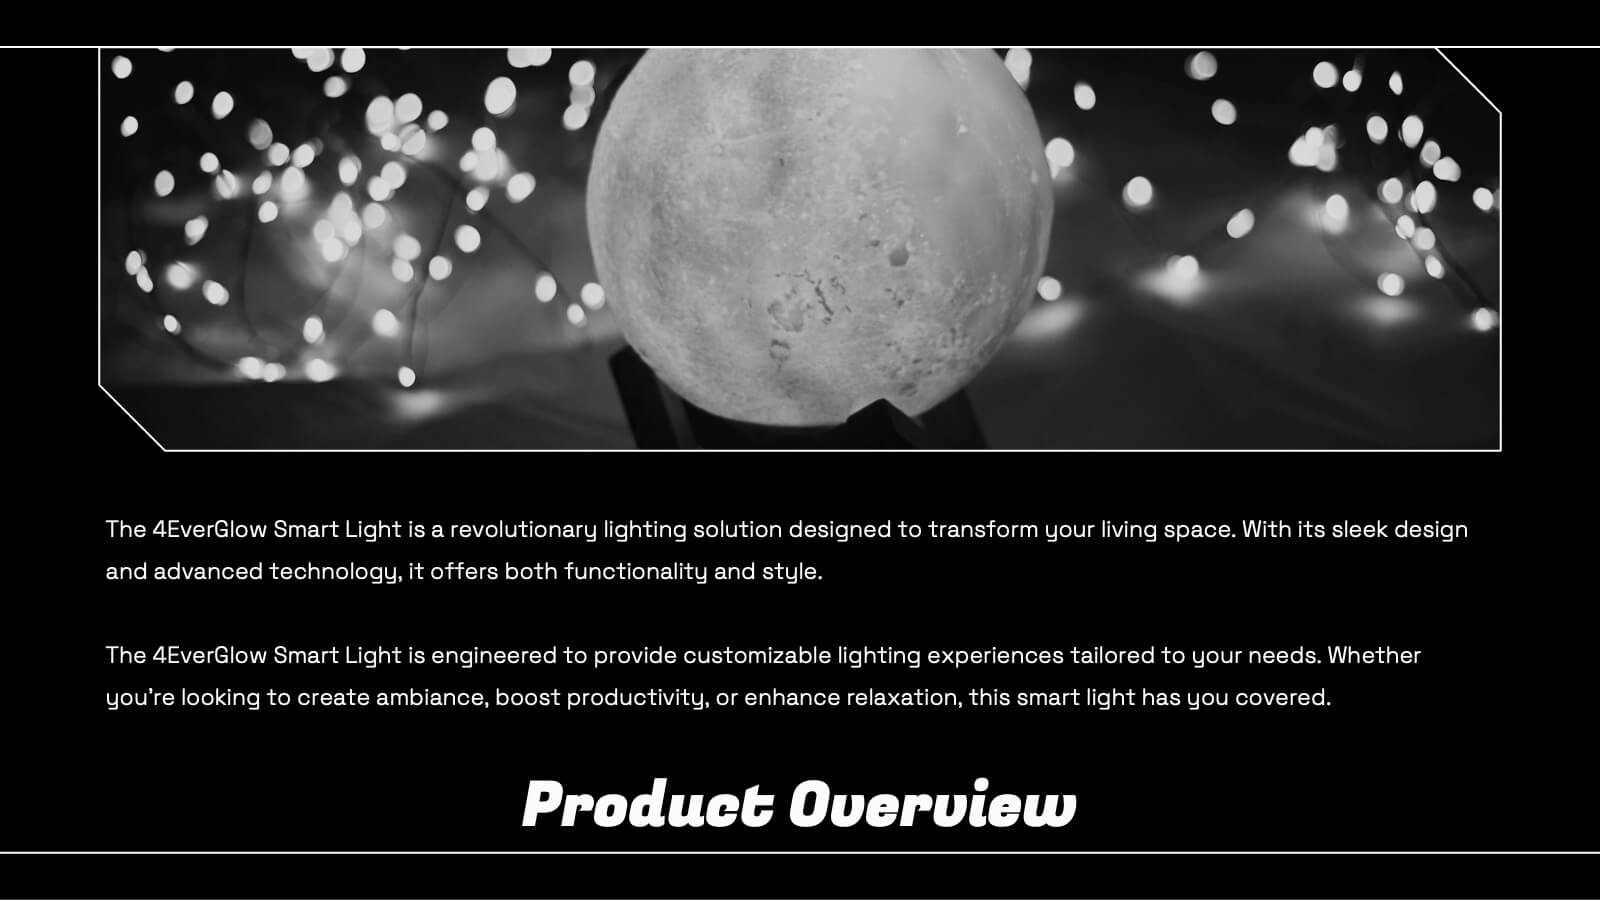
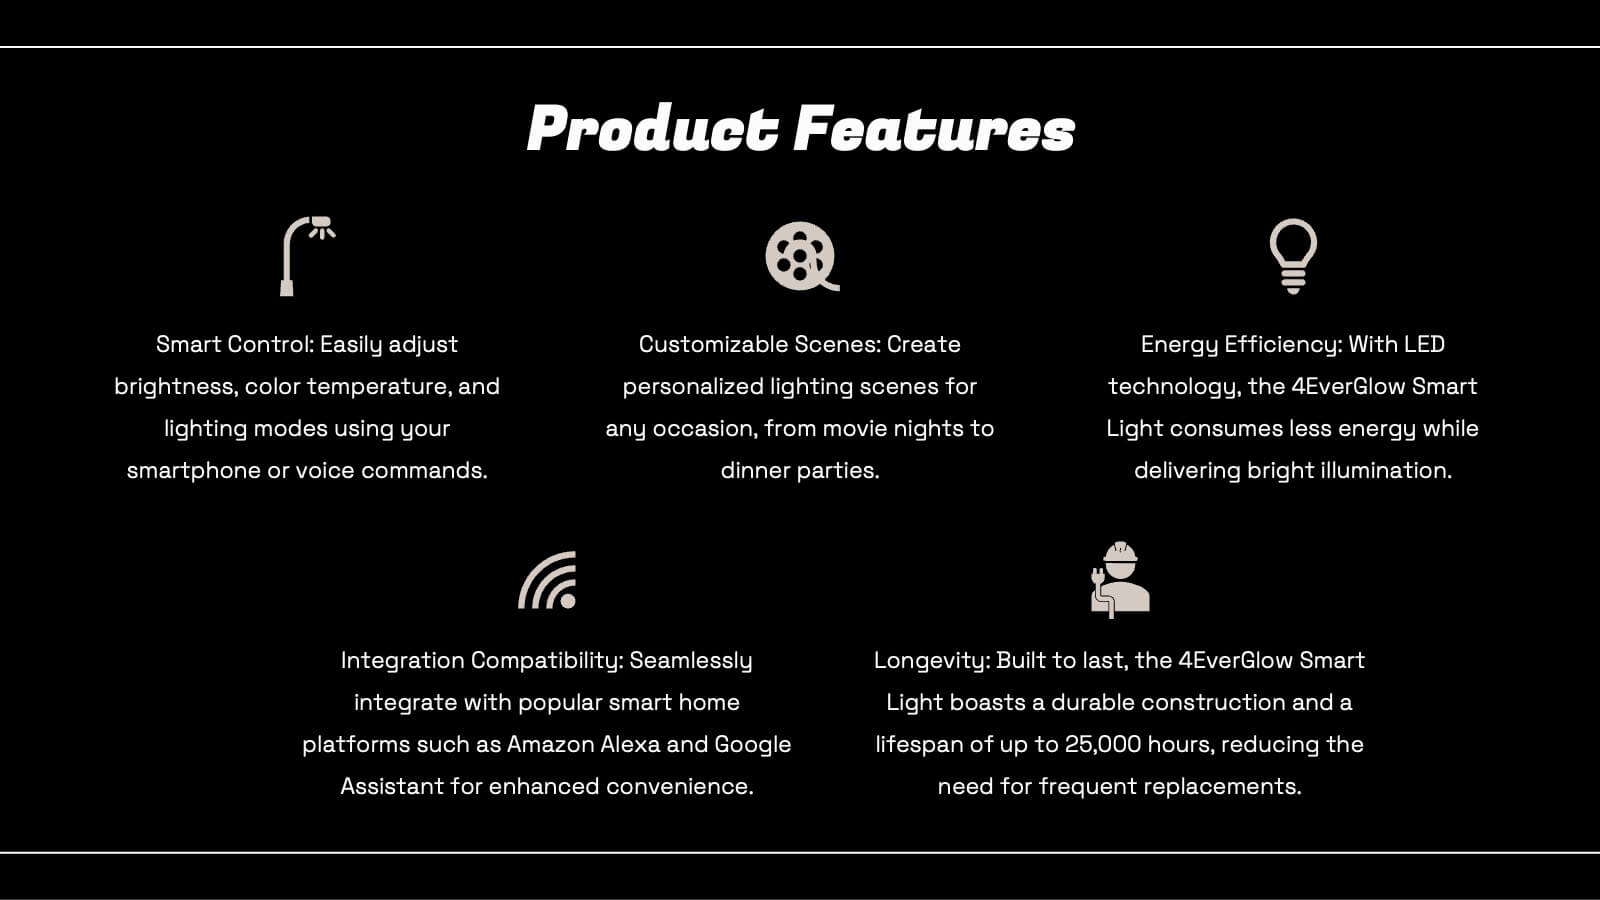
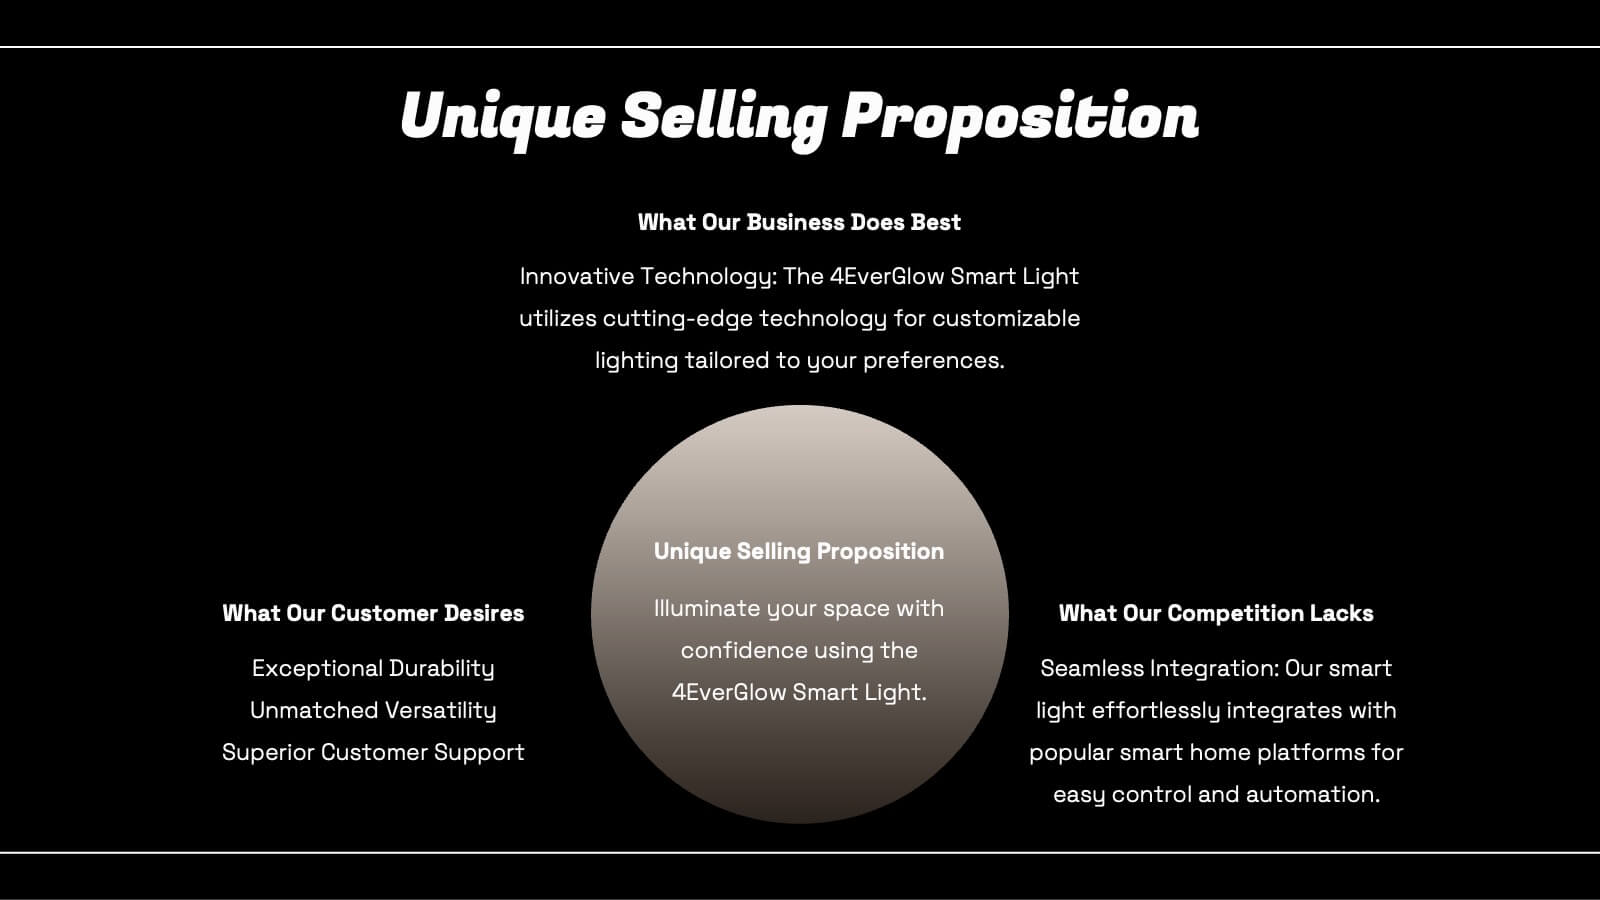
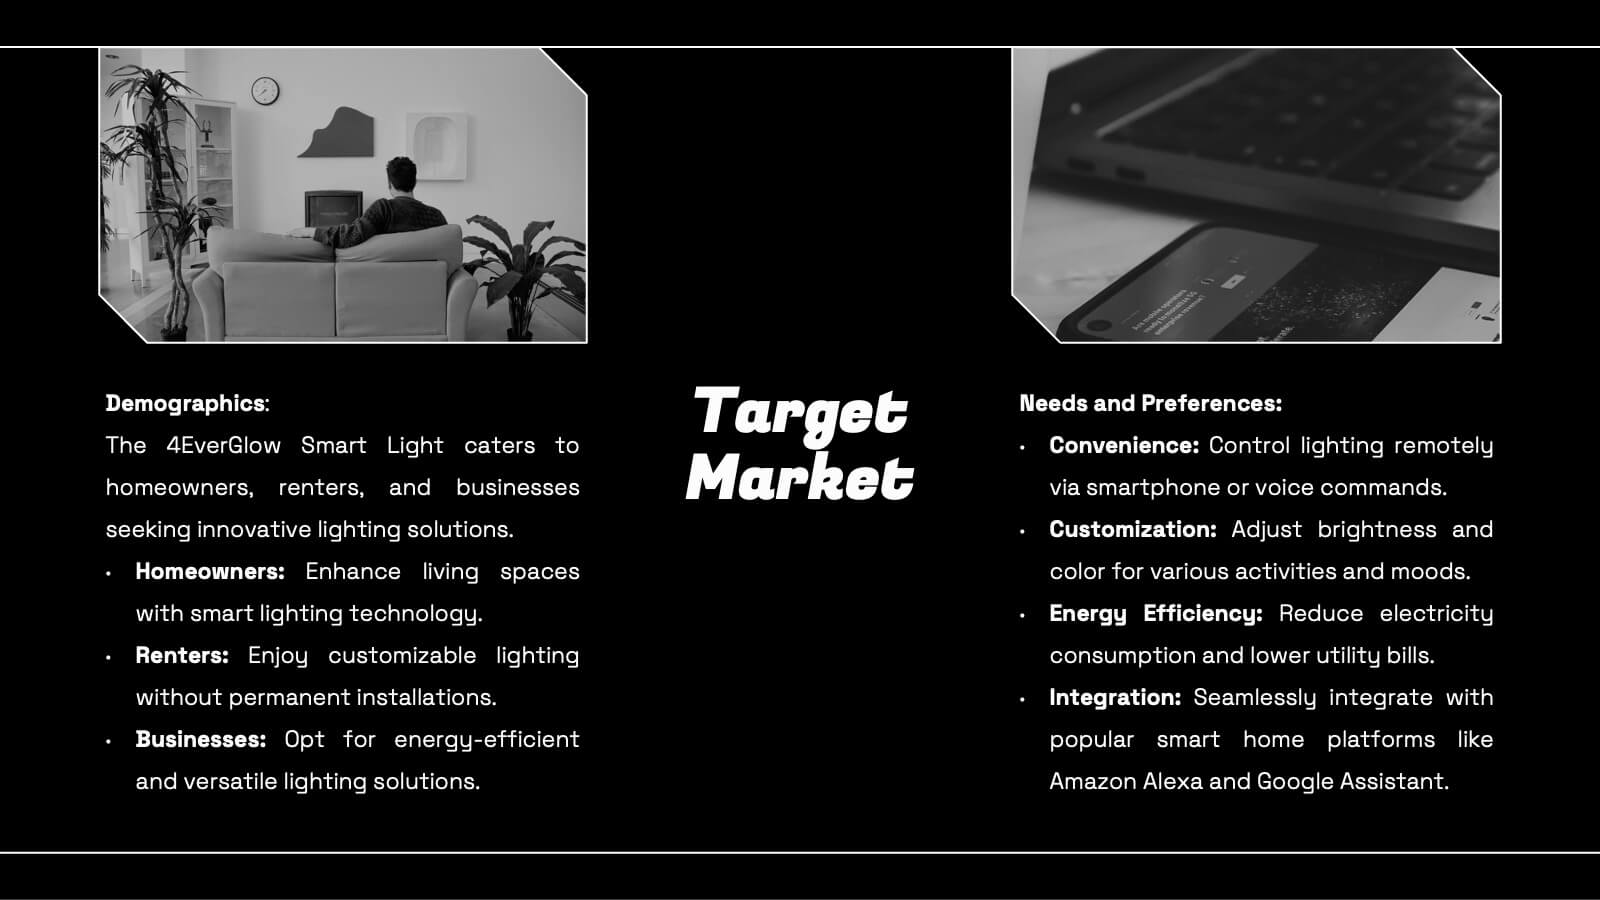
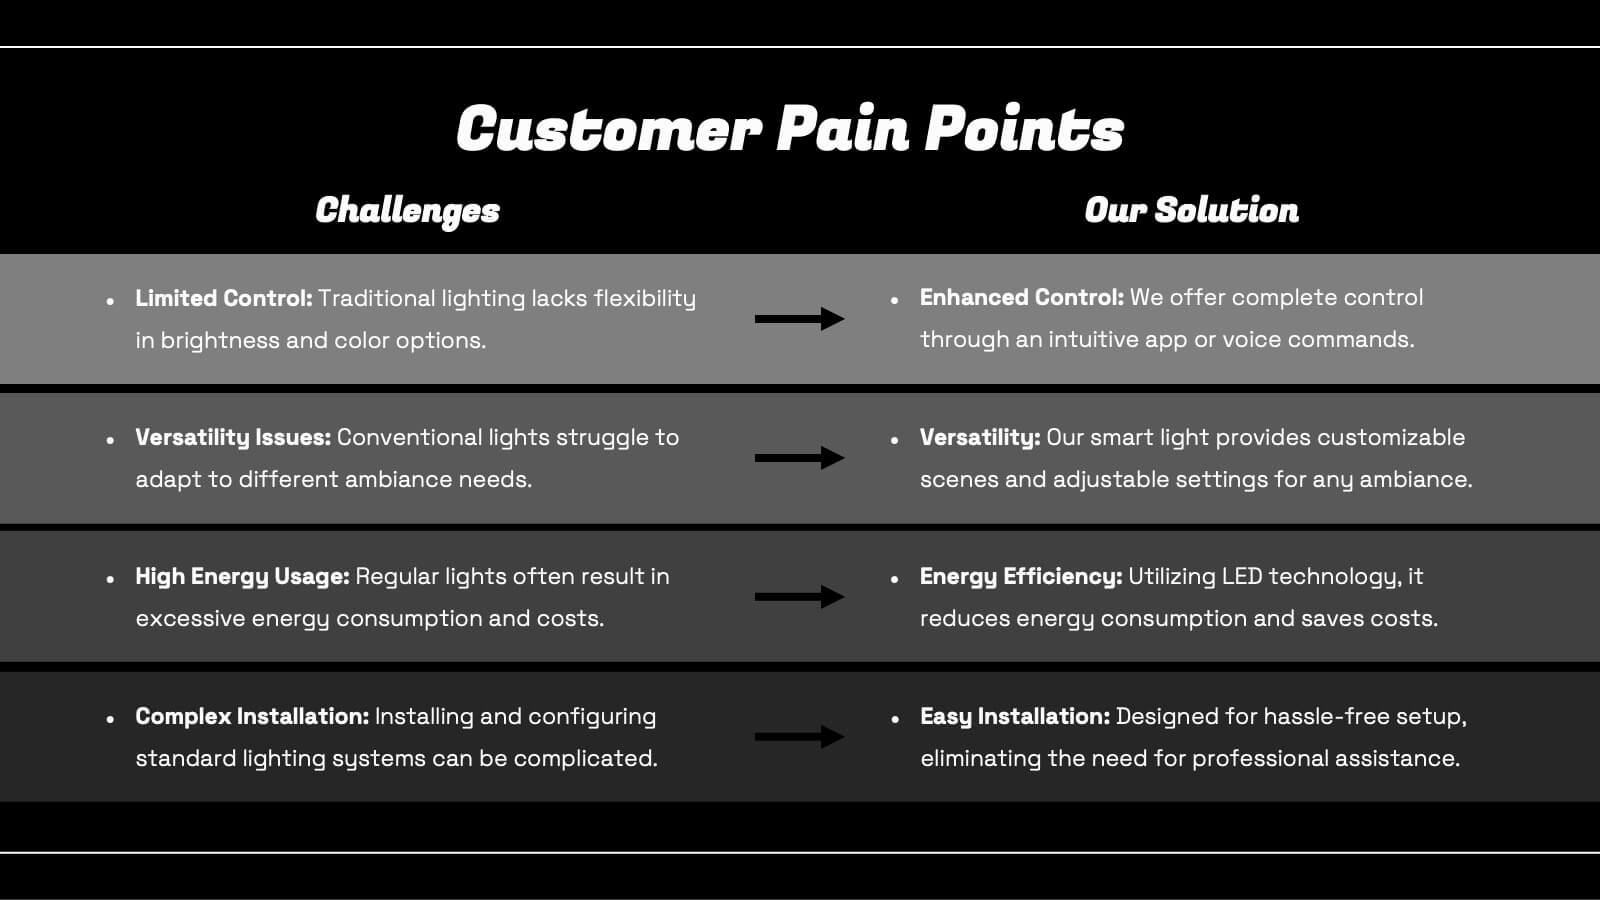
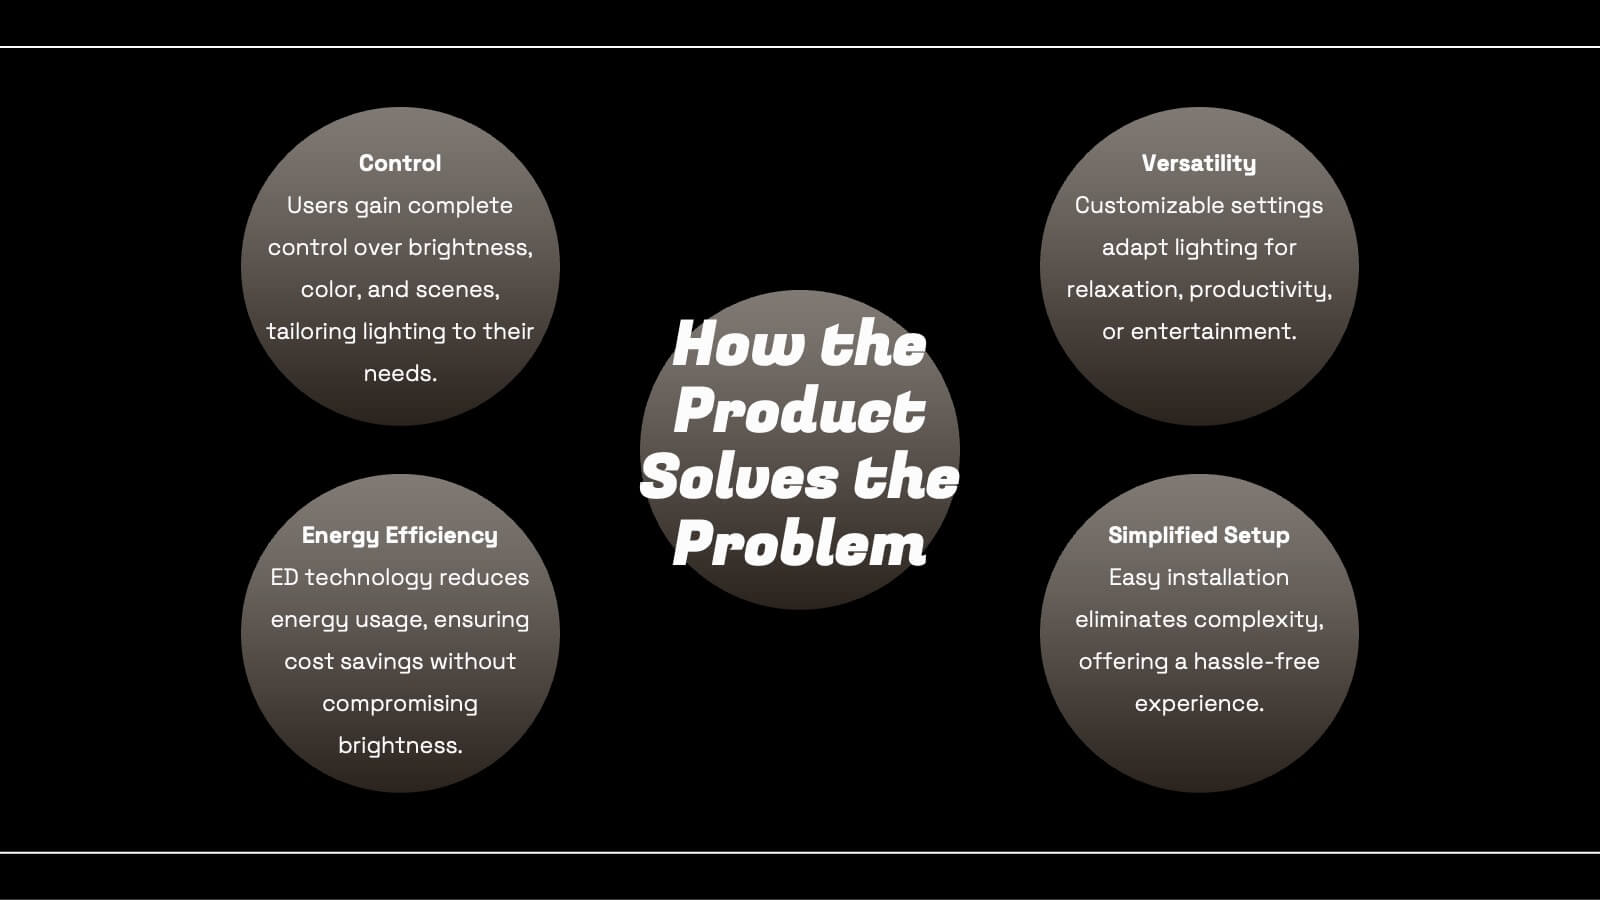
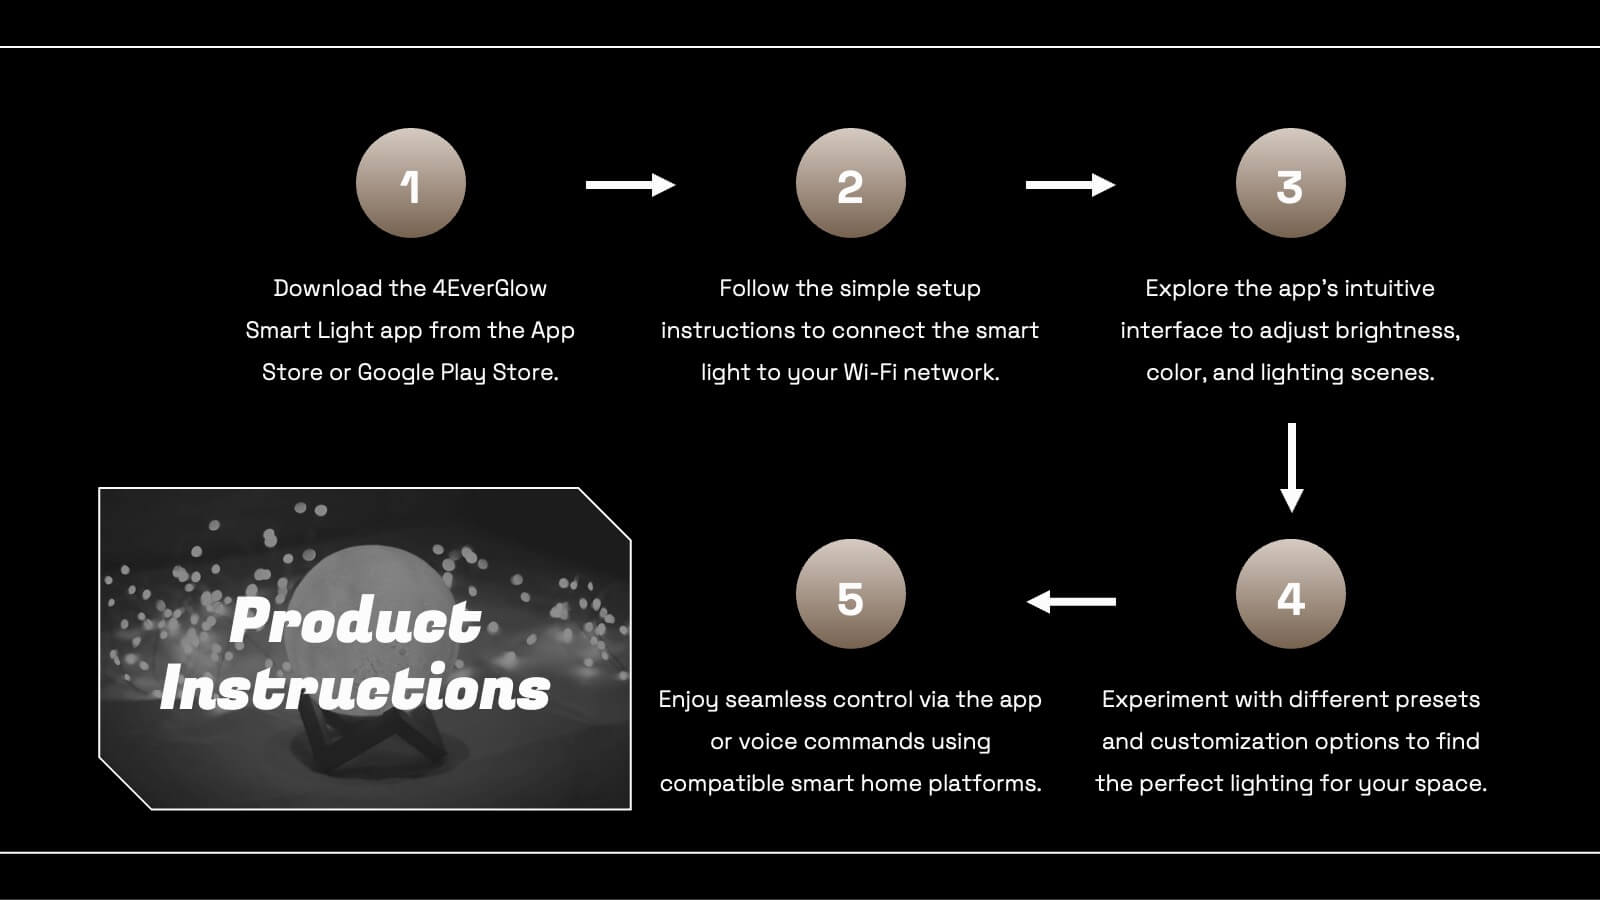
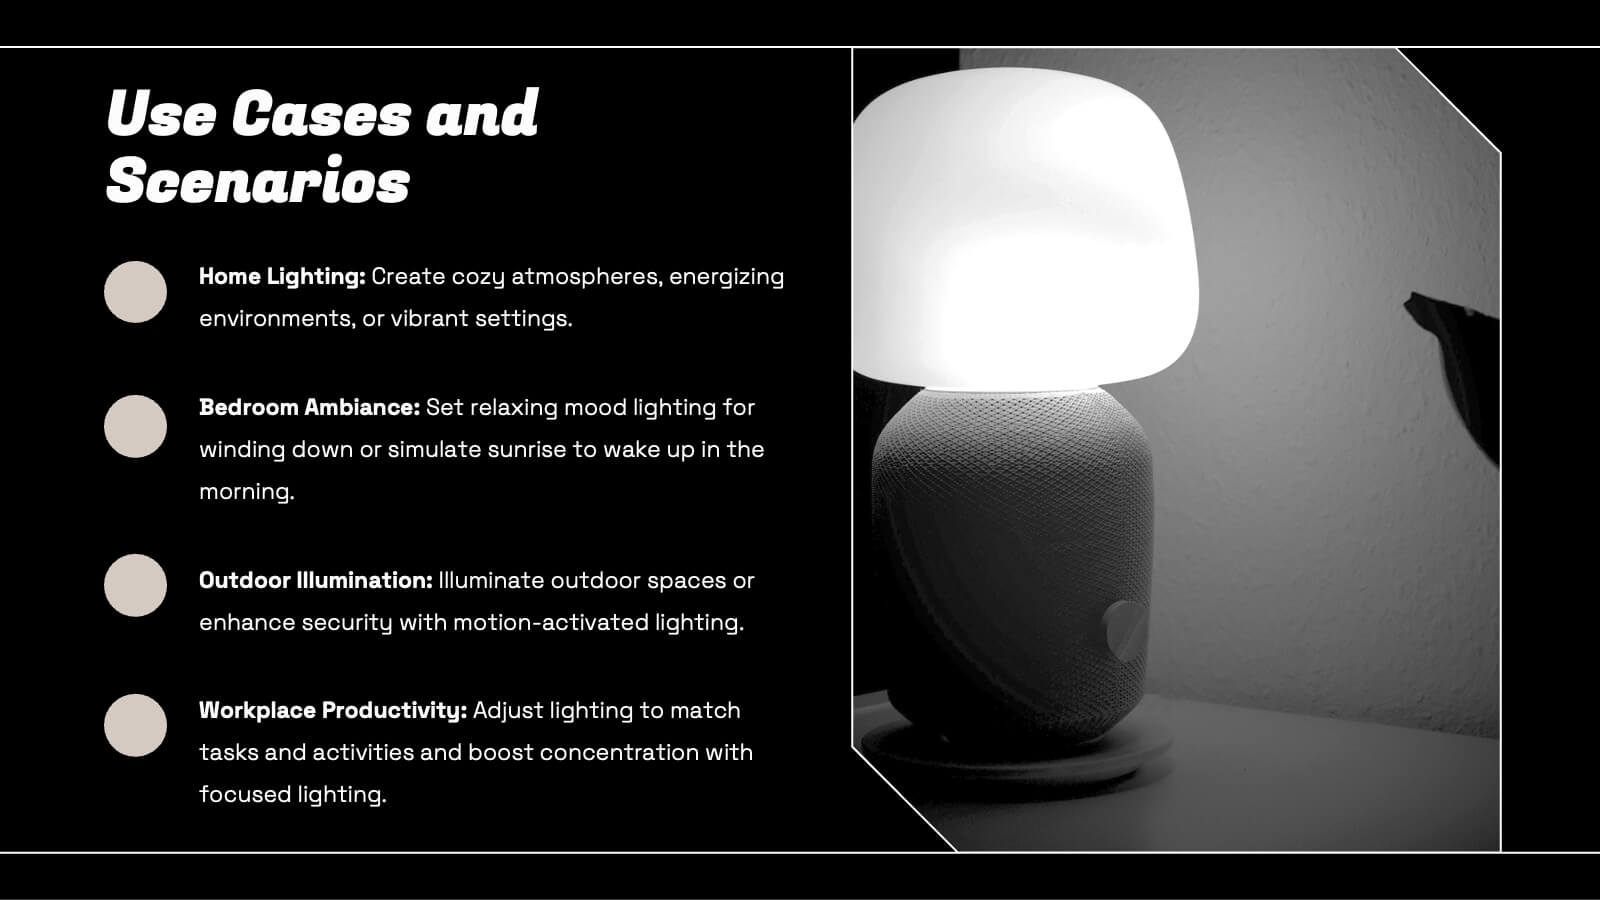
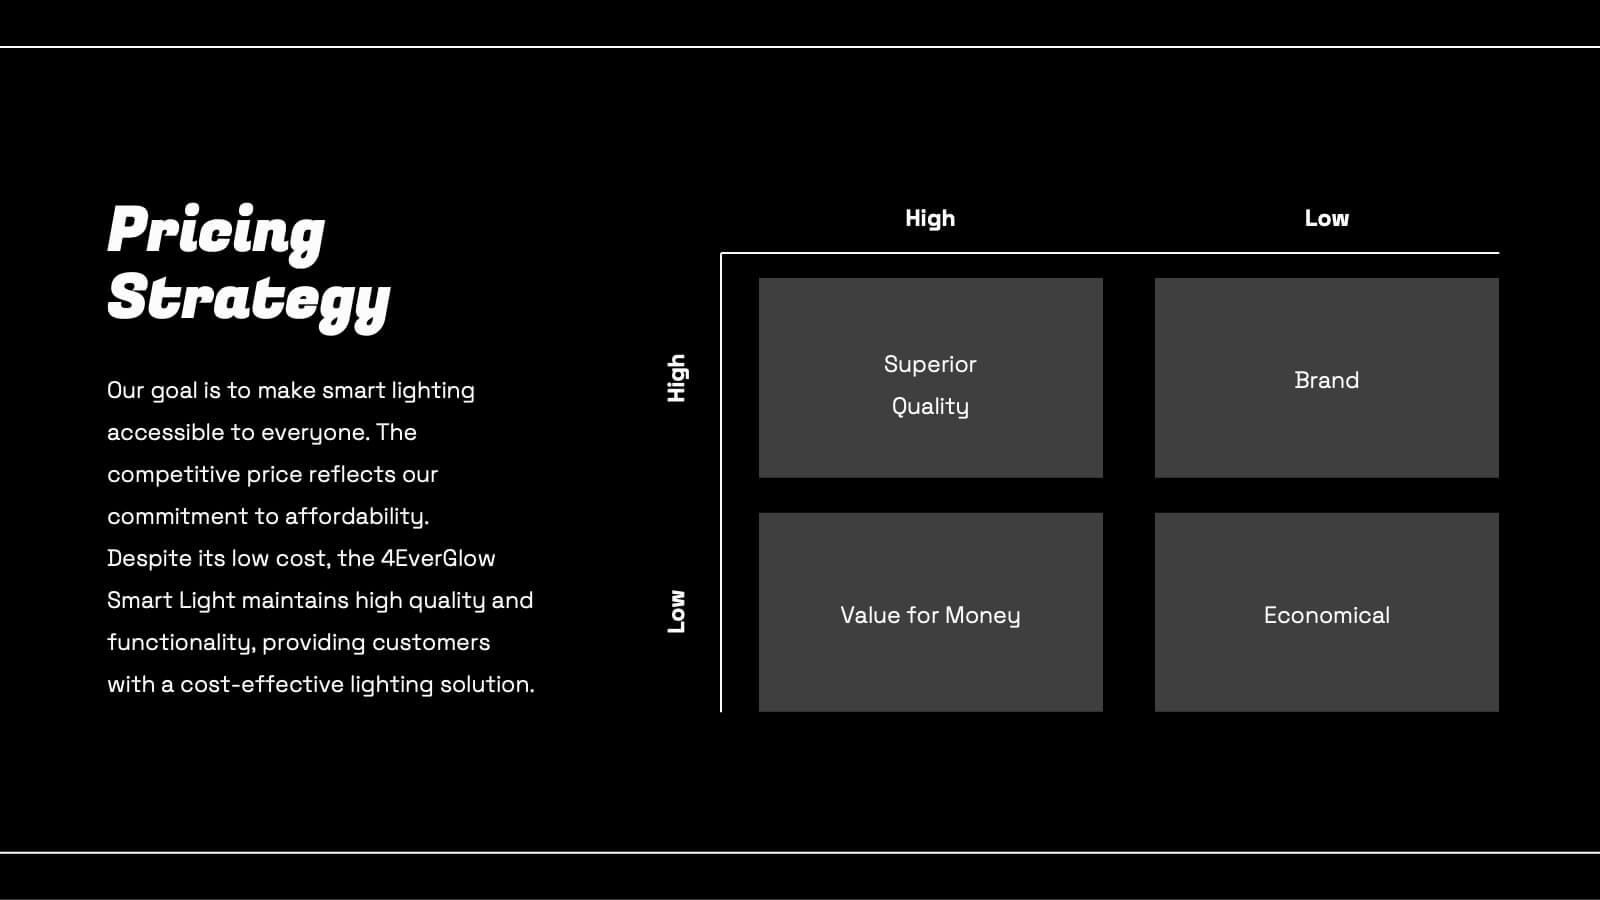
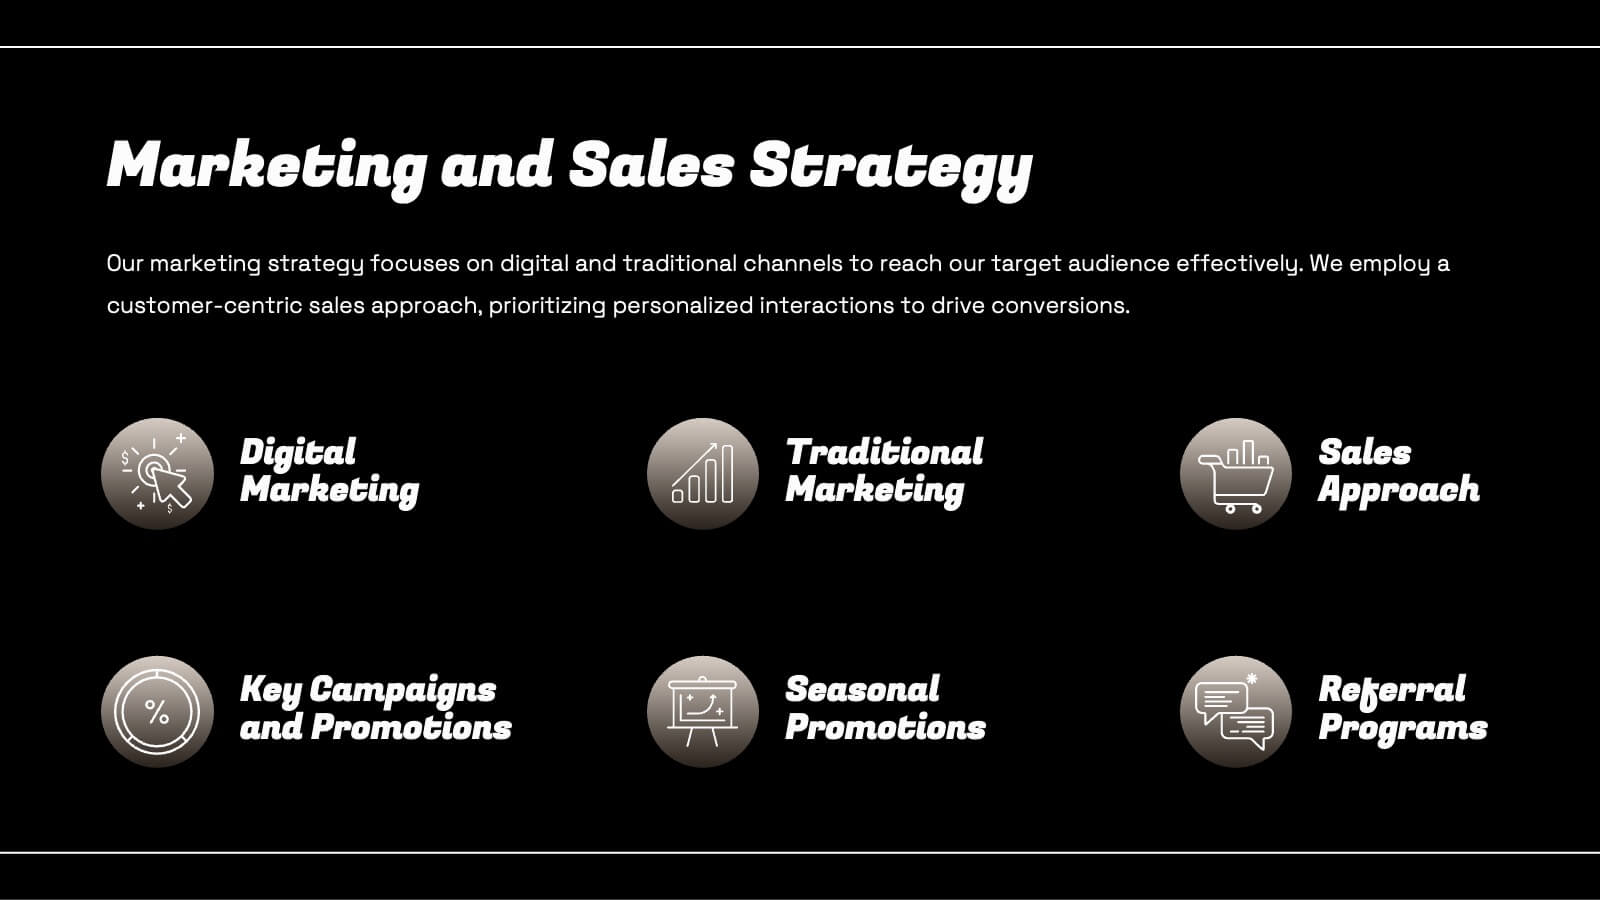
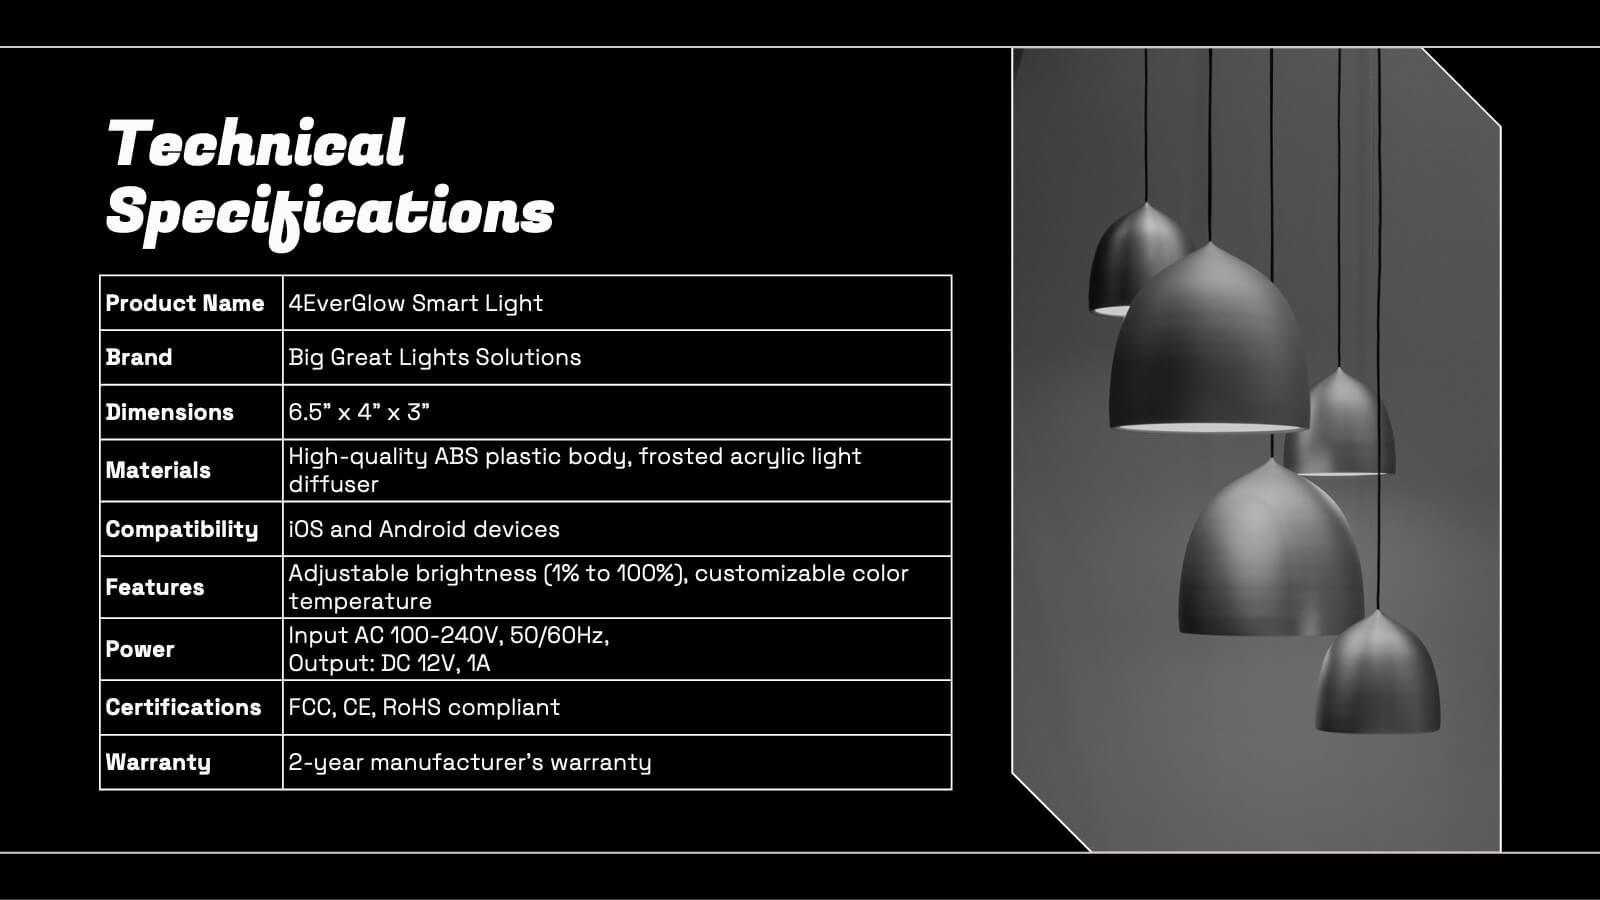
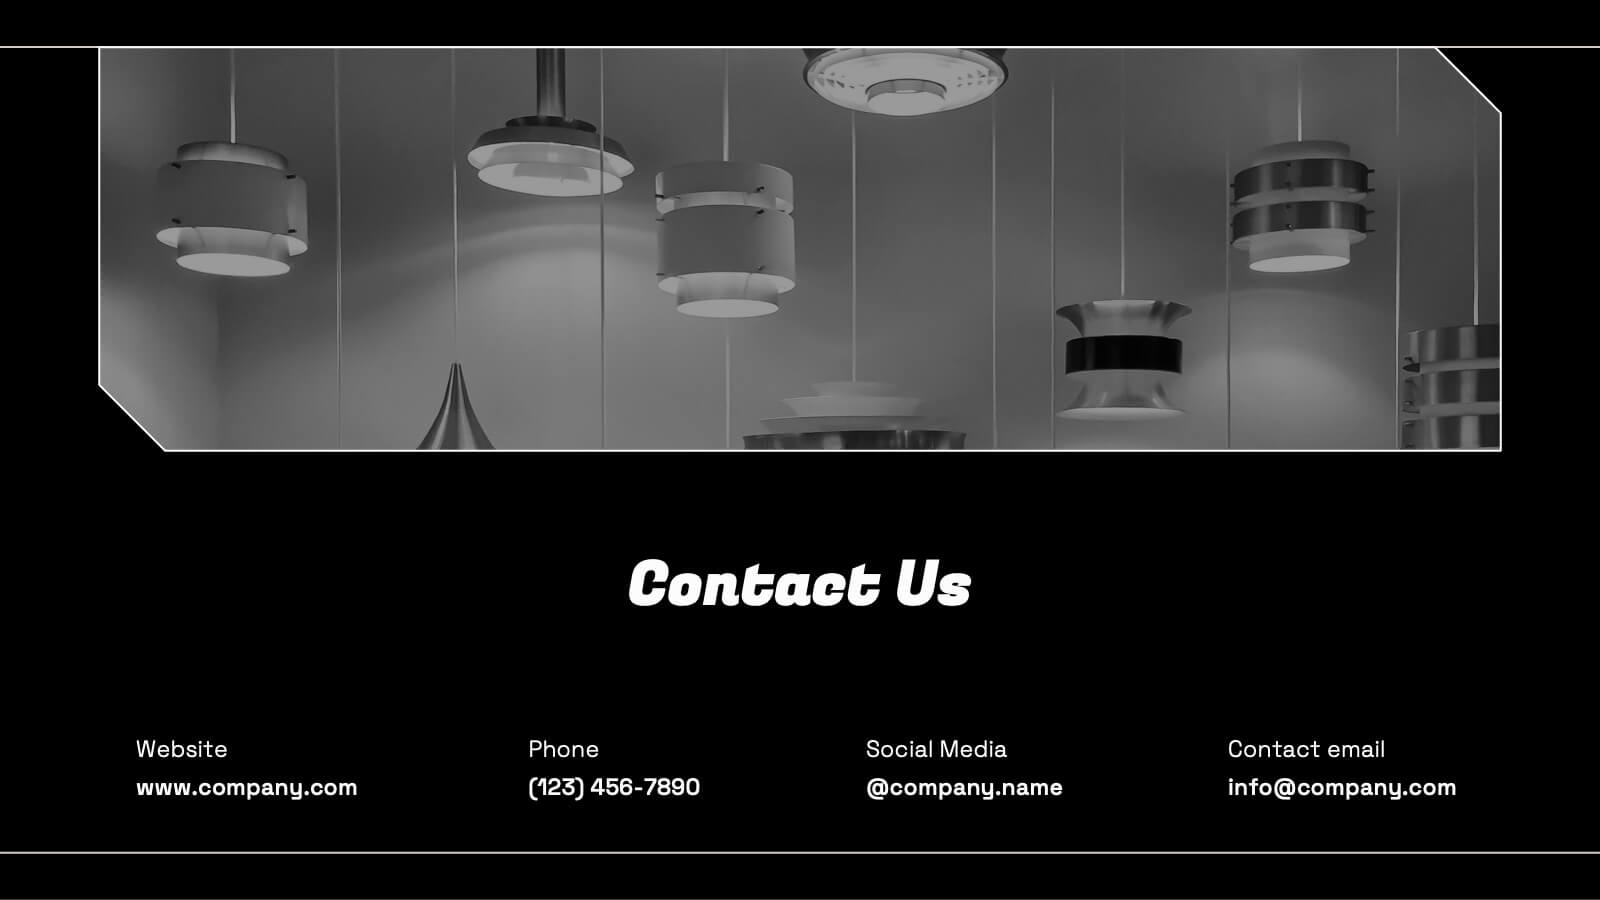
Smart Light Product Presentation
Enhance your product presentations with this Smart Lighting template. Designed for clarity and aesthetic appeal, it includes slides detailing product features, market analysis, technical specifications, and pricing strategies. Ideal for tech products, it's compatible with PowerPoint, Keynote, and Google Slides, ensuring broad accessibility and ease of use.


22 diapositivas
Aurorafrost Project Timeline Presentation
A sleek timeline-focused presentation template that showcases project overviews, objectives, deliverables, and milestones. Perfect for tracking budgets, resource allocation, stakeholder analysis, and quality assurance plans. Includes modern layouts for seamless planning and execution. Fully editable for a range of industries, compatible with PowerPoint, Keynote, and Google Slides for polished results.


5 diapositivas
Future of 5G Technology Infographics
Embrace the telecommunications revolution with the future of 5G technology infographics template. This vibrant, creatively styled vertical layout is designed to captivate and educate, making it an ideal companion for tech enthusiasts and educators alike. The template, adorned in a dynamic spectrum of purple, orange, blue, and green, simplifies the complex narrative of 5G evolution. Compatible with Powerpoint, Keynote, and Google Slides. It features intuitive graphics, engaging icons, and image placeholders, all to highlight 5G's possibilities and its impact on global connectivity. It's the perfect medium for illustrating the sophisticated architecture.


8 diapositivas
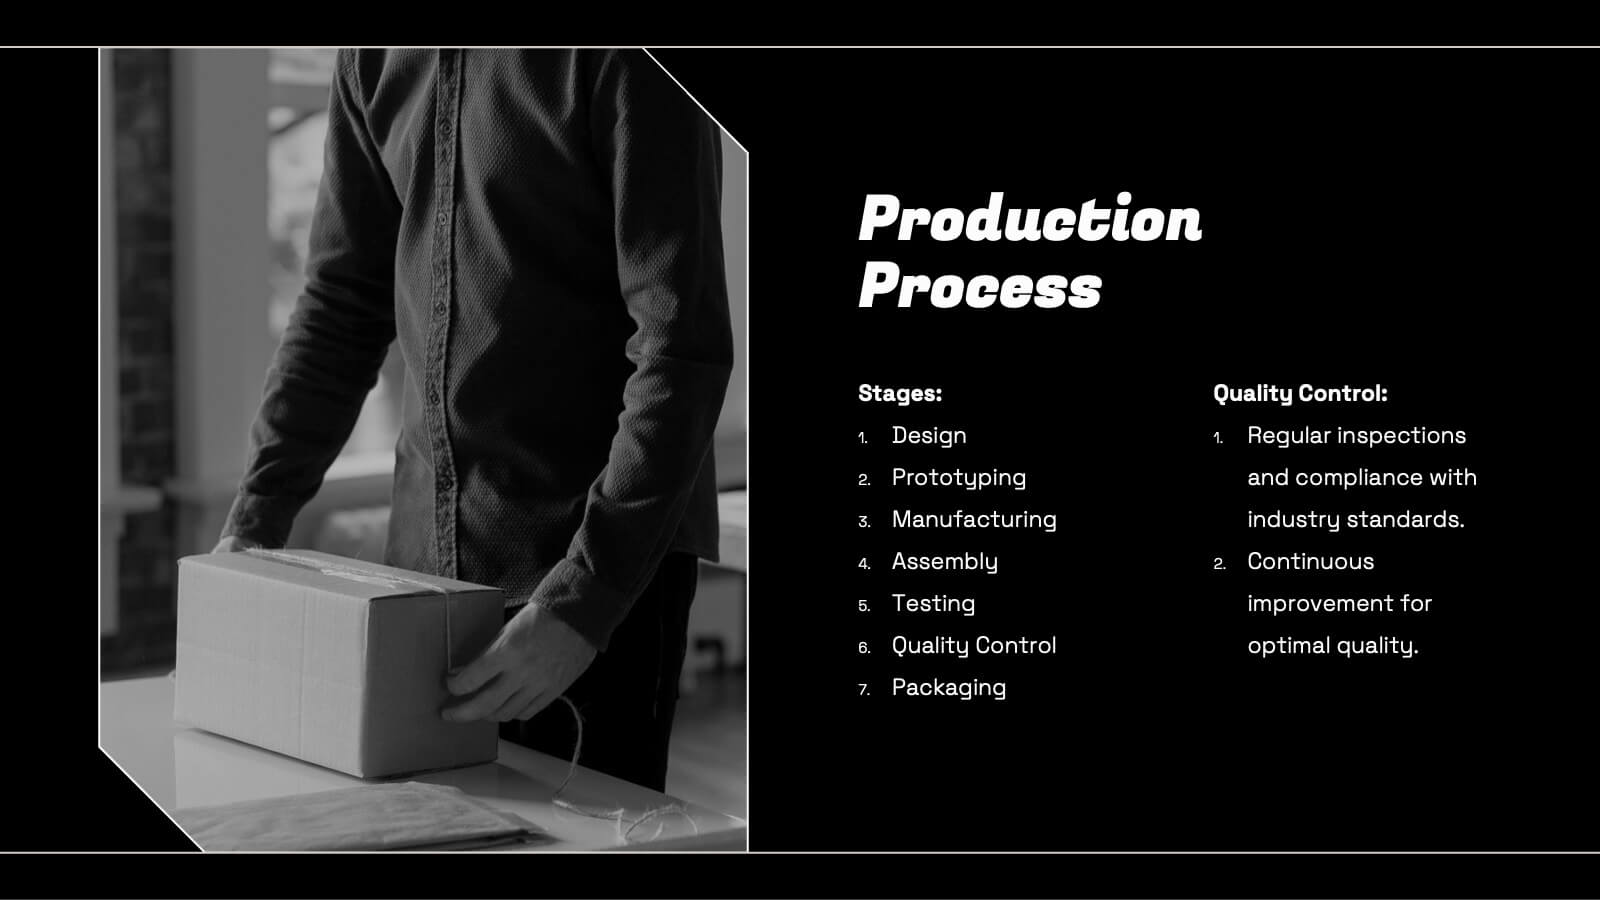
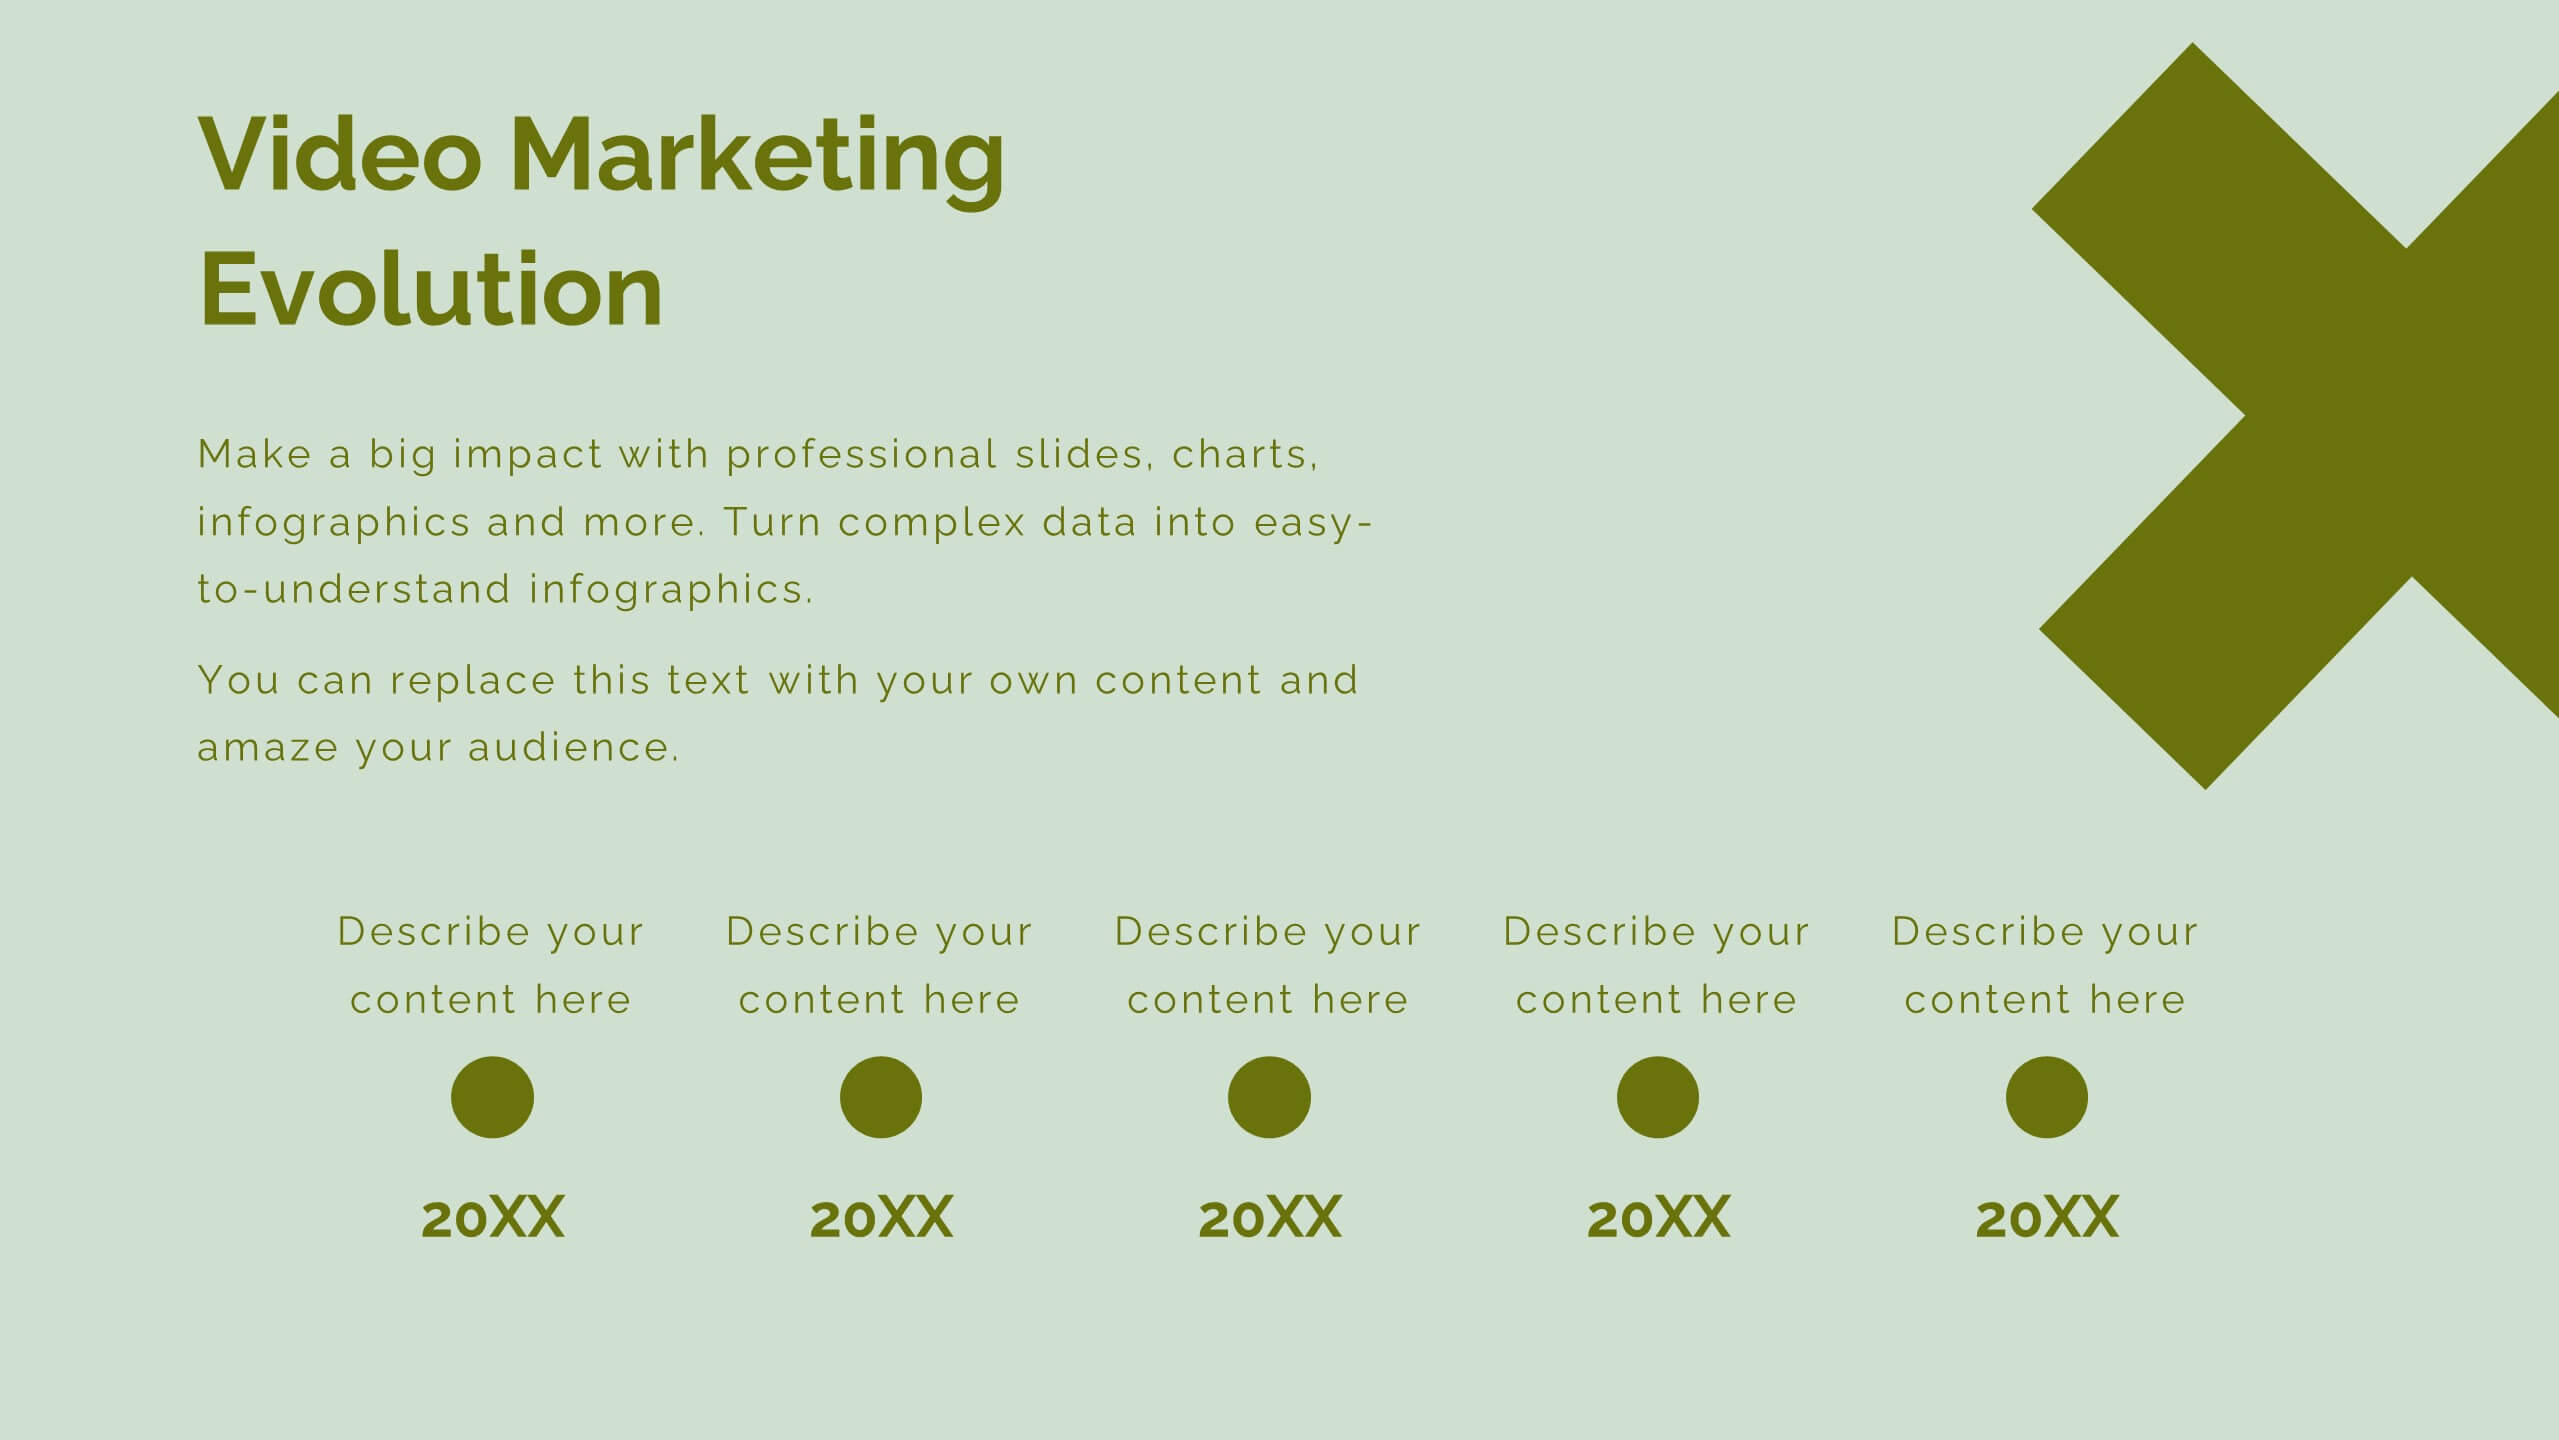
7-Step Business Process Presentation
Streamline your workflow with this 7-Step Business Process template. Perfect for illustrating step-by-step strategies, milestones, and project phases. Easily customizable with editable colors, icons, and text to fit your brand. Enhance presentations with a professional, clean layout. Compatible with PowerPoint, Keynote, and Google Slides for seamless integration.


5 diapositivas
Food Waste in School Infographics
Food Waste in schools is a significant issue that can have economic, environmental, and social impacts. These vertical infographics aim to raise awareness about the magnitude of the problem and provide actionable steps to reduce food waste in schools. These can be used as valuable tools to highlight the issue of food waste in school environments. The visually appealing illustrations, informative content, and color schemes make it effective for raising awareness and promoting sustainable practices in school environments. Compatible with Powerpoint, Keynote, and Google Slides.


4 diapositivas
Three-Part Triangle Model Presentation
Show the perfect balance between three core ideas with this dynamic triangular layout. Designed for clarity and structure, it’s ideal for visualizing strategies, models, or relationships in a professional way. Fully editable and compatible with PowerPoint, Keynote, and Google Slides for effortless customization and polished results.


7 diapositivas
Customer Empathy Map Infographic Presentation
An Empathy Map infographic is a visual tool used to help understand the needs, wants, and behaviors of a particular customer. This template is a perfect way to gather and organize information about a person's experience and perspective, in order to better understand their motivations and desires. This empathy map infographic consists of a diagram that is divided into four quadrants: what the user thinks and feels, what they hear, what they see, and what they do. In each quadrant, information is gathered about the user's thoughts, feelings, and actions related to a particular product or service.


20 diapositivas
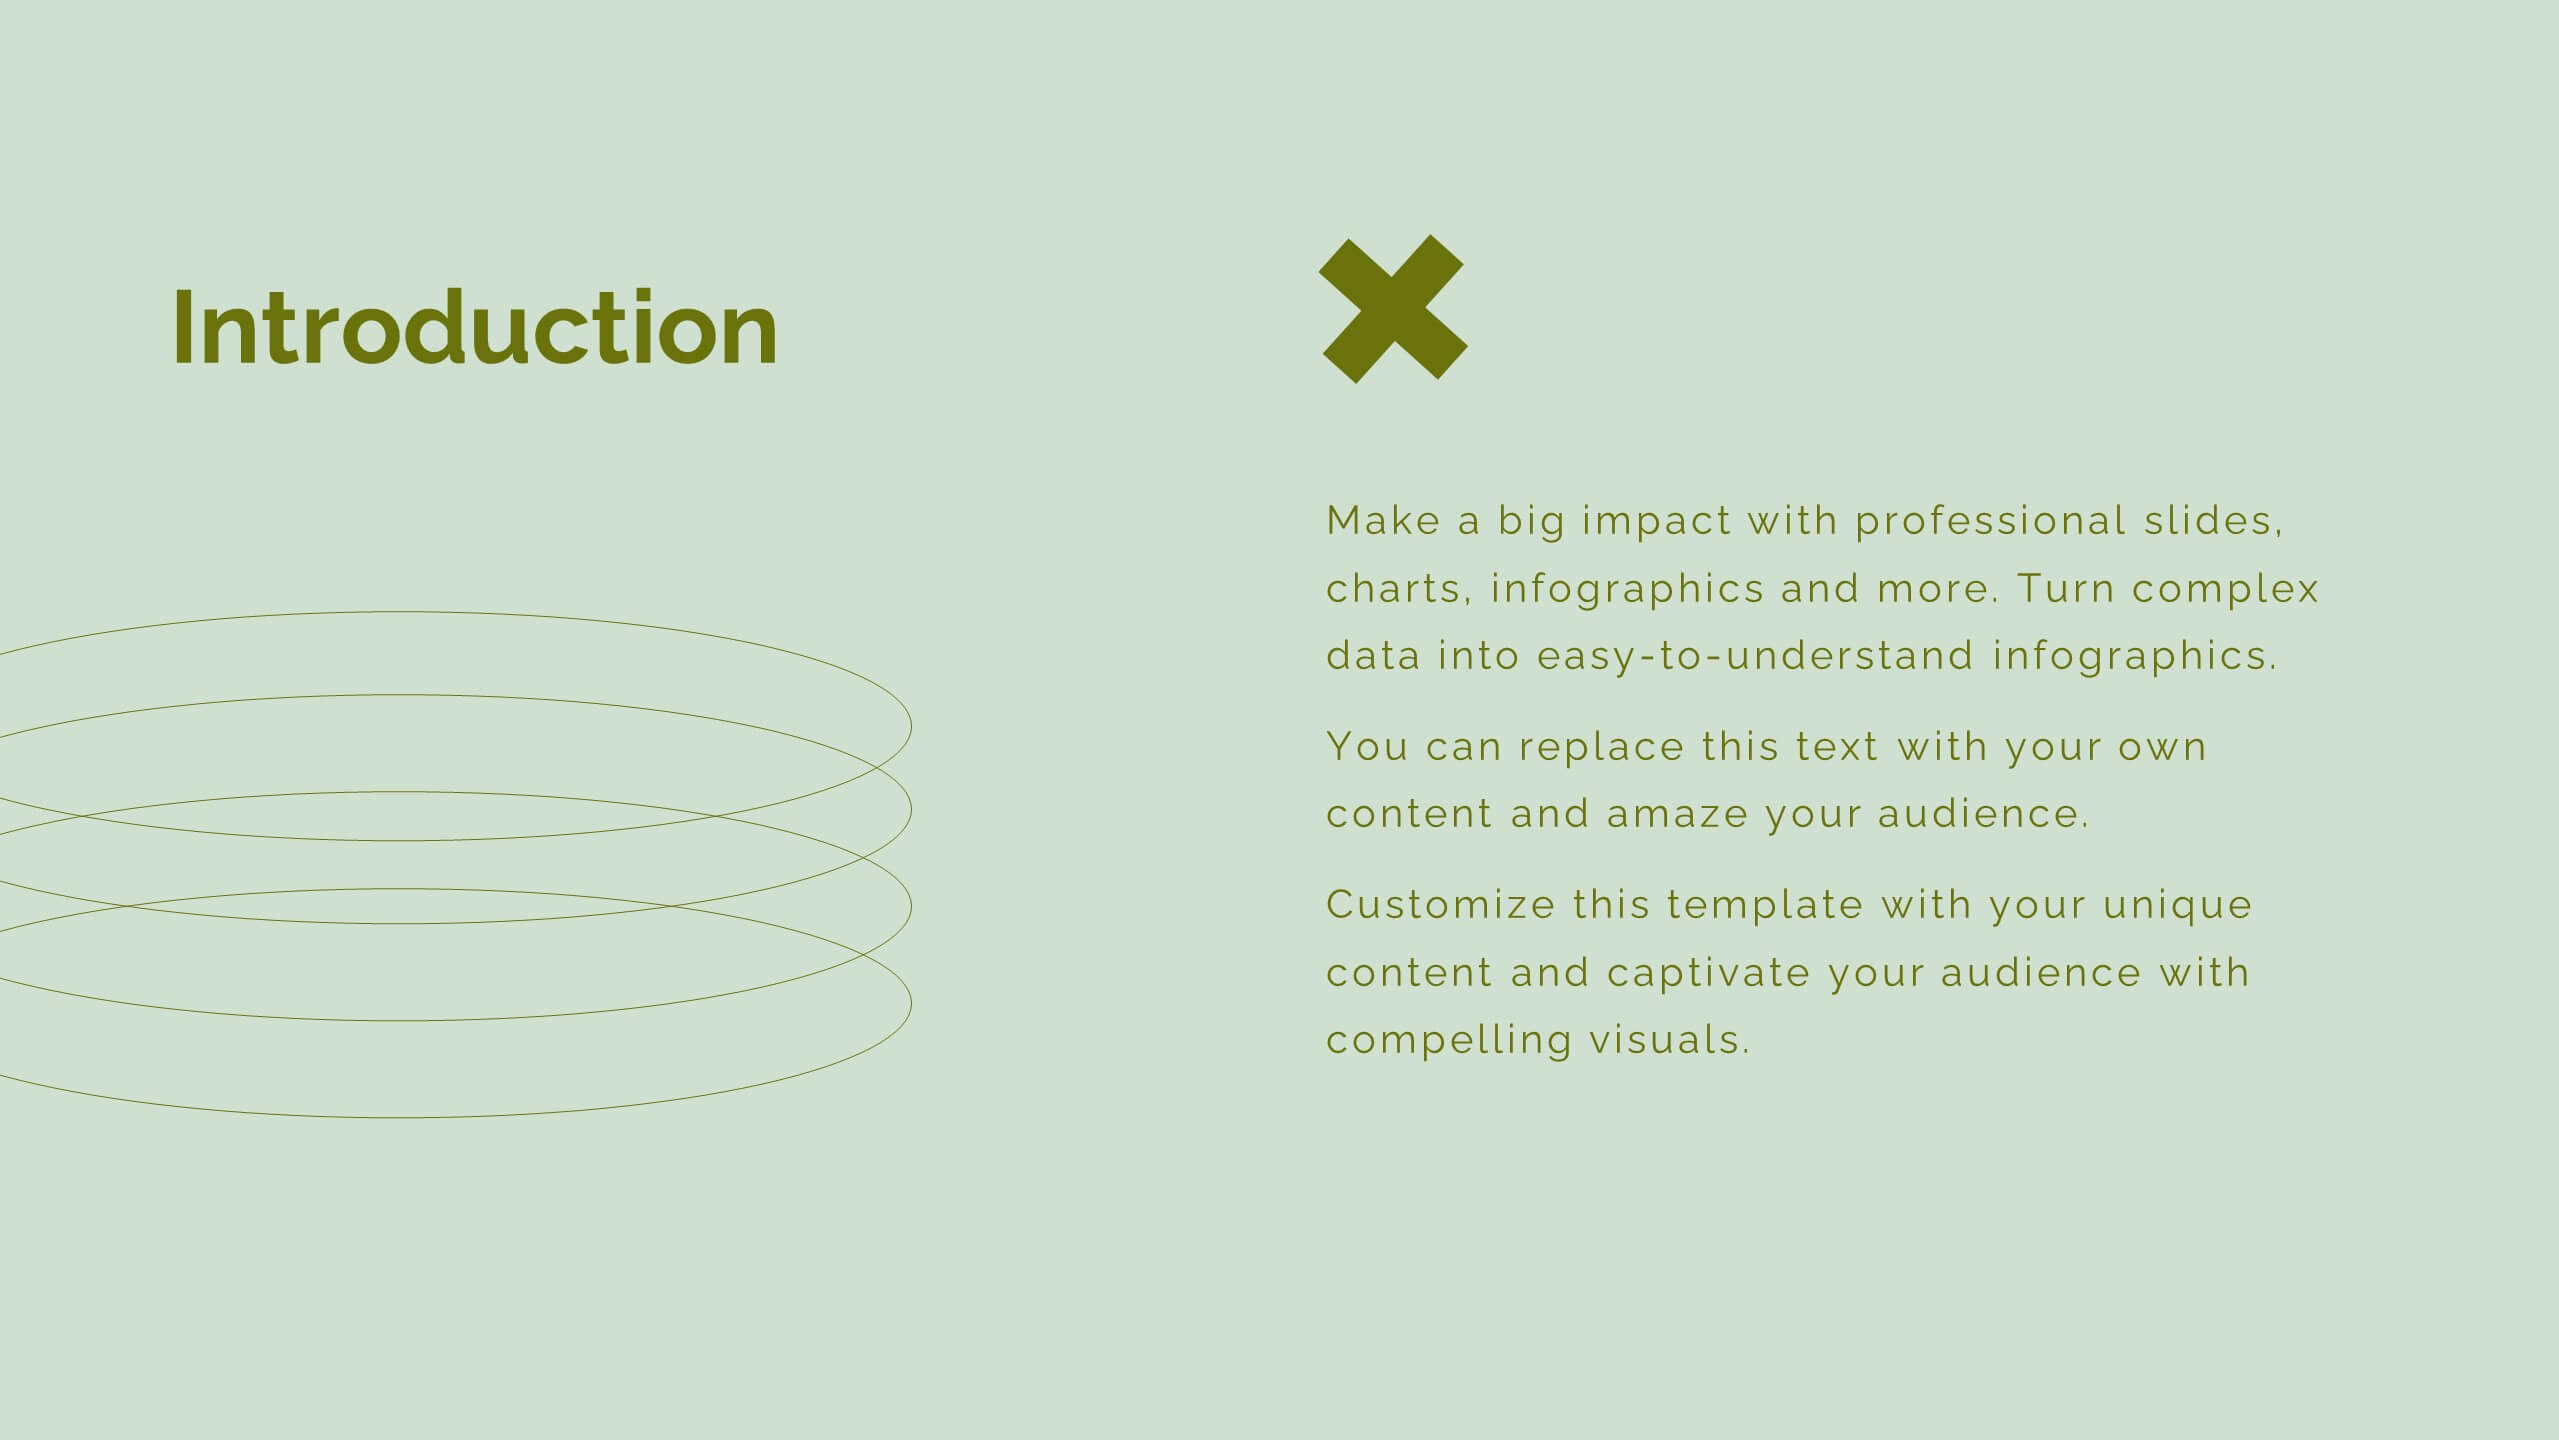
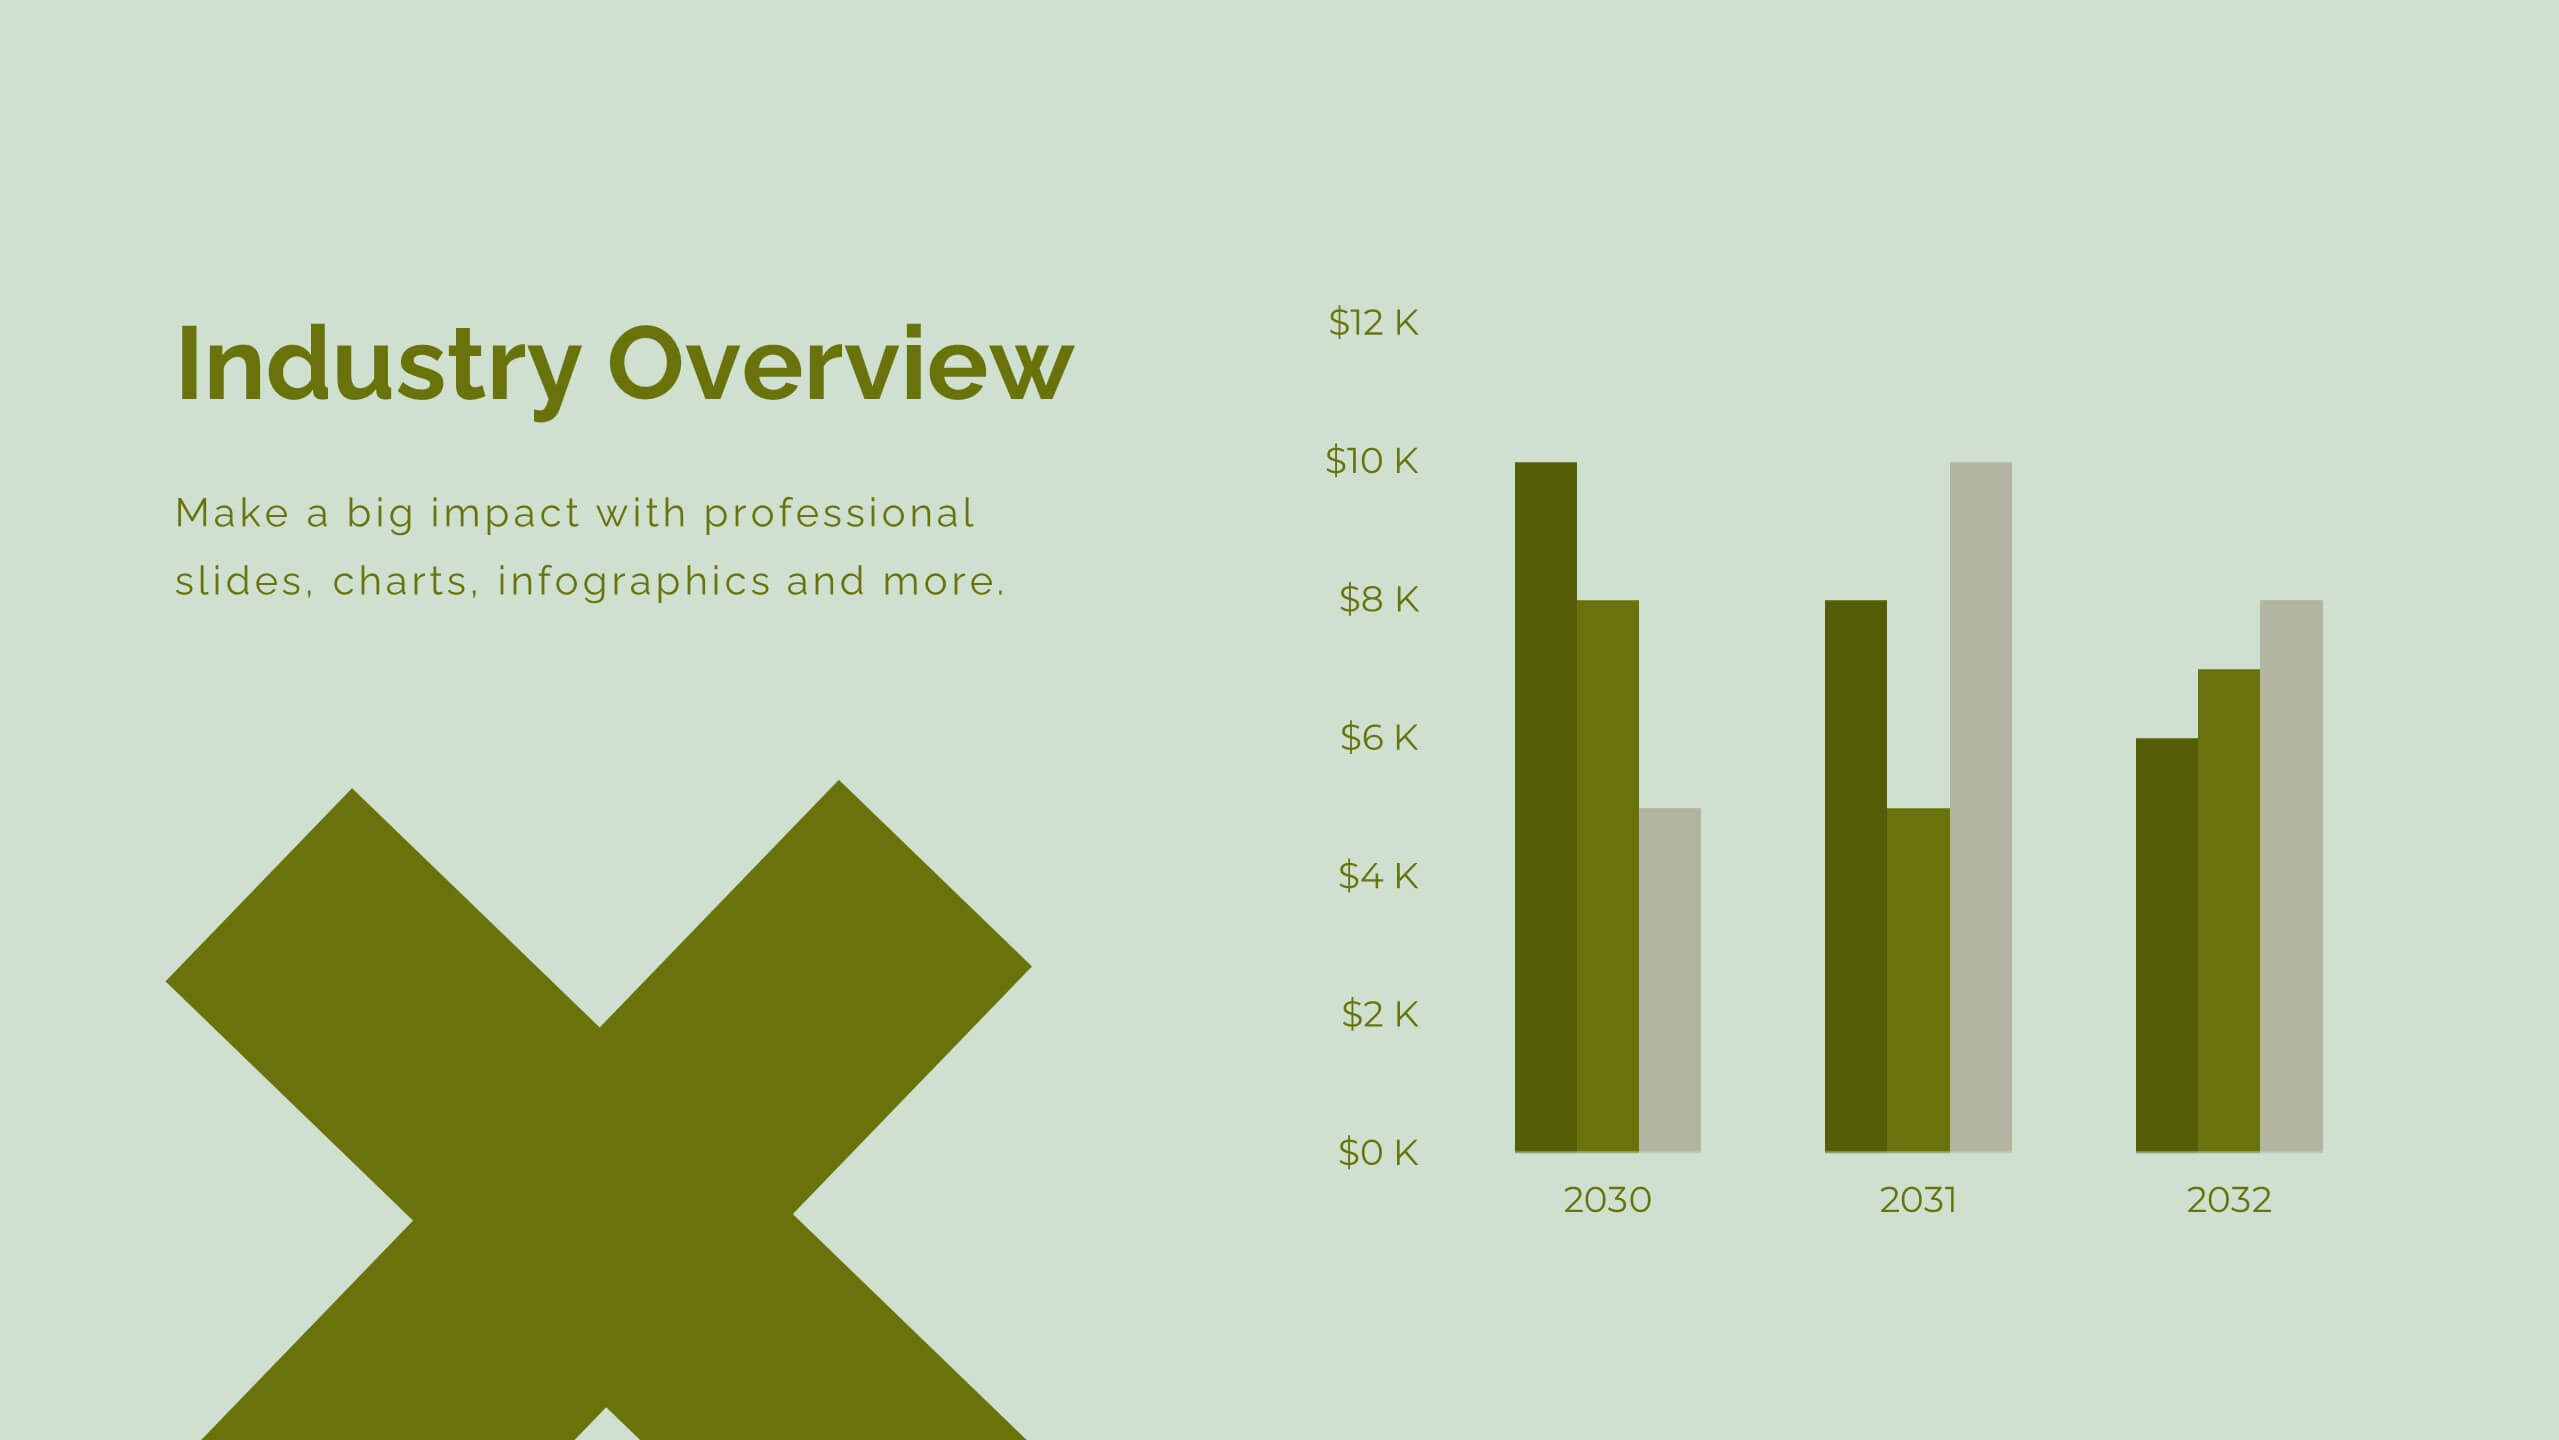
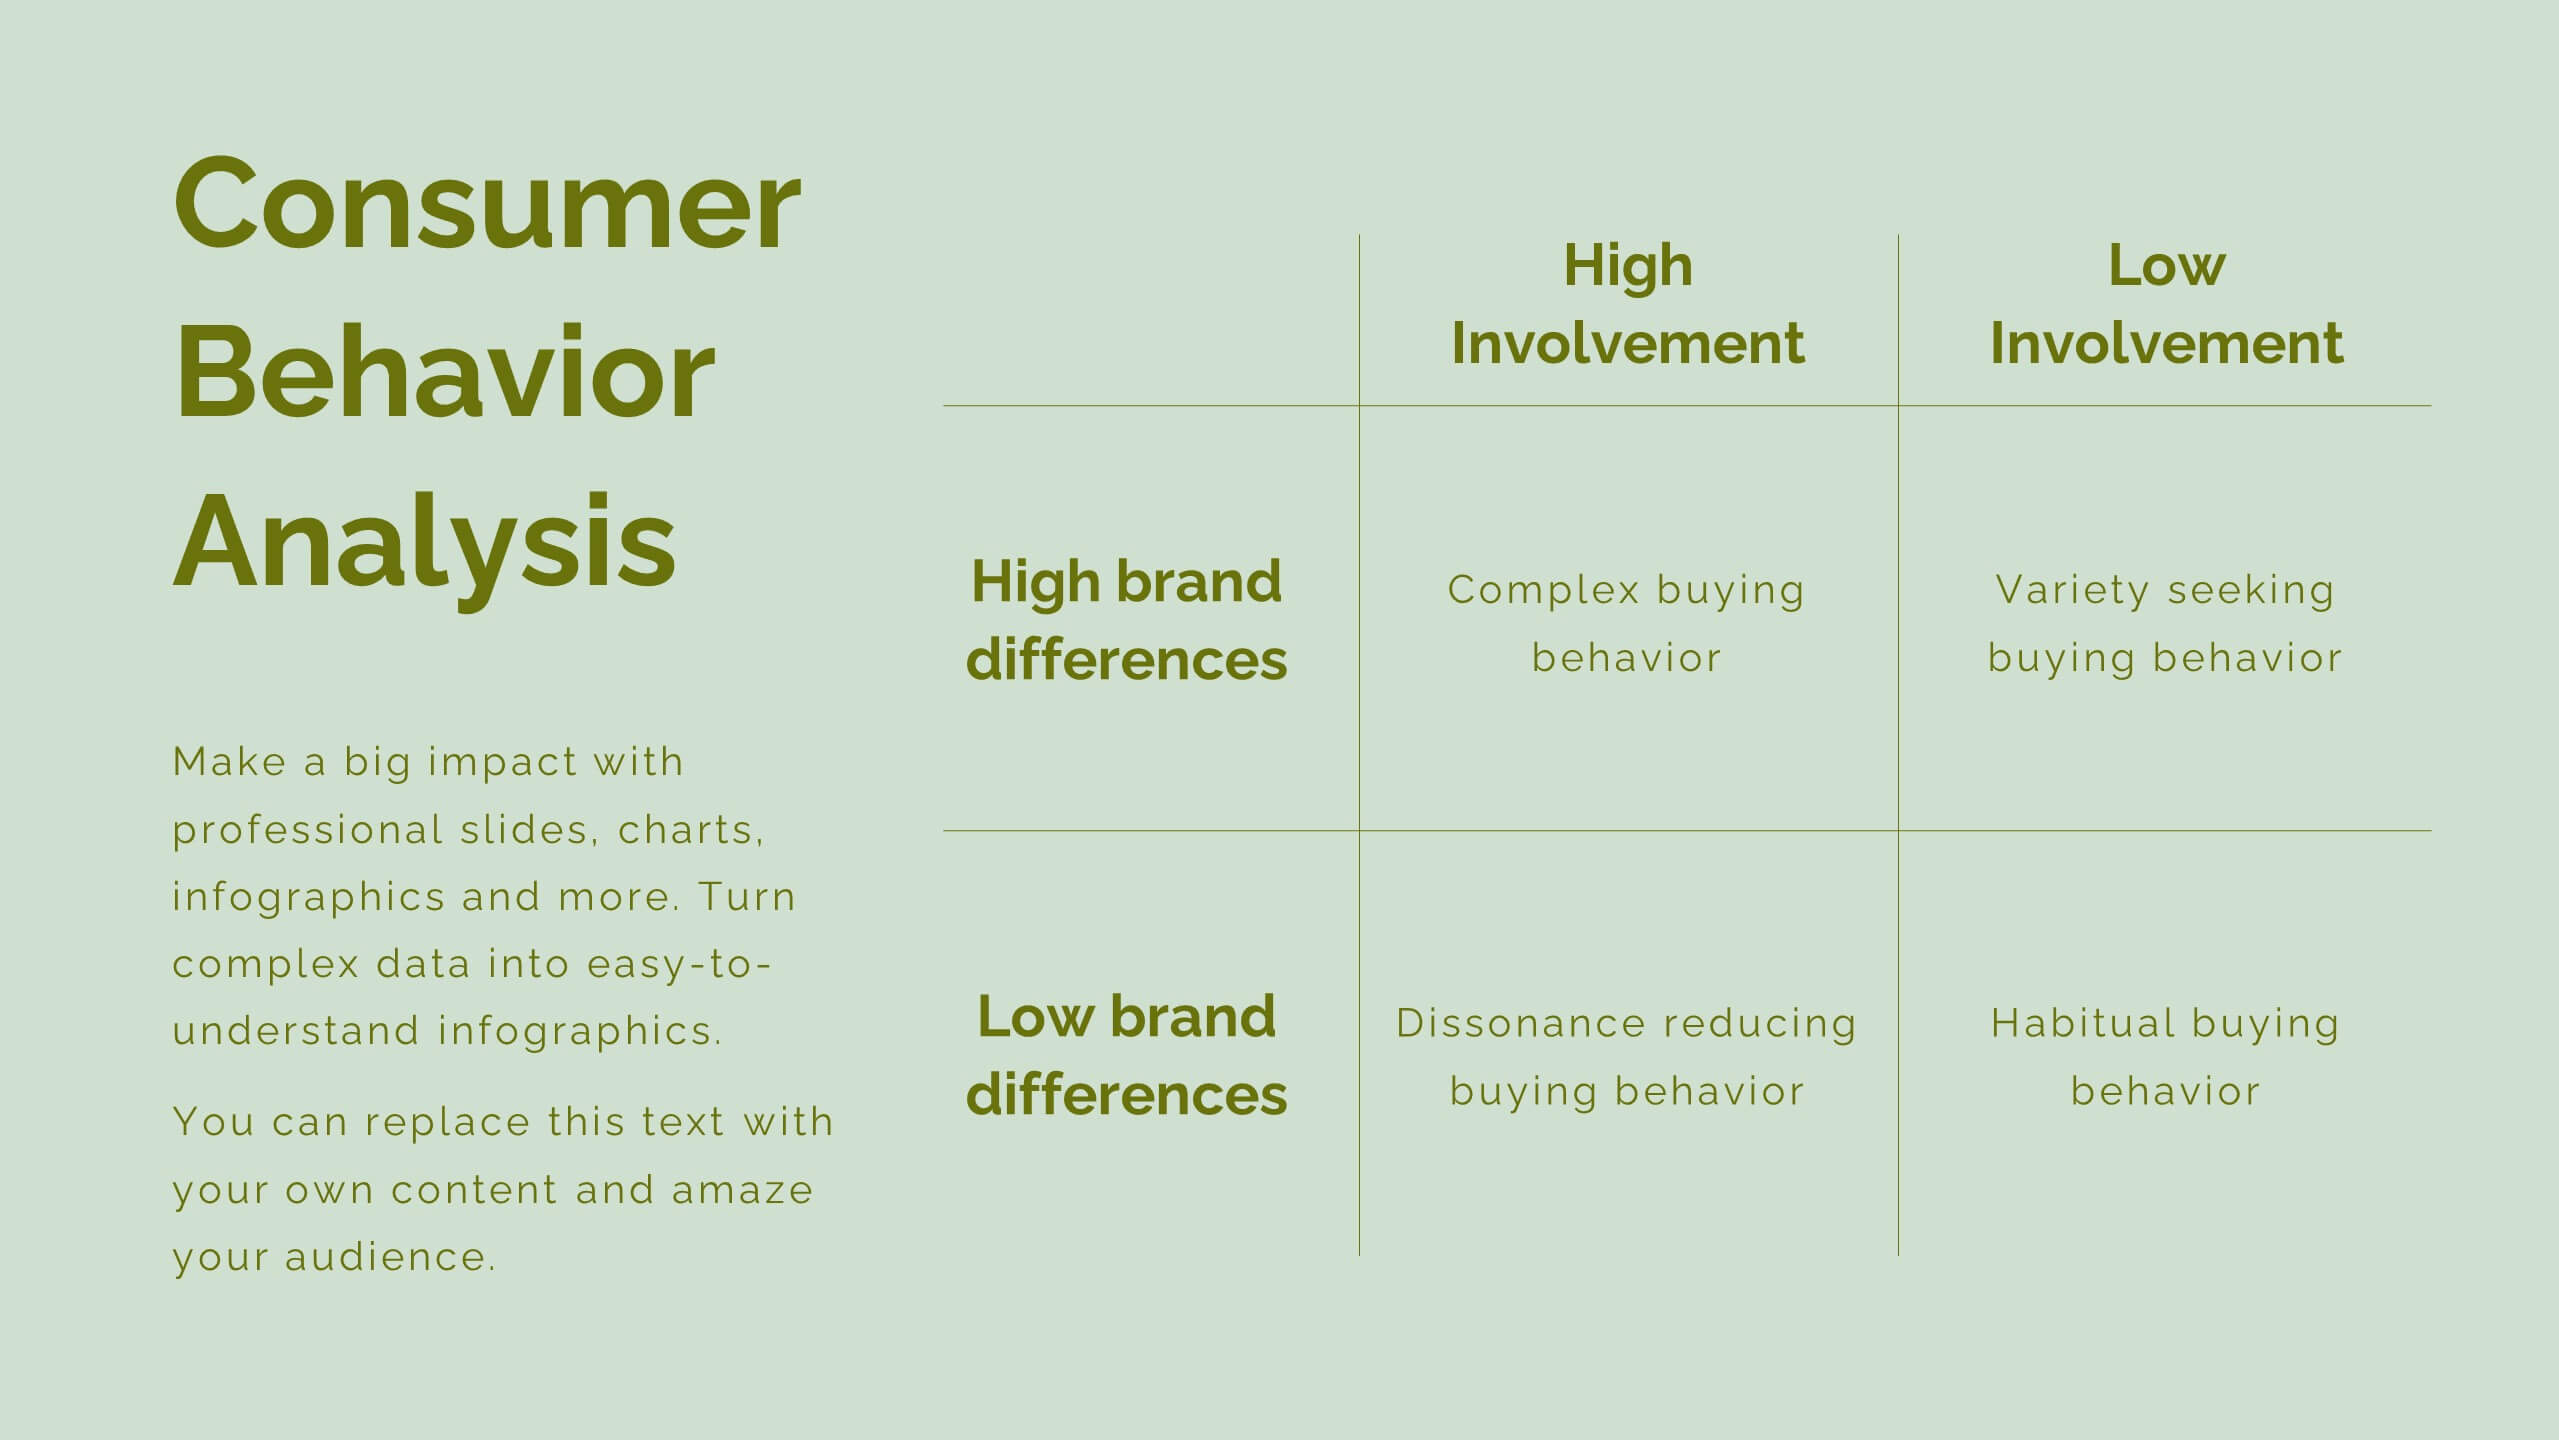
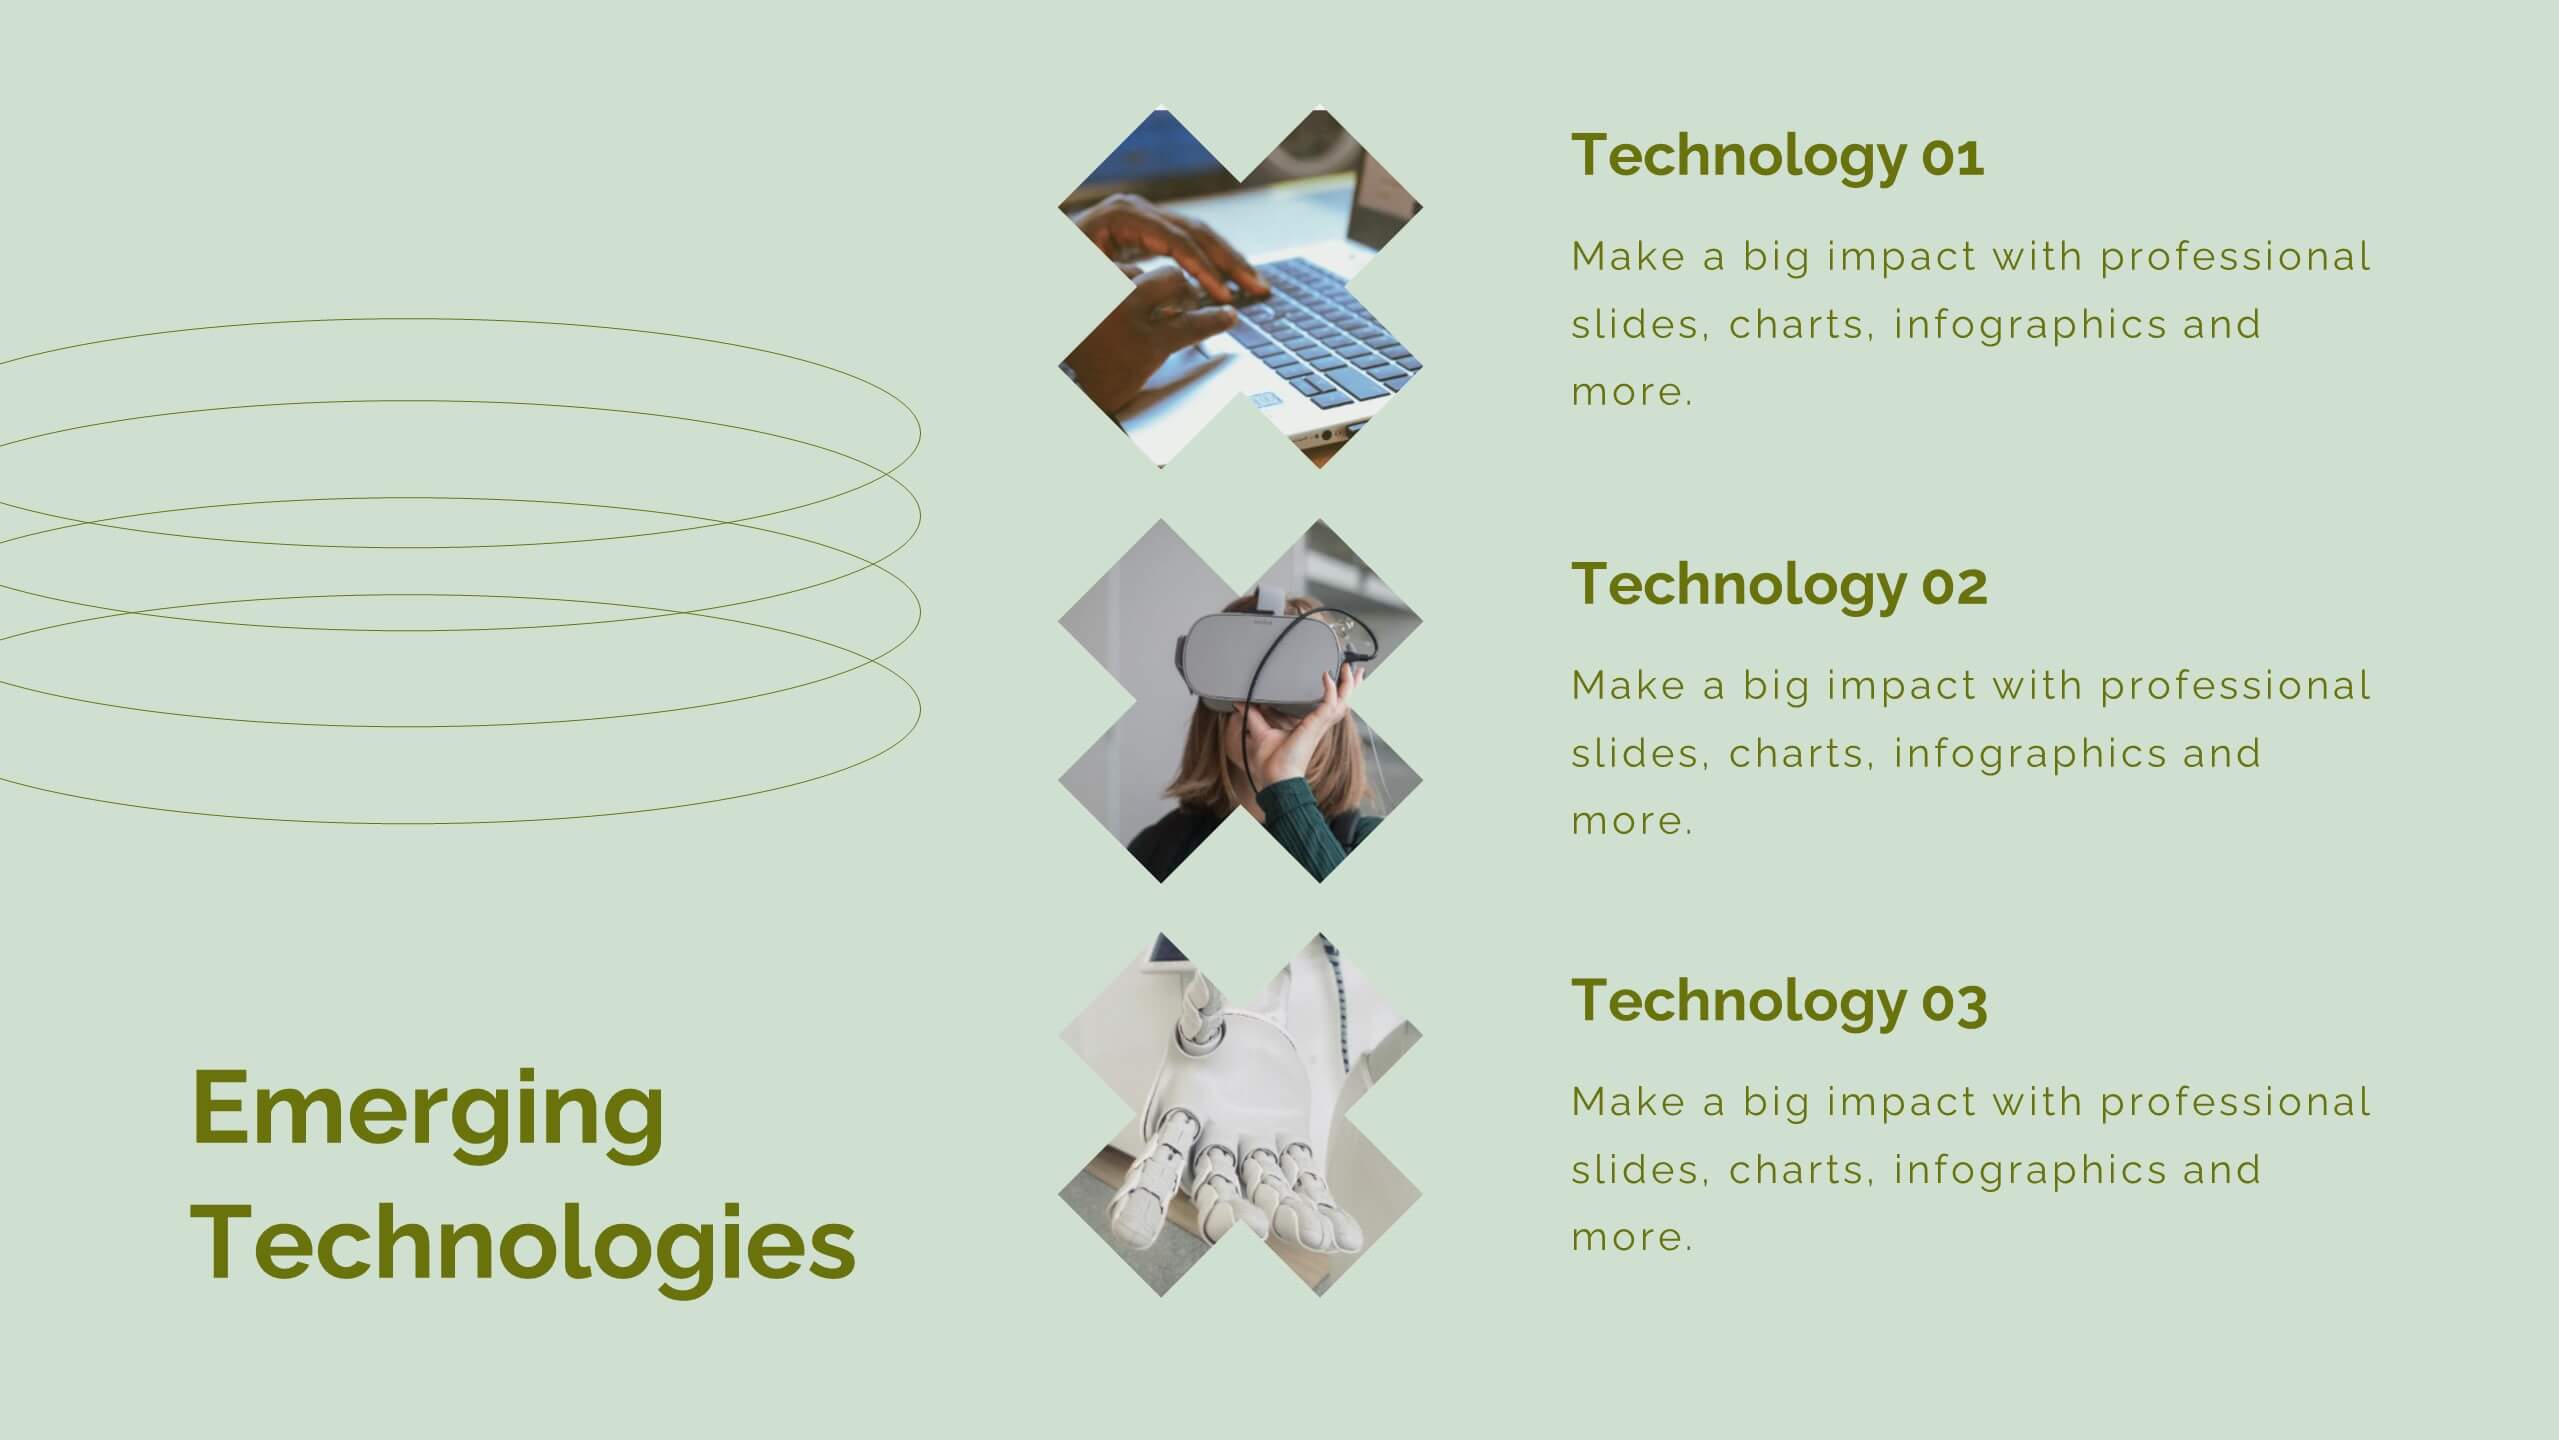
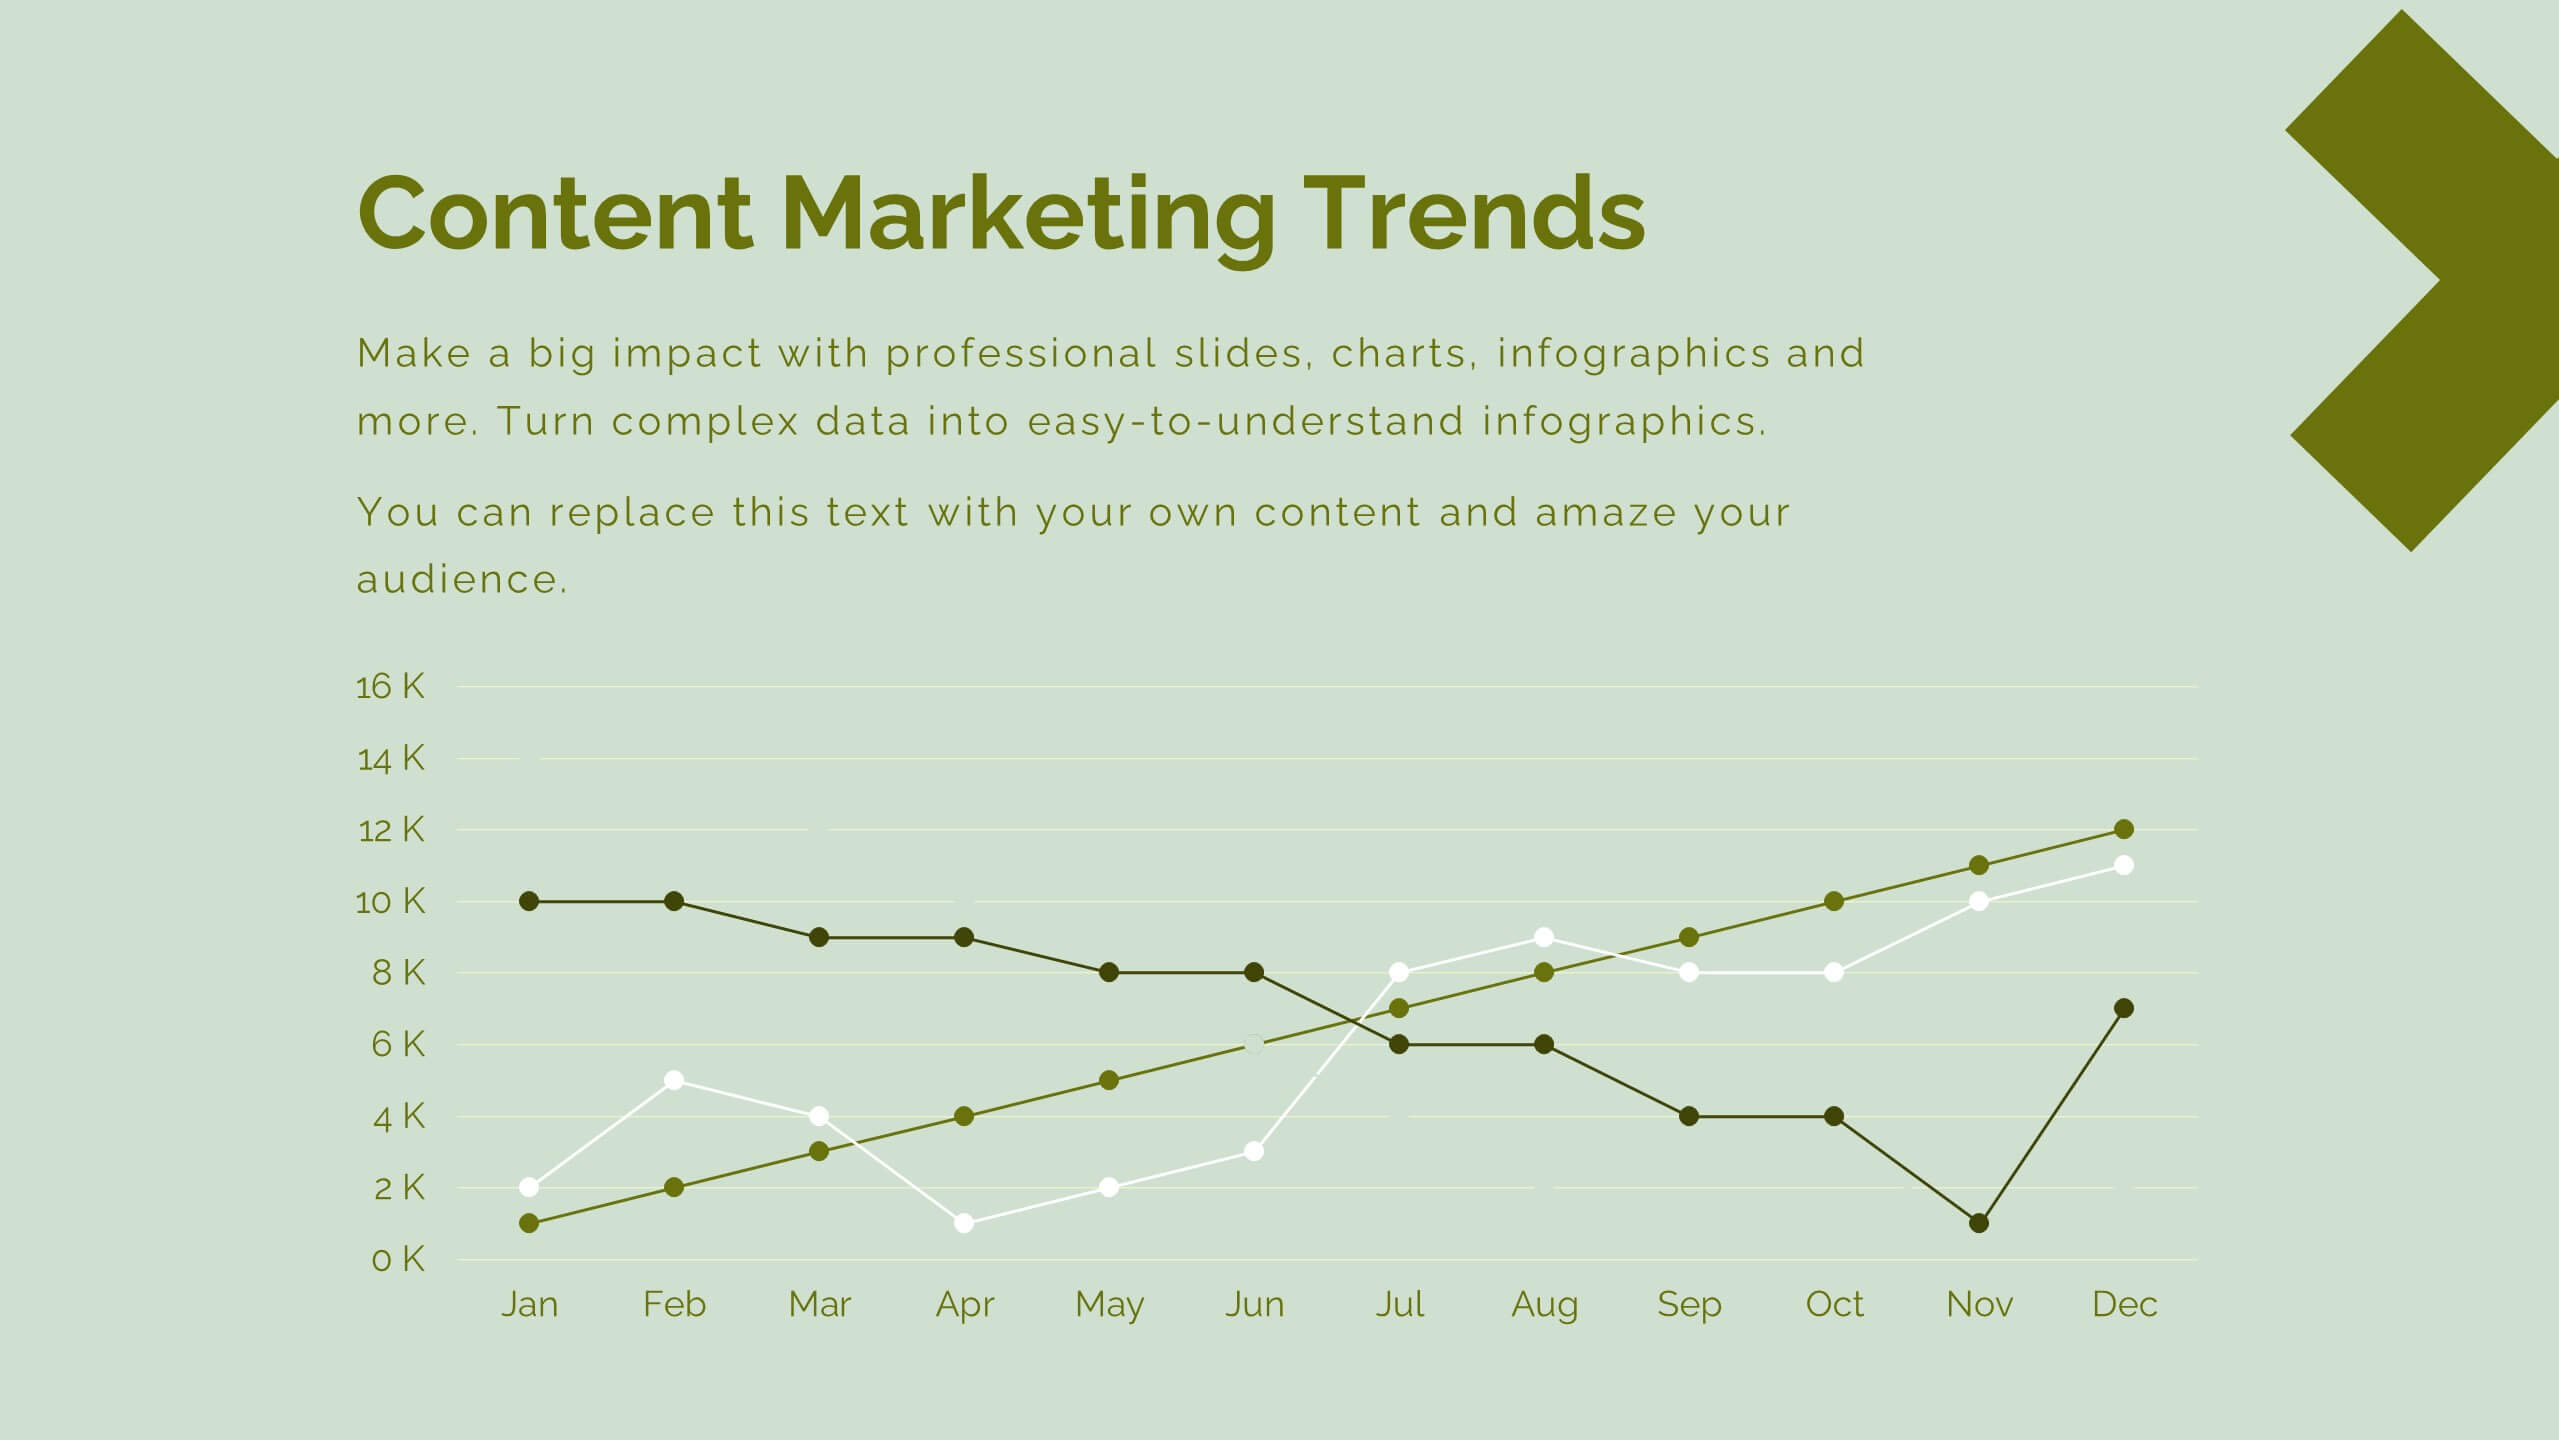
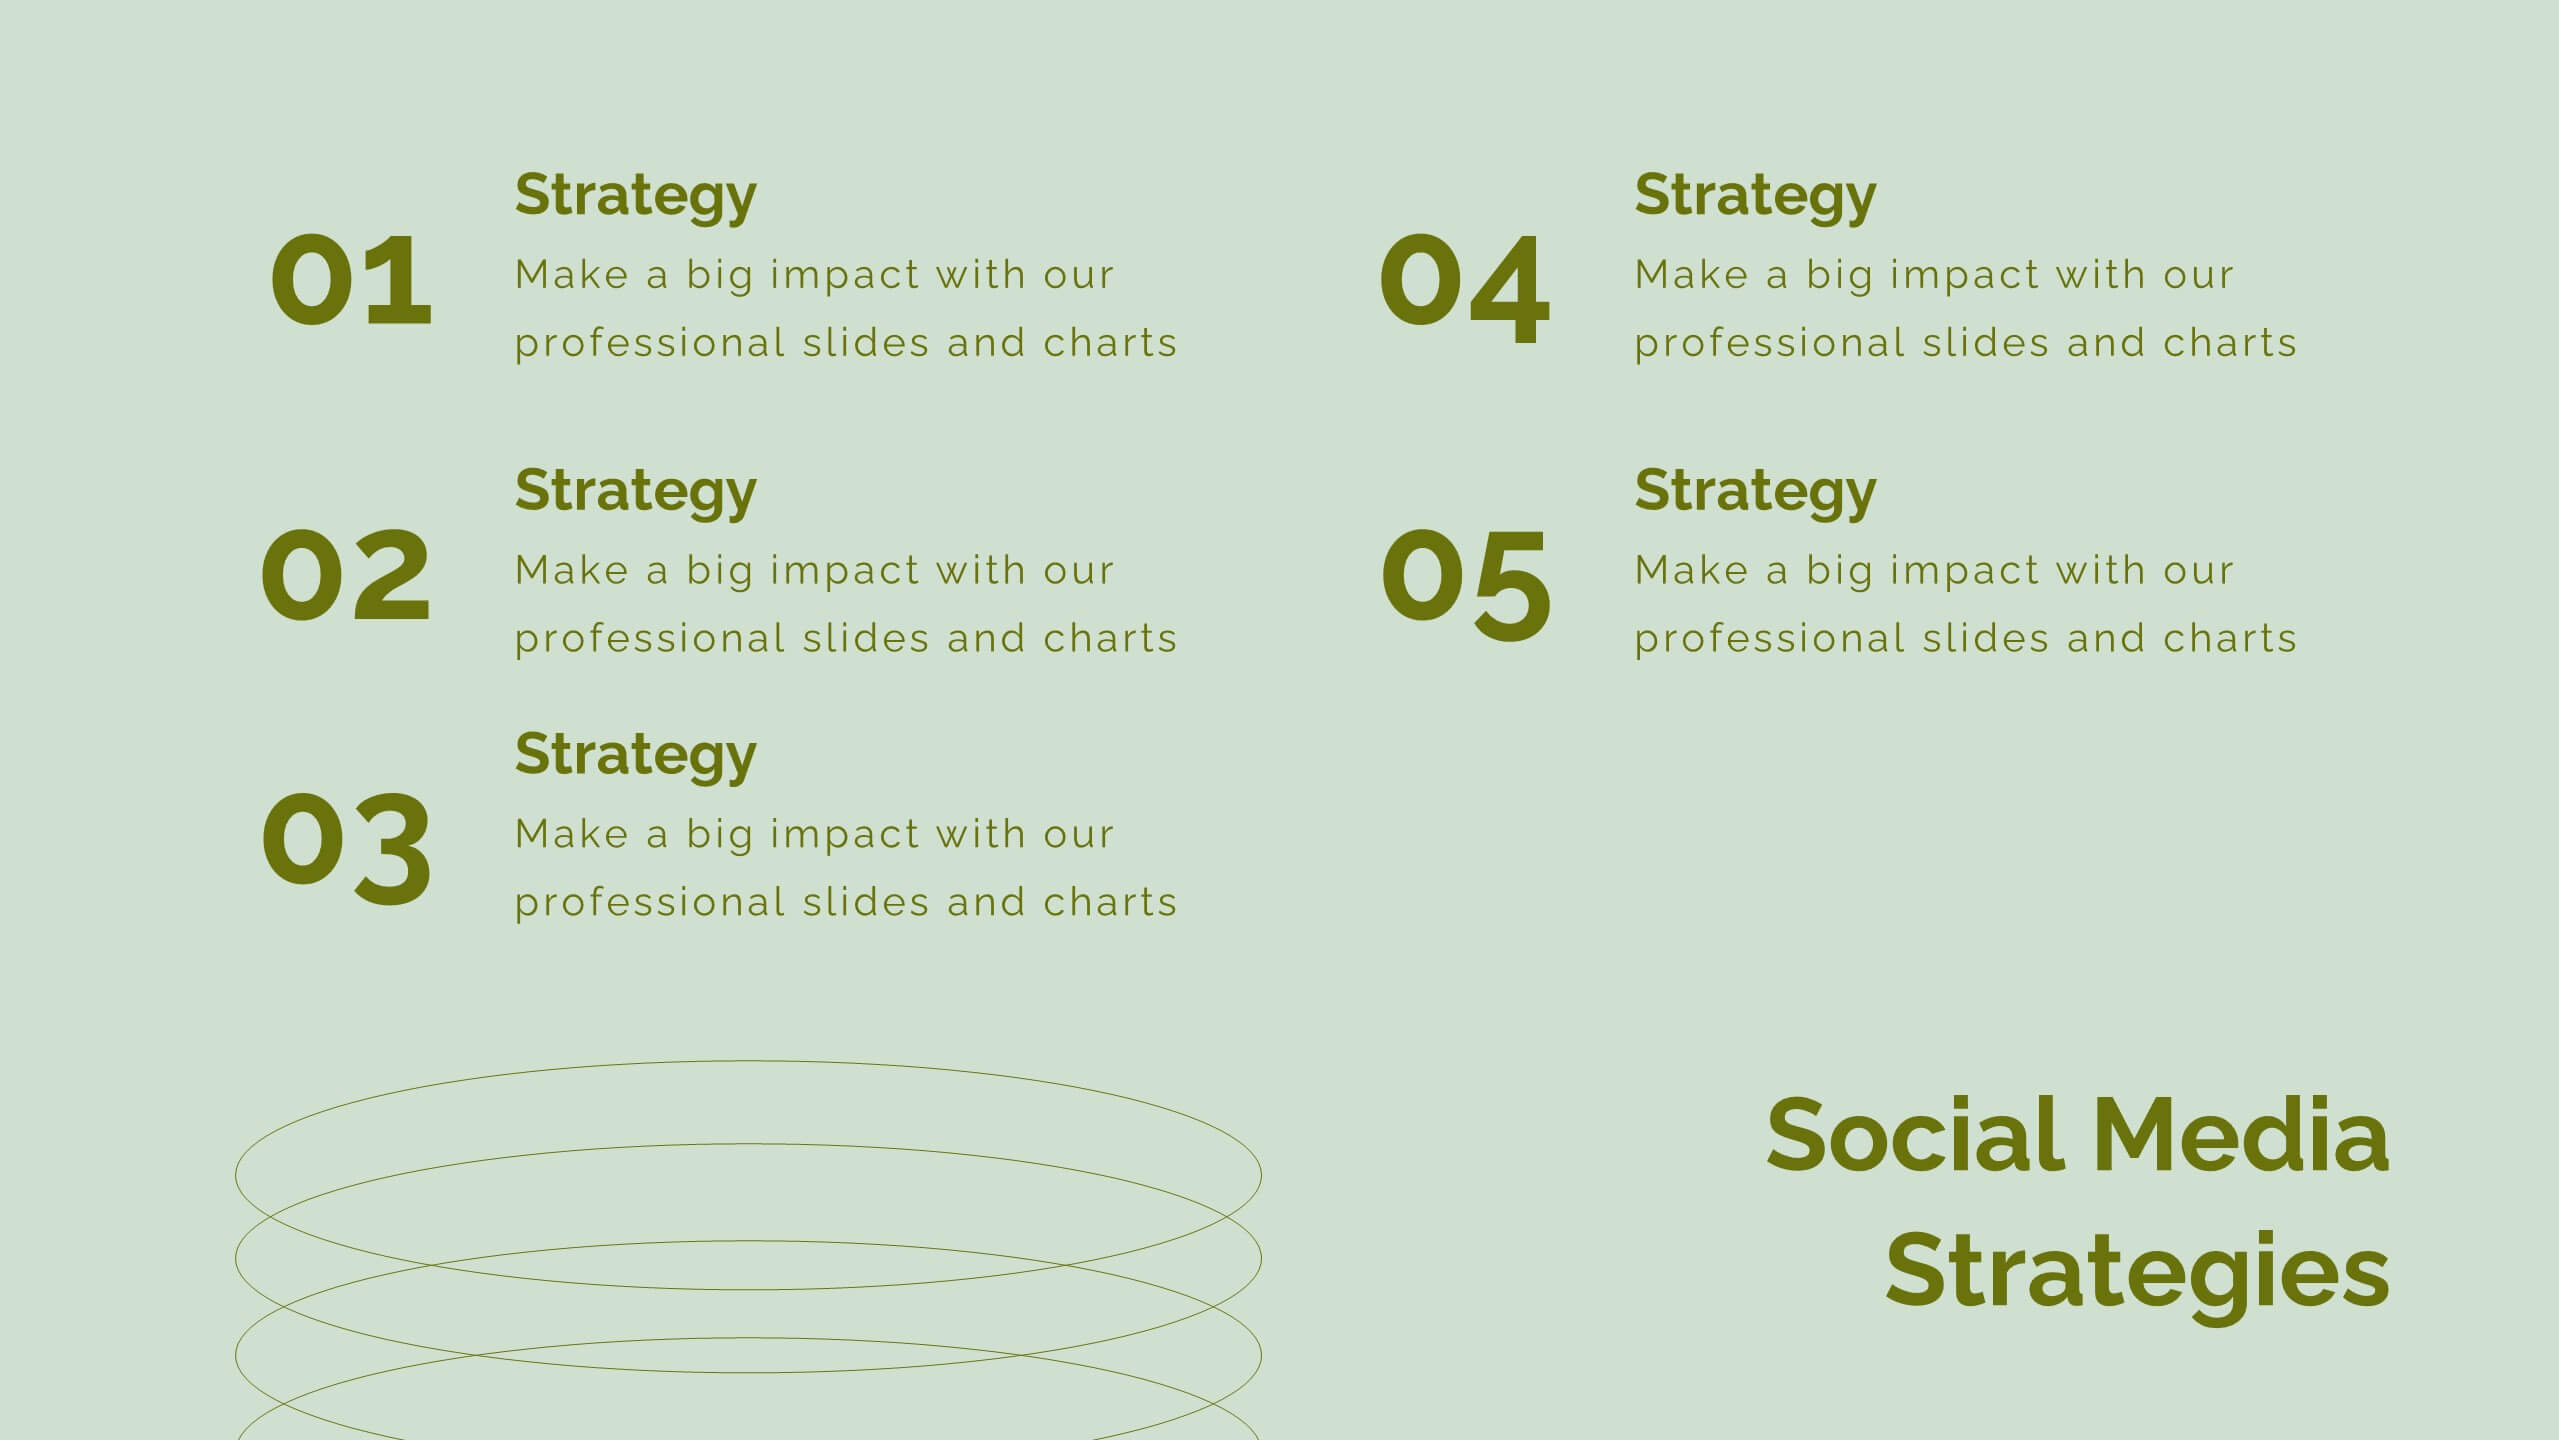
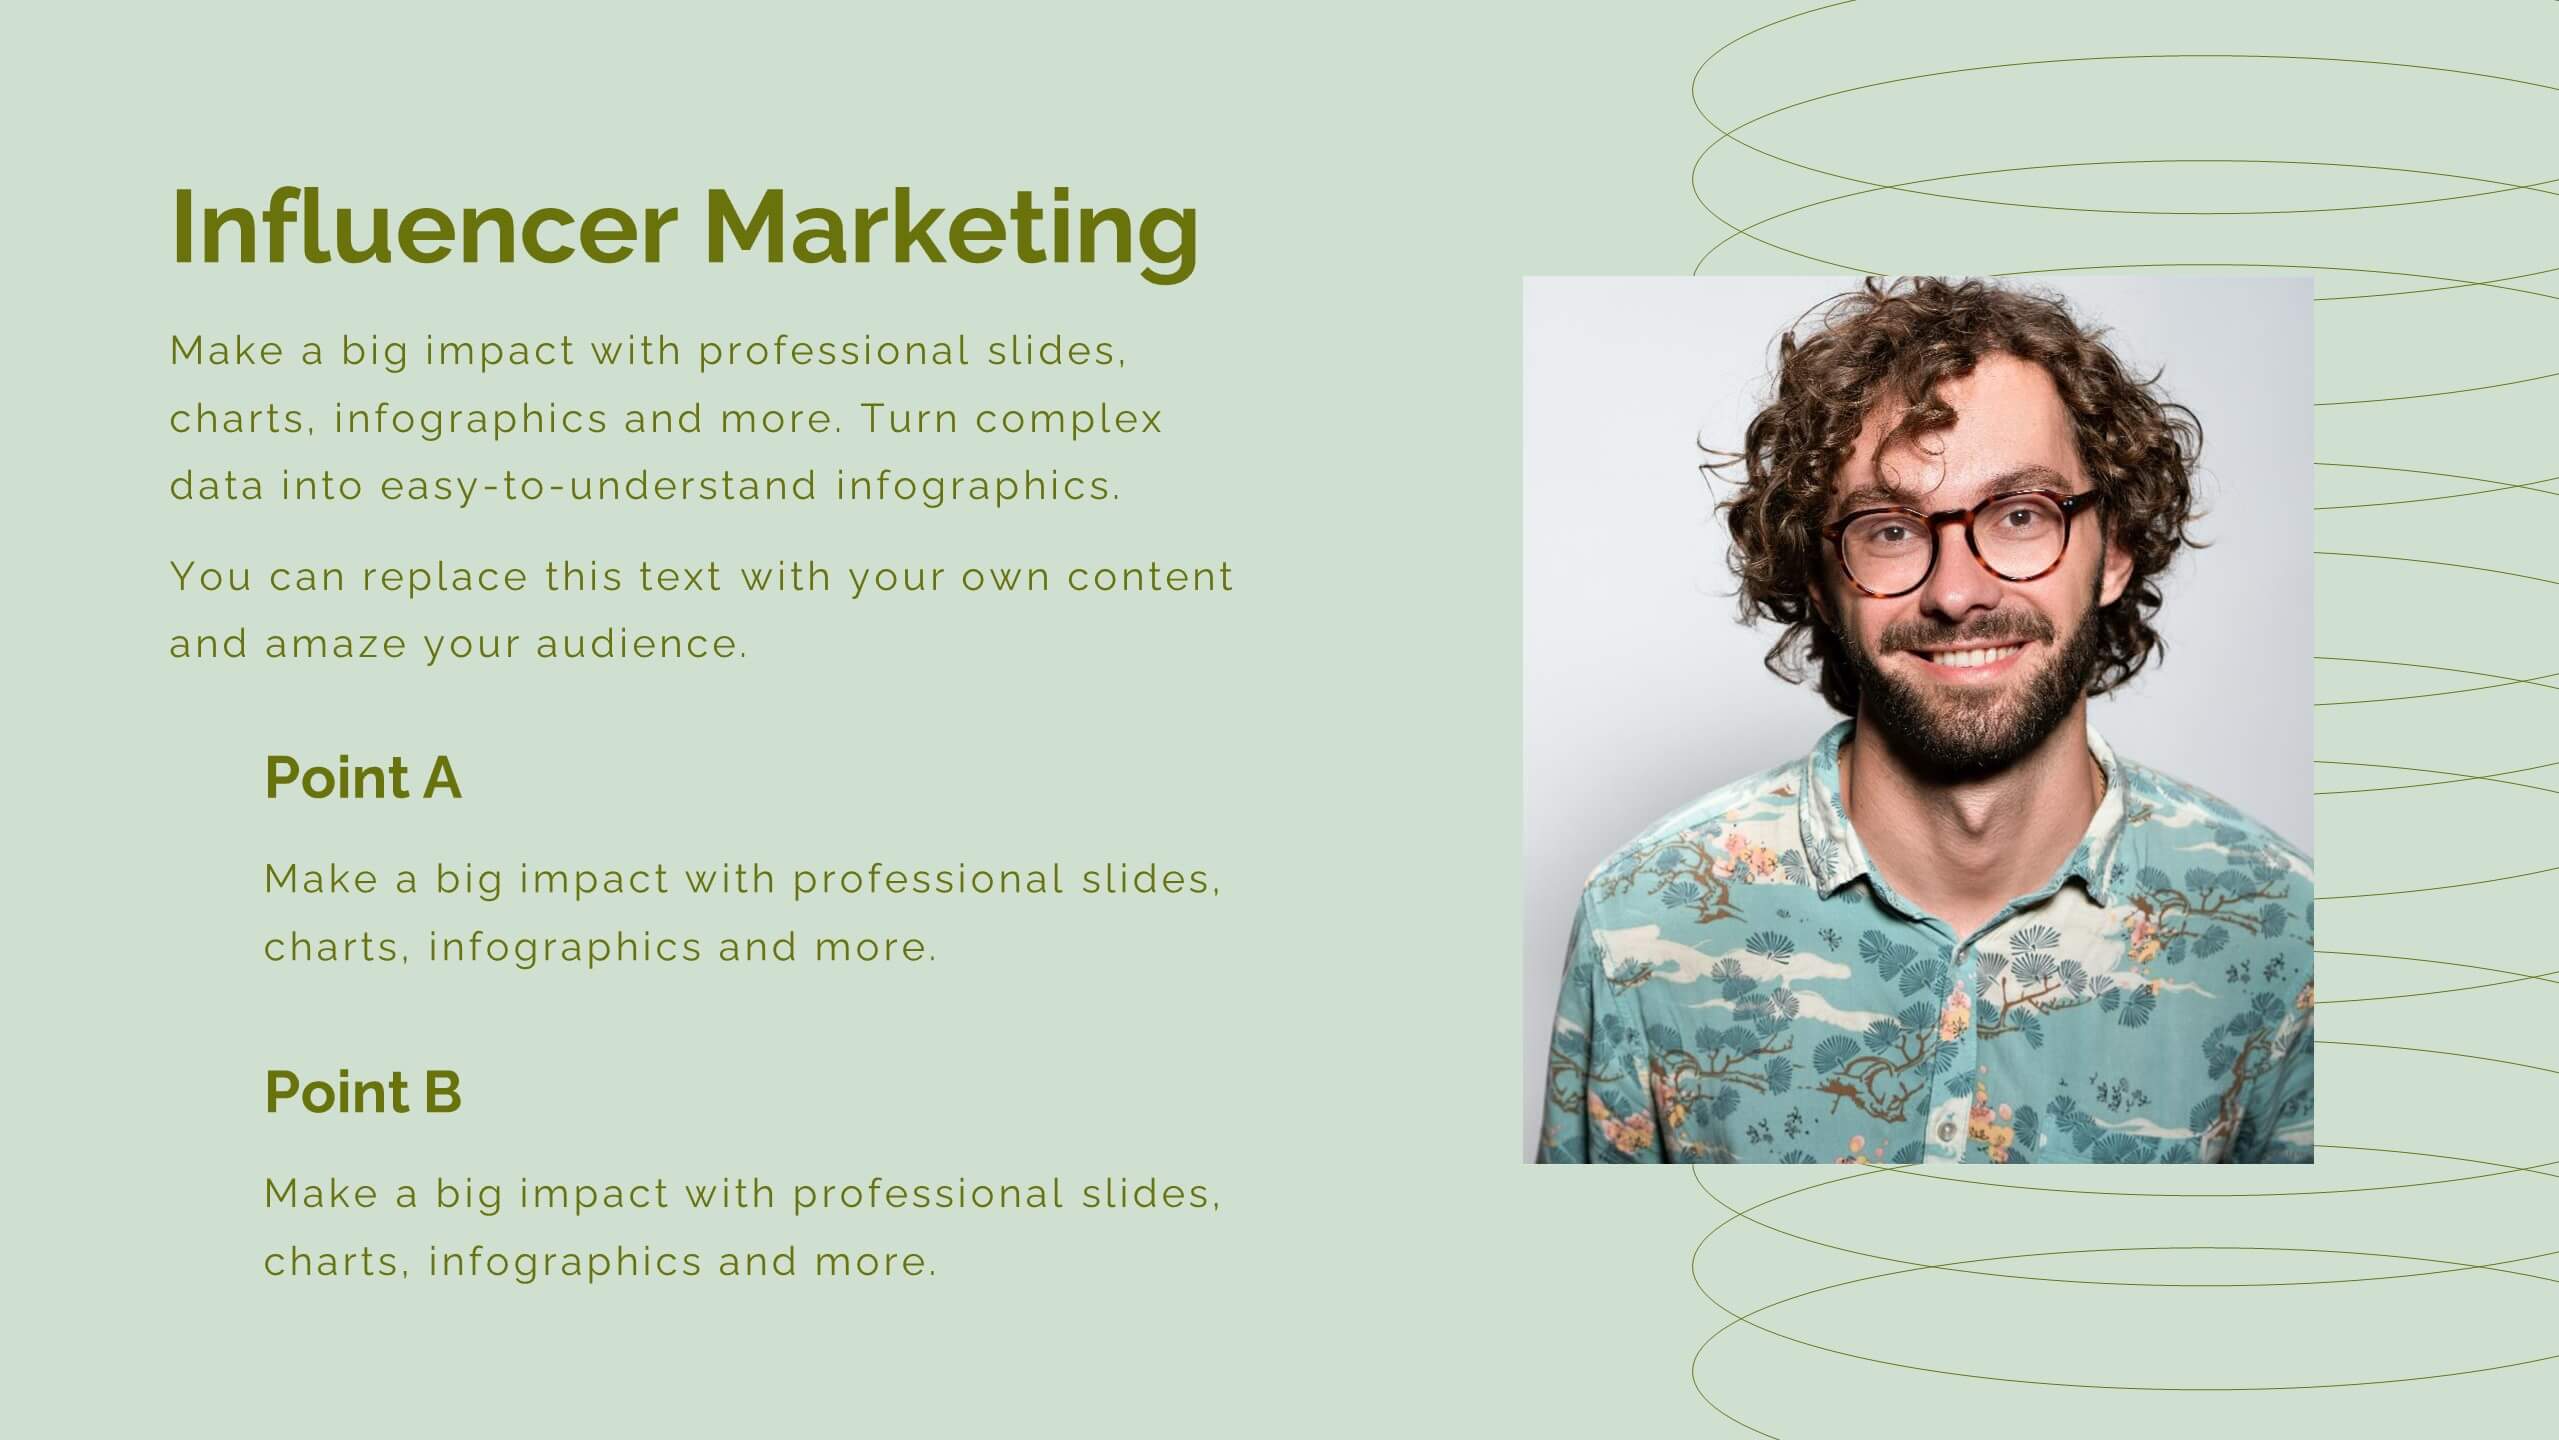
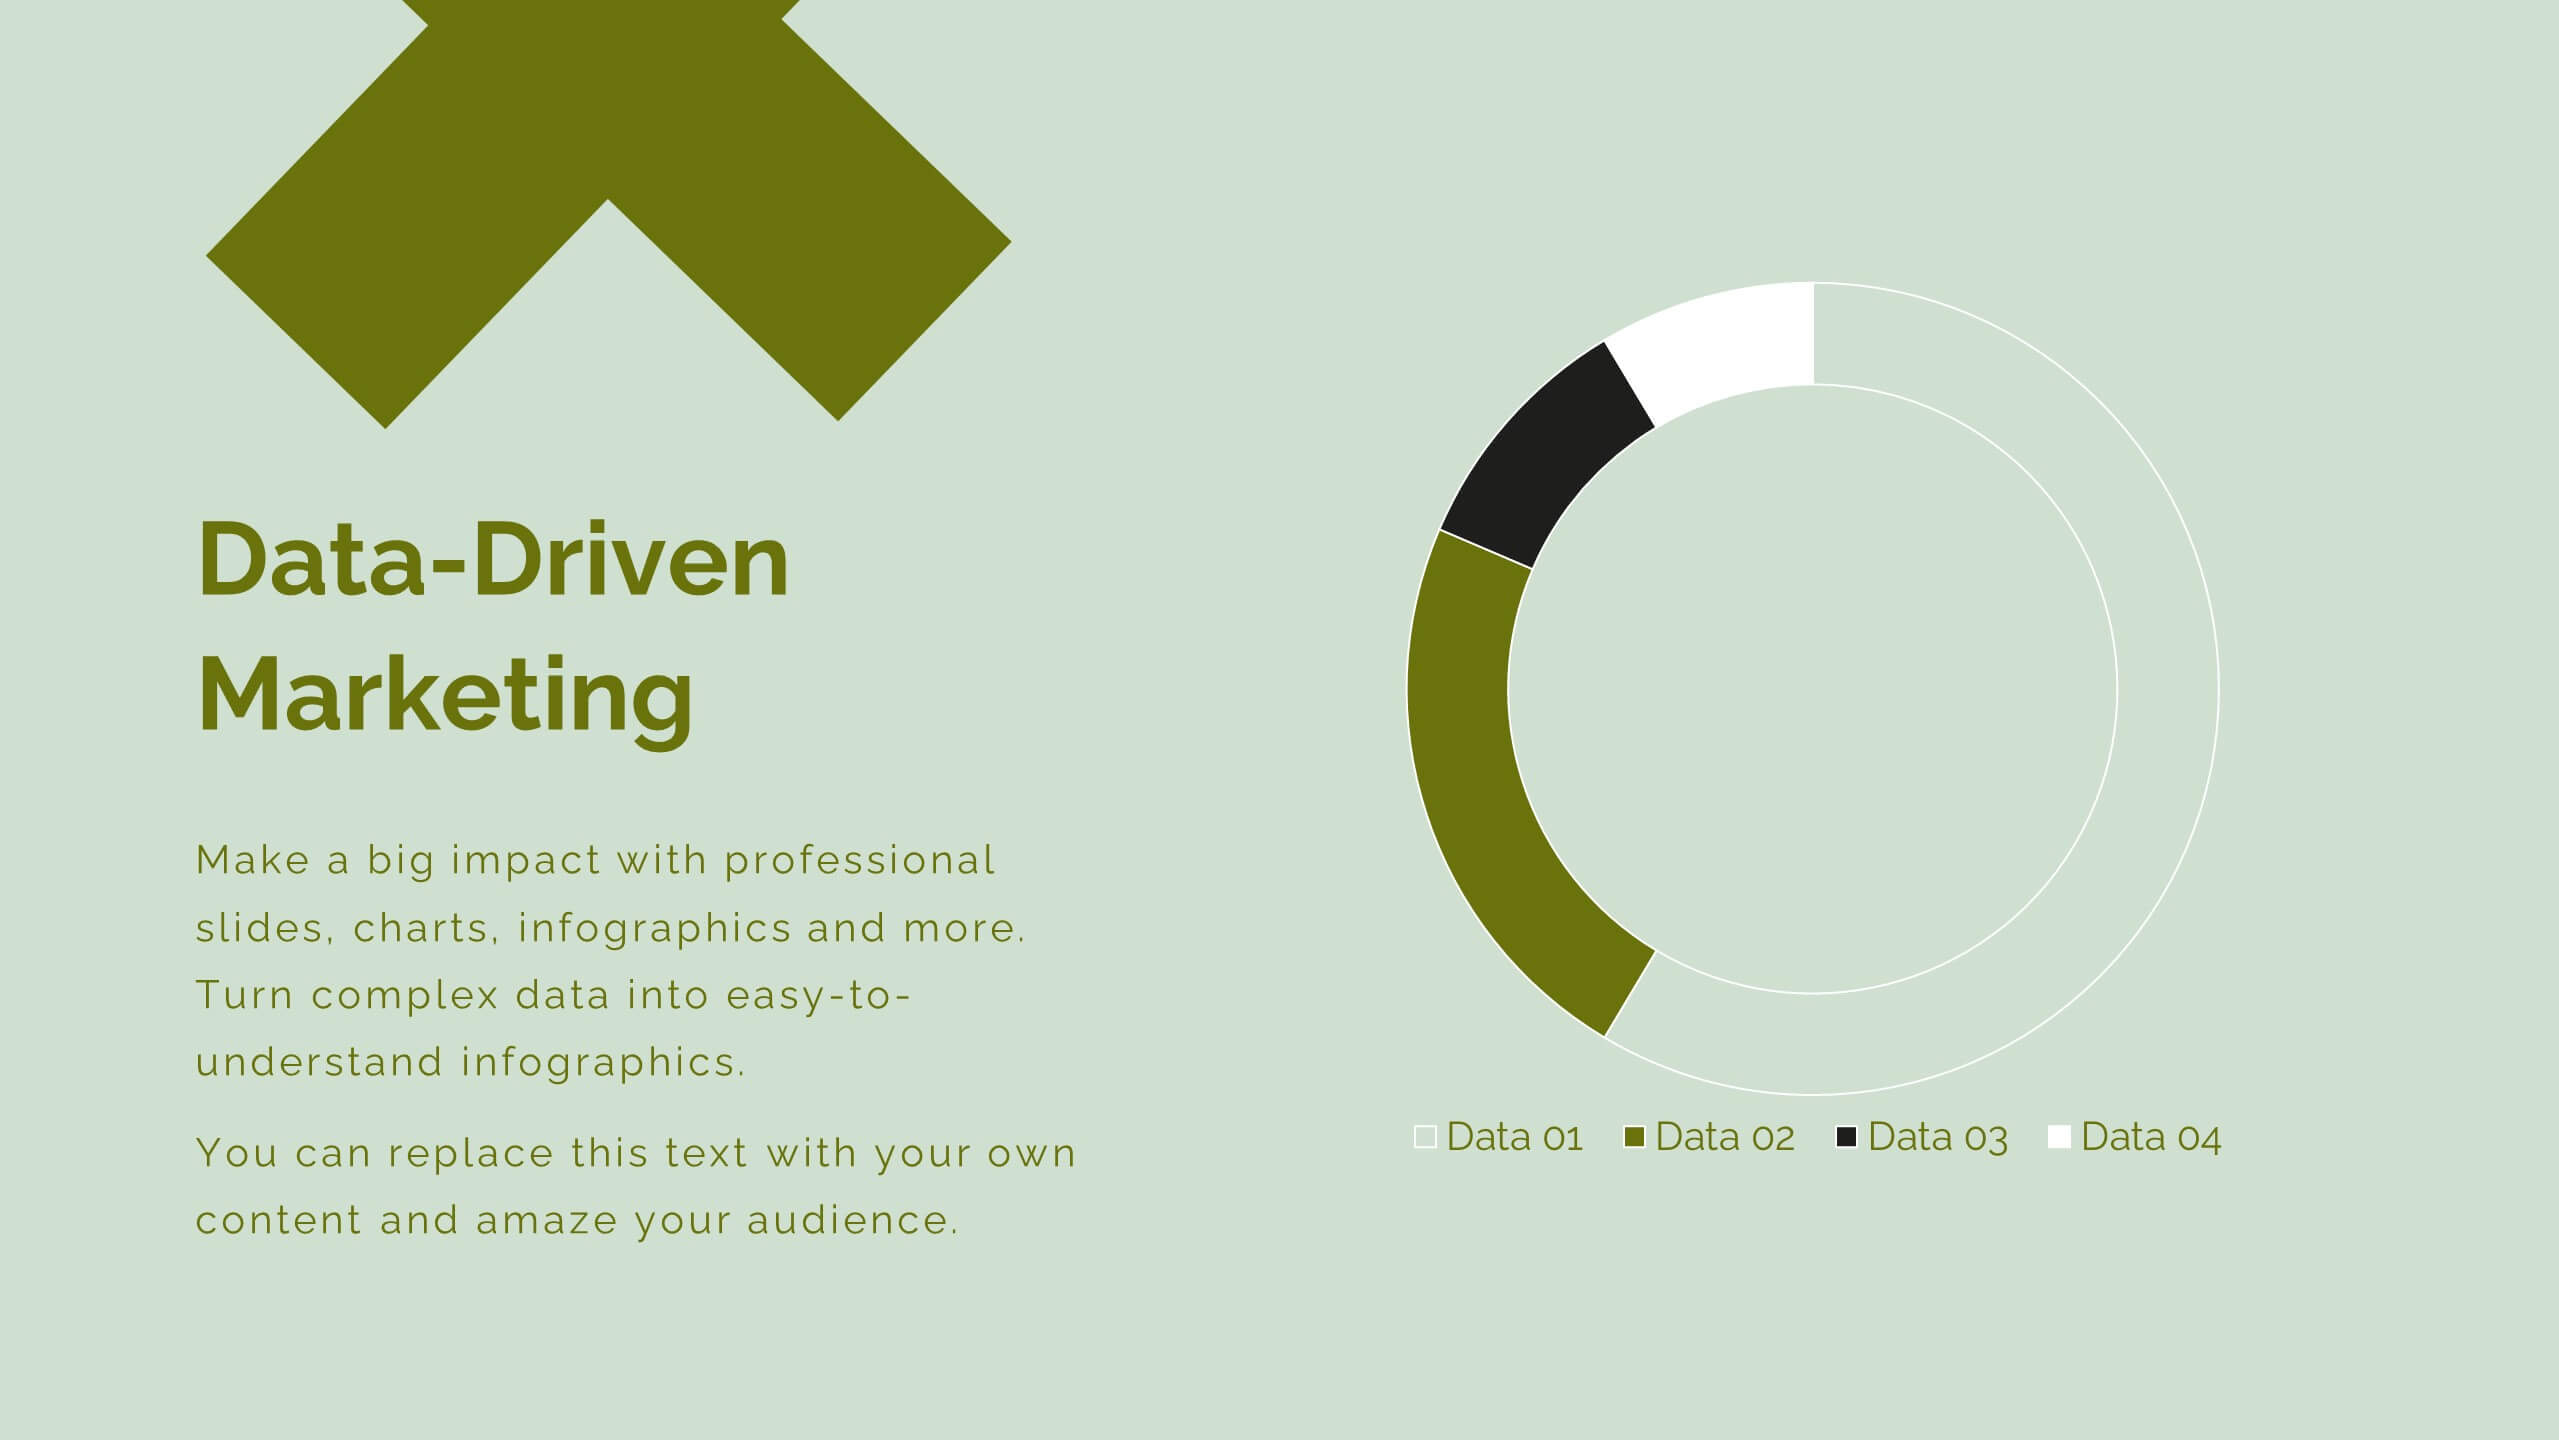
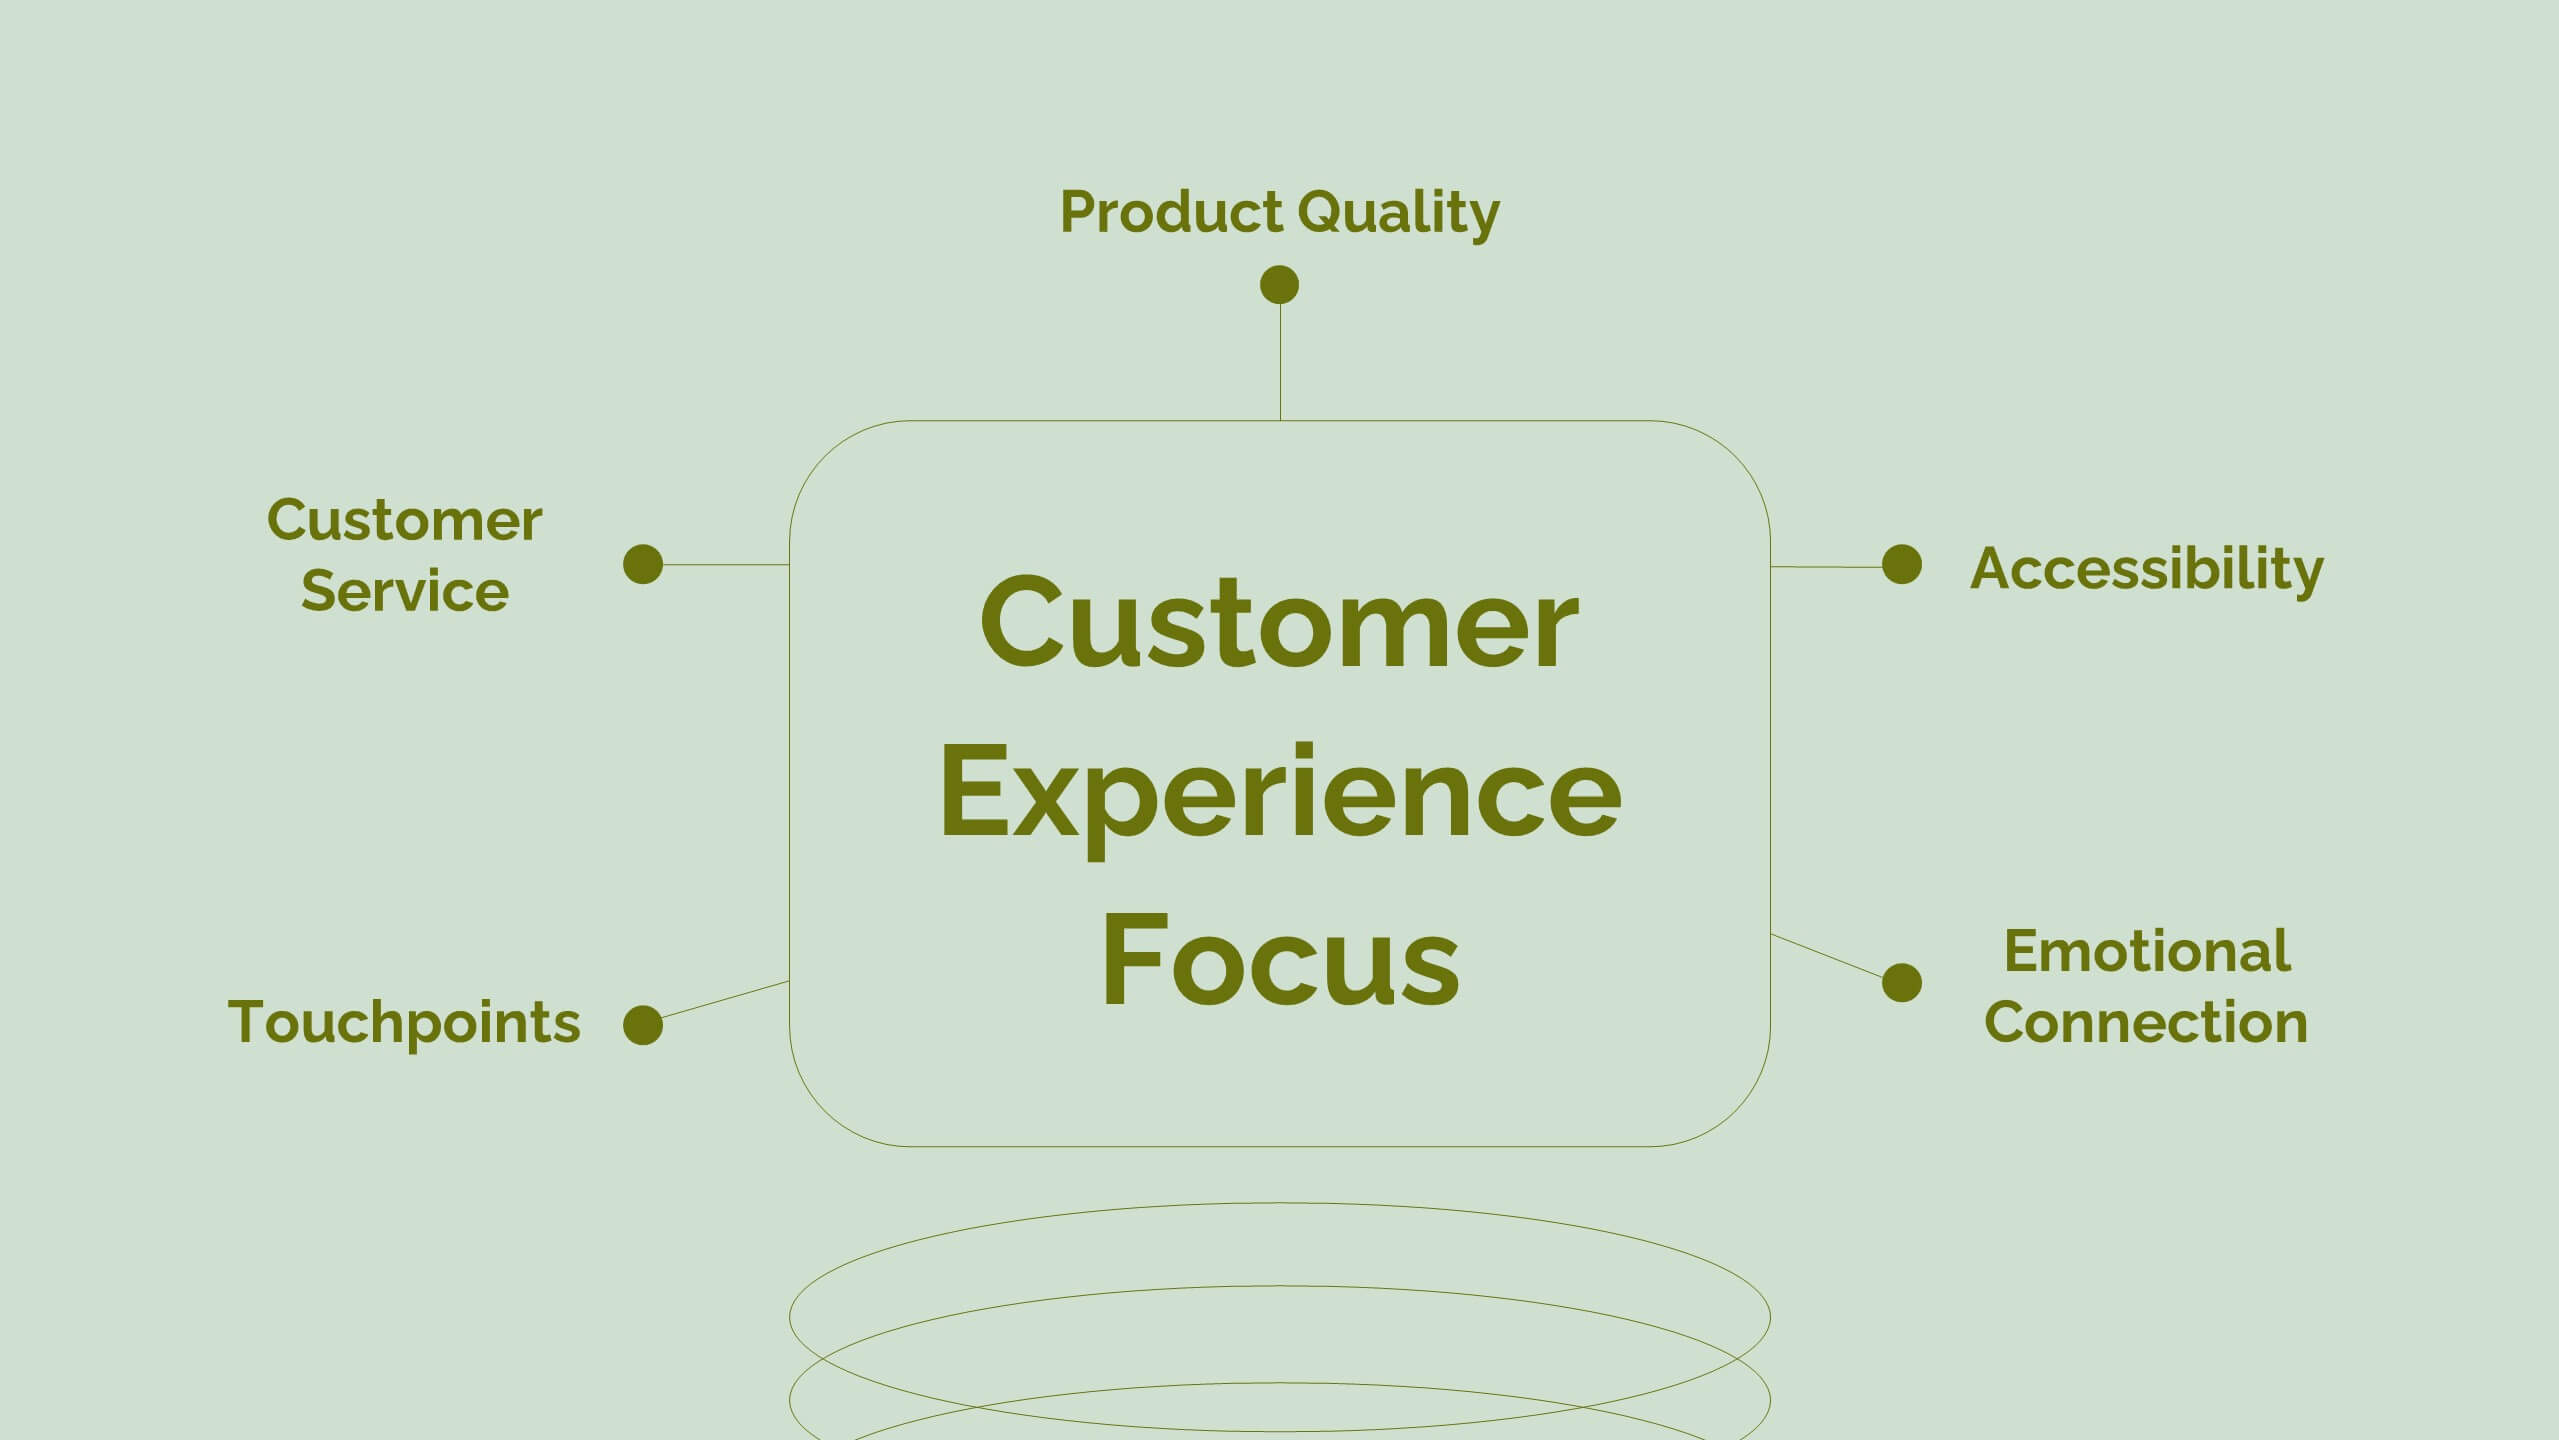
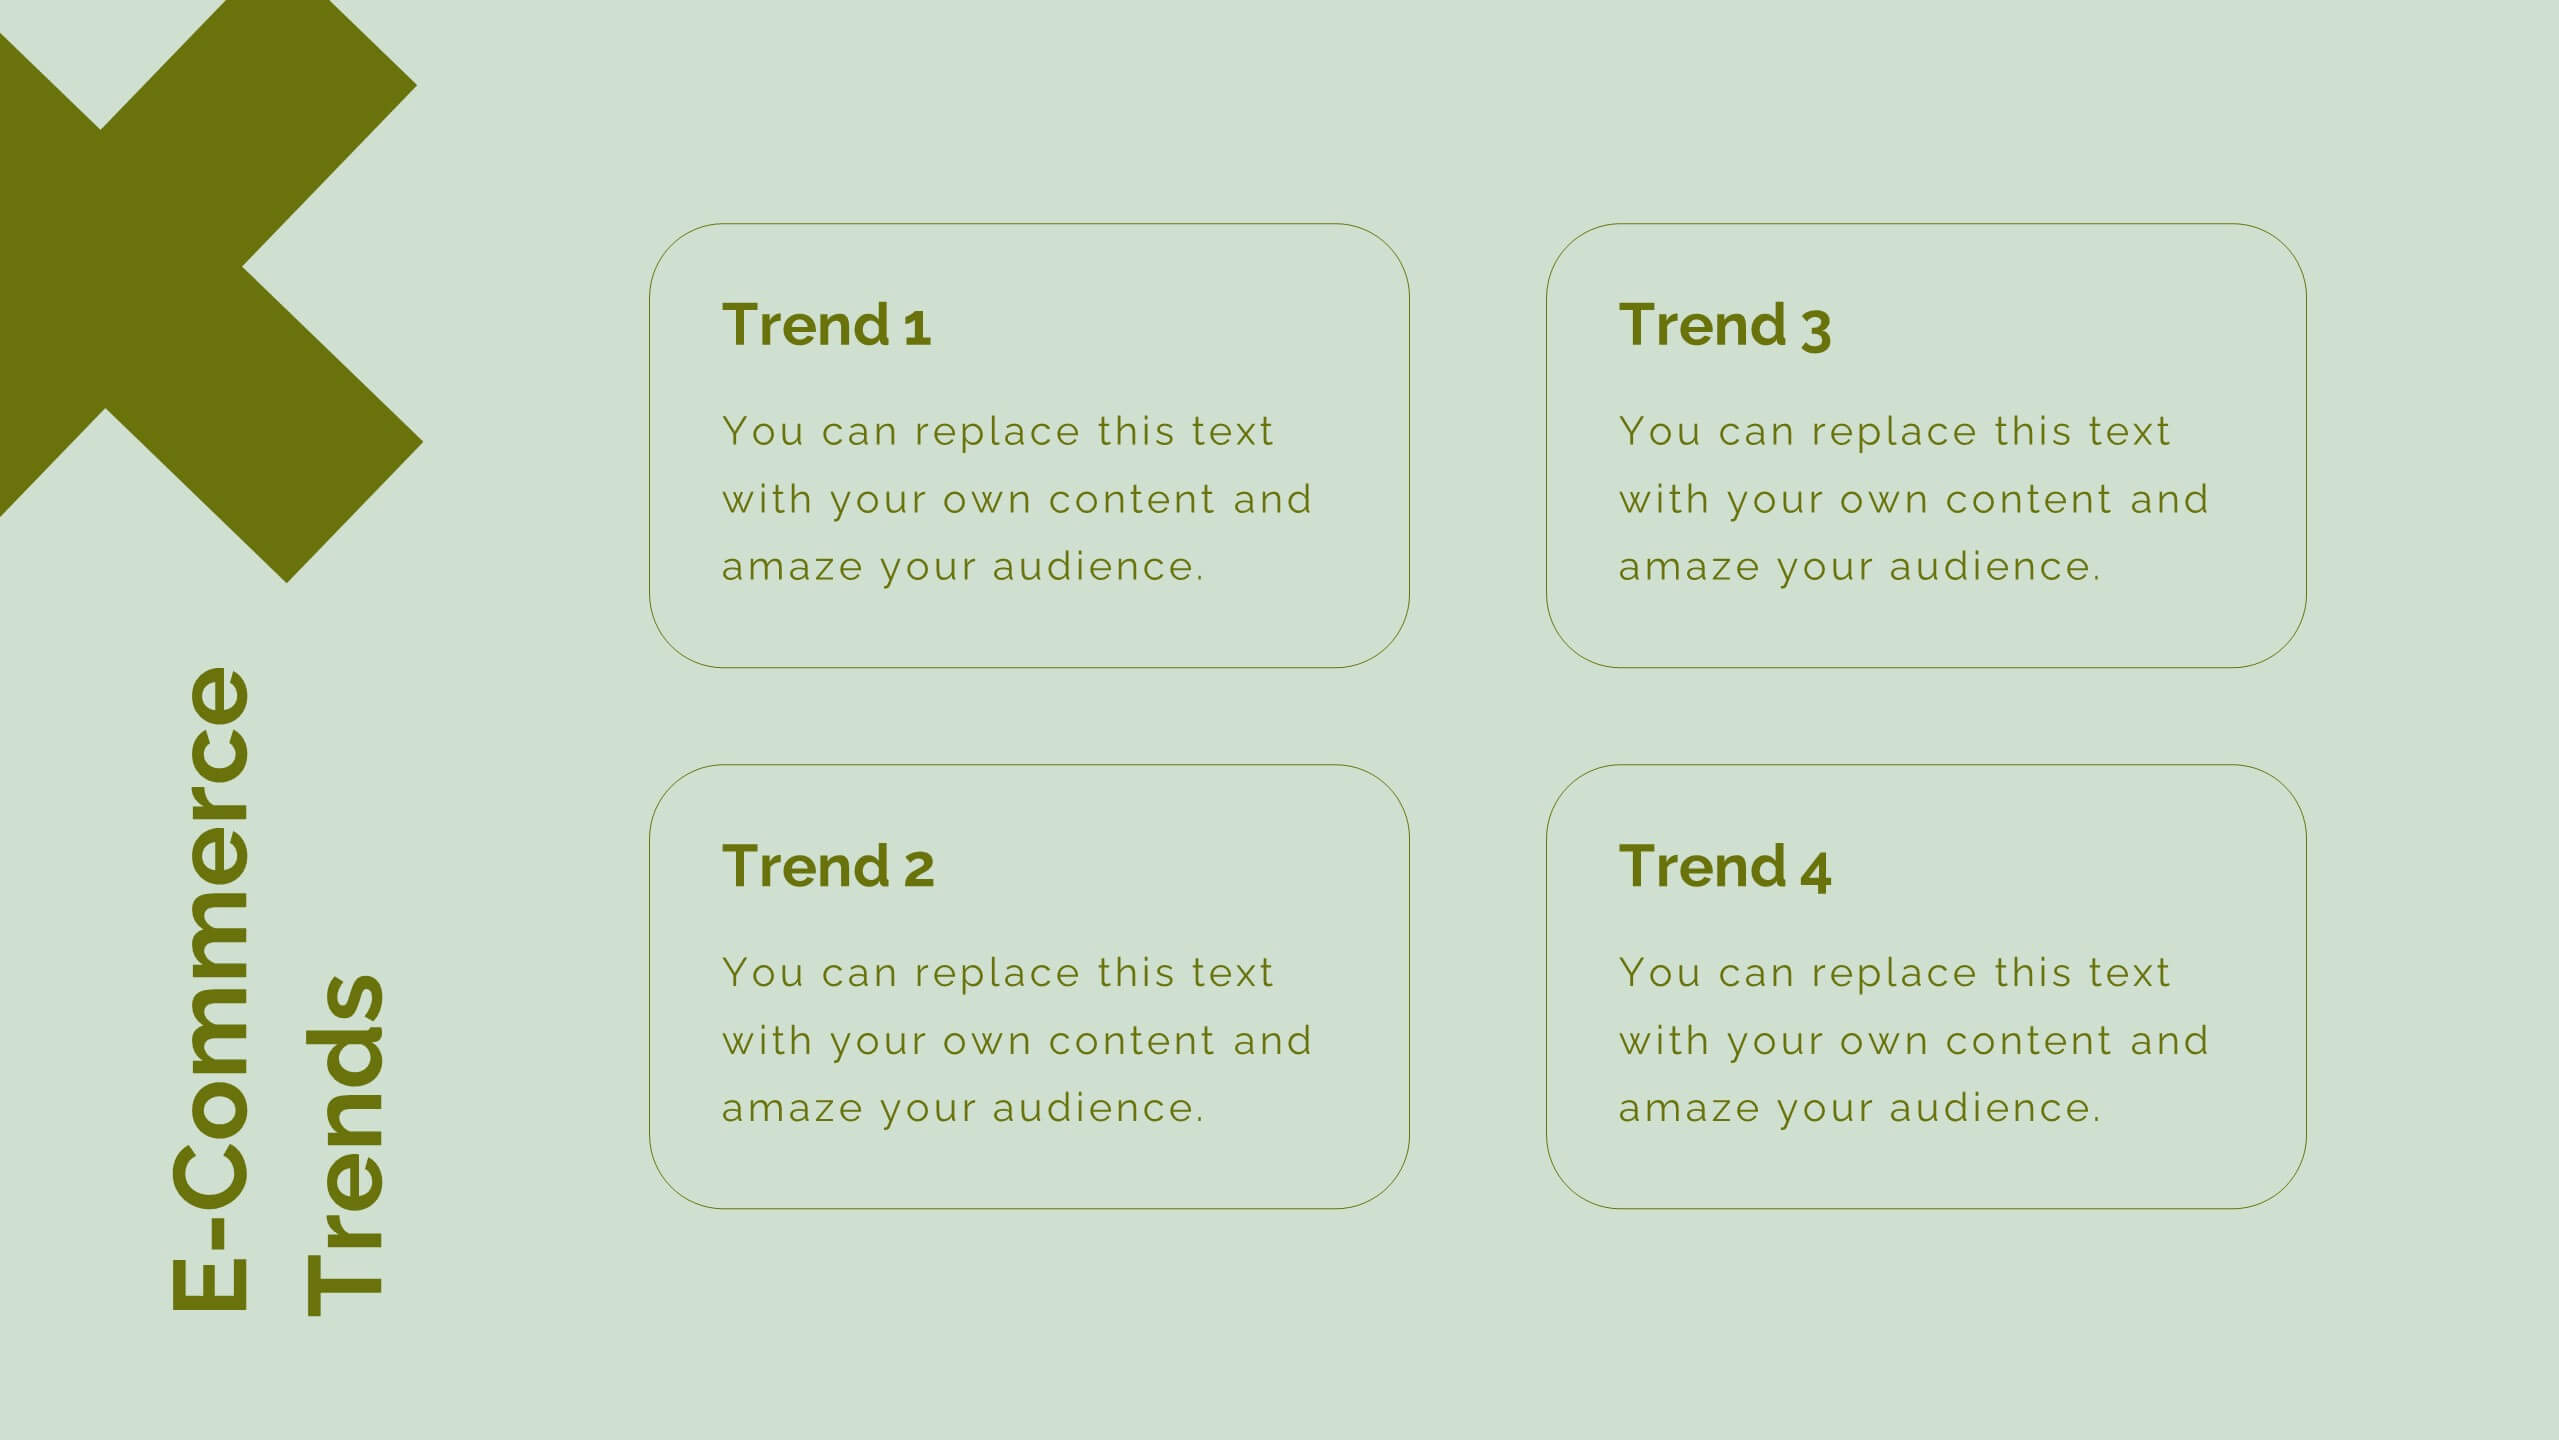
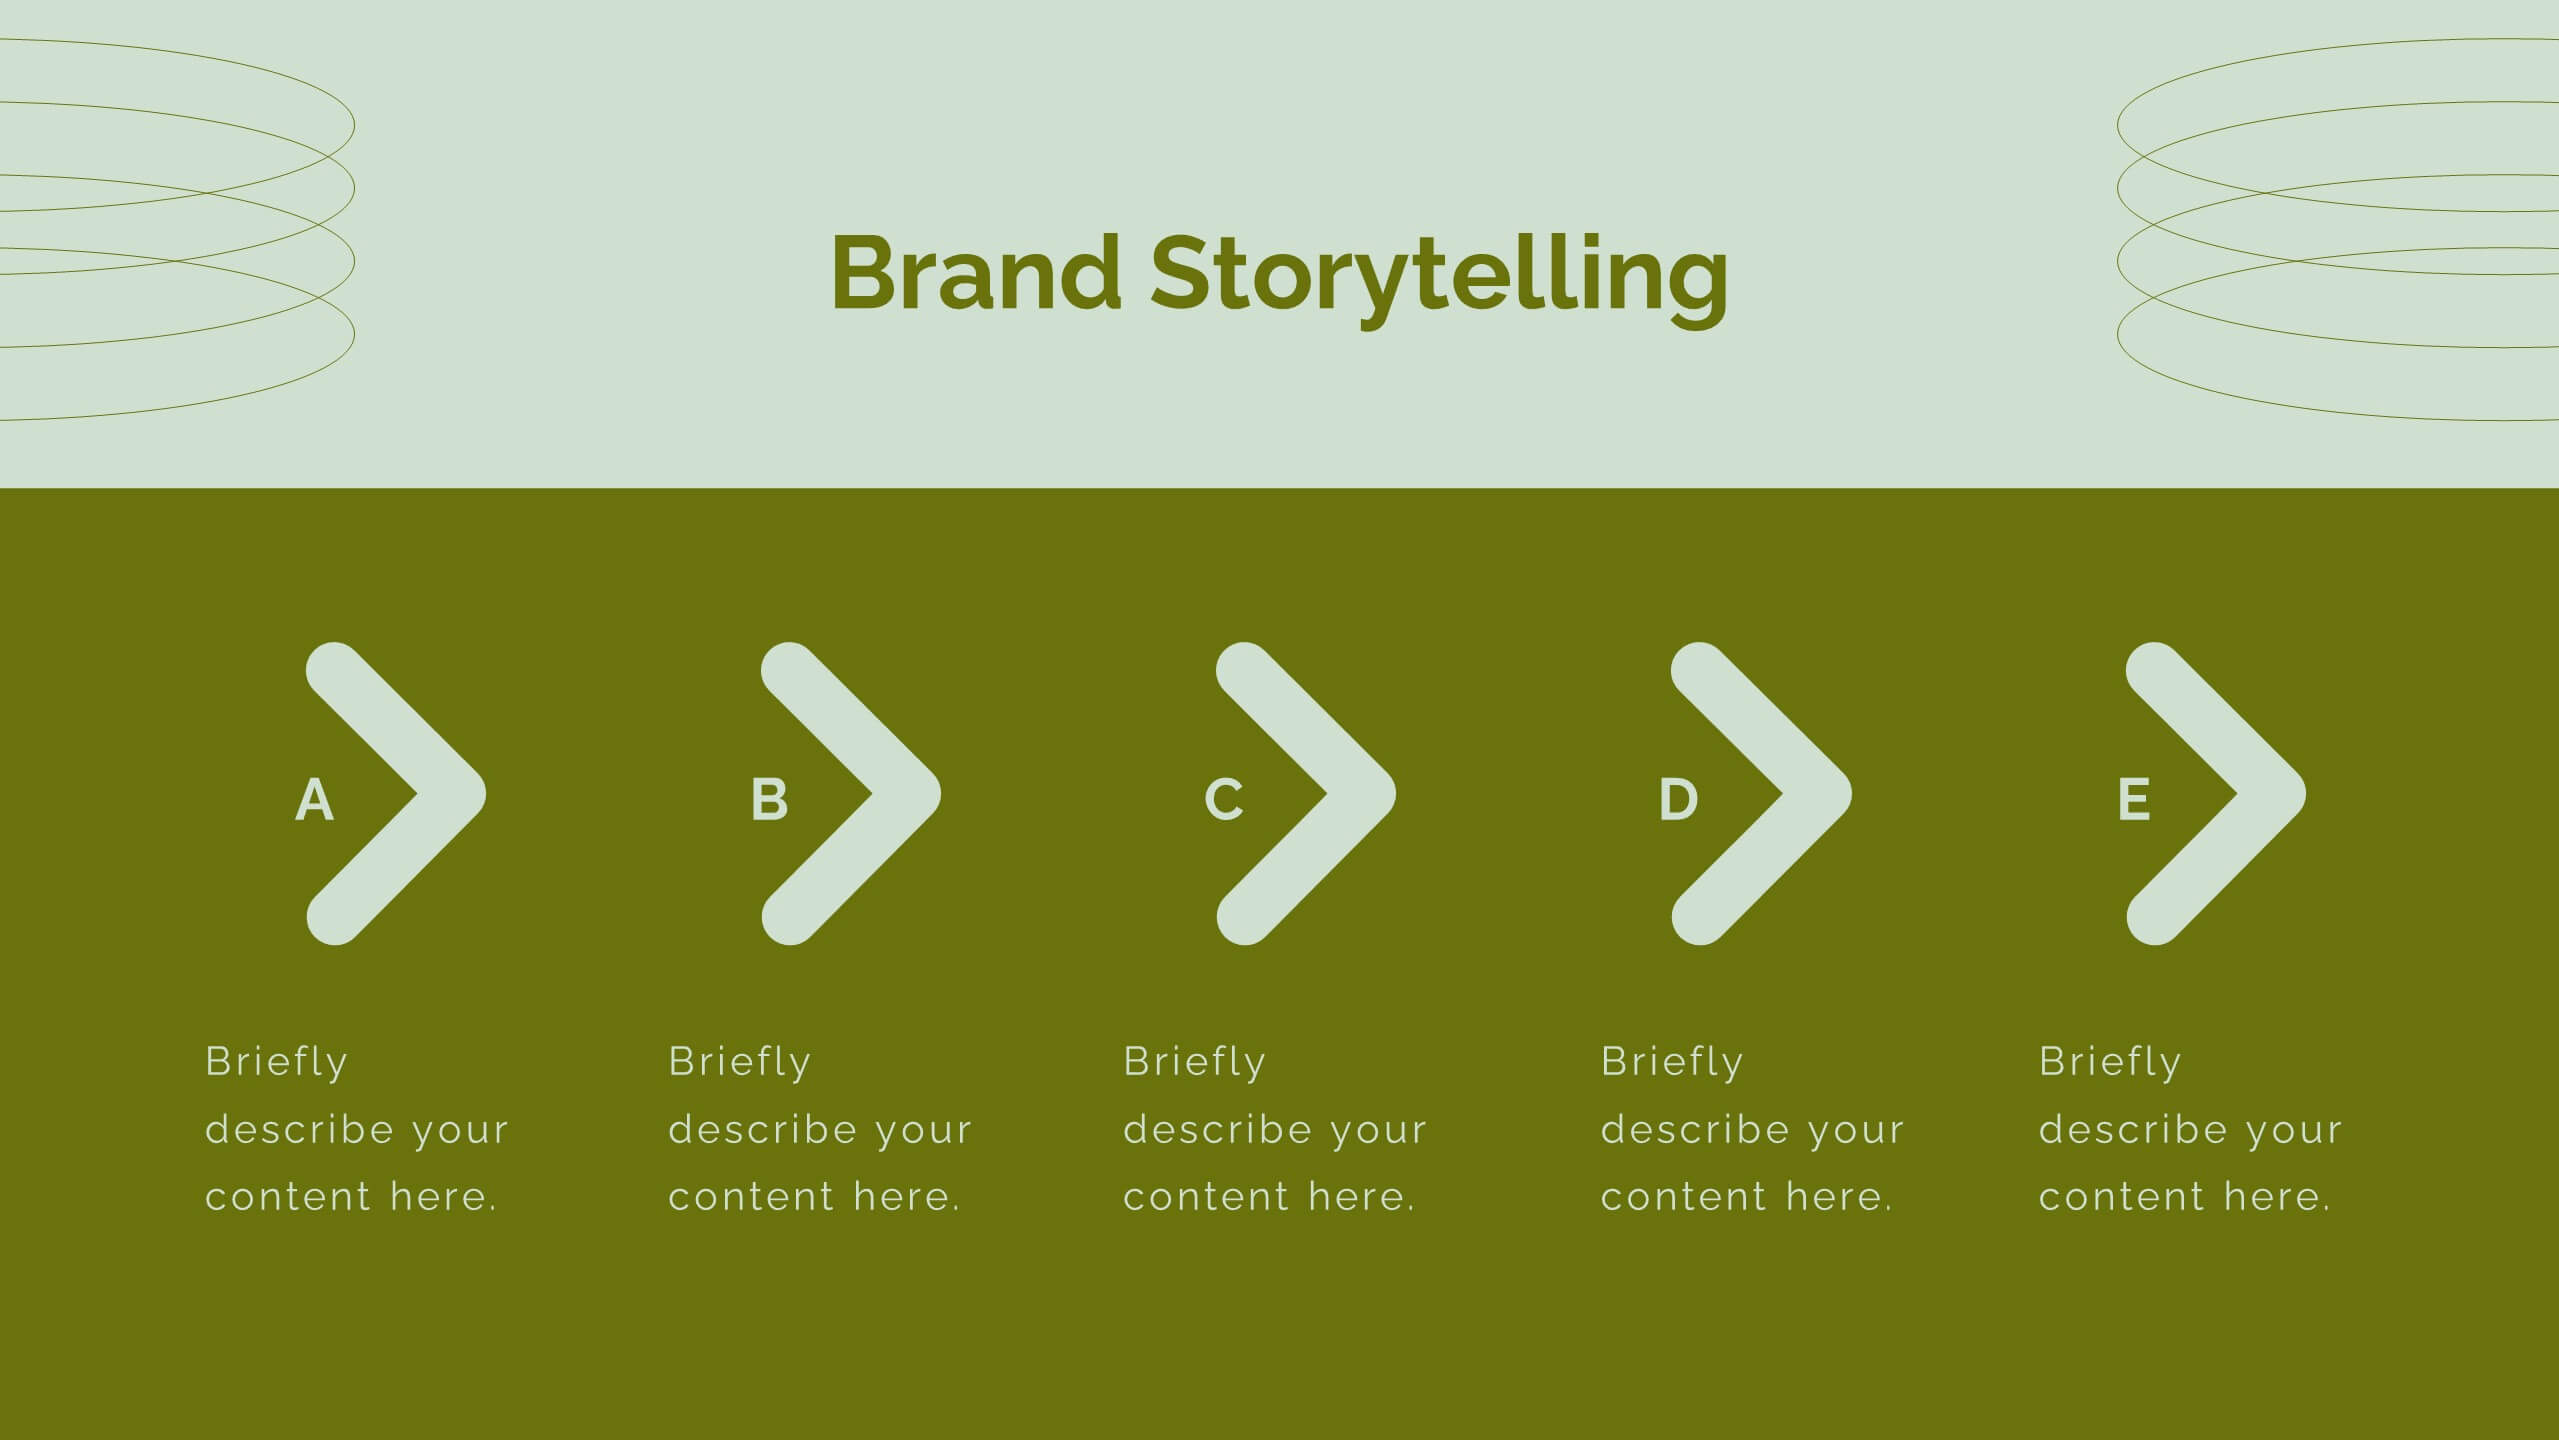
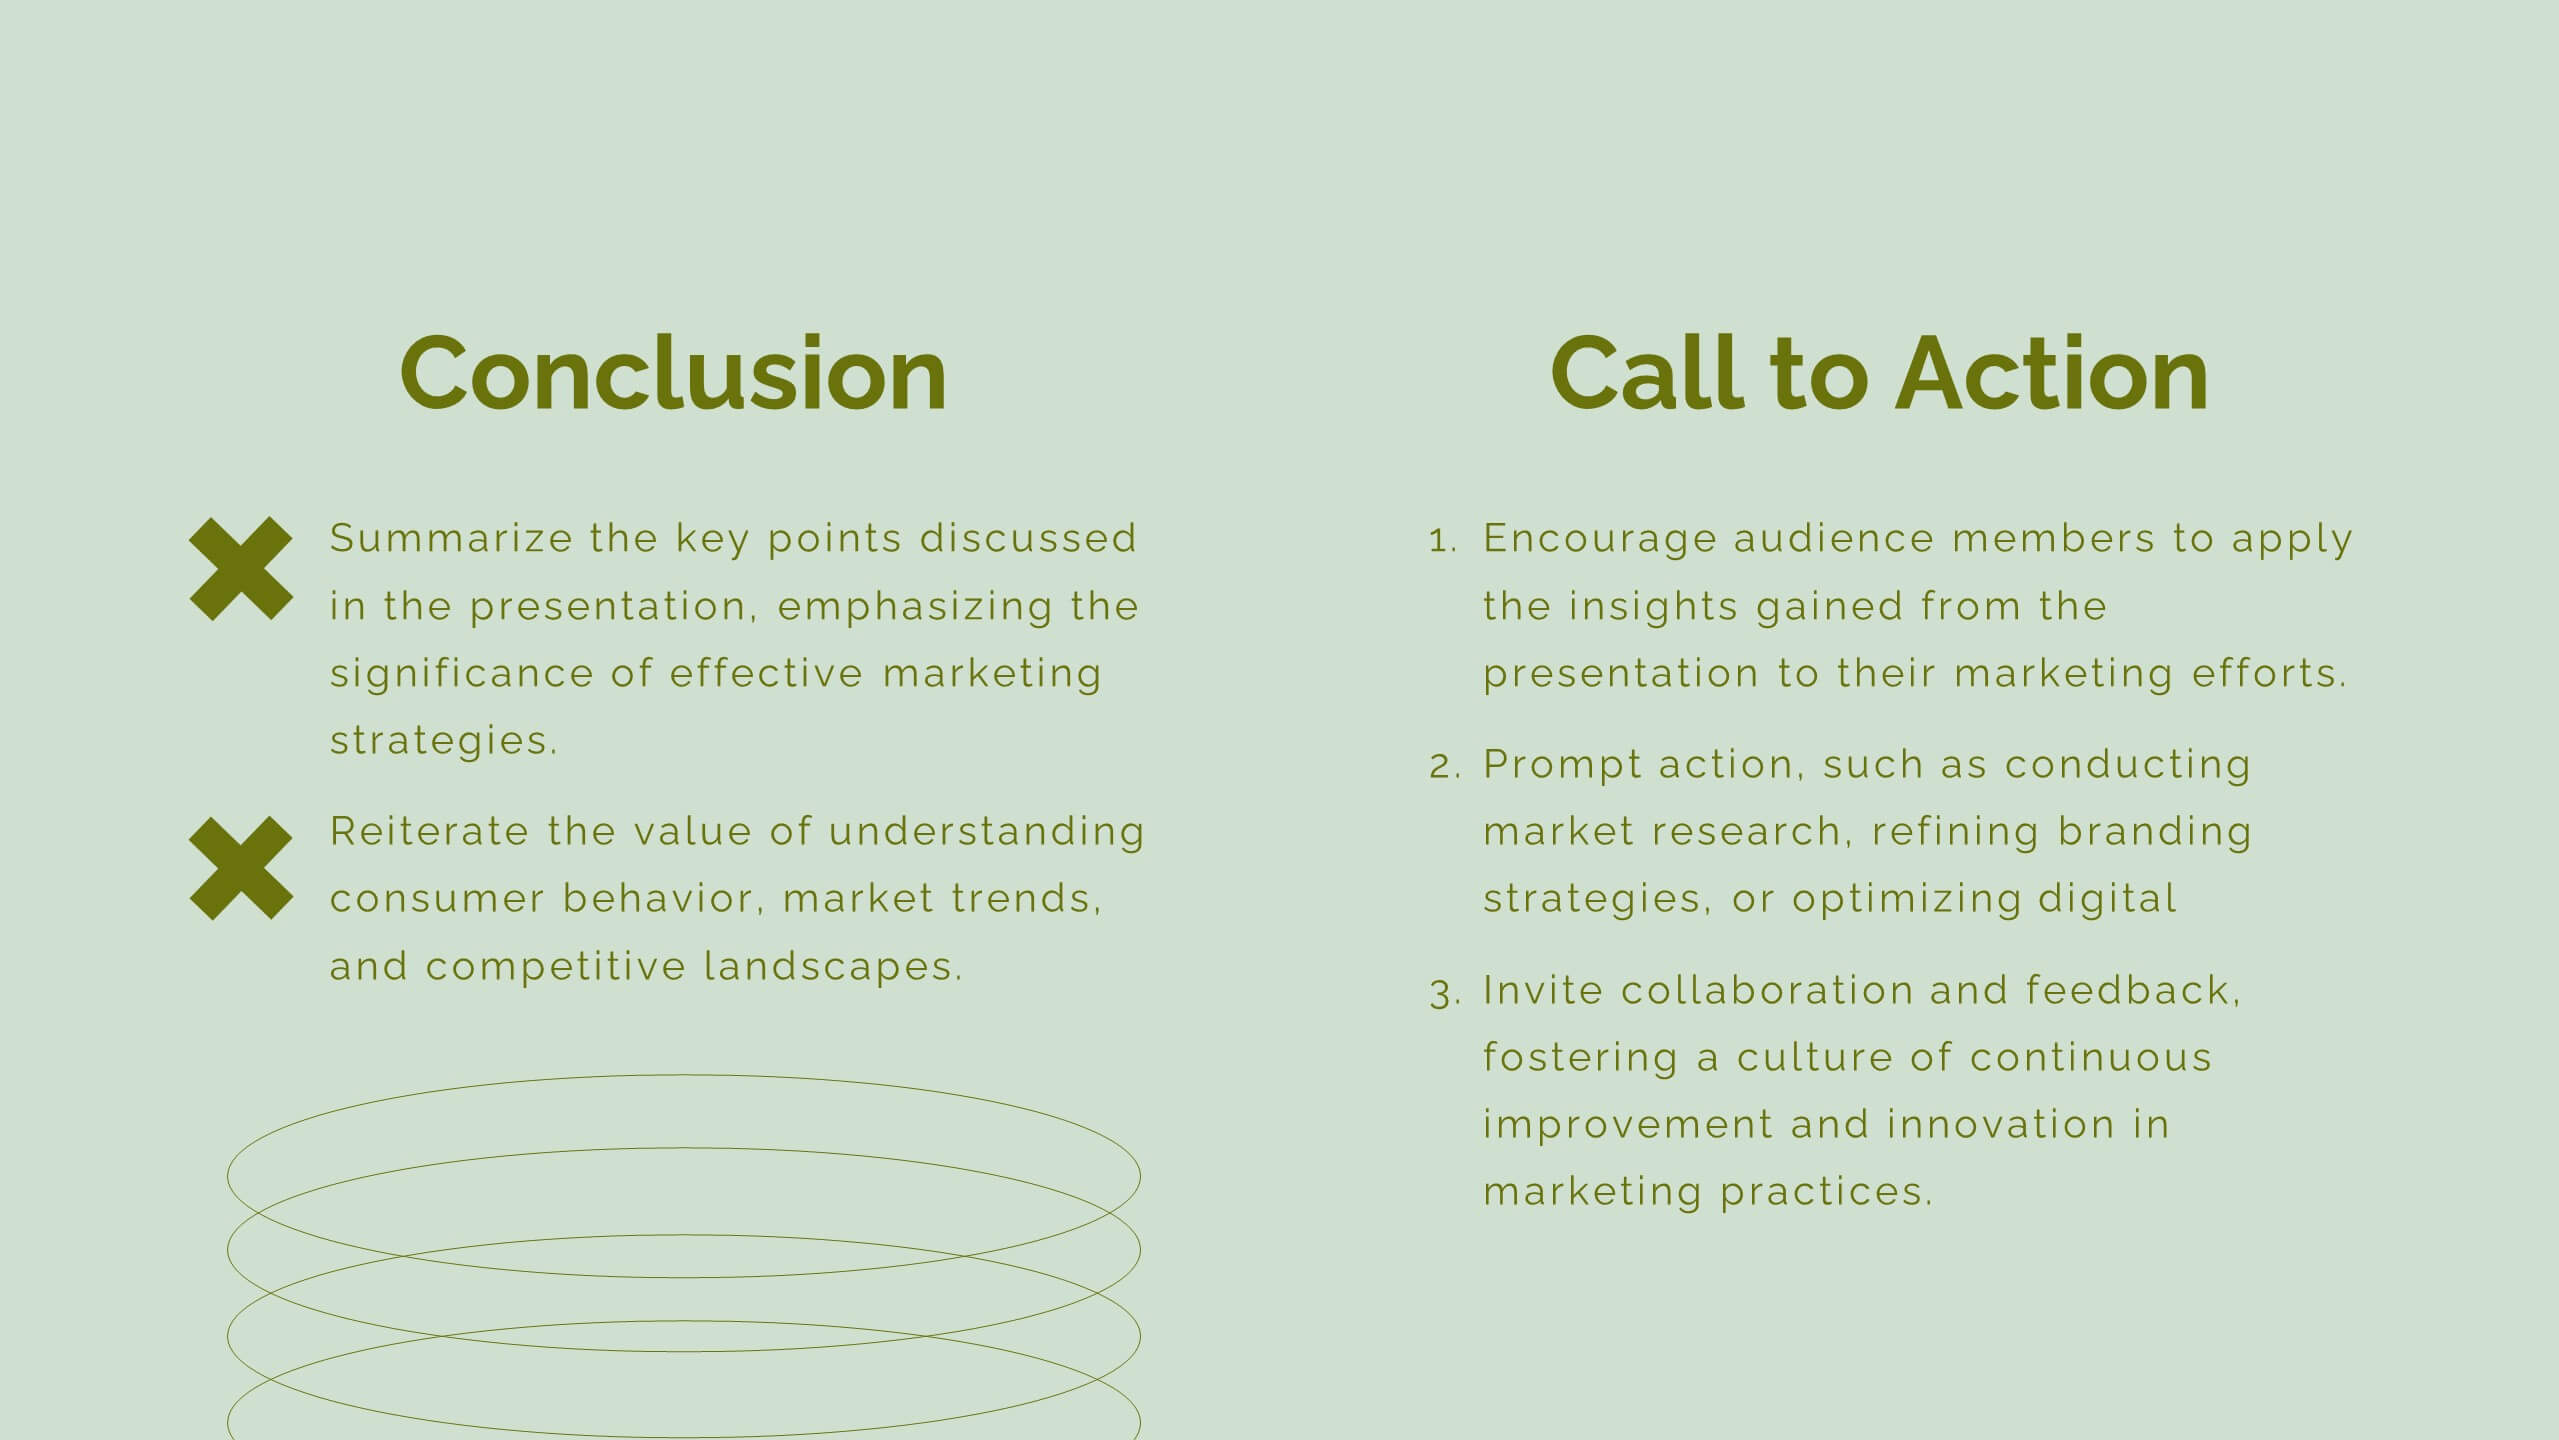
Aura Digital Marketing Strategy Plan Presentation
Revamp your digital marketing strategies with this dynamic template! Covering everything from industry overviews and consumer behavior analysis to emerging technologies and social media strategies, this template has it all. Perfect for creating compelling presentations that highlight data-driven marketing and brand storytelling. Compatible with PowerPoint, Keynote, and Google Slides.


8 diapositivas
Identifying and Addressing Business Problems Presentation
Break down challenges with clarity using this structured 4-step business problem-solving slide. Highlight each issue with its own icon, number, and explanation, making it easy to communicate obstacles and outline solutions. Ideal for team strategy meetings, leadership briefings, or client reports. Fully customizable in PowerPoint, Keynote, and Google Slides.


5 diapositivas
Artificial Intelligence Insights Infographics
Embark on an explorative journey into the future with artificial intelligence insights infographics. Set against a visually stimulating backdrop of purple, blue, and white. It's designed for innovators, educators, and students who strive to understand and communicate the multifaceted impacts of AI in various sectors. By encapsulating trends, innovations, and challenges, these infographics are perfect for presentations, educational materials, or online content. The creative use of graphics and icons, ensures each segment of information is not only informative but also engaging, bringing clarity to the future shaped by artificial intelligence.


4 diapositivas
2030 Year in Review Company Report Presentation
Highlight achievements and key metrics with the 2030 Year in Review Company Report Presentation. This professionally designed slide is perfect for summarizing company growth, social stats, or performance KPIs at a glance. Featuring bold typography, modern layout, and editable elements in Canva, PowerPoint, and Google Slides. Ideal for annual business updates.


3 diapositivas
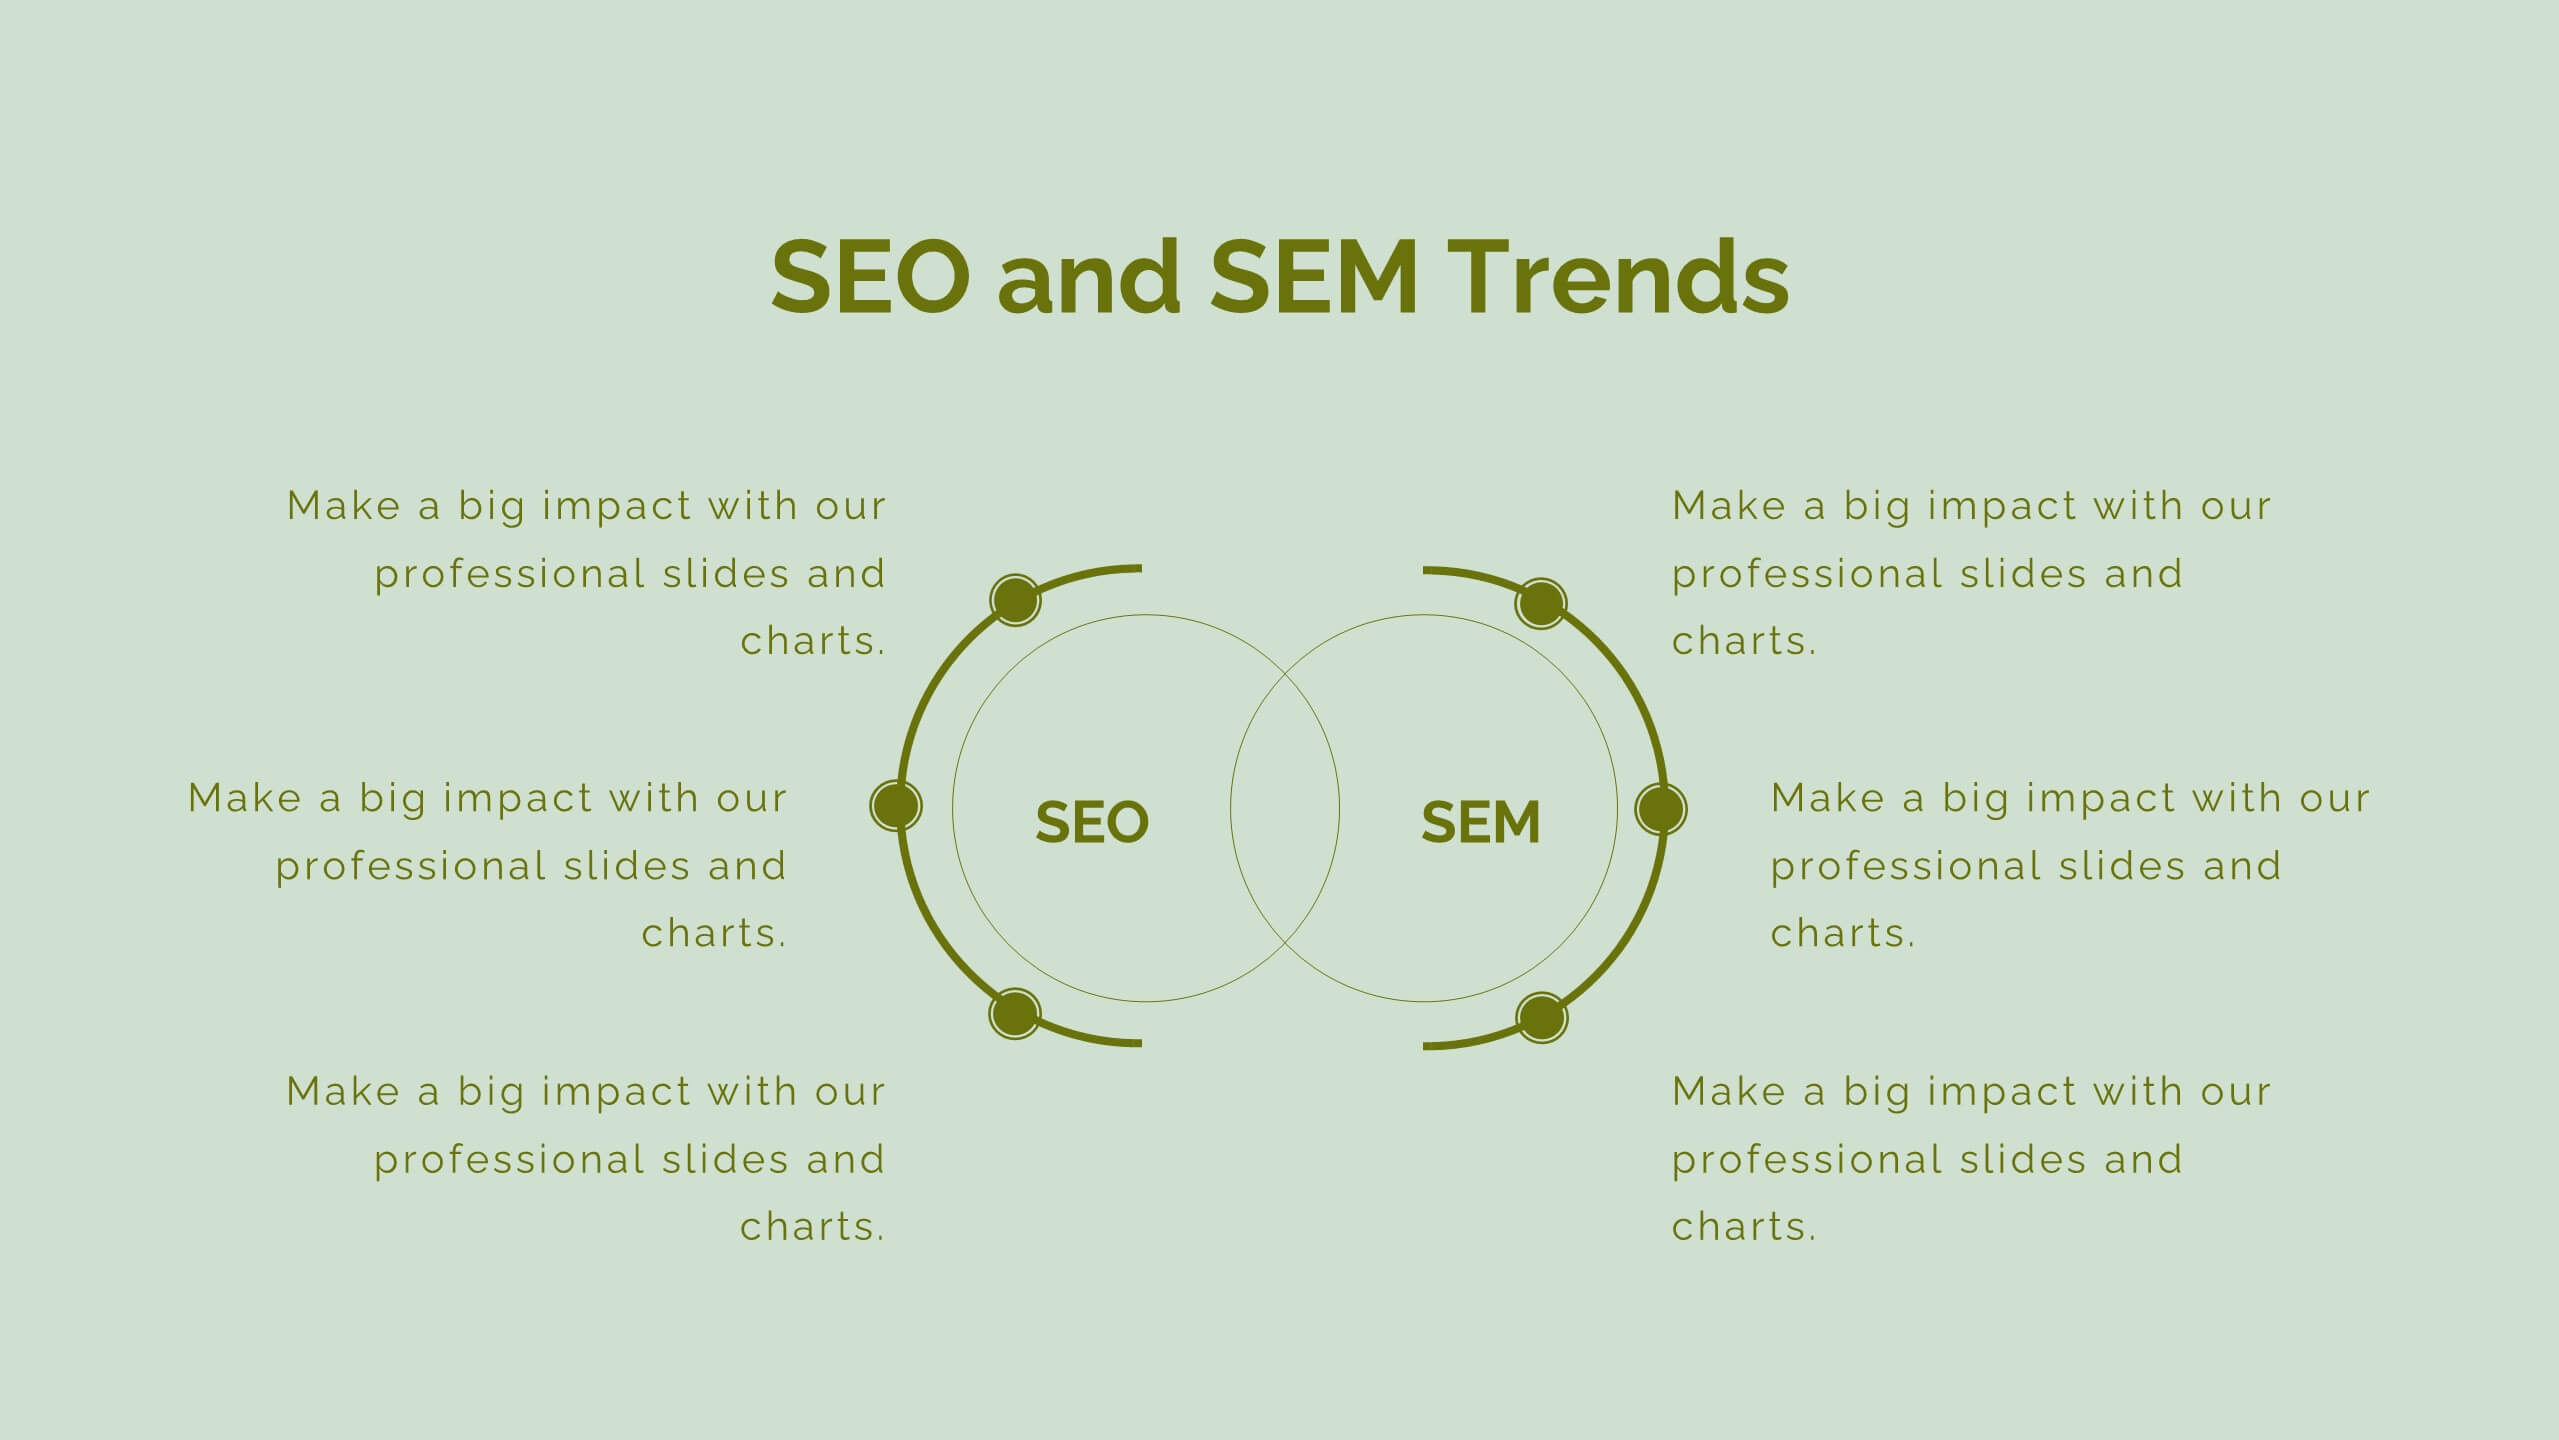
TAM SAM SOM Strategy Slide Presentation
Transform data into strategy with a clean, layered visual that helps you present market opportunities with precision and style. Ideal for illustrating market reach and segmentation, this professional layout keeps your insights clear and impactful. Fully compatible with PowerPoint, Keynote, and Google Slides for seamless customization and presentation use.