


Características


¿Tienes alguna pregunta?
Recomendar


6 diapositivas
Project Timeline and Scheduling Presentation
The Project Timeline and Scheduling template provides a visual progression of project tasks and deadlines, featuring clear, progress-indicating design elements for each phase. It's ideal for project managers and teams to track milestones and updates efficiently. This template is compatible with PowerPoint, Keynote, and Google Slides, ensuring accessibility across different platforms.


8 diapositivas
Business Expense and Cost Control
Visualize cost distribution and expense tracking with the Business Expense and Cost Control Presentation. This circular arrow chart is ideal for breaking down four key categories—such as departments, cost centers, or financial strategies—while also displaying percentage-based insights. Fully customizable in PowerPoint, Keynote, and Google Slides, it’s perfect for finance teams, analysts, or consultants needing a visual approach to budget control.


6 diapositivas
Target Audience Demographics Presentation
The "Target Audience Demographics" presentation employs an innovative spiral chart design to display key demographic data in an engaging and easy-to-understand format. Each segment of the spiral represents a different demographic characteristic with percentages clearly marked, enabling quick insights into audience composition. This design is well-suited for marketing presentations or any scenario where understanding audience segments is crucial. The placeholders are conveniently set up to add specific details or insights, making the template not only visually appealing but also highly functional for strategic planning and audience analysis.


6 diapositivas
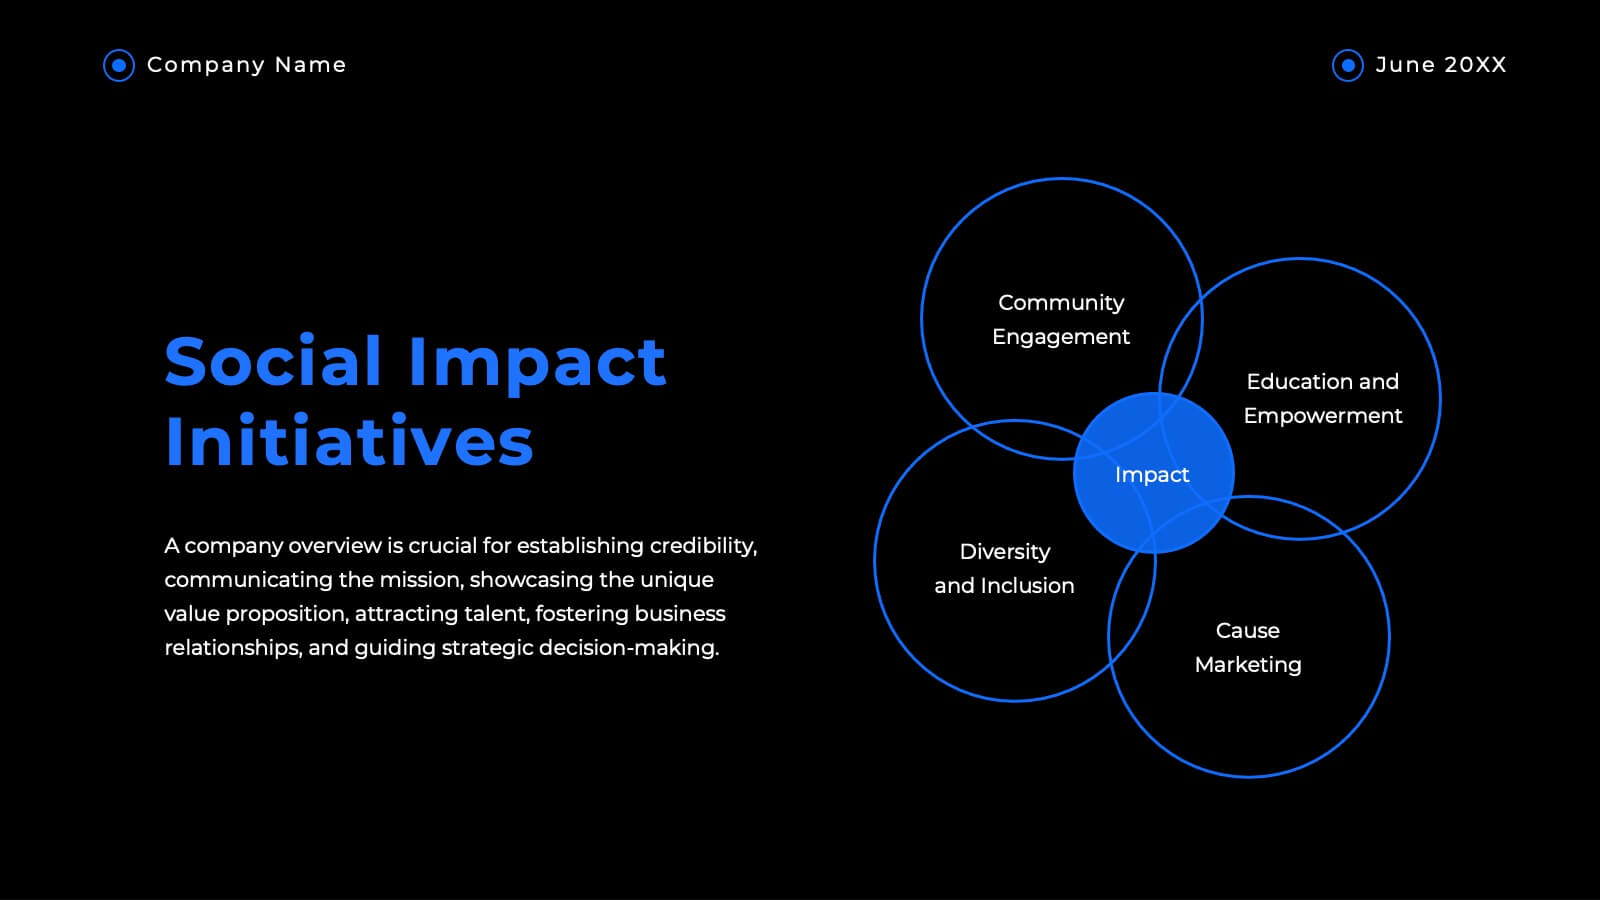
Central Idea Spider Layout Presentation
Bring your big idea to life with a sleek, organized layout that keeps every supporting point perfectly connected. This presentation is ideal for mapping strategies, goals, or project concepts in a clear, visual way. Fully customizable and compatible with PowerPoint, Keynote, and Google Slides for effortless editing.


8 diapositivas
Team Time Allocation and Planning Presentation
Stay on top of your team's workload with the Team Time Allocation and Planning presentation slide. This template features a clear, month-by-month Gantt-style layout, helping you visualize team tasks, priorities, and resource distribution across the year. Ideal for project managers, department leads, or operations teams aiming to streamline scheduling and improve collaboration. Fully customizable in PowerPoint, Keynote, and Google Slides.


5 diapositivas
Political Campaign Strategies Infographics
A political campaign refers to the organized efforts of individuals or groups to promote a particular candidate, political party, or specific political agenda during an election or to raise awareness and support for a specific issue. These infographic templates are designed to showcase various strategies and techniques used in political campaigns. This is perfect for politicians, campaign managers, or anyone involved in the political arena who wants to present their campaign strategies. Its customizable layout and eye-catching design enable politicians to communicate their campaign, engage with their audience, and rally support for their goals.


5 diapositivas
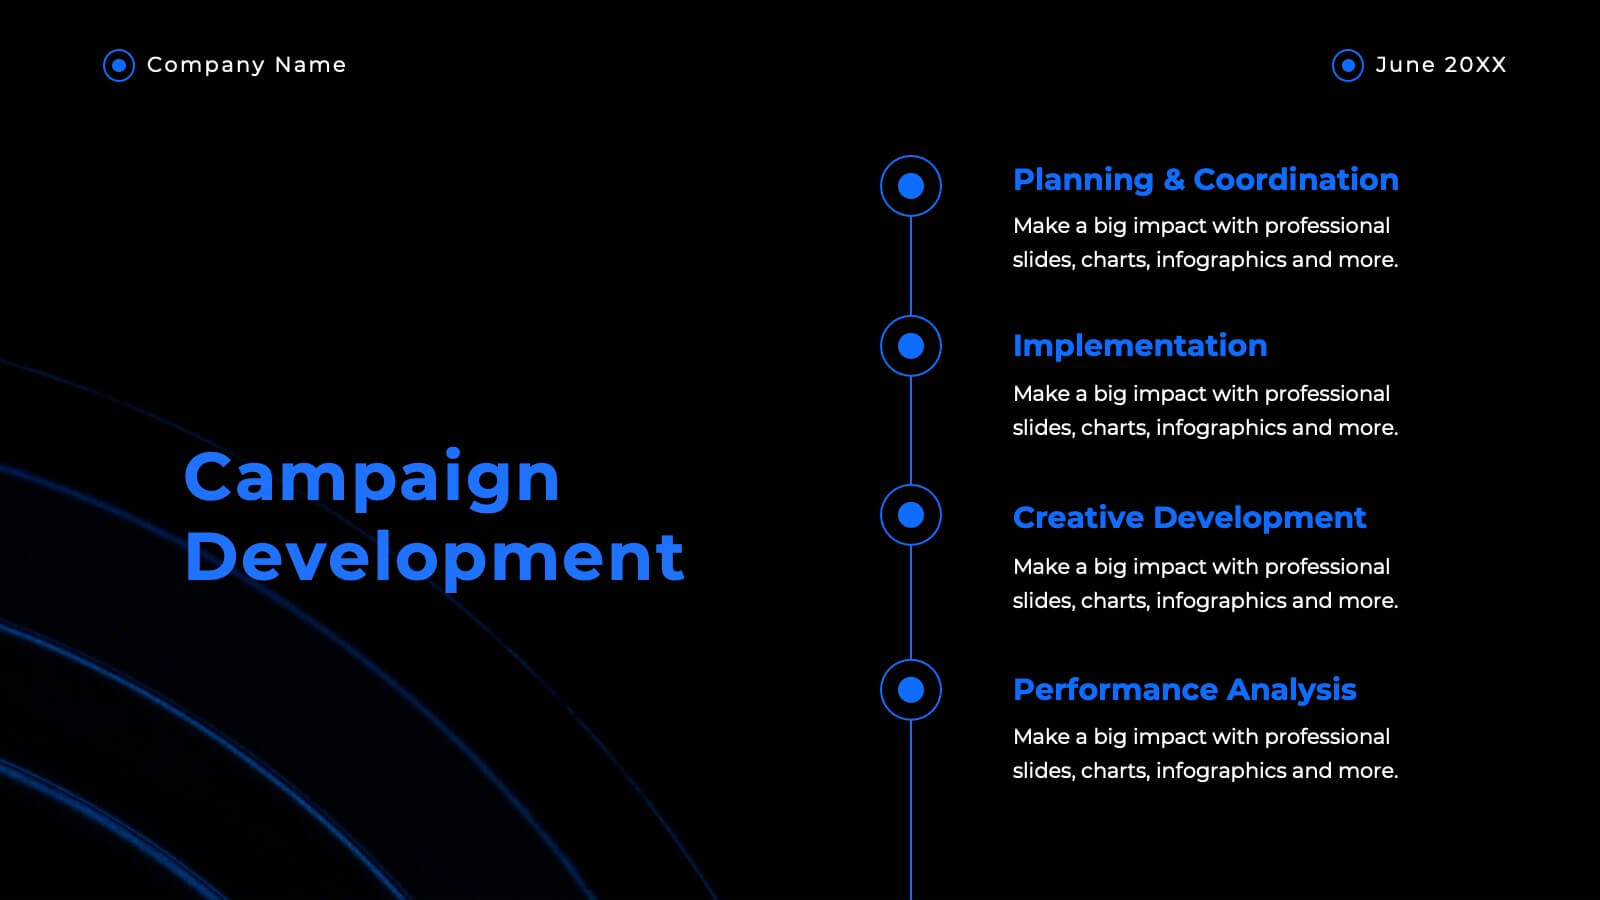
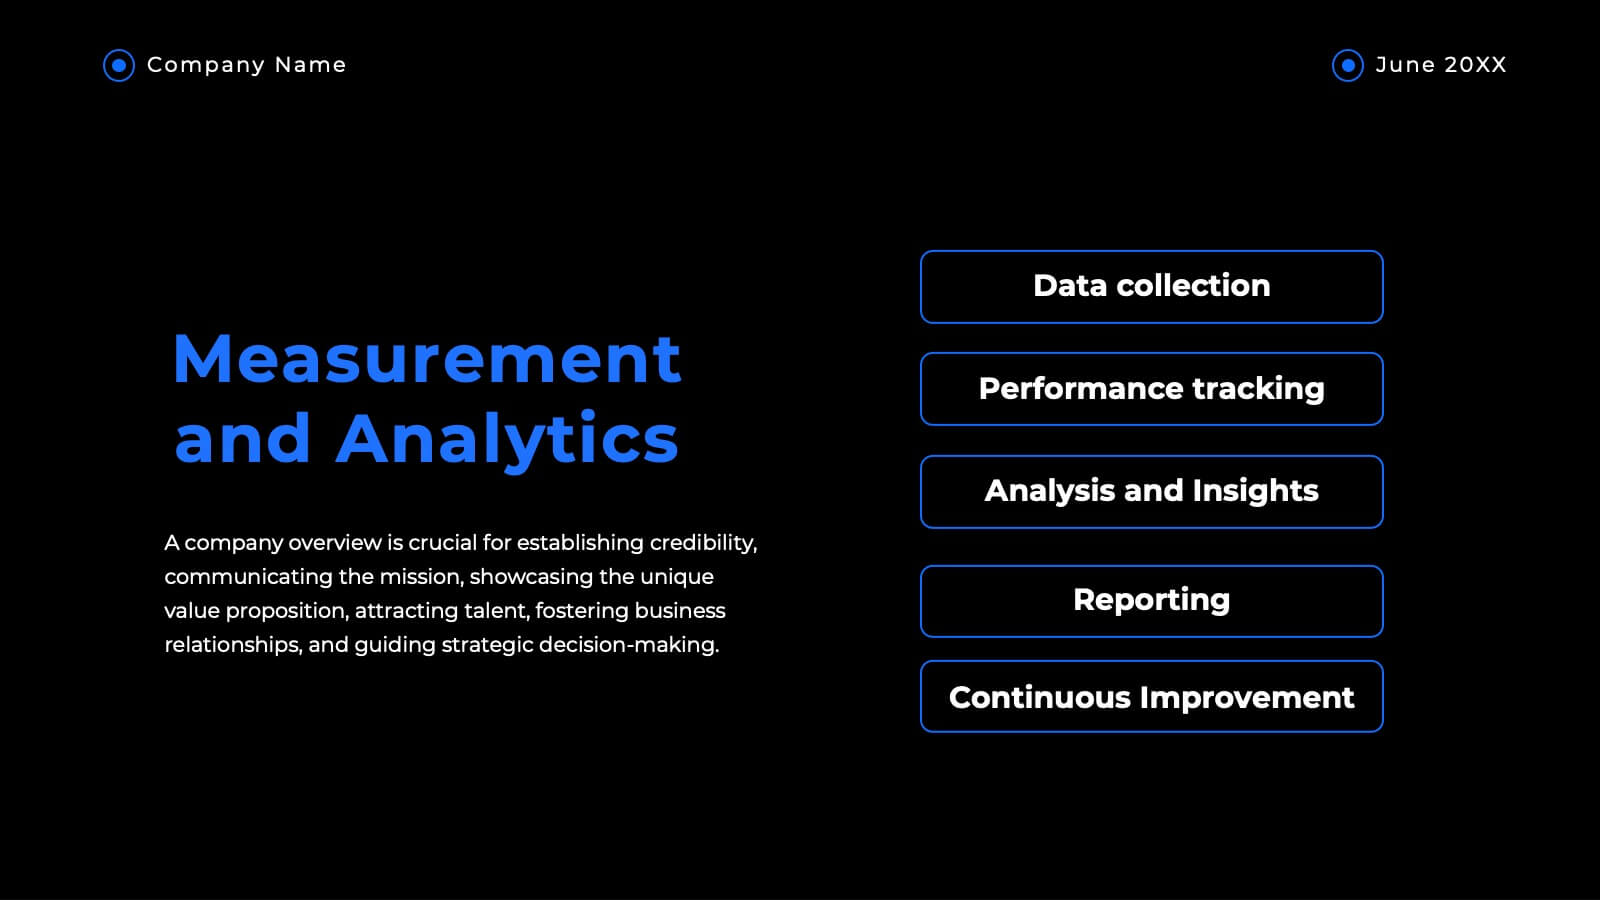
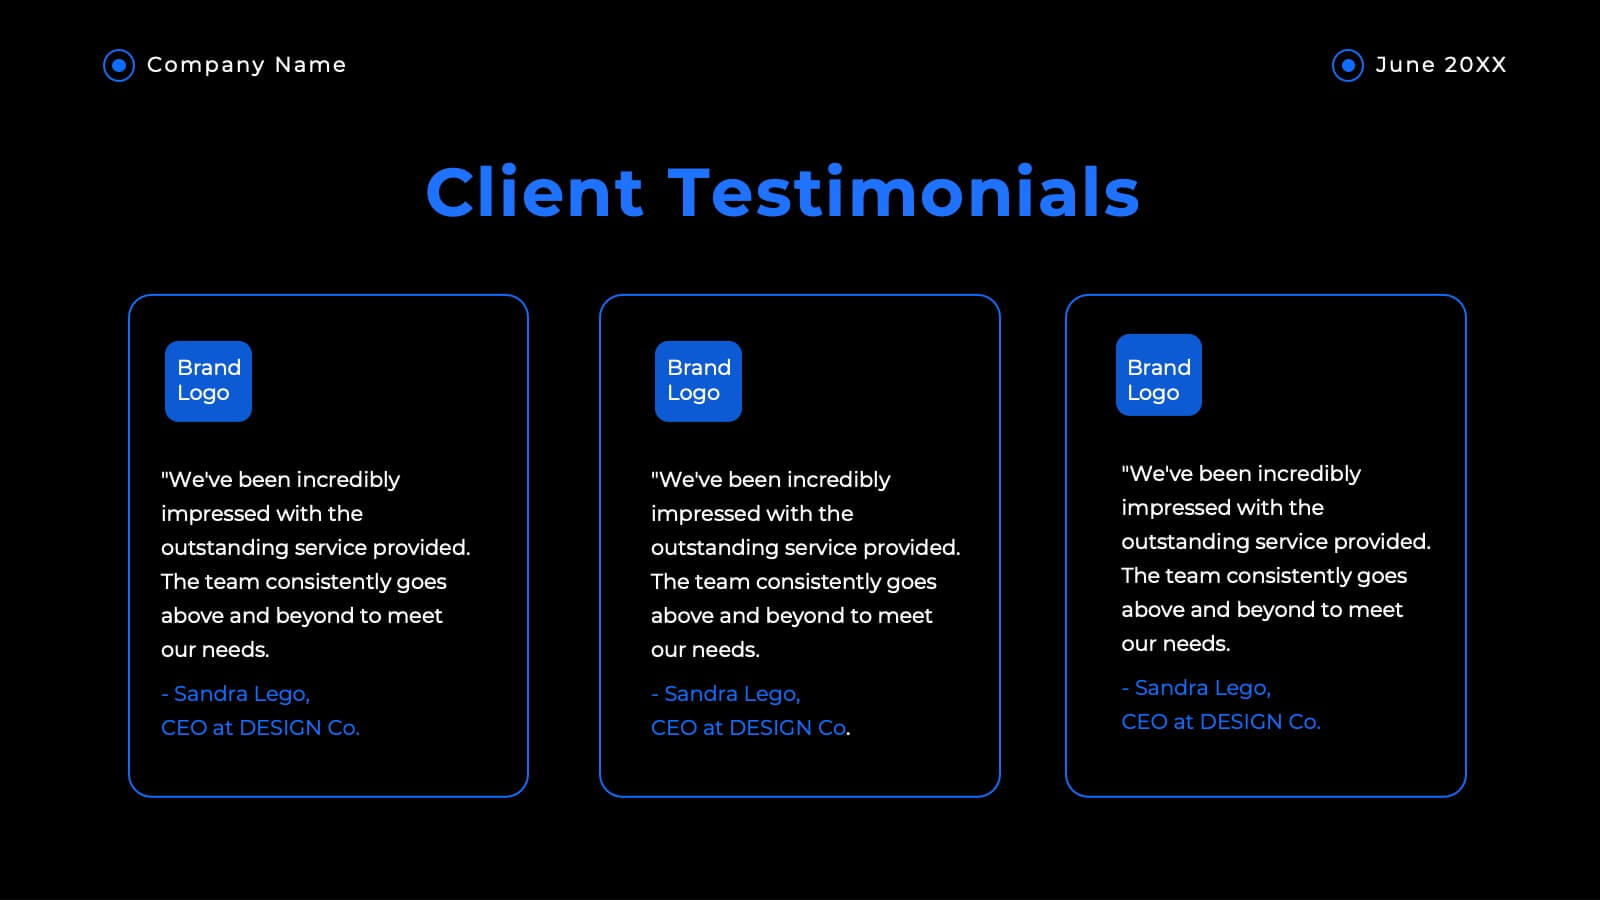
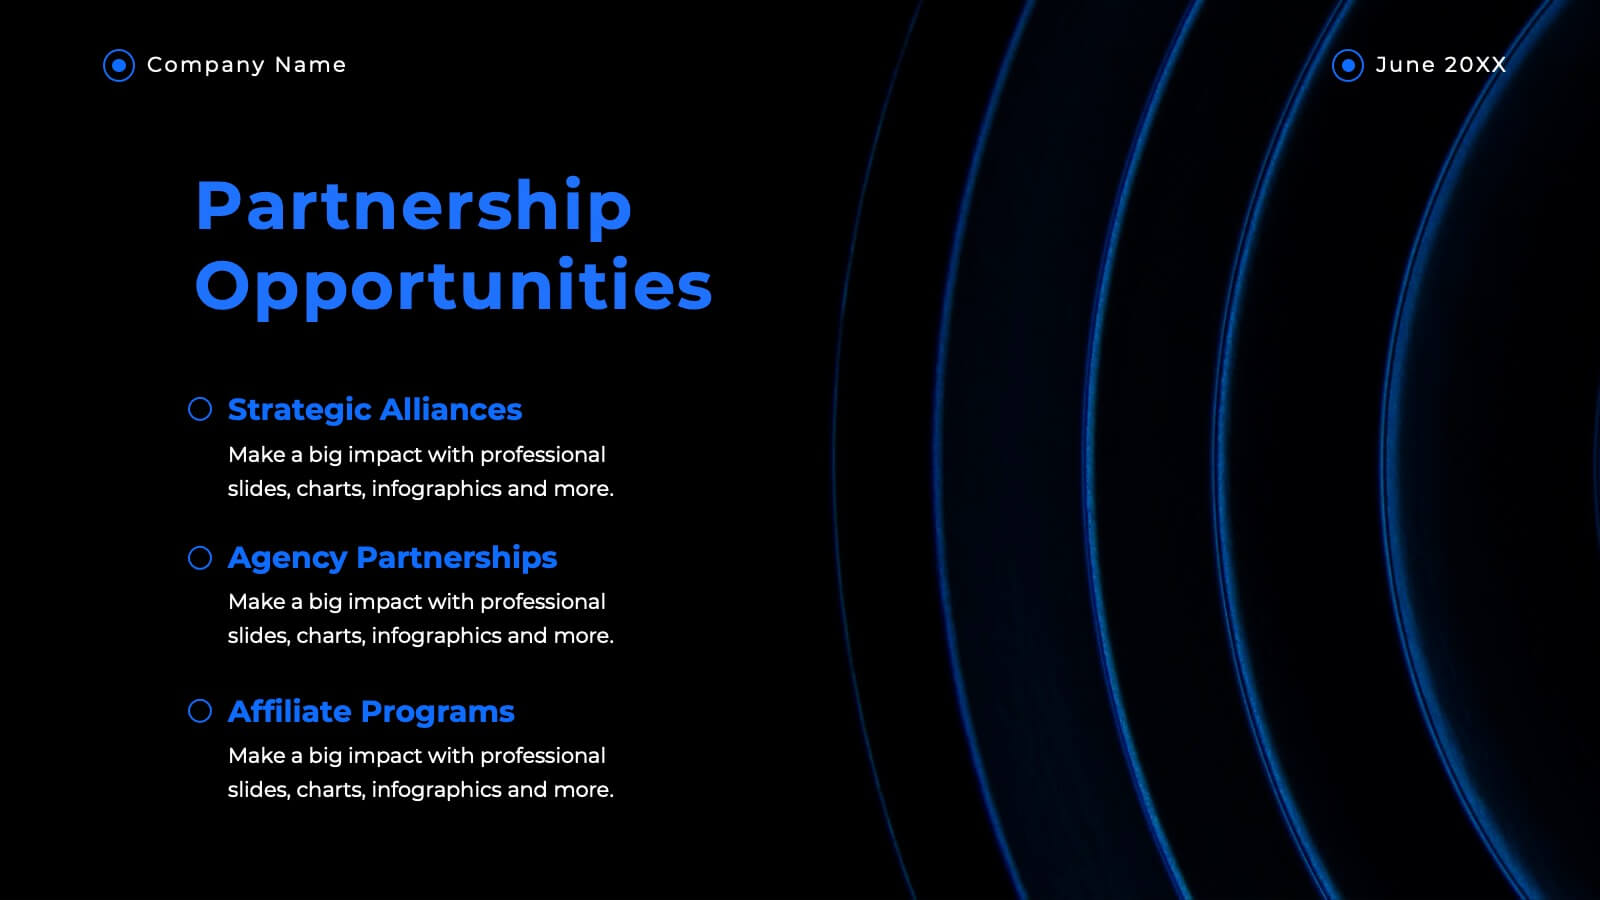
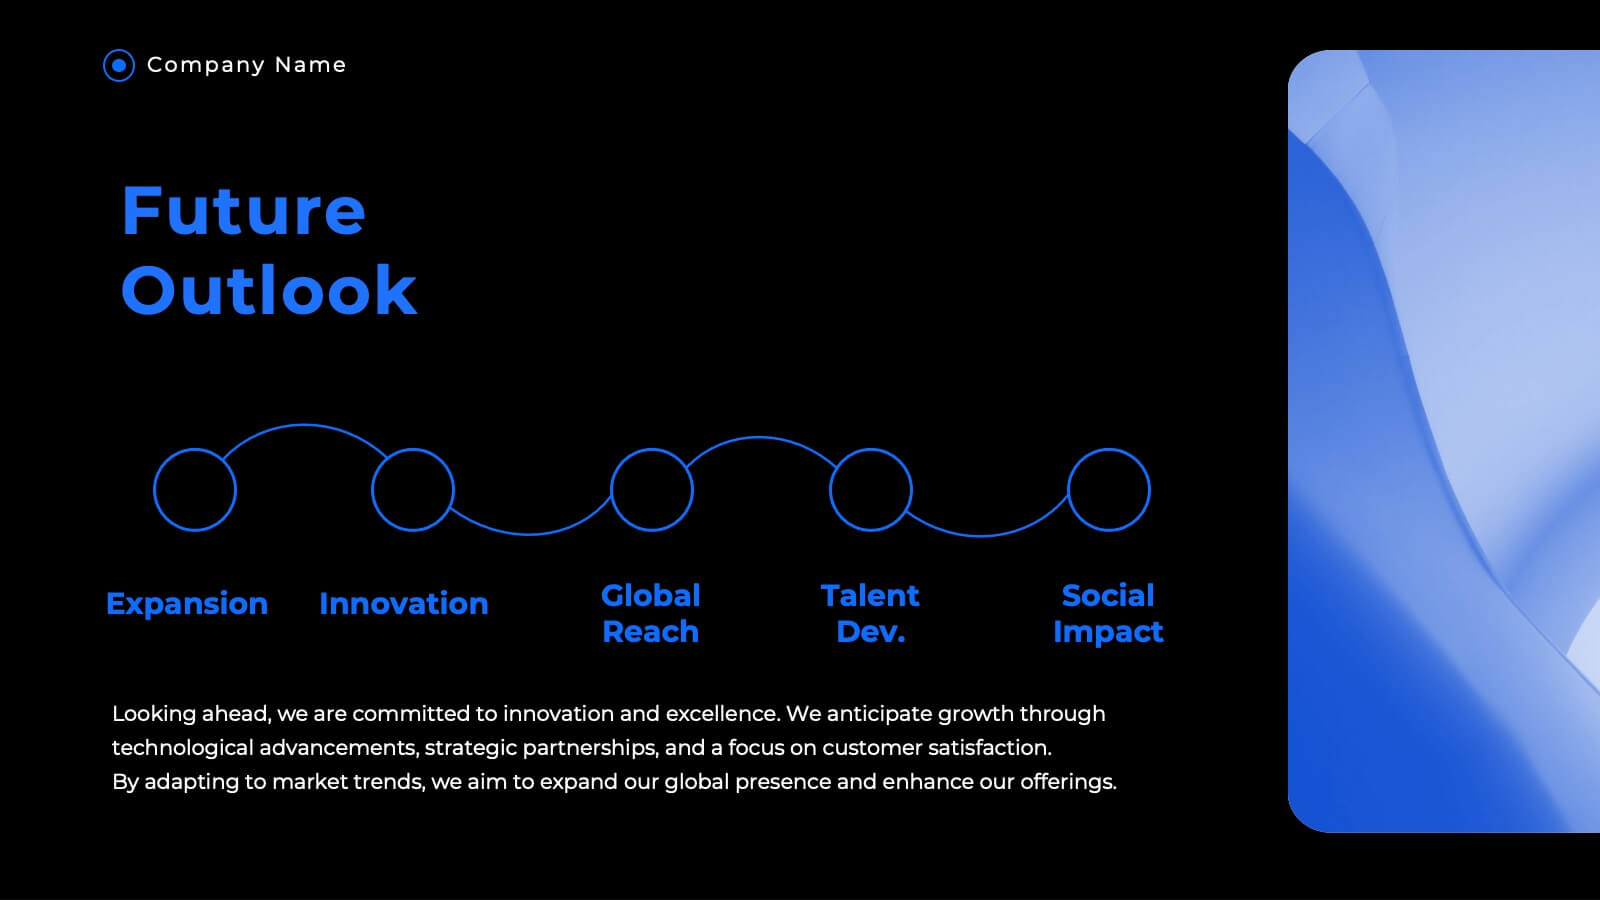
Digital Marketing Strategy Roadmap
Visualize your marketing initiatives step-by-step with this clean, arrow-driven roadmap design. Ideal for showcasing campaign planning, funnel stages, or content rollouts, this slide helps keep your strategy clear and easy to follow. Fully editable and compatible with PowerPoint, Keynote, and Google Slides.


7 diapositivas
Comparative Analysis with Butterfly Chart
Showcase side-by-side insights with clarity using the Comparative Analysis with Butterfly Chart Presentation. Designed for balanced visual storytelling, this template contrasts two sets of three data points—perfect for comparing teams, strategies, features, or timelines. The symmetrical butterfly layout draws focus to the center "VS" section, ideal for highlighting your core comparison or conclusion. Fully editable in PowerPoint, Keynote, and Google Slides for fast, tailored presentations.


6 diapositivas
Corporate Performance Annual Report
Present key business metrics with precision using this Corporate Performance Annual Report slide. Designed with progress bars and intuitive icons, this layout clearly communicates departmental or project-based performance. Ideal for year-end reviews, board meetings, and investor updates. Fully editable in PowerPoint, Keynote, and Google Slides.


7 diapositivas
Professional Project Management Infographic Presentation
Project management is the process of planning, organizing, and overseeing resources and tasks to achieve goals and objectives within a defined timeframe. This template includes a clean, eye-catching design with plenty of space to add your content. This infographic template provides a step by step explanation of project management. It's the perfect way to explain complex projects easily to clients and employees. This template is compatible with Powerpoint, keynote and google slides making it easily customizable and editable. Use this for next project management research paper, presentation, etc.


5 diapositivas
Feedback Collection Strategy Presentation
Engage your audience with a dynamic visual that simplifies how feedback is gathered and turned into meaningful action. This presentation helps illustrate communication loops, data flow, and process improvements with clarity and style. Fully editable and compatible with PowerPoint, Keynote, and Google Slides for seamless customization and professional delivery.

22 diapositivas
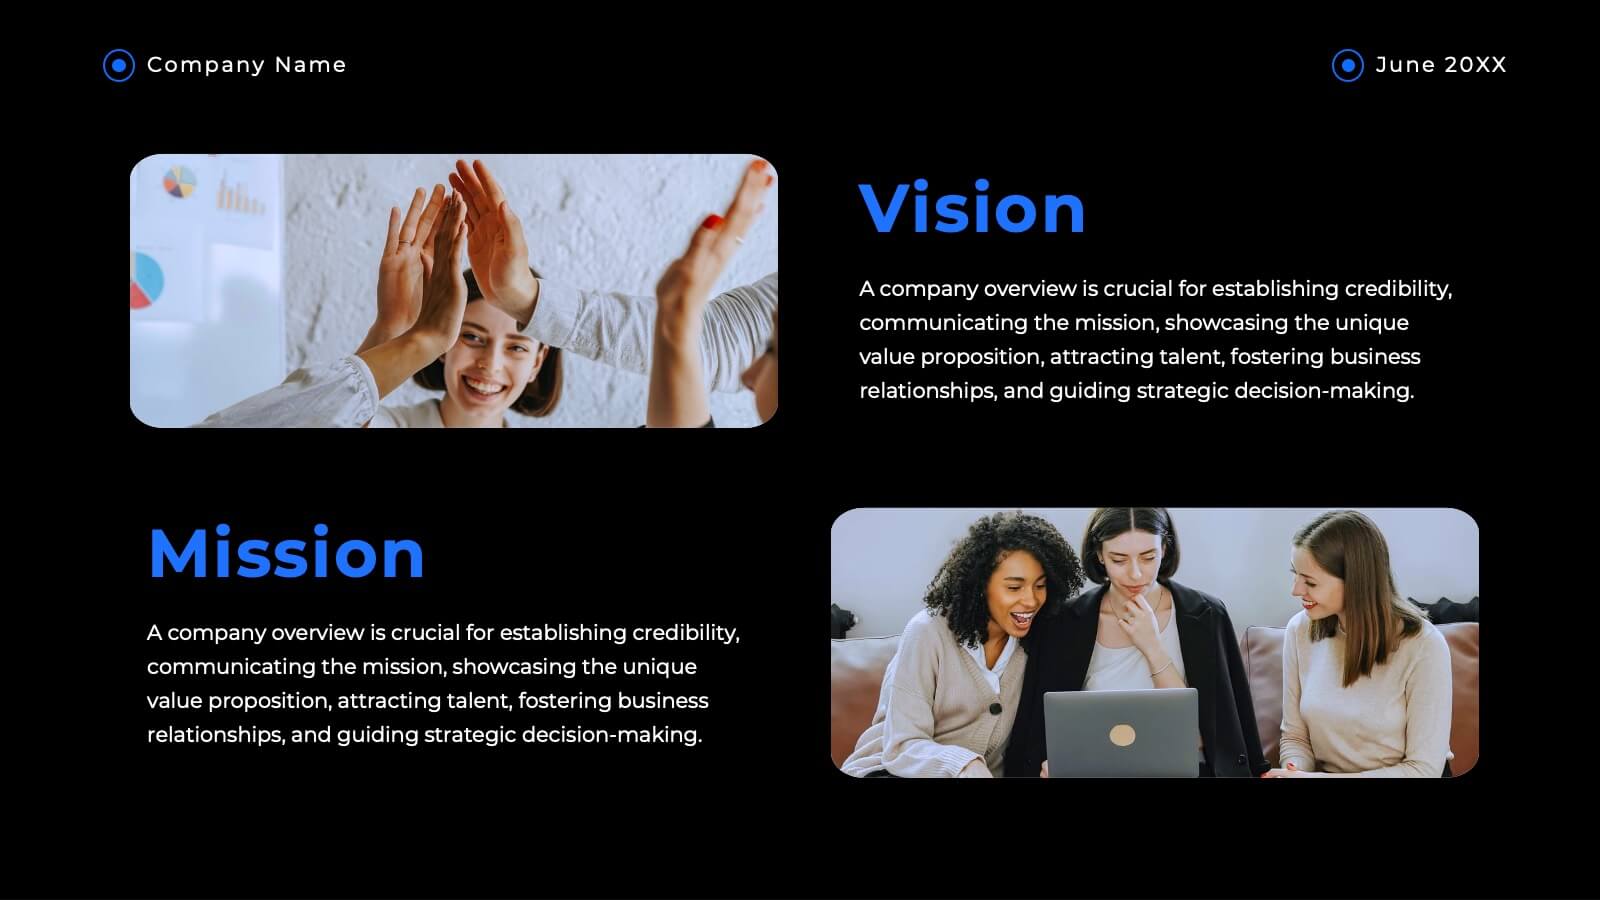
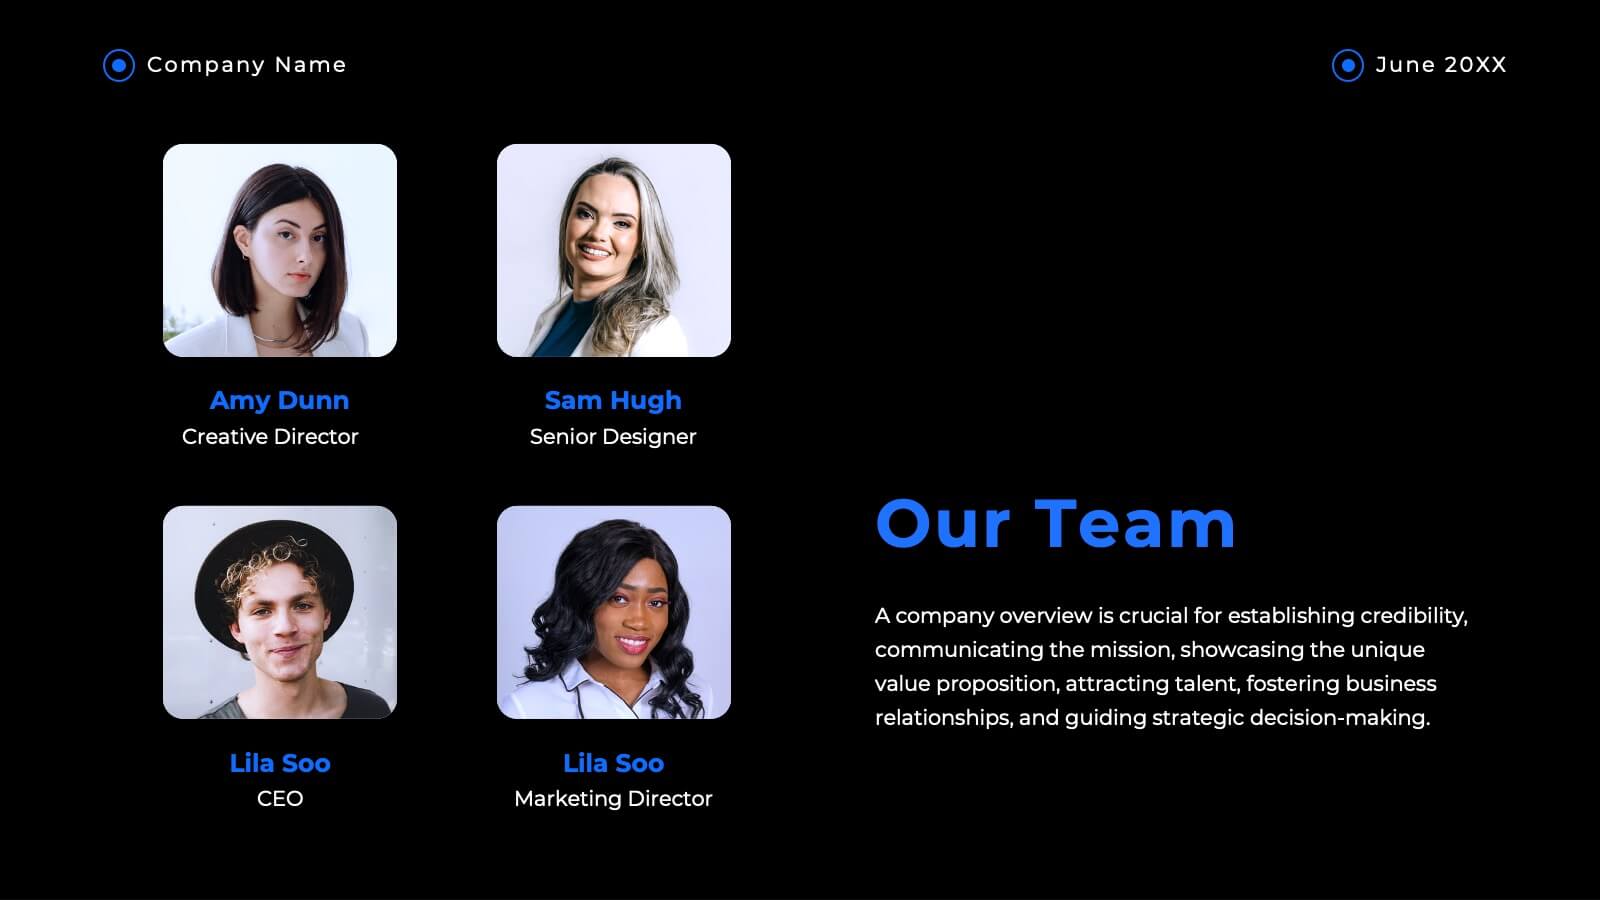
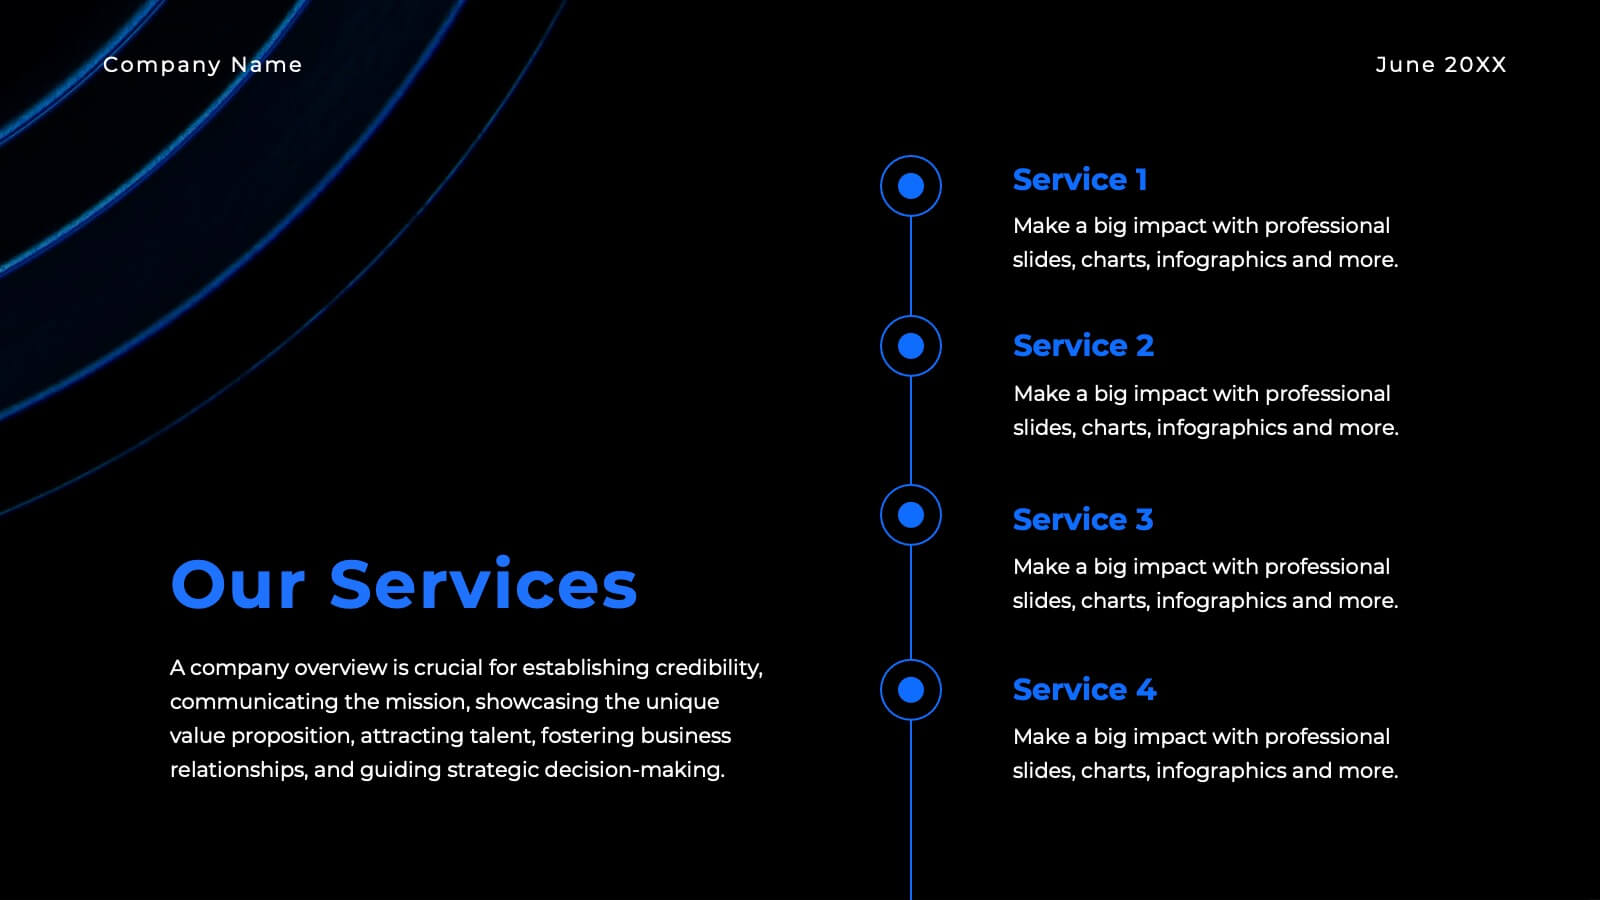
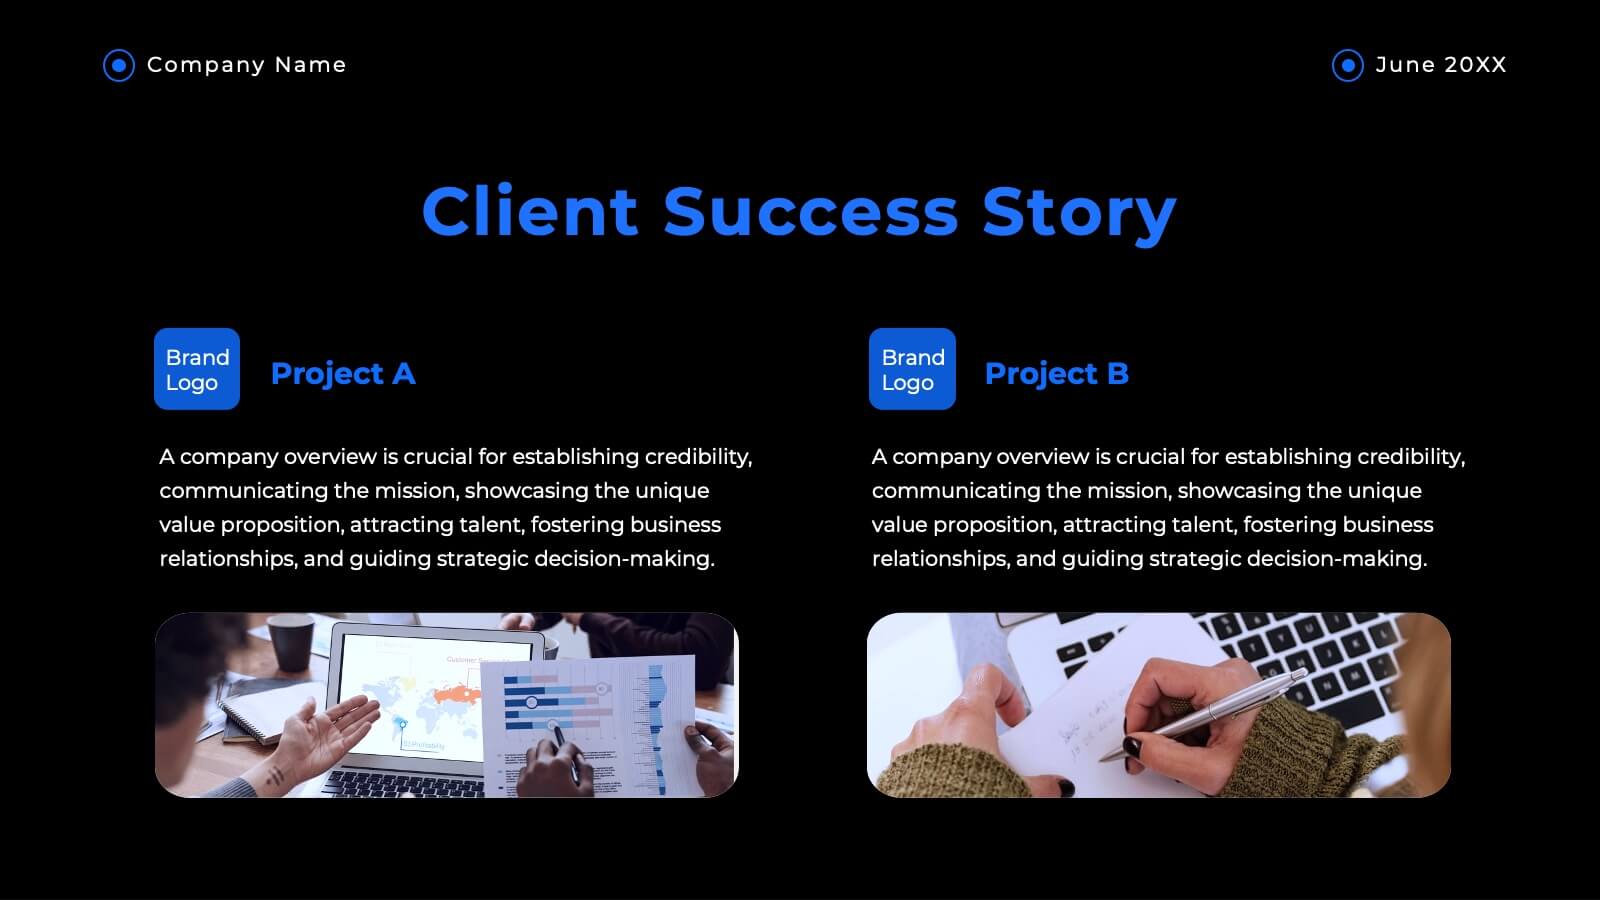
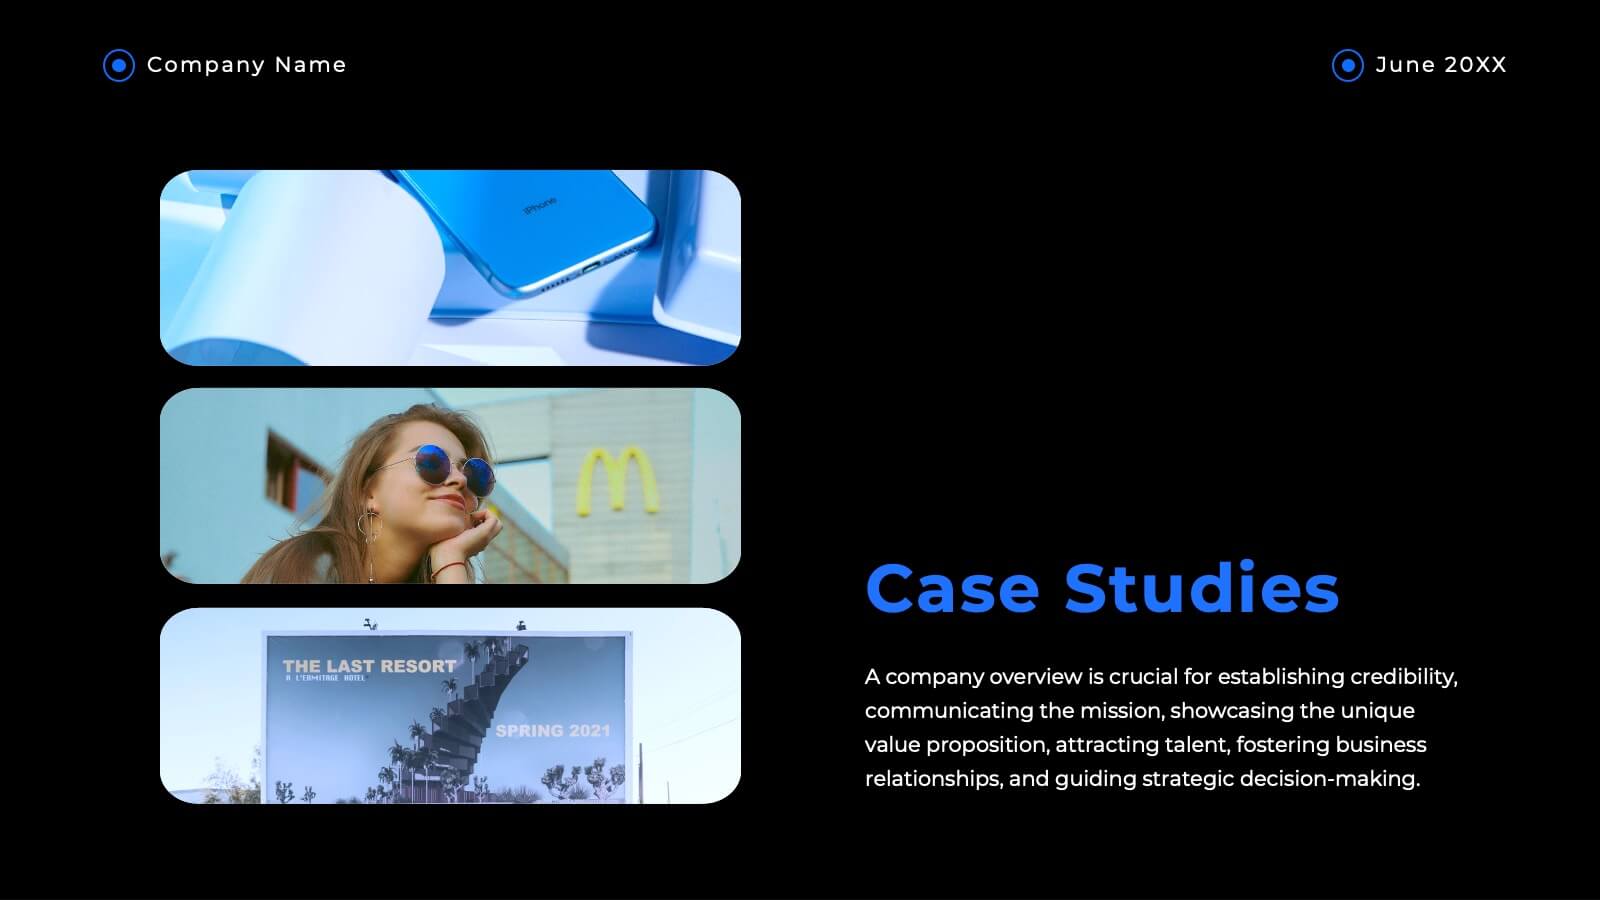
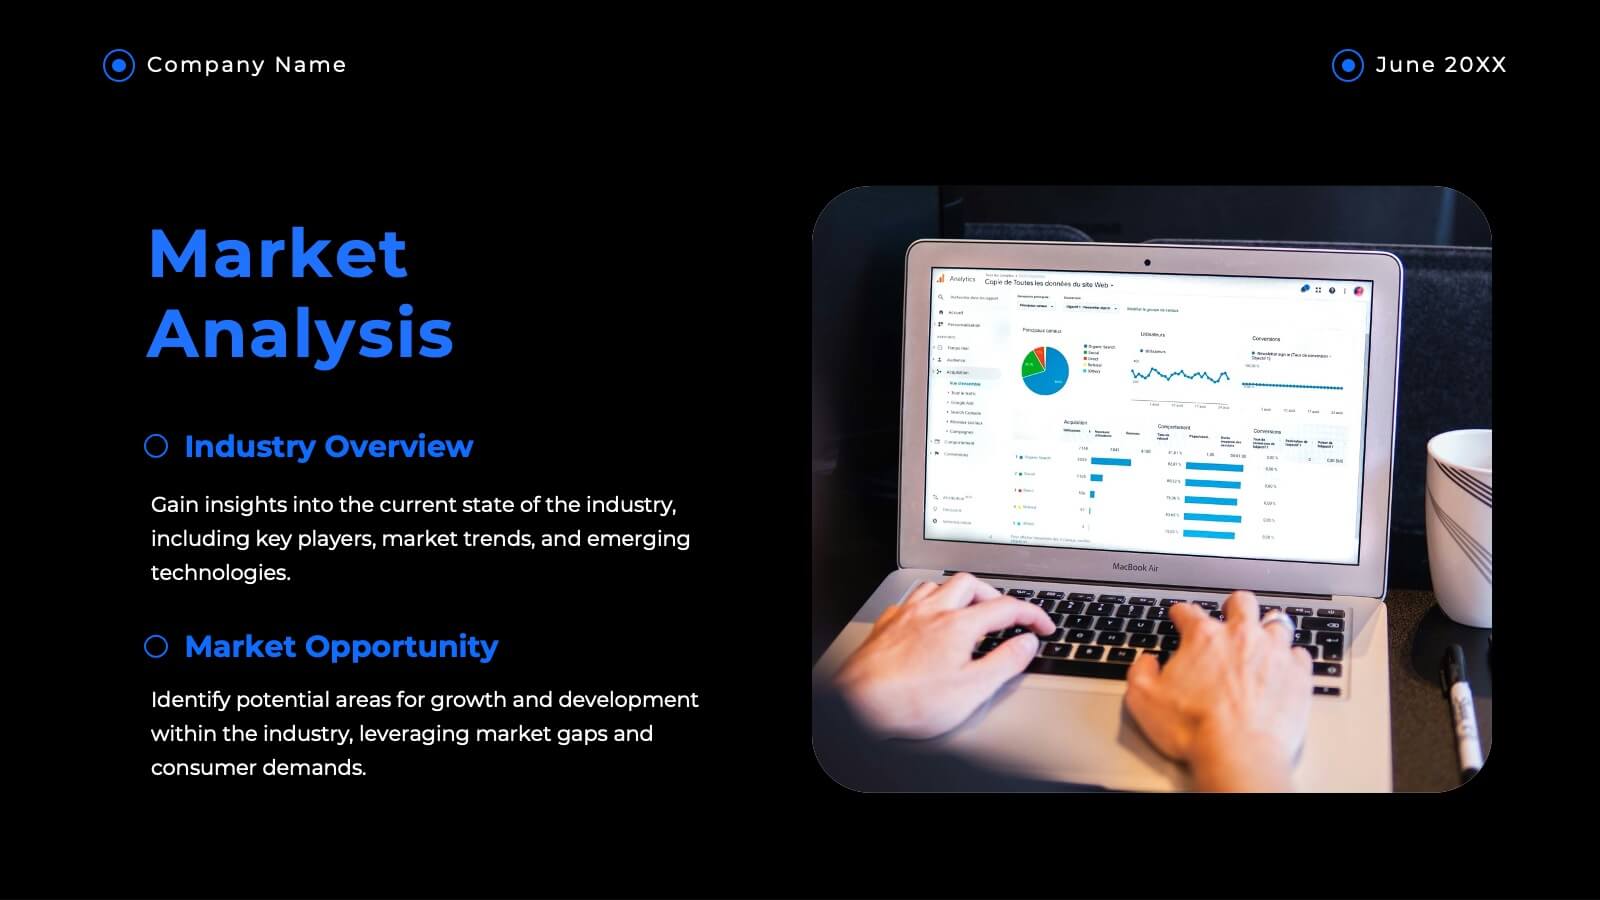
Haven Advertising Agency Proposal Presentation
Wow your clients with this sophisticated agency presentation template! Perfect for showcasing your services, client success stories, and market analysis. Ideal for agencies looking to impress and secure new business. Compatible with PowerPoint, Keynote, and Google Slides, this template ensures your proposals stand out with professional elegance. Perfect for any pitch or proposal.


6 diapositivas
Common Question for Businesses Infographic
Captivate your audience and enhance interaction with our collection of slide templates, perfect for engaging beginners and prompting them to ask top questions. These templates feature inviting designs and dynamic layouts, making them ideal for educational sessions, workshops, or any presentation aimed at beginners. Each template employs bright colors and creative graphics to draw attention and stimulate curiosity. The designs are crafted to not only pose questions but also to invite thoughtful responses and active participation. Whether you are hosting a seminar, leading a training session, or facilitating a learning module, these slides provide a friendly and approachable way to encourage questions and discussions. Customize these templates to suit your specific session, adapting the text, colors, and images to fit the theme and audience. They are a fantastic tool for educators and trainers looking to create a more engaging and interactive learning environment.


7 diapositivas
Geometric Sequence Infographic Presentation
Geometric infographics typically involve the use of various shapes to convey different pieces of information. This Geometric Template is a professional way to show your great designworks and ideas. This template can be used in a variety of contexts, from business and marketing to education and journalism. This clean design includes many categories, dividers and icons which will help you show your data in the best way. Start creating your own customized presentation by adding your text, images and other content from your slides, just download in PowerPoint, Keynote or Google Slides.


7 diapositivas
Asia Map Infographic Presentation Template
Asia is the largest, most populous, and most culturally diverse continent. Asia constitutes of nearly one-third of Earth's landmass and is lying entirely north of the equator. The continent is home to a variety of cultures, ethnic groups, and religions. This Asian map template includes the different labeled countries, and graphs with statistics. This can be used to show your audience the geographical layout of Asia, or as an example of what a modern, professional presentation should look like. This template is a great resource for students, teachers and people who want to learn more about Asia.


4 diapositivas
HR Workflow and Policy Overview Presentation
Streamline organizational processes with the HR Workflow and Policy Overview template. Featuring a clear flowchart design, this layout is ideal for mapping HR procedures, compliance steps, and policy implementation. Fully customizable in Canva, PowerPoint, and Google Slides to align with your company’s branding and human resources management needs.


6 diapositivas
Solution Architect Infographics
Our Solution Architect infographic is an exceptional visual aid designed for Powerpoint, Keynote, and Google Slides. This infographic is perfectly suited for solution architects, systems engineers, and IT professionals who need to convey complex architectural solutions in a clear and concise manner. The infographic is structured to outline the components of a solution architecture framework, including the software, hardware, and network infrastructure. It helps in visualizing the relationships between different system components, making it easier to understand how they work together to create a comprehensive solution. Using this infographic in your presentations will not only add a professional touch but also enhance the audience's comprehension of the solution architecture. Whether you're explaining the architecture of a new software system, the integration of various technologies, or the planning of an IT project, this infographic provides a streamlined way to share that information, ensuring your concepts are communicated effectively.